Disincumbenting Illinois: A Democratic Redistricting Plan

This diary presents an 18-seat map for Illinois. Illinois is a particularly difficult state for me to get my head around politically, so in this diary I am  going to highlight a particular strategic approach to redistricting. I’m calling it “disincumbenting” — I don’t think I’ve encountered an existing term of  art anywhere that covers quite the same ground.

The basic idea of disincumbenting is to make the new districts as unlike the current districts as possible. Doing so reduces the value of incumbency (hence  the name) by reducing the number of constituents who are familiar with the incumbent representative.

Illinois strikes me as a particularly fertile environment for the technique, because the party out of power on the state level has a large number of  contiguous seats. The Democrats have unified control over the line-drawing. In the most recent election, they lost four outstate districts, resulting in the Republicans controlling every non-Cook-County-based district except for Jerry Costello’s 12th district in the far southwest. (The Republicans also control  the Cook-County-based 9th.) With so much adjacent territory under the control of the opposition party, it is fairly easy to draw new lines that wreak havoc  on the political bases of each incumbent.

As I said above, I find it difficult to get my head around Illinois’ politics. This is because recent elections have been so very unrepresentative. 2010 was a Republican wave year. 2008 was a Democratic one, compounded by Obama’s favored son status. Blagojevich’s election numbers are impacted by the presence of a  significant Green candidacy. And so on. I tried to design the new districts so as to maximize the number of “Democratic opportunity” districts outside of  Cook County as best I could, but these districts aren’t as numbers-based as I would like. I welcome any feedback from those who know Illinois better.

Aside from the goals of disincumbenting Republican incumbents and maximizing Democratic chances outstate, I had two other, inter-related goals: create a second Hispanic majority seat in cook County, thereby eliminating Lipinski’s district. In a previous diary, I had created a second Hispanic seat by (inadvertantly) messing with Quigley. Geoneb suggested that Lipinski should be the target instead, so here’s a plan that does that. These two goals have an unintended spillover effect of somewhat disincumbenting the Chicago Democratic representatives. If resistance from the Democratic incumbents proves too great, these two goals could be abandoned.

To demonstrate the disincumbenting strategy, in my district descriptions I’m making use of silverspring’s Territory Transfer Percentage (TTP), introduced here. TTP is the percentage of the new district’s population that was part of the old district. My impression is that Silverspring introduced it with the general intent of keeping TTPs relatively high. Because of the set of goals I applied to the creation of this map, I’m actually trying to keep TTPs low (at least in the Republican districts.)

Pictures and descriptions of the plan start after the jump.
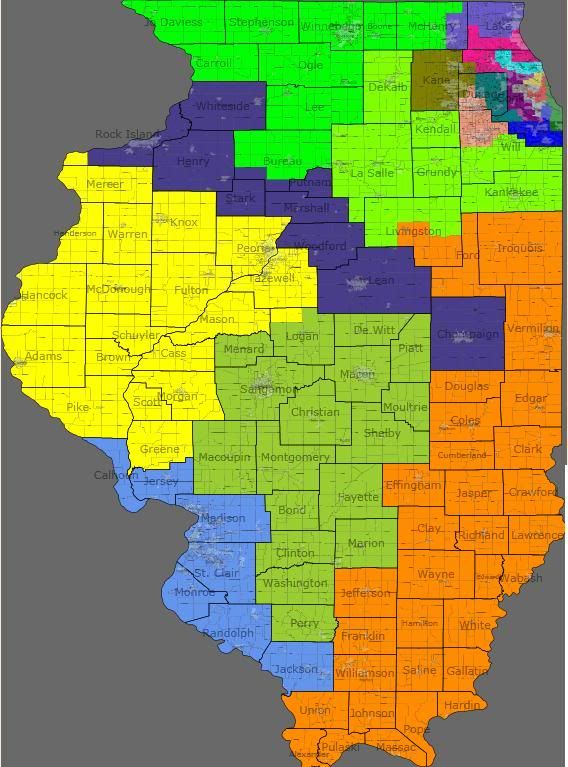
Overview Map

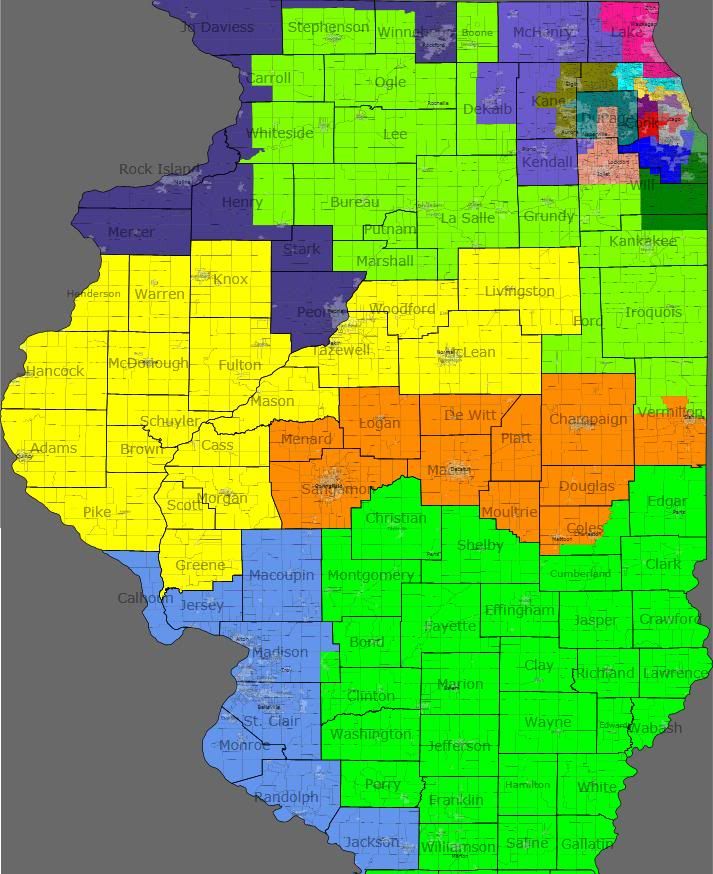
Note that the 16th is (roughly speaking) the seat lost through reapportionment. I relocated it south to cover for the missing number 19.
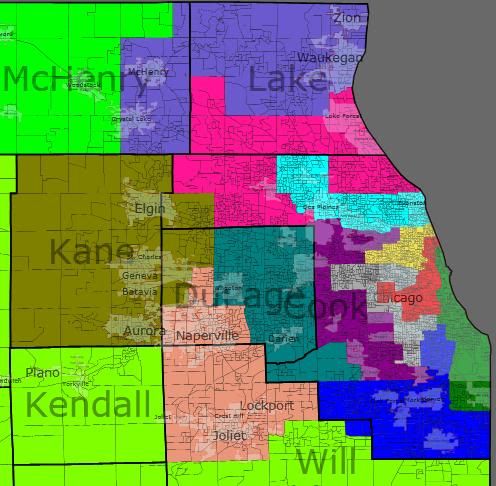
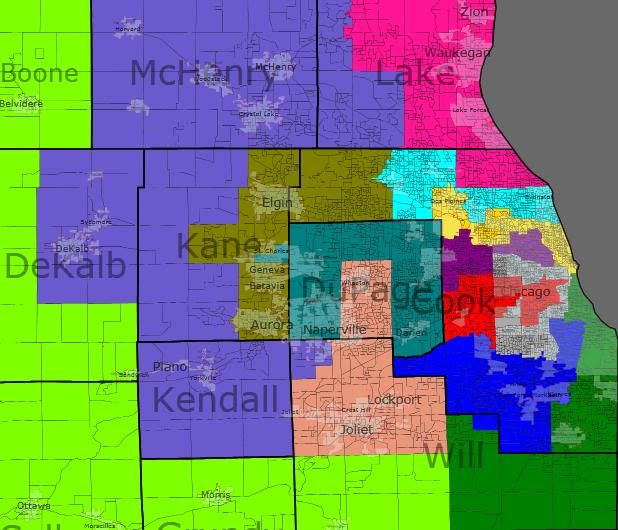
Chicagoland Map

District-By-District

Given the strategy I’m following here, I’m presenting the old/new maps for each district. The pink outline is the old district. The green squiggles represent the new district.

Democratic Held Seats

My intention was that all of these seats would remain solidly Democratic. In the absence of sound numbers though, I’m slightly worried about the 9th. (And, I guess, the 12th — but I think I actually improved the 12th’s Democratic performance.)

District 1 — Bobby Rush (D)

VRA: B 53% W 35%

TTP: 49%

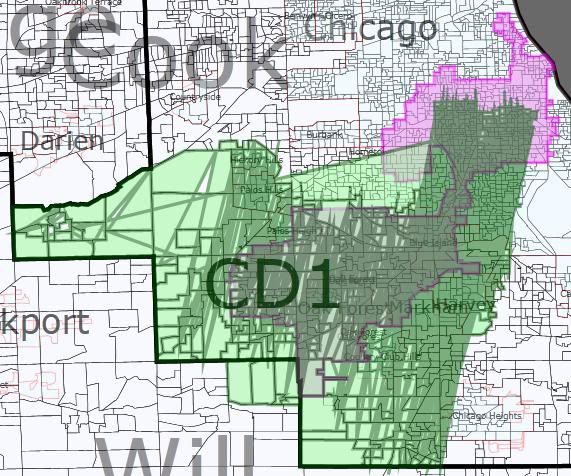
Rush’s district slides south somewhat, expanding into parts of what is currently the 2nd and 13th. I’m not sure if Rush still lives in this version of the district. Wikipedia says he used to represent the 2nd Ward. If he still lives there, it’s a relatively easy fix to swap some territory with the 2nd while keeping both majority African American.

District 2 — Jesse Jackson, Jr (D)

VRA: B 54% W 32% H 11%

TTP: 56%

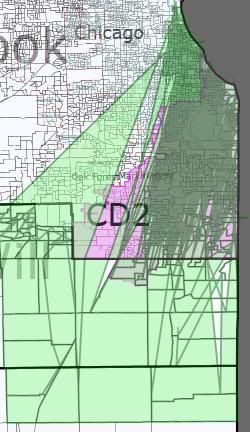
Jackson’s district narrows slightly to expand significantly to the north and south. Again, I’m not sure if Jackson lives here, but his wife represents the 7th Ward, so I think he probably does.

District 3 — Open Seat (D)

VRA: H 52%, W 34%

TTP: 2%

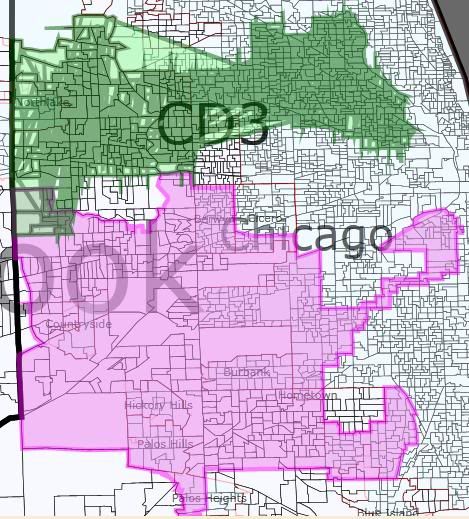
[Update: Per sapelcovits in the comments, my description of the ethnic background for the 3rd and 4th are flipped. This is Guiterrez’s district. It’s the 4th that’s open.]

This was Lipinski’s district, now almost entirely relocated to become a second Hispanic majority district. (The old district is split roughly evenly between the new 4th and 7th, both of which are still majority-minority.) My understanding is that the Hispanic population here is largely Mexican, so voting participation rates might not be enough to elect a Hispanic representative.

District 4 — Luis Guiterrez (D)

VRA: H 58%, W 35%

TTP: 51%

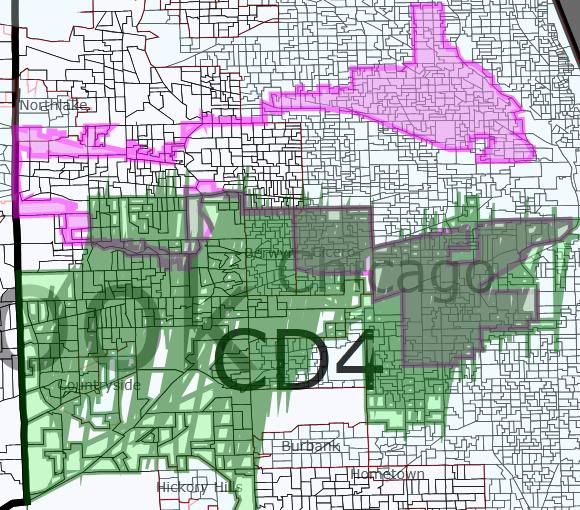
Guiterrez’s seat now takes in only the southern half of his old district (along with a good part of the old 3rd). My understanding is that the Hispanic population here is largely Puerto Rican (and therefore US citizens), so this district should pass VRA muster.

District 5 — Mike Quigley (D)

VRA: W 68%, H 15%

TTP: 53%

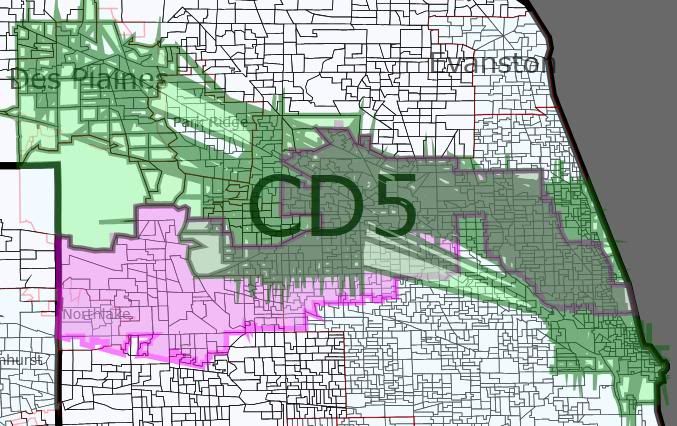
Quigley’s seat shifts northwest on its western end, now taking in Des Plaines instead of Northlake. I believe he should still live in the district; if not, the territory swap needed to make it happen shouldn’t be too difficult.

District 7 — Danny Davis (D)

VRA: B 50% W 34% H 11%

TTP: 50%

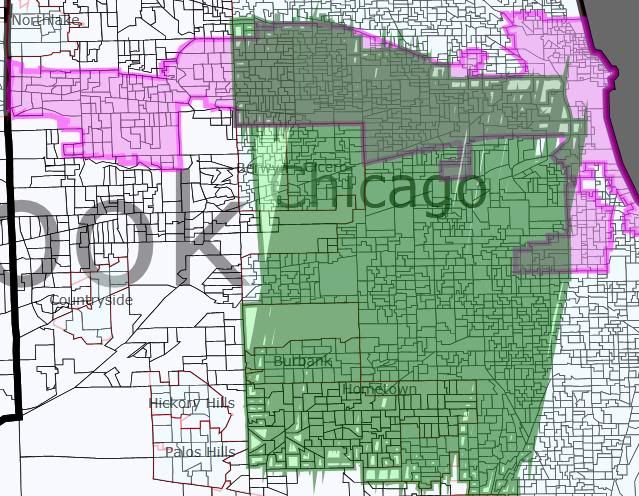
Sadly one of the less informative old/new maps. You might need to refer back to Chicagoland overview. Davis’s seat lurches south radically as part of the dismemberment of the old 3rd. The 29th Ward that he used to represent is still in the district, so I assume he is too. If 50% is too low an African-American percentage, some territory swaps with the 1st and/or 2nd could probably be arranged.

District 9 — Jan Schakowsky (D)

VRA: W 62% H 15% A 14%

TTP: 60%

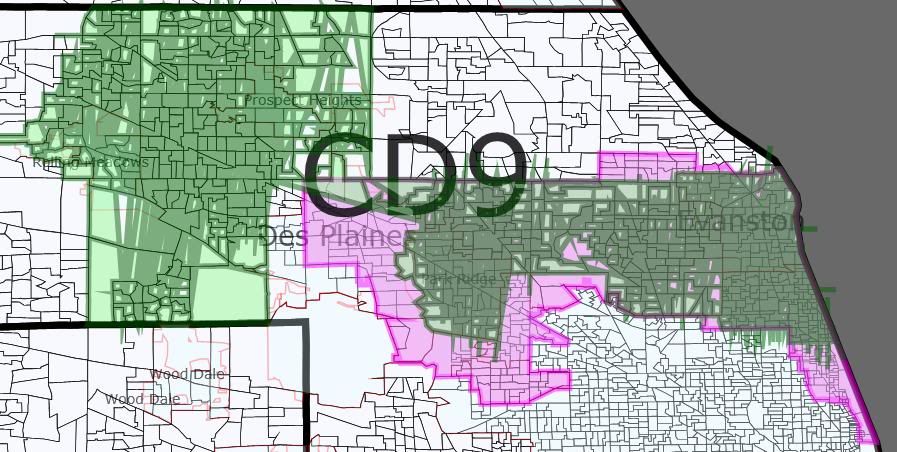
Schakowsky’s district stretchs significantly further west now. This is the only Democratic-held district I’m concerned about whether I weakened it significantly. Perhaps she and Quigley could swap Elk Grove for Des Plaines? (Is that even an improvement for her?)

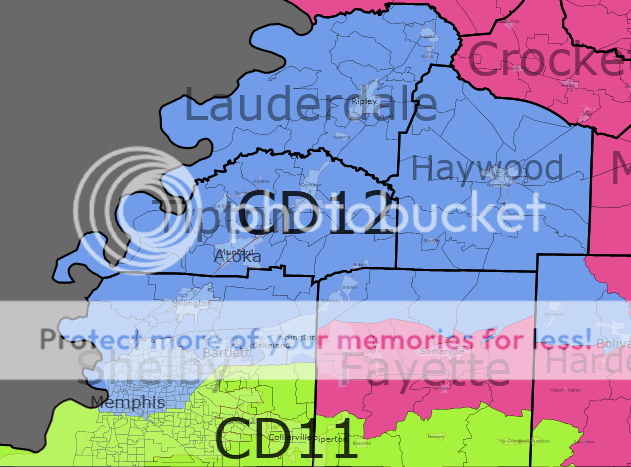
District 12 — Jerry Costello (D)

VRA: W 80%, B 15%

TTP: 71%

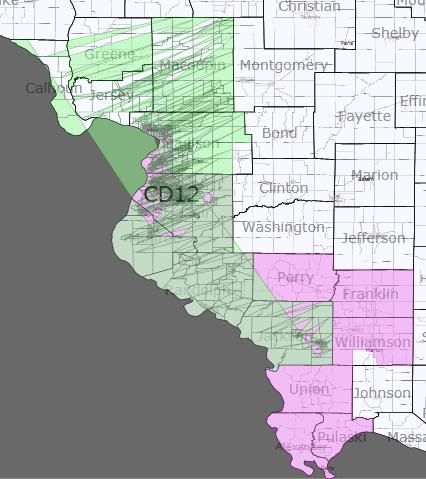
Costello’s district shifts north, and in doing so becomes more Democratic (I think.) One danger: I’ve technically drawn Shimkus into this district, but I’m assuming he’d run in what is now the neighboring 16th. I don’t think Shimkus is a problem (71% TTP for Costello!), but if he is, he could be drawn into the 16th properly. But I’m guessing that would require decreasing the 12th’s Democratic performance.

Republican Held Seats

Now the fun begins! Republicans, please met your new districts.

I have no firm idea what the Democrat’s chances in any of these districts are. I’m hoping that disincumbenting the Chicago suburban Republicans will make them vulnerable. Outstate from Chicagoland, I think I created two new districts that are at least competitive for the Democrats.

District 6 — Judy Biggert (R) vs Randy Hultgren (R)

VRA: W 71% H 14% A 10%

TTP: 55%

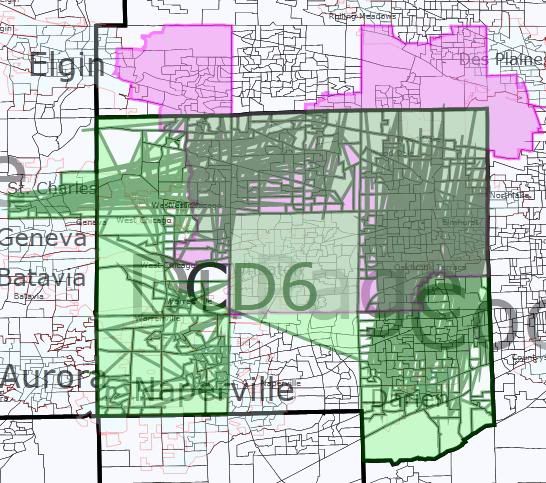
While remaining DuPage-based, the 6th now pairs the residences of two incumbent Republicans — neither of whom are the incumbent in the 6th! Its upside-down U-shape is to keep incumbent Peter Roskam’s hometown of Wheaton out of the district. The listed TTP is if Roskam ran here anyway. If Biggert ran here, her TTP would be 34%; for Hultgren, 11%.

District 8 — Joe Walsh (R)

VRA: W 82%, H 11%

TTP: 35%

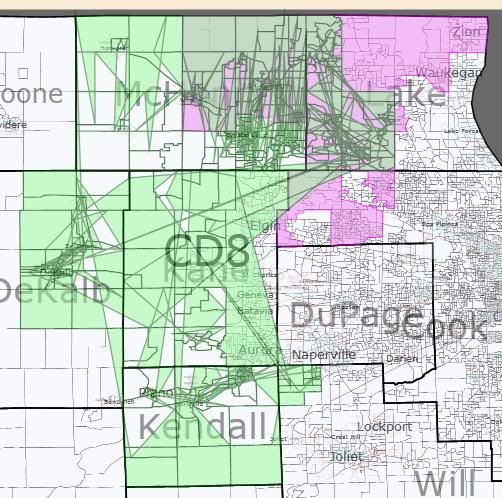
No longer stretching to Lake Michigan, Walsh’s seat now heads south into eastern Dekalb, western Kane, and Kendall Counties. Sadly, I suspect that this territory as at least as favorable to Walsh as his current one. Walsh would have nearly the same TTP if he ran in the new 10th at 30%. Representatives Manzullo and Hultgren would be at 28% and 29%, respectively, if they ran here — despite, you know, not living here.

As a side note, I believe Bean lives in my new 14th.

District 10 — Bob Dold (R)

VRA: W 67%, H 19%

TTP: 68%

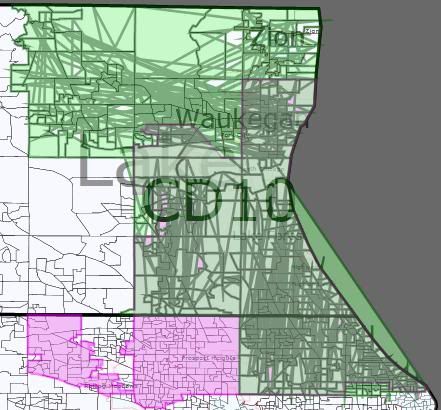
The GOP district I most failed to disrupt. Any suggestions on what I can do with this?

District 11 — Don Manzullo (R) vs Adam Kinzinger (R)

VRA: W 86%

TTP: 46%

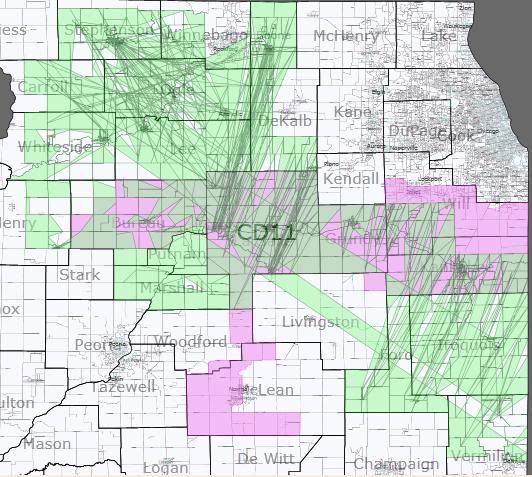
Contains parts of no fewer than 6 current districts. The TTP listed is for Kinzinger, the incumbent by district number and by largest TTP. Manzullo’s TTP is 28%. I’m pretty sure that this is a Republican vote sink. I do feel like I’m wasting LaSalle County, though, which I understand to be a reliable source of Democrats votes. Maybe there’s a better way to draw this vis-a-vis the 8th?

District 13 — Peter Roskam (R)

VRA: W 68%, H 15%, B 10%

TTP: 50%

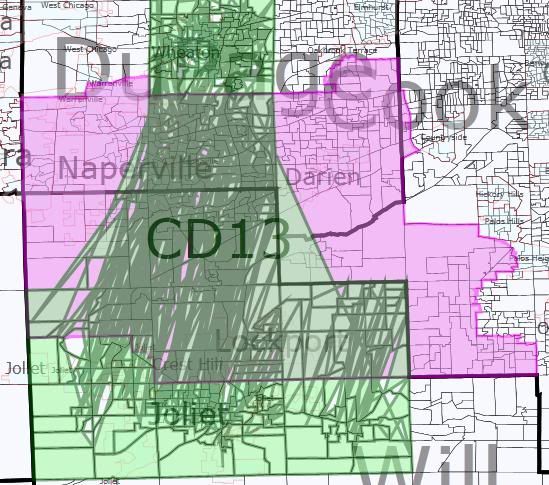
Biggert’s old district now stretches from Wheaton to Joliet. She no longer lives here (Roskam does), but the TTP listed is hers. If Roskam run here, his TTP would only be 17%; Kinzinger would have a TTP of 34%.

District 14 — Open Seat (R?)

VRA: W 62%, H 25%

TTP: 61%

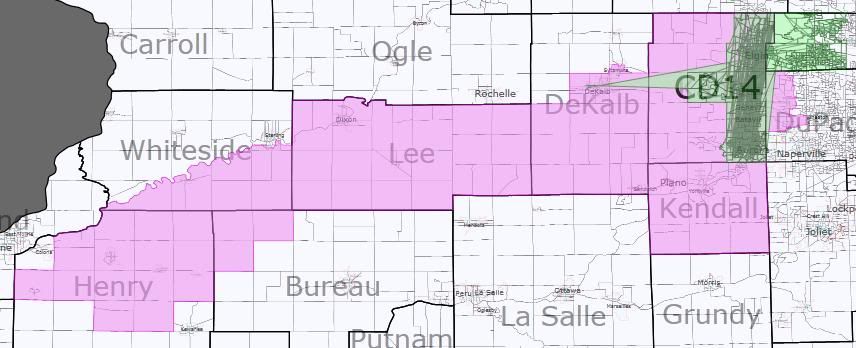
Compacts immensely — no longer stretching out towards the Quad Cities, it is now limited to eastern Kane and far northwestern Cook. This is technically an open seat, since Hultgren lives in the neighboring 6th, although the TTP is his. I believe that both Foster and Bean live in this district. Walsh would have a TTP of 23%. It’s not as disincumbented as I was hoping for — any suggestions?

District 15 — Tim Johnson (R)

VRA: W 83%, B 10%

TTP: 54%

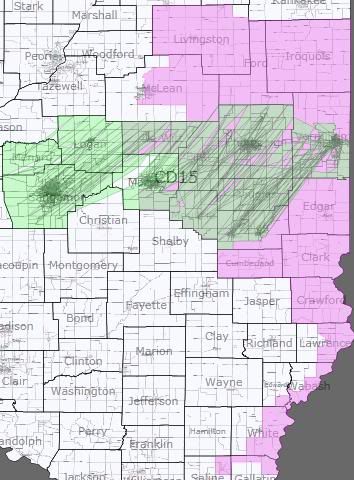
Switches orientations from north-south to east-west, dropping rural areas to pick up Decatur and Springfield. The Springfield area seems to be unusually Republican-friendly for a state capital, so I don’t think this hurts him as much as might be hoped. Nonetheless, this is one of the three districts outstate that I consider a potential D pick-up. Schock’s TTP is 22%, Schilling’s is 17%.

District 16 — Open Seat (R)

VRA: W 93%

TTP:  60%

Entirely relocated from the northwest to the southeast, where it takes over for the reapportioned-away 19th. (This also results in no old/new picture, since the number changes — you’ll have to scroll up to the overview.) Although technically an open seat, I assume that Shimkus would run here; the TTP is his. Johnson’s TTP is 21%; Costello’s is 14%. The second of the downstate Republican vote sinks.

District 17 — Aaron Schock (R) vs Bobby Schilling (R)

VRA: W 78%, B 11%

TTP: 45%

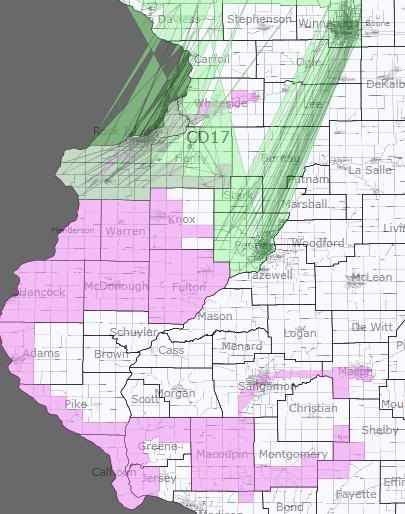
Of the Republican-held seats, this is the one I most strongly suspect would flip Democratic under my plan. A succesor in spirit, if not in form, to the current 17th. It strings together Rockford, the Quad Cities, and Peoria. The TTP listed is actually Manzullo’s, who doesn’t live in the district. Schock’s TTP is 26%; Schilling’s is 25%.

District 18 — Open Seat (R)

VRA: W 91%

TTP: 38%

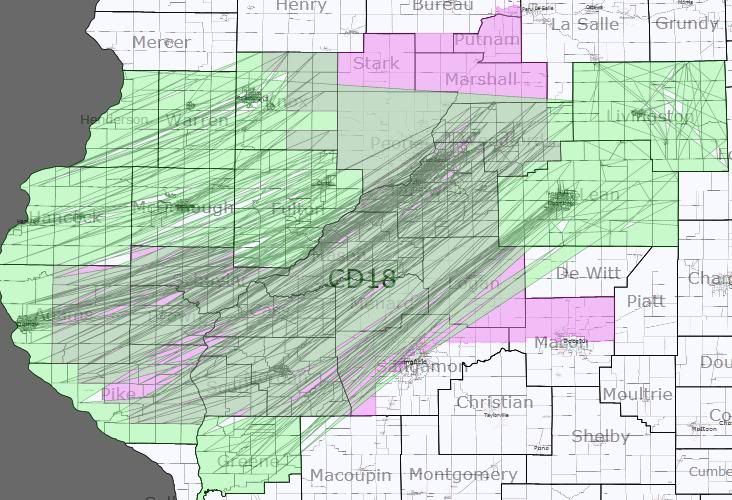
Drops Peoria County and the northern suburbs of Springfield to pick up Bloomington-Normal. This is my third and last Republican vote sink. The listed TTP is Schock, the closest this district (which covers parts of five current ones) comes to an incumbent. Schilling’s TTP is 32%; Johnson’s is 15%; Kinzinger’s is 14%.

Summary

With the caveat again that Illinois is a hard state for me to judge, I think that this map averages around a 12-6 Democratic advantage. Best case scenario: 15-3. Worse case scenario: 8-10 (ie, the status quo, minus one Republican from reapportionment.)

Again, the goals for this map were to demonstrate two things: a possible way to disincumbent the Republicans by making their districts as different as possible from the current set-up and a possible way to swap out Lipinski for a new Hispanic representative. I remain curious about what people who actually understand Illinois think about my plan.

Maryland and Utah: Plausible Redistricting Maps

This writeup will be brief and will lack detail pictures. Dave’s app ate one of my save files for the Maryland map, and the Utah map I drew up on a public computer when I was bored.

Utah will gain one seat. Rep. Matheson, the only Democrat in the Beehive State’s congressional district, has resisted every effort to defeat him. With the Wasatch Front gobbling up so much of Utah’s voting population and Salt Lake County trending blue, I think Utah Republicans will be relieved to confine Matheson to the state’s most populous county and parcel out his redder rural and suburban territory to help create a new district. Rep. Chaffetz will probably run against Sen. Hatch in 2012, but if he doesn’t, he could run in the new UT-04, as he’s been drawn out of UT-03. It really doesn’t matter, as UT-01, UT-03, and UT-04 would probably vote for Attila the Hun as long as he could prove he was a naturalized U.S. citizen.

All of these districts but MD-06 (teal) are safe Democratic seats. I posted this map in the comments section of a now-buried diary, but I figured I’d repost it in a new diary. Rep. Kratovil can run for MD-01 (blue) from his Stevensville home in coastal Queen Anne’s County. Rep. Bartlett has been drawn out of MD-06, with the blueing city of Frederick (as well as its little cousin of Hagerstown, in Washington County) drawn into Rep. Van Hollen’s MD-08 (slate blue). Rep.-elect Harris would probably do just fine in MD-06. Just to give you an idea of exactly how Democratic this state is, MD-06 voted for Sen. McCain over Sen. Obama in 2008 by within a point of the same margin by which MD-05 (yellow) and MD-08 broke for Sen. Obama. MD-04 (red) and MD-07 (grey) are black-majority VRA districts (54% black, 22% white; and 53% black, 33% white respectively). I may have drawn Rep. Sarbanes out of MD-03 (purple), but moving across Baltimore is really not a big deal for a congressman.

(MI, NC, IL) Redistricting Potpourri

This diary presents potential redistricting maps for Michigan, North Carolina, and Illinois. It also carries the ulterior motive of the following bleg:

I’ve started working on two related projects for Michigan for Dave’s App. I’m collating partisan data and renaming the voting districts by municipality name and precinct number. (Currently, Michigan’s voting districts are named using a 14 digit code.) I could use the following three forms of help:

1. I need a precinct map for the city of Detroit. This is looking ahead a bit, because Detroit is the final portion of the state I intend to work on, but it would really help. My Google-fu has failed me thus far.

2. In order to enable collaboration (see third form below), I need to figure out how to get the lines in my copy of vt26_d00.csv sorted by county and voting district number. The vt26_d00_data.csv file is already sorted like this, but its counterpart is somewhat helter-skelter. The solution that occured to me was to try sorting it using OpenOffice Calc (my only spreadsheet program), but that immediately lost leading zeroes, which breaks the CSV file. Any ideas out there?

3. Actual collaboration in collating and renaming. I’m currently going through the counties alphabetically. After two-ish weeks of sporadic effort, I just finished the H’s with Huron County. (On to Lansing’s Ingham County next!) That’s about 19% of the state population. Doing Flint’s Genessee County took most of the day yesterday, and I’m fairly frightened of Kent/Macomb/Oakland/Washtenaw/Wayne. Even if you’re just interested in helping with some of the smaller, easier counties, I’d be grateful. If you’re willing and interested, send me an email at my user name at gmail.com so that I can send you information about the conventions I’ve been using. Also, post a comment letting me know you emailed me — it’s a secondary email that I don’t otherwise check.

After the jump, you’ll see the following forms of actual content to assuage my conscience from this bleg:

Michigan: what my partisan map progress looks like so far and a potential Republican gerrymander (an abgin-esque atrocity by Michigan standards)

North Carolina: a Republican map that packs five Democratic incumbents into two districts

Illinois: an oxymoronic “good government” map of Illinois — I’m posting it mostly to show that two majority Hispanic districts in Chicago are easily created and to show off an particular idea for a reconfigured 17th district.

Michigan Partisan Progress So Far

Michigan Republican Gerrymander

Michigan redistricting law heavily discourages county and municipality splitting. This map probably looks tame by most states’ standards, but it’s basically an abgin-esque “finding the limits” map by ours.


The Detroit-Ann Arbor-Flint CMSA

This map has its origins in a comment — I don’t recall which thread — that posited an I-75 district linking together Kildee and Peters. This is my attempt to make that district and show its consequences.

I started by painting in all of Genessee County (I really don’t think you can get away with having a district consisting of only portions of three different counties.) Then I painted in the bare minimum number of people to take in Saginaw City from Saginaw County — no GOP plan is going to saddle one of their representatives with Saginaw. Finally, I snaked down through Oakland County, taking heavily Democratic Pontiac and Peter’s home area of Bloomfield /Bloomfield Hills.  That, as it turns out, is a district. So I started working other districts around it.

End result: Peter’s 9th district has been eliminated by trisection. Its eastern third is now in Miller’s 10th, its central third is in Kildee’s 5th, its western third is in McCotter’s 11th.

I won’t dissect the districts in detail, but suffice it to say that I think this is a fairly successful Detroit-area map for the GOP. McCotter gets majorly shored-up (although he might at primary risk from an Oakland-based politican), Miller probably washes out in trading the Thumb for eastern Oakland, and Peters gets the short end of the reapportionment stick.

Taking a look statewide…

… there are some interesting repercussions, mostly favorable to the Republicans. Starting with one of the pieces of bad news, however, with the 5th and 10th sucked down into the Detroit area, the 4th is forced to cover the Thumb. Dave Camp becomes an incumbent in-name only, with only his home county of Midland and the western portion of Saginaw County overlapping between his current district and this one. I would guess that this district is at least as Republican as his current one, but I’m not entirely sure.

With the 4th swinging east, the 1st gets to pick up the Republican-leaning Traverse City area, mildly shoring up Benishek. The 2nd and 3rd also get pulled north by the 4th’s relocation. That, in turn, allows Upton to take in all of Republican Allegan County and Walberg to newly acquire heavily Republican Barry County — a significant upgrade for him that I’ve been otherwise unable to find. I’m genuinely unsure about how the changes to Roger’s 8th district pan out — he loses Republican northern Oakland, and gains some swingy territory in central Michigan along with fairly Republican (I think) Ionia County.

Summary: This map definitly eliminates a Democratic incumbent. I think it also shores up four Republican incumbents while severely inconveniencing another, with the effects on yet another being unknown.

North Carolina Republican Gerrymander

This map has its origins in SaoMagnifico’s recent Wyoming Rule diary on North Carolina. While composing a counter-suggestion to his proposed map, I discovered that there’s a significant African American population in and around Fayetteville. I’ve seen some insisting that this population could be linked with Raleigh’s to produce a new VRA-seat. My attempts at drawing that district while preserving the current 1st have failed, but it turned out to work well when linked with Charlotte’s African-American population instead.

This is a 7-4-2 Republican/Democratic/swing map.

A quick run-through:

The 1st district (blue) stays more or less in place. VRA: 49% black, 44% white (is this kosher?). 2008: Obama 62%, McCain 37%.

The 2nd district (green) shifts substantially west. Still contains all of Ellmer’s (and Etheridge’s) Harnett County. 2008: McCain 56%, Obama 43%.

The 3rd district (purple) now hugs the coast all the way down to (and including) Wilmington. Incumbent Jones is (barely) drawn outside the lines, but I’ve been told he’s outside the lines already. 2008: McCain 57%, Obama 42%.

The 4th district (red) packs Price and Miller into one uber-Democratic (majority-white) district. 2008: Obama 73%, McCain 26%.

The 5th district (yellow) continues to hug the northwest corner of the state. Foxx now lives in her district. 2008: McCain 60%, Obama 38%.

The 6th district (teal) shifts west. This is kind of like a bizzaro-12th, covering broadly similar territory between Charlotte and Greensboro, but with the intention of being a Republican district instead of an African-American gerrymander. Coble still lives here, I think. If not, he’s close. 2008: McCain 56%, Obama 43%.

The 7th district (grey) is still in the southeast corner of the state, reaching north into the eastern parts of the old 2nd — but it’s been reconfigured to exclude incumbent McIntyre. 2008: McCain 56%, Obama 43%.

The 8th district (slate blue) is the center-piece of this plan. It strings together all three of Watt, Kissell, and McIntyre into a minority-majority district. VRA: 41% black, 35% white, 13% Hispanic. 2008: Obama 66%, McCain 33%.

The 9th district (cyan) now lies exclusively east of Charlotte. So far as I know, Myrick still lives in the district. 2008: McCain 55%, Obama 44%.

The 10th district (magenta) pulls in closer to Charlotte. 2008: McCain 59%, Obama 40%.

The 11th district (lime) stays in place. 2008: McCain 52%, Obama 46%.

The 12th district (cornflower) is a (majority white) Democratic new open seat in the Triad. Effectively, the Republicans get rid of both of McIntyre and Kissell and replace them with a Triad-area Democrat. 2008: Obama 60%, McCain 38%.

The 13th district (salmon) is a swing(!) district surrounding the Triangle. 2008: McCain 50%, Obama 49%.

If not screwing with Shuler is something you can’t see the Republicans doing, here’s an area map for the changes necessary:

(Please ignore the 5th changing colors.]

New stats

5th:  56 Mc / 42 Ob

10th: 57 Mc / 42 Ob

11th: 58 Mc / 42 Ob

Illinois Good-Government Redistricting

This map was drawn to avoid splitting counties and muncipalities — an idea I support in the abstract if not necessarily in practice. I won’t go into detail at all about it, because I don’t feel like I understand Illinois well enough. But I wanted to draw attention to two features to see what people think who do understand Illinois politics. (The 11th and 16th — both green — can be hard to distinguish. DeKalb, LaSalle, and points east are in the 11th.)

Feature one: Here’s the VRA statistics for most of the Cook County districts.

1st (blue) — white 39%, black 53%

2nd (green) — white 26%, black 58%, Hispanic 10%

3rd (purple) — white 75%, Hispanic 16%

4th (red) — white 25%, black 12%, Hispanic 59%

5th (yellow) — white 32%, Hispanic 51%

7th (grey) — white 29%, black 53%, Hispanic 16%

9th (cyan) — white 66%, Asian 13%, Hispanic 12%

Actual census numbers may change this, of course, but 2 VRA Hispanic district seem possible with a miminum of fuss.

Feature two: Note district 17 [dark blue] in the whole-state map above. It links together the Quad Cities, Bloomington-Normal, and Champaign-Urbana. Is this a workable Democratic district?

If not — I’ve gotten the impression that Bloomington-Normal is fairly Republican for a mid-sized city — how about this, which substitutes in Decatur?

Tennyoming: Redistricting Tennessee, But With 12 Districts

Under the Wyoming Rule, Tennessee would increase its share of districts to an impressive round dozen. But while the Volunteer State was once a swing state, it has become solidly Republican, at least for the time being. It remains unclear whether the wing of the party represented by the relatively moderate Sen. Corker or the wing of the party represented by Lt. Gov. Ramsey, who called Islam a “cult” during the primary campaign, will win in the battle for the soul of the Tennessee Republican Party, and whether the victor may determine where the fickle electorate lurches next.

As it rests now, though, Tennessee Republicans could force a 9-3 map under Wyoming Rule redistricting, and the only reason why they could not draw a 10-2 map is the Voting Rights Act.

TN-01 (safe Republican)

Rep. Phil Roe’s district just loses a few counties.

TN-02 (likely Republican)

Rep. Jimmy Duncan’s district is now consolidated around Knoxville.

TN-03 (safe Republican)

Rep.-elect Charles Fleischmann gets a nice safe district that looks a lot less disgusting than outgoing Rep. Zach Wamp’s current oddly shaped district.

TN-04 (safe Republican)

No longer Rep.-elect Scott DesJarlais’s district, this Republican-friendly open seat is leftovers from the first three.

TN-05 (safe Republican)

A partial successor to Rep.-elect Diane Black’s TN-07, this district contains her Gallatin residence and is thus her seat, for all intents and purposes. It has nothing to do with the safe Democratic district in Nashville, represented by Rep. Jim Cooper. On the contrary, this seat is safe Republican.

TN-06 (safe Republican)

Just as the previous district provided a natural home for Rep.-elect Black, DesJarlais’s gutted TN-04 is effectively replaced by this smaller district. Middle Tennessee is fertile ground for Republicans, and DesJarlais should be fine here.

TN-07 (likely Republican)

This district, which contains the home of outgoing Democratic Rep. Bart Gordon, is an open seat that leans Republican due to the territory. If Gordon runs, he might be able to win it, but it’s pretty conservative territory for the most part.

TN-08 (safe Democratic)

Team Blue finally gets on the board, with this successor to Cooper’s TN-05 solidly Democratic with its territory nibbled down to the center of Davidson County.

TN-09 (likely Republican)

With Democratic Rep. David Tanner history, Republican Rep. Marsha Blackburn (currently of TN-07) gets a less stupid-looking district. She should be established enough to win even though it includes a bit more of Democratic-leaning Davidson County than before.

TN-10 (safe Republican)

This western district, which includes pieces of the current TN-07 and much of the current TN-08, is an open seat that any Republican should be able to win.

TN-11 (safe Democratic)

As VRA districts go, these aren’t very stringent. This partial successor to TN-09, represented by Democratic Rep. Steve Cohen, is 51% African American, 41% white. I don’t know if Cohen lives here, but it should be safe for Democrats.

TN-12 (likely Democratic)

I screwed over Rep.-elect Stephen Fincher, who looks like a liability for the GOP in Tennessee right now anyway, and plopped him into a coalition VRA district, which is 47% white, 46% African American, and 100% problematic for Republicans. Sen. John McCain of Arizona carried Tipton County in 2008, but only won Lauderdale County by a few points, while then-Sen. Barack Obama of Illinois won big in Shelby and Haywood counties. Fincher could win it with a great campaign, but he doesn’t seem to run great campaigns.

Thoughts, either on the map or on the Wyoming Rule?

Newyorkoming: A 36-seat Democratic Gerrymander

Photobucket

As a thought experiment, I’d figured I try redistricting the state of my birth (and my entire life up to age 30) under the Wyoming Rule discussed elsewhere on this website.  Aside from truly applying “one-man, one vote” by ensuring that residents of the smallest state do not have more of a vote than residents of the 3rd largest, there were other benefits of the Wyoming Rule when applied to New York City.  I was able under this map to create a new Hispanic VRA-compliant district in Queens (and give Valasquez an entire Brooklyn Hispanic district of her own).  In Queens, it was also possible to create an Asian influence “coalition” district that might ensure the election of the first Asian-American congressmember from New York.  And through the creation of several Queens/Nassau hybrid districts, I was able probably to ensure Peter King’s removal from public office (a major goal of mine as he is just terrible).  In the Bronx, with the smaller sized districts, it is possible not only to create another Hispanic VRA district (sorry Eliot Engel) but also an Black VRA district centered on northern Bronx and neighboring Mount Vernon.

Elsewhere, the major purpose of this map was to maximize Democratic-performing districts, particularly Downstate.  I created an open GOP seat in Suffolk County but cracked Peter King’s base and threw him into a 61% Obama district.  Staten Island is divided into two and hence neutered as a possible source of Republican votes.  In the Hudson Valley, three relatively safe Democratic seats were created with just one district with a Republican PVI (and that seat – Rockland/Orange, a reincarnation of the old Ben Gilman seat – is really more Democratic than the Obama percentages suggest).

Upstate, it is very possible to create a Democratic dummymander (as several of the maps on this site did last year in my opinion).  You need to leave some Republican vote sinks.  My map does this, aiming for a 7-4 split north of Maurice Hinchey’s now Hudson Valley-centered district.  Some of the 4 are within reach for an exceptionally strong Democratic candidate but only one of the 7 Democratic seats is realistically within reach for a Republican now.

This map creates just 6 districts where a Republican has a reasonable shot of winning (the new 2nd out in Suffolk County, the 24th in Rockland/Orange, and 4 districts upstate: the 28th and 29th in Central New York/Adirondacks region, and the 32nd and 34th in Western New York.  29 Democratic seats are at 58% Obama or higher, a 30th Democratic PVI seat (Bill Owen’s new 26th) is at 56% Obama, the best you can draw in that area without splitting Albany which I did not want to do.  A 30-6 delegation and not, I believe, a dummymander.  But please let me know what you think.

Eastern/Central Long Island (Districts 1-3)

Photobucket

District 1 (Blue) (Bishop (D) if he survives his recount… otherwise it’s his again in 2 years) Obama 59, McCain 40

Lose Republican voting areas in eastern LI and replaces them with Democratic-areas of Islip Town.  Turns a swing district into something more like the current NY-02 or NY-04.  Bishop should now be fine.

District 2 (Green) OPEN LEAN GOP Obama 46, McCain 54

Realistically this GOP vote sink is necessary to protect Bishop and Israel.  I would have drawn Peter King in here but he lives too far away (and as I said, I wanted this map to get rid of that thug of a politician).  Would be the only Republican left in the entire downstate New York delegation.

District 3 Israel (D) (Purple) Obama 59, McCain 41

All of Huntington and Babylon towns in Suffolk, finger into Nassau as currently but extends a bit further down to Hempstead and Uniondale to grab black Democratic voters to push the Obama numbers up.  Israel should like this district.

Nassau/Queens Hybrid Districts (Districts 4-10)

Photobucket

Photobucket

District 4 (Red) Ackerman Obama, 60, McCain 39

North Shore areas of Nassau that Ackerman represented before in the 1990s, non-Asian areas of northern Queens that are in his district now, and Astoria (a new area for Ackerman but put in the district to bring up the Obama numbers).  Helps out the cracking of Peter King by removing parts of his North Shore base.  Although the district drops slightly in Democratic performance from now, Ackerman or another Democrat should be fine.

District 5 (Yellow) OPEN ASIAN-INFLUENCE “MINORITY-MAJORITY COALITION” VRA DISTRICT

Obama 69, McCain 30

Asians 39%, Whites 29%, Hispanics 22%, Blacks 6%, Others 4%

If you go to smaller Wyoming-sized districts, you still have to follow the VRA.  But ethnic/racial groups that do not have enough numbers to dominate a 720,000-person district do when we’re talking more like 545,000.  This was the hardest district to draw because Dave’s redistrict app does not color-code high Asian-American census tracts as it does for Blacks or Hispanics.  Luckily, my familiarity with Queens from living in New York City for 6 years helped me somewhat in knowing roughly where Asians reside in Queens.

District 6 (Teal Green) Crowley (D) or Weiner (D) although perhaps Weiner moves back to Brooklyn and runs in my new 14th?  Obama 62, McCain 37

Leftover bits of Queens after drawing a new Hispanic VRA district (the 9th), the Asian-influence VRA district (the 5th), and the current black VRA district centered on South Queens (the 8th).  It then snakes out in Long Island to continue helping crack Peter King.  With a PVI of +9, any generic Democrat should be fine in this district.

District 7 (Gray) McCarthy (D) Obama 61, McCain 38

Dips a bit into Queens to grab excess Blacks not needed for the #10 and helps further crack Peter King by grabbing some redder precincts out of his current district.  And it gets 2% more bluer than currently is the case.  What’s not to like?

District 8 (Purple-Blue) King (R) Obama 61, McCain 39

I think Peter King is finished with this remap.  And where is he going to run if not here?

District 9 (Sky Blue) OPEN VRA HISPANIC DISTRICT

Obama 80, McCain 19

Hispanics 50%, Whites 22%, Asians 14%, Blacks 8%

Barely VRA complaint, but I think it passes legal muster as the nearest demographic group, whites, are 28% less in the district.

District 10 (Pink) Meeks (D) BLACK VRA DISTRICT

Obama 79, McCain 21

Blacks 51%, Whites 26%, Hispanics 16%, Asians 2%

Completes the cracking of GOP voters in Nassau County, and thus Peter King, by sinking the heavily Republican Five Towns and other southwest Nassau GOP areas in a black-majority district that now extends a bit into Brooklyn to equalize its population and gain the necessary blacks to remain VRA complaint.  Meeks should still be fine.

Brooklyn (Districts 11-14)

Photobucket

District 11 (neon green) Valasquez (D) HISPANIC VRA DISTRICT Obama 88, McCain 12

Hispanics 51%, Whites 21%, Blacks 13%, Asians 11%

With Wyoming-sized districts, Valasquez’s currently flailing in all directions district gets partitioned into Queens and Brooklyn-only successor districts.  There are just enough Hispanics in Brooklyn to make a district and its Valaquez’ for as long as she wants it.

District 12 (light blue) I’m guessing Towns (D)? VRA BLACK DISTRICT

Obama 78, McCain 22

Blacks 52%, Whites 34%, Hispanics 7%

I diluted the black share of this district and Yvette Clarke’s next-door so I could crack heavily McCain precincts in south Brooklyn and keep them away from the open #14.  Don’t know for sure whether I kept the Caribbean Blacks in one district and the African-American Blacks in another, though.  (This is mainly why the districts are drawn in the weird wrapping-around way right now).

District 13 (beige pink) Yvette Clarke (D)? VRA BLACK DISTRICT

Obama 81, McCain 19

Blacks 52%, Whites 28%, Hispanics 11%, Asians 6%

Also helps crack McCain precincts in south Brooklyn.

District 14 (ugly green) OPEN DEM SEAT Obama 69, McCain 30

Stretches from parts of Williamsburg, Fort Greene, and Park Slope down to Coney Island.  I think a Park Slope liberal like David Yassky would love this district; otherwise if Weiner wants to move back to Brooklyn he can have it.

Staten Island-Manhattan Districts (Districts 15-18)

District 15 (orange) Grimm (R) NOT MUCH LONGER!! Obama 67, McCain 32

Takes the last bits leftover in Brooklyn from drawing 4 districts, adds that to about 1/2 of Staten Island, and finishes the job by adding a bit of heavily Democratic lower Manhattan.  Shares joint-contiguity across New York Harbor with neighboring 16th with the Staten Island ferry.  Thousands of Staten Islanders take that to work each and every day – along with oodles of tourists getting a free view of the Statue of Liberty and Ground Zero.  Prior to 1982, the Staten Island district connected with a bit of Manhattan.  It’s perfectly legal.

District 16 (green) Nadler (D) Obama 69, McCain 31

Nadler helps complete the job of cracking Staten Island.  Even better his type of progressive politics causing Staten Islanders even bigger heartburn.  Want to secede from NYC?  Tough, you can’t!

Photobucket

District 17 (dark purple) Maloney (D) Obama 78, McCain 21


Shrinks to become just an East-Side Manhattan district, like it was before the 1990s.

District 18 (yellow) Rangel (D) VRA “MINORITY-MAJORITY COALITION DISTRICT”

Obama 94, McCain 5


Hispanics 45%, Blacks 37%, Whites 13%

Largely the same as before, without Rikers Island or a bit of upper-most Manhattan.  Due to the exponential growth of Dominicans, it is no longer possible to draw a black-majority district in Harlem anymore without crossing over into the Bronx.

Bronx-Lower Westchester Districts (Districts 19-21)

Photobucket

District 19 (Serrano (D) VRA HISPANIC DISTRICT

Obama 85, McCain 14

Hispanics 54%, Blacks 23%, Whites 17%

Did a bit of rejiggering of the Bronx districts to create a second Hispanic VRA district as well as an African-American one.  But Serrano should be fine.


District 20 OPEN VRA BLACK DISTRICT

Obama 89, McCain 11

Blacks 51%, Hispanics 31%, Whites 14%

One of the best outcomes in my mind of a Wyoming Rule is that it enables you to craft VRA complaint districts in areas that you ordinarily cannot now.  Such is the case of northern Bronx/Mount Vernon.  District extends a bit north to Eastchester Town in Westchester to steal GOP votes from Lowey’s district.

District 21 (maroon) Engel (D) but likely not for much longer VRA HISPANIC DISTRICT

Obama 87, McCain 12

Hispanics 58%, Whites 18%, Blacks 17%

Under the Wyoming Rule and the VRA, Bronx is going to have to have a second Hispanic district.  And with that, Engel loses a seat, unless he wishes to move to Rockland County and take on the open swing district there.  Not that I care much; I find Engel one of the least effective congressmen from the New York delegation.

Lower-Mid Hudson Valley (Districts 22-25)

Photobucket

District 22 (brown) Lowey (D) Obama 60, McCain 39


Most of Westchester, goes north to grab a few more Republican-leaning areas away from Hayworth in the 23rd and helps transform that district from a swing district into a lean-Democratic one now.  Lowey, who’s an institution in Westchester, should be fine.

District 23 (very light blue) Hayworth (R) but not for much longer!

Obama 58, McCain 42

This would be my home district were I still living where I grew up.  Ancestrally Republican, southern Dutchess is now becoming a swing region, in part due to people moving in from New York City and Westchester, but also in part due to the Republican party lurching right off of a cliff over the past 2 decades.  The type of Republicans this region used to support were centrists like long-serving GOP congressman Ham Fish Jr., current State Senator Steve Saland who isn’t all that bad especially on education issues, and George Pataki who is bad on education issues but pretended to be a socially liberal Republican while governor between 1995 and 2007.

Still, by going deep into Democratic areas of Westchester, it is possible to draw this district so that it has a Democratic PVI.  John Hall probably would have won reelection on these lines.


District 24 (purple) OPEN SWING DISTRICT/LEAN GOP?

Obama 51, McCain 49

Welcome to a reincarnated version of the old Ben Gilman district.  Going by Obama percentages alone would suggest that this is a lean-GOP district.  However, for some reason or another, Obama didn’t sit well with a lot of Jewish Rockland and southern Orange voters; similarly, he didn’t earn the robust vote percentages out of Long Island that Clinton and Gore received.  Perhaps a lingering 9-11 effect?  Well, whatever the reason, Rockland and southern Orange are heavily Jewish regions that tend to support Democrats at the state and local level.  A Republican can win here but it has to be a Republican in the mold of Ben Gilman, who even when he was serving in congress (1972-2002) was considered a RINO.  I like our chances in this district even though I drew it this way to maximize the Democratic chances in the 23rd and the 25th next door.


District 25 (pink) Hinchey (D) Obama 59, McCain 40


Hinchey finally gets a Catskills-Hudson Valley only district instead of his squiggling around all over the place!  I love the Wyoming Rule!!

Central New York-Capital Region

Photobucket

District 26 (grey) Gibson (R) vs. Owens (D) LEAN DEMOCRATIC  Obama 56, McCain 42


Being purely tactical here, I combined the most Democratic areas of both the current 20th and the 23rd, excising out the most Republican regions of each (Jefferson, Lewis, northern Oneida, Hamilton, Fulton, etc. in the 23rd; Saratoga in the current 20th).  While I do not like blue Dog DINO Owens, he has shown moxy in winning not once but twice a district that never elected a Democrat before in something like a century.  Now he has a district that has a lean-Democratic PVI… and without having to cut Albany in half.

District 27 (neon green) Tonka (D) Obama 60, McCain 39

The Albany outlaying region is slowly turning against national Democrats.  Decided here to shore up Tonka a little by grabbing Saratoga Springs.  The neighboring 28th is one of 4 GOP vote sinks in upstate New York so this makes a bit of sense.

District 28 (lilac) OPEN GOP SEAT Hoffman probably? (Ugh!) Obama 47, McCain 52

The consequence of making a safer district for Bill Owens is that we probably also get Doug Hoffman.  Oh well….

District 29 (green/gray) Hanna (R) Obama 47, McCain 51

A lean-GOP vote sink in upstate New York because frankly Oneida County has too many frigging Republicans and because under the Wyoming Rule, there’s no place really for them to go but here.  also, I wanted to a safer district for Maffei near Syracuse and an open Democratic college-towns district near the Binghamton-Ithaca area.  So, Hanna gets a safish district.  Arcuri could make a comeback, though, as it isn’t all that Republican.

District 30 (light red) Maffei? (D) Obama 58, McCain 40

I think Dan Maffei is well primed for a comeback with these lines.  Includes along with all of Syracuse-dominating Onondaga County, most of Oswego, including the university town that is bound to turn out big for President Obama in 2012.

District 31 (cream) OPEN DEMOCRAT SEAT

Obama 57, McCain 41

I had a lot of fun creating this one.  In addition to grabbing pockets of Democratic voters from Central New York, the Southern Tier, and the Finger Lakes, it is a community of interest district: it is a universities and colleges district.  SUNY-Oneonta, Hartwicke College, SUNY-Binghamton (my alma mater), Ithaca College, Cornell University, SUNY-Cortland, the list goes on and on.  And I think a liberal/progressive in the mold of Maurice Hinchey would do just fine here.

District 32 (red-orange) Tom Reed (R) Obama 43, McCain 56

This is the most Republican district in New York, and serves as one of four GOP vote sinks in Upstate to ensure the election of 7 Democrats in neighboring districts.  Worth the trade in my opinion.  Takes most of the Republican areas of the Southern Tier and connects them via a narrow corridor in Ontario County to uber-GOP Wayne County (the reason why Maffei lost btw).


Rochester-area

Photobucket

District 33 (blue) Slaughter (D) Obama 63, McCain 36

Could have risked it and created another Democratic district in Western New York other than the 3 I have created there.  But let’s face it; Slaughter is getting on in years, the suburbs of Monroe County aren’t nearly as blue as those of Erie, and it just ain’t worth it when you already are running up the score downstate where there are more reliably Democratic votes to unpack.  This district therefore consists of the entire city of Rochester and its immediate suburbs, safely Democratic even when Slaughter decides to retire.

Buffalo-area

Photobucket

District 34 (green) Lee (R) Obama 44, McCain 54

Republican suburbs of Erie County, the heavily GOP GLOW region between Rochester and Buffalo, and parts of Ontario County left over from the 32d.  A safe GOP district for as long as Lee wants it, designed this way to ensure a Democratic victory in the neighboring 35th and 36th seats.

District 35 (purple) OPEN DEMOCRATIC SEAT

Obama 58, McCain 40

A reincarnation of the old LaFalce seat, without its little finger into Rochester.  A generic Democrat should do just fine here.

District 36 (orange) Huggins (D) Obama 58, McCain 40

Little changed from current district in being a Erie-Chautauqua hybrid, but gains bluer portions of Buffalo to raise its Democratic performance a bit.  Remember in 2002, the district was drawn to be a district that a Republican, namely Jack Quinn, could win.

Oregoming: Breaking Down the Internal Borders

Oregon is the latest guinea pig in my experiment with Wyoming Rule redistricting. Because under the rule, the number of seats in the House are apportioned by dividing the U.S. population by the population of its least populous state, Wyoming, Oregon would add two districts to its existing five.

Somehow, I managed to draw a 5-1-1 map for Democrats, although part of it is strong incumbency value in Oregon…and part of it is that Oregon is much more liberal on the federal level than it is on the state level.

Unfortunately, the app doesn’t have voter information for Oregon; fortunately, I did most of my division along county lines, and most of the rest of my division along lines I’m familiar with as a former Oregon resident.

OR-01 (safe Democratic)

Interestingly enough, when I originally drew this Wyoming Rule-sized district, the neat little combination of adjacent Washington and Columbia counties was the perfect size. Then I realized I was still using the 2000 Census data rather than the 2008 population projections, and that went to hell because the western Portland suburbs have positively exploded population-wise over the past decade. So I had to chop out the western halves of those counties, removing a lot of more conservative, rural areas to create a district that, especially with Yamhill County gone too, is even safer for Democratic Rep. David Wu. I say “even safer” because a lot of non-Oregonians are under the impression Wu isn’t completely fireproof in his current district. In 2004, Wu won going away despite being forced to admit to late-breaking claims of attempted date rape, against a highly qualified, moderate candidate with gangbusters fundraising in a cycle Republican enough that Oregonians cast the state’s electoral votes for Sen. John Kerry of Massachusetts by an uncomfortably close four-point margin while passing a constitutional amendment banning same-sex marriage in a state that today, just a few years later, has an openly gay man as mayor of its largest city; has the highest-ranking openly bisexual politician in the country in Secy. Kate Brown, first in line to the governorship; and has both of the nation’s only two openly gay state Supreme Court justices, both of whom were elected by popular vote. In 2010, amid a 63-seat loss for House Democrats nationally, Wu won by a double-digit margin over a challenger endorsed by the highly influential and fairly liberal Portland daily newspaper The Oregonian. If Wu is safe now, he will live forever here, even without the little spur into the western Multnomah County suburbs.

OR-02 (safe Republican)

This was one of the trickiest districts to draw, which is funny, because on the current map, it’s obviously just the half of the state east of the Cascades. But recent population growth in Deschutes County has complicated the traditional breakdown of electoral politics in Oregon, with exploding Bend nearly handing the county to Sen. Barack Obama of Illinois in 2008; Sen. John McCain of Arizona only won Deschutes County by 0.3% in the worst showing by a Republican there since 1964. This year, Republican Jim Huffman appears to have won the county over Democratic Sen. Ron Wyden, the incumbent, by a whopping 22 votes in a year Republicans almost won the Oregon gubernatorial election for the first time since 1982, when moderate Gov. Victor Atiyeh blew now-Gov. Ted Kulongoski out of the water (how times change). Because districts are smaller under the Wyoming Rule anyway, I decided to cut out Central Oregon, including Deschutes County, and because Bend is by far the largest population center in the current district, that left me with a lot of ground to make up despite the fact each district is much less populous now. To make up for it, the district absorbed all of Josephine County and extended slightly upward into Douglas County. Instead of being just an Eastern Oregon district, it is now effectively Eastern and Southern Oregon, minus the Central Oregon subregion. Rep. Greg Walden, a Republican known to be close to incoming House Speaker John Boehner, would be fine here if his Hood River residence wasn’t drawn out of the district. I think he would probably move east to run here again, although if he chose not to, State Senate Minority Leader Ted Ferrioli of John Day would probably be the Republicans’ strongest potential candidate. If former Sen. Gordon Smith of Pendleton, defeated by now-Sen. Jeff Merkley in 2008, decided to run, he would be a very strong candidate, but he might be too moderate for this intensely red district’s Republican primary voters.

OR-03 (safe Democratic)

Instead of containing most of part of Clackamas County, this district is now Multnomah County-only, containing nearly all of Portland proper. Just to give you an idea of how safe Democratic Rep. Earl Blumenauer is here, he destroyed challenger Delia Lopez in the portion of Multnomah County now in his district by a better-than-3:1 margin. In the small part of Multnomah County now in OR-01 that has been reallocated to this compact district, Wu did equally well. This would be one of the safest Democratic districts in the country.

OR-04 (likely Democratic)

I took great pains here to keep Rep. Peter DeFazio, Democrat of Springfield, in this drawing of the district. Somehow, despite being one of the most left-wing members of the House, DeFazio is able to win reelection in a swingish district even when he barely campaigns. With the district stripped out and reapportioned as an Oregon Coast district extending a finger out to take in the twin cities of Eugene and Springfield, which drive the strong Democratic bias of Lane County, I doubt DeFazio would have much trouble. The Oregon Coast is traditionally union territory, and although unions don’t have as much sway in Oregon as they do in some other states, most of the coastal counties are good for Democrats at the federal level.

OR-05 (likely Democratic)

There are two important things to note about this district. First, Marion and Clackamas counties may be swingy on the state level, but on the federal level, they generally prefer Democrats. Second, Yamhill and Polk counties are much less friendly to Democrats at every level, and indeed, they are among the most conservative counties in the Willamette River Valley (although Linn County is by far the most conservative). Despite that, and despite the fact that on paper, this district looks like a tossup, I think it’s likely Democratic. Without the numbers, it’s hard to justify my reasoning here, but basically it goes like this: Chris Dudley may have won practically this entire district in the gubernatorial race, but Obama carried it in 2008 and Rep. Kurt Schrader, the incumbent Democrat, defied the polls in a serious way to win this district so frequently mentioned as a potential Republican pickup, so consistently held by a Democrat. Schrader, who wife is a state senator from Canby (still locked in an as-yet-undecided race for reelection, by the way), has actually been drawn out of this district, but I think a Salem-area Democrat like Brian Clem, a fairly young state representative who has stated his ambitions for higher office, would be a strong candidate here. Fellow Salem-area state Rep. Vicki Berger would probably be the Republicans’ strongest candidate, but she would slot in to the left of several Blue Dogs as a member of the U.S. House of Representatives, so she would probably fail to win the nomination. West Linn-based state Rep. Scott Bruun, who won the Republican nomination this year, has been drawn out of the district along with Schrader.

OR-06 (likely Democratic)

Schrader and Bruun both wound up in this new Portland-area district, which covers the swingy Clackamas County suburbs of Oregon’s largest city, as well as eastern Multnomah County. Fiscally conservative, wealthy Lake Oswego and Wilsonville are more than balanced out in this district by strongly Democratic, working-class Gresham and Milwaukee. Lake Oswego is rapidly turning blue anyway, preferring former (and now future) Gov. John Kitzhaber over Chris Dudley and Schrader over Bruun this year, what with the Oregon Republican Party forgetting what made Vic Atiyeh and Gordon Smith so popular (hint: a combination of bipartisan credentials and socially moderate, environmentally conscious positions). It is entirely possible a rematch between Schrader and Bruun could take place, or that failed gubernatorial candidate Chris Dudley could mount a bid for the House from his Lake Oswego mansion. I think this district should be pretty good for Democrats, though.

OR-07 (swing)

This district includes the tiny Republican counties of Wheeler and Sherman, as well as the larger Republican counties of Crook and Linn, as well as the Democratic counties of Hood River and Benton and the swingy, blueing counties of Deschutes and Wasco. It also borrows large chunks of Democratic Lane County (excluding especially liberal Eugene and Springfield, though) and Republican Douglas County. To be blunt, I have no idea what will happen in this district, although I suspect that if current demographic trends and growth rates hold, it will be solid territory for the Democrats by the time of the next redistricting in 2022. As it is, I think it may tilt Republican. Walden has been drawn into this district, and while he could win here, I think he might prefer to run in his current OR-02. Freshman State Sen. Chris Telfer of Bend, who represents much of Deschutes County and waged an unsuccessful bid for state treasurer this year, may be a stronger candidate to run on the Republican side. State Sen. Rick Metsger of Welches, who did not seek reelection this year, is a potential Democratic candidate (he lost the Democratic primary for secretary of state to Brown in 2008).

Thoughts on the map or the Wyoming Rule?

North Caryoming: 17 Districts on an Already Ugly Map

I applied the Wyoming Rule, stating that each congressional district in the country should have roughly the same population as the smallest state’s at-large district, to North Carolina. Redistricting is gruesome in North Carolina, and with 17 districts, it’s even nastier. I came up with four safe Democratic districts (all of them VRA districts, either with black majorities or minority-majority coalitions), eight probable Republican districts, and five swing districts, ensuring electoral politics in the Tarheel State with this map would be pretty exciting.

Marvel at the atrocity I have committed. For anyone who is curious, going off 2008 population estimates, each district contains roughly between 472,500 and 474,500 people.

NC-01 (safe Democratic)

41% white, 54% black

66% Obama, 34% McCain

This is one district I did manage to make more compact. It remains black-majority and acts as a Democratic vote sink in swingy eastern North Carolina. Rep. G.K. Butterfield, the Democrat who currently holds this seat, would have no new obstacles here.

NC-02 (swing)

78% white, 12% black

51% Obama, 48% McCain

This is where things start getting ugly. After surveying the map I drew for the Raleigh-Durham area, I felt like I needed to take a shower. Rep.-elect Renee Ellmers, a Tea Party Republican loathed by the GOP establishment for some reason, has been drawn out, as she currently resides in Dunn in Harnett County, which isn’t even a part of this district. Meanwhile, I believe Democratic Rep. Brad Miller of NC-13, who resides in Raleigh, has been drawn into the district. Realistically, Ellmers has little chance of holding the current NC-02 in 2012, and Republicans would be better off running a more competent candidate in this district anyway.

NC-03 (safe Republican)

78% white, 18% black

41% Obama, 58% McCain

This district hasn’t changed much, absorbing some of the more conservative parts of NC-01 and ceding a bit of ground where the African American population has risen at a disproportionate rate. The only major change is that it has been extended along the Atlantic coast, absorbing some of the southern suburbs of Wilmington. Republican Rep. Walter B. Jones of Farmville, a town in western Pitt County, would easily win another term here.

NC-04 (safe Democratic)

42% white, 44% black, 9% Latino

73% Obama, 26% McCain

If you thought NC-02 was ugly, this is even worse. It effectively combines the African American precincts of Raleigh, Durham, Cary, Garner, Sanford, and Fayetteville, linking them via spindly threads of rural countryside and wilderness. Rep. David Price, the incumbent Democrat here, has been drawn out of this district. Price lives in Chapel Hill, home to the University of North Carolina. Chapel Hill, for what it’s worth, is just too white to include in this district without the risk of upsetting its VRA status depending on demographic rates. Democrats should romp in this district regardless.

NC-05 (likely Republican)

69% white, 25% black

45% Obama, 55% McCain

Northern North Carolina is mostly white and mostly Republican, but the inclusion of Vance County and parts of Nash County, as well as a cut of ultra-liberal Chapel Hill, in this district make it a bit less absurdly partisan than the current iteration. Republican Rep. Virginia Foxx, who lives in Avery County, would have to move in order to run for reelection here, but I’m inclined to think somebody a bit younger and less emblematic of conservative obstinacy would make a better candidate for the GOP here anyway. A Democrat could certainly win this seat in a good year, and indeed, it is possible Price has been drawn into this district (I’m not exactly sure where he claims his address). But the quandary of having part of a liberal college town in an otherwise Republican district is that students might not get out the vote for a Blue Dog, and socially conservative ancestral Democrats might not vote for a progressive.

NC-06 (safe Republican)

81% white, 11% black

43% Obama, 56% McCain

This district effectively drowns what is left of liberal Chapel Hill in the bathtub of rural conservatism. In my first drawing, this district had not changed a lot from the current version represented by Rep. Howard Coble, a long-serving Republican, but the new version crawls evilly into Orange County to keep Chapel Hill out of a swingier district. If Coble wants another term, he should have no problem getting one in this district, even if he has to run against Price, who is probably drawn in here. As with NC-05, though, Democrats will have a wicked balancing act to perform, as well as a lot of electoral ground to make up, if they want to flip this seat.

NC-07 (safe Republican)

71% white, 21% black

42% Obama, 57% McCain

This redrawing would represent a fait accompli for the Republicans, drawing out Rep. Mike McIntyre, the Lumberton-based Democratic incumbent. It’s another district with a face only a mother could love, but the loss of Wilmington’s majority-black northern precincts and the excision of outlying Democratic-friendly areas like Robeson County take it from being a swing district to being a fairly solid Republican district, especially with McIntyre out of the picture. It trades a few rural precincts with NC-03 with no real effect otherwise, simply a matter of working out the numbers.

NC-08 (safe Democratic)

47% white, 33% black, 12% Native

58% Obama, 41% McCain

If you were curious as to where McIntyre went, he was drawn into this district currently held by Rep. Larry Kissell, a fellow Democrat. This new drawing sucks in pieces of Wilmington, Fayetteville, and Aberdeen in exchange for Cabarrus and Stanly counties. It is narrowly a minority-majority coalition district, with a not-insignificant Native American population, and it should be solid for Democrats regardless of whether Kissell, McIntyre, or someone else is the party’s 2012 nominee.

NC-09 (likely Republican)

81% white, 11% black

44% Obama, 55% McCain

Despite sacrificing its southern and western portions in favor of extending further north into Cabarrus County, this district serves the same function as it did before: dividing Charlotte along racial lines. Republican Rep. Sue Myrick, who I believe would still reside in this redrawn district, isn’t going to have any trouble getting reelected here. In the event Myrick has been drawn out, any other Republican might have a bit tougher haul but would probably still be favored.

NC-10 (safe Republican)

85% white, 8% black

41% Obama, 57% McCain

Okay kid, here’s where things get racially homogeneous. This redrawn district would be overwhelmingly Republican if it didn’t stick a long spur into liberal Asheville, intentionally diluting that population center’s influence. Instead it’s just very Republican, and it’s hard to see a Democrat picking it up. Rep. Patrick McHenry of Cherryville, a Republican, has been drawn out of this district with its move north from Gaston County.

NC-11 (safe Republican)

87% white, 7% black

40% Obama, 59% McCain

This is that pesky district where Shuler, a Blue Dog, seems to be hanging on just fine despite determined attempts to dislodge him. This redrawing is effectively just the most conservative parts of western North Carolina, with its sole purpose being to get rid of Shuler. Republicans would benefit from a shrunk-down district excising Democratic-friendly Asheville, and indeed, Shuler winning a district now-President Barack Obama lost by 19 points in 2008 seems like a stretch even for him.

NC-12 (safe Democratic)

38% white, 49% black, 8% Latino

75% Obama, 24% McCain

This is another slimmed-down version of an existing monstrosity. Democratic Rep. Melvin Watt’s district is famous for being one of the most egregious examples of gerrymandering in the county. Fortunately, this Wyoming Rule map puts it to shame, with multiple examples of even grosser gerrymandered districts. The smaller version of this district omits the spur into Winston-Salem and includes only southern and eastern Greensboro. Despite my personal distaste for Watt, he would have no excuse not to win reelection here.

NC-13 (swing)

79% white, 15% black

47% Obama, 52% McCain

This district simply ended up in a completely different place than it currently occupies. The current NC-13 includes most of Wake County and a great deal of northern North Carolina, using Raleigh’s Democratic tilt to offset the conservative tendencies of Rockingham, Caswell, Person, and Granville counties in what amounts to a big fat Democratic gerrymander. Because there is literally no overlap between the current and redrawn versions of this district, Miller has been drawn out and placed in NC-02, as previously mentioned. The new NC-13 would cover a swath of the central part of the state, including the cities of Kannapolis and Concord in Cabarrus County, stretching down to the South Carolina border west of Charlotte (there is actually an outside chance that Myrick, the NC-09 incumbent, may find herself living here). Because of the inclusion of Cherryville, Gaston County, the long-serving Republican McHenry has certainly been drawn into this district. It’s a swing district, and a savvy Blue Dog Democrat could win it, but I think it tilts Republican, especially if McHenry or Myrick run.

NC-14 (likely Republican)

90% white, 6% black

43% Obama, 55% McCain

This new district in North Carolina under the Wyoming Rule is mostly left over from Shuler’s gutted NC-11 and McHenry’s dismembered NC-10, with Foxx drawn in along with parts of the current incarnation of NC-05. It’s not as strongly Republican as it might have been, but most of liberal Asheville is here putting a weight on the scale due to its size. Considering that Shuler might rather move here from NC-11 to run, I would love to see him battle it out with Foxx. The demographics here ultimately would work in Foxx’s favor whether she ran against Shuler or another Democrat.

NC-15 (swing)

72% white, 18% black

48% Obama, 51% McCain

Yes, you’re seeing it right: this district includes the east and west sides, but not the middle third, of Harnett County. For all its gerrymandered-to-hell appearance, this is a swing district, carved up in a hideous way partly to permit the existence of the two VRA districts it borders, partly to keep it competitive enough to make surrounding districts more solidly partisan. Ellmers has been drawn into this district, although I’m not sure it’s conservative enough for her to win. Getting around in this district looks like it would be hell, and the cultural incongruity between Durham and Dunn might pose an issue in an election year.

NC-16 (swing)

74% white, 18% black

47% Obama, 52% McCain

Amazing how a district of leftovers can end up being perhaps the most compact one on the entire map. This all-new district covers most of Winston-Salem, along with rural Yadkin County and large swaths of Stokes, Surry, and Wilkes counties. I don’t believe any member of the House of Representatives lives within these district boundaries, but either a conservative Democrat or a cautious Republican could win here. It’s a swing district, but it tilts Republican.

NC-17 (swing)

78% white, 16% black

47% Obama, 52% McCain

The last new district is materially similar to the previous one in some ways. Demographically, it comes out looking much the same. It includes most of Guilford and Rockingham counties, serving to sponge up Democratic-friendly areas that could change NC-05 or NC-06 from being Republican districts to being swing districts, as this Republican-tilting district is. I don’t think a current House member lives here, meaning we would probably see a new face in Congress representing it in 2013. I think that face is likely to be Republican.

Comments, either on the map or on the Wyoming Rule?

New Mexicyoming: Four Wyoming-Size Districts in the Land of Enchantment

Redistricting according to the highly hypothetical Wyoming Rule is the latest SSP trend. In brief, the rule throws out the inequality currently on display in the House, where the at-large district of Wyoming is dramatically overrepresented in terms of population compared to the average district in, say, Los Angeles.

I took on the task of drawing a Wyoming Rule map for New Mexico. Under the rule, the Land of Enchantment would add one congressional district. Using 2008 population estimates, I managed to draw a 3-1 map with no less than three VRA minority-majority coalition districts.

NM-01 (safe Democratic)

43% white, 4% Native, 47% Latino

64% Obama, 35% McCain

This district covers most of the Albuquerque area, excluding the whiter, more Republican suburbs and exurbs in eastern Bernadillo County and creeping up just barely into Sandoval County. It’s quite close to being an outright Latino-majority district; growth rates suggest it will be by the end of the decade, if I remember right. No reason studly Rep. Martin Heinrich couldn’t win here, as it’s a heavily Democratic district.

NM-02 (likely Democratic)

33% white, 17% Native, 48% Latino

58% Obama, 40% McCain

In Maryland, this would be a safe Democratic seat, but inconsistent voter turnout among Native Americans means that for New Mexico, this is just a district in which Democrats start off with a pretty decent advantage. Indeed, virtually all of this district will be represented by Republican Rep.-elect Steve Pearce in the 112th Congress, although western New Mexico tends to be more liberal than eastern New Mexico, which balances out the current NM-02 for a Republican-tilting swing district. Rep. Harry Teague could certainly win here, but as this district is likely to be outright majority-Latino by redistricting, the base might prefer a Latino representative.

NM-03 (safe Democratic)

43% white, 13% Native, 41% Latino

63% Obama, 36% McCain

This district in northern New Mexico is basically just a smaller version of Rep. Ben Ray Luján’s current district, ceding McKinley County and much of Sandoval County to NM-02 and ceding Quay, Curry, and Roosevelt counties to NM-04. It is strongly Democratic and actually plurality-white, although minority groups still make up the majority of the population. Luján would cruise here, much as he does in the current version of his district.

NM-04 (safe Republican)

60% white, 2% Native, 33% Latino

40% Obama, 58% McCain

The whitest, most conservative district in the Wyoming Rule drawing of New Mexico covers the state’s southeastern quadrant, with tendrils reaching into the Republican-tending eastern part of the greater Albuquerque area, including eastern Bernadillo County. Rep.-elect Pearce would be fine here.

Thoughts, either on the Wyoming Rule or on the New Mexico electoral map?

Maryoming: A Plausible Redistricting for an Unlikely Eventuality

I like the idea of the Wyoming Rule. Take the population of the smallest state in the Union, divide the total U.S. population by it, and allocate however many seats that comes out to be according to each state’s population. Under the Wyoming Rule, Maryland would probably end up with 11 congressional districts at the next redistricting; assuming no population growth or decline, that puts each district’s population at roughly 481,500, although for this map, I’ve given each district a margin of about ±1,500, give or take a bit.

Spoiler alert: two of these districts are safe Republican, eight are safe Democratic, and one is a super-exciting swing district!

MD-01 (safe Republican)

85% white, 11% black

59% McCain, 39% Obama

This district covers most of the Eastern Shore, as well as rural, conservative northern Harford and Baltimore counties. It effectively soaks up big areas that Democrats don’t want. Rep.-elect Andy Harris could easily hold down this seat.

MD-02 (swing, lean Democrat)

75% white, 19% black

54% Obama, 44% McCain

This district covers the eastern Baltimore suburbs and exurbs, taking in portions of southern Harford and Baltimore counties, as well as some of the eastern reaches of Baltimore City and Anne Arundel County. It snakes awkwardly down the shoreline to capture the Democratic stronghold of Annapolis. If Rep. Frank Kratovil moved across the Bay, he could probably win this district without too much trouble.

MD-03 (safe Democratic)

40% white, 54% black

81% Obama, 17% McCain

This is a VRA district that goes straight down the middle of Baltimore City and includes some northern suburbs in Baltimore County. I’m not exactly sure where Rep. Elijah Cummings’s house is, but he could definitely win here. That would probably set up a primary showdown with Rep. John Sarbanes, though, unless he moved elsewhere.

MD-04 (safe Democratic)

46% white, 48% black

71% Obama, 28% McCain

It turns out that under the Wyoming Rule, the Baltimore area actually needs two VRA districts. This is actually a coalition district, technically, with black residents making up only 48% of the district’s population by 2000 numbers. It includes western Baltimore City while soaking up some of the western and northern Baltimore County suburbs and exurbs, none of which are numerous enough to really threaten Democrats here. As with MD-03, Rep. Cummings could win here easily. Rep. Dutch Ruppersberg, who I believe lives here, could win as well.

MD-05 (safe Democratic)

69% white, 12% black

61% Obama, 37% McCain

Incorporating some of central Maryland’s swingier rural areas in Howard, Montgomery, and Frederick counties with a few Democratic bastions like the cities of Frederick and Gaithersburg, this is a fairly solid Democratic district that is almost entirely within the D.C. media market. Jennifer Dougherty, who ran against Rep. Roscoe Bartlett in 2008 and used to be Frederick’s mayor, would probably win in a walk here.

MD-06 (safe Republican)

93% white, 4% black

62% McCain, 36% Obama

This district soaks up the Panhandle, Carroll County, and most of Frederick County. It’s a community of interest, and keeping it that way avoids some unpleasantness for surrounding Democrats. If Rep. Bartlett ran for reelection here, he’d be a lock to win.

MD-07 (safe Democratic)

70% white, 20% black

59% Obama, 39% McCain

This district includes eastern Howard County and western Anne Arundel County, as well as collecting some southern Baltimore County suburbs. It went for President Obama by 20 points, so I’m calling it safe, unless anybody objects. If Rep. Sarbanes moved down here from Towson, considering this MD-07 includes most of his current district anyway, I think he could win easily.

MD-08 (safe Democratic)

63% white, 28% black

63% Obama, 36% McCain

By balancing out Republican-leaning Anne Arundel County with parts of northern and eastern Prince George’s County, one of the country’s bluest, this district should be a walk for a competent Democrat. I don’t think any of Maryland’s current representatives are likely to run here, though.

MD-09 (safe Democratic)

64% white, 11% black

72% Obama, 27% McCain

This Montgomery County district is basically just a smaller version of Rep. Chris Van Hollen’s current district, MD-08. It eschews the tendril into Prince George’s County and cedes some space to surrounding districts, but it remains strongly Democratic. Van Hollen could win here without trouble, and I think he already lives within its boundaries.

MD-10 (safe Democratic)

17% white, 64% black

93% Obama, 7% McCain

This suburban district would be one of the most strongly Democratic districts in the country even under the Wyoming Rule, including most of the majority-black and -Latino parcels of land in Prince George’s and Montgomery counties. Rep. Donna Edwards would be a natural fit for this district.

MD-11 (safe Democratic)

60% white, 34% black

65% Obama, 34% McCain

This district of remainders stretches across the Chesapeake Bay to encompass Somerset and Worcester counties on the Eastern Shore as well as Charles, St. Mary’s, and Calvert counties in southern Maryland. It also stretches up into Prince George’s County to solidify its Democratic orientation. Rep. Steny Hoyer, soon to be the House minority whip, lives here and could win here without trouble.

Your thoughts, either on the map or the Wyoming Rule (or both)?

Dodging a Bullet: Oregon 3-2

As we all know, Republicans very, very narrowly fell short of taking the governorship of Oregon. Oregonians instead opted to send former Gov. John Kitzhaber back to the governor’s mansion over Republican Chris Dudley, best known for playing basketball.

Republicans also came extremely close to capturing slim majorities in both the State House and the State Senate. The State House is now evenly split, while it appears Democrats will hang onto a majority of one or two in the Senate.

If Republicans had garnered just another point in the statewide popular vote, it seems likely they would have flipped both houses of the Oregon state legislature and installed Chris Dudley as governor, giving them a trifecta in the Beaver State. As a left-leaning independent and an Oregonian expat, let me just take a moment to editorialize by way of gagging.

With redistricting coming up, Republicans could have taken control and gerrymandered Oregon, provided they could agree on a map (otherwise, Secy. Kate Brown, Oregon’s Democratic secretary of state, would have been constitutionally empowered to draw one up – which, as it is, puts considerable pressure on Republicans to compromise with Democrats). Here’s one they might have liked.

I’ve done what any self-respecting, all-powerful Republican trifecta would do, and I’ve just handed Democrats the Willamette River Valley while giving Republicans two seats in the rest of the state.

There should be little controversy about the Portland metropolitan area. The new OR-01 I’ve drawn would have been, if Republicans had won and drew this map, one of the most Democratic districts in the entire country; Rep. Blumenauer’s Republican opponent, Delia Lopez, picked up three percent of the vote in the portion of Multnomah County in Blumenauer’s district, currently OR-03. Note: I spent so much time playing around with the district lines that some of the district numbers are mixed up.

OR-01 here includes some of the most liberal parts of Clackamas County, including Milwaukee. Rep. Blumenauer would thrive here, obviously.

As for OR-05, it includes most of Portland’s western suburbs, as well as some of the most swingy parts of Clackamas County. It’d probably be a Democratic district, but an Oregonian answer to Reps. Reichert or Tiberi might be able to flip it in a good year.

I originally had OR-05 reaching up into Columbia County to encompass St. Helens and Scappoose, but I decided against it. They were instead awarded to OR-04, which thus holds the entire Oregon Coast. OR-04 also reaches inland to western Washington, Yamhill, and Polk counties. It’s almost entirely rural, and despite Astoria and a few other lean Democratic cities in northwestern Oregon, it would be safely Republican.

The reason OR-04 would be safely Republican is simple: Eugene has been gerrymandered into a district with the lean Democratic cities of the Willamette River Valley, including the capital of Salem and its suburbs. Conservative Albany is left to OR-04. Because of the way OR-03 is drawn, it would be a pretty safe Democratic district, especially considering the surging Latino population in and around Salem.

OR-02, currently Rep. Walden’s district, remains safely Republican, soaking up the swingy population centers of Bend, Medford, Ashland, and Hood River with the entirety of hard-right eastern Oregon, as well as most of fairly conservative central and southern Oregon.

In plain speech, OR-02 and OR-04 would be safely Republican, while OR-01, OR-03, and OR-05 would be Democratic. Definitely a good thing Republicans didn’t manage to take over Salem this year.

BONUS: Just for kicks, here’s a picture of the way I originally gerrymandered OR-03:

I decided Bend would be fine in OR-02 and it would be best to keep the district more compact and inclusive of the Salem suburbs, not just the I-5 corridor down the Willamette River Valley. The way this district is drawn would force OR-03 to spill into Clackamas County. While it’s funny (and hideous), I decided it wasn’t practical.