Previewing Senate Elections: New York

This is the first part of a series of posts analyzing competitive Senate elections in blue states. The first part, which analyzes Illinois can be found here.

Out of the three heavily Democratic states being analyzed, Republicans probably have the least chance of winning New York. A serious Republican challenger to Senator Kristen Gillibrand has yet to emerge. Moreover, Ms. Gillibrand has proven an adept politician willing to campaign hard.

Nevertheless, in a bad national environment with low name recognition, victory for Democrats is not assured. Under the right circumstances (perhaps a Gillibrand scandal), Republicans may be able to pull off a shocker.

Previewing Senate Elections: New York

Like Illinois, New York can be divided into three sections: upstate, the suburbs downstate, and New York City. A New York Republican must win upstate and the suburbs by substantial margins – and perform extremely well in New York City.

More below.

Upstate New York

Like Illinois, the first step on the Republican road to victory lies with here. A Republican candidate must win strong margins upstate; a strong performance here is embedded with a double-digit loss.

Unfortunately for Republicans, upstate New York and downstate Illinois are not the same. Unlike Illinois, upstate New York is home to four major cities: Buffalo, Rochester, Albany, and Syracuse. In a normal election – i.e. a double-digit Democratic victory – these cities will vote Democratic, some by substantial margins.

There are several more wrinkles for a Republican candidate. Like much of the rural northeast, upstate New York has been trending Democratic. Despite the conservative national mood, Democrats last year won two special elections upstate. Moreover, Senator Kristen Gillibrand has roots there; she represented an upstate congressional district before becoming Senator.

Nevertheless, the majority of this region still votes loyally Republican; a competitive candidate can rely upon it to help counter New York City. In a close election a Republican ought to win almost every county in upstate New York.


The Suburbs Downstate

This region can be defined as the suburbs surrounding New York City: Long Island and the communities around Yonkers. A Republican’s task here is similar to that upstate: win, and win big.

Historically this was not too difficult; New York City’s suburbs regularly voted Republican, although never by enough to overcome Democratic margins in the city itself. Like many other suburbs, this changed with President Bill Clinton: since his time they have generally voted Democratic.

Today things are changing once more. Since the events of 9/11, downstate’s suburbs (especially Long Island) have been trending Republican. This was one of the few regions Senator John McCain did well in (as opposed to President Barack Obama doing poorly in); his national security credentials appealed to a number of downstate suburban voters.

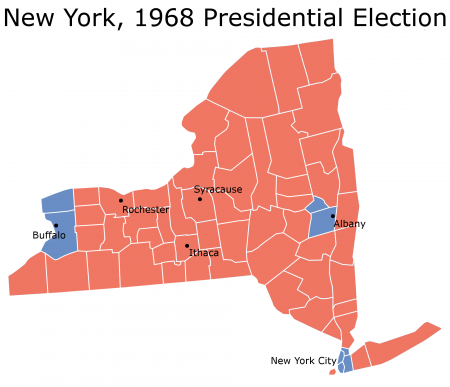
A strong Republican must capitalize on this trend, changing New York’s suburbs back into Republican territory. This strength, added to margins from upstate, makes for a 5% Republican loss. Republican candidates have achieved this combination many times in the state’s electoral history. Take 1968, when President Richard Nixon lost New York by 5.46%:

Previewing Senate Elections: New York

The problem is the last 5%, to  which a Republican must look to New York City for.


New York City

To make up the last 5%, a Republican candidate must do well in New York City, that great metropolis of the United States. The Big Apple composes an astounding 43% of the state’s population, the largest proportion in the country. It also votes extremely Democratic; in 2008 four out of five voters turned the lever for President Barack Obama.

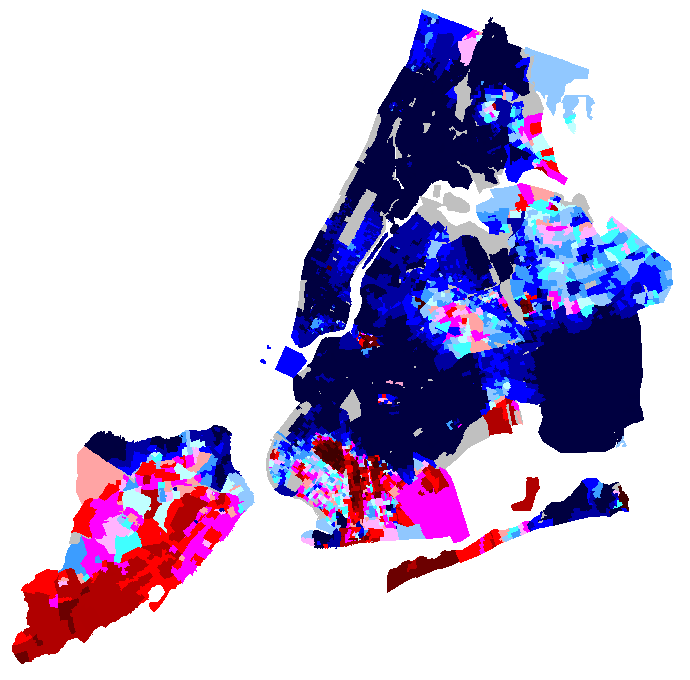
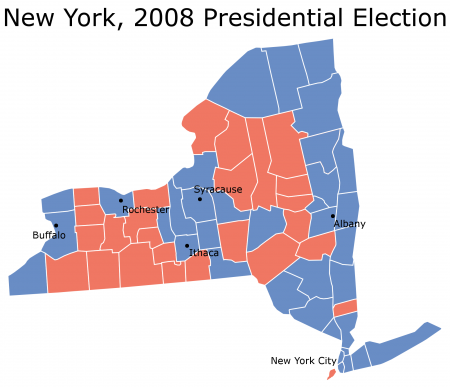
The Republican facing Ms. Gillibrand will have to substantially improve upon this number. This is not as hard as it first sounds. New York City, after all, has had a non-Democratic mayor for more than a decade. Low minority turn-out looks likely to bedevil Democrats during this off-year election. Moreover, Republicans retain a base in Staten Island and southern Brooklyn. Even in 2008 these places voted Republican:

Previewing Senate Elections: New York

(Note: Image courtesy of a very old post from jeffmd.)

Finally, some regional complexities come into play. Although almost all of New York City voted for Mr. Obama, some parts are more less loyally Democratic than others (as was the case in Massachusetts). White liberals and impoverished minorities in Manhattan and the Bronx almost never vote Republican; suburbanites in Brooklyn and Queens, on the other hand, are more perceptible to Republican appeals. Winning Republicans generally tie or win the Queens borough and hold Democrats below 60% in the Kings borough.


Conclusions

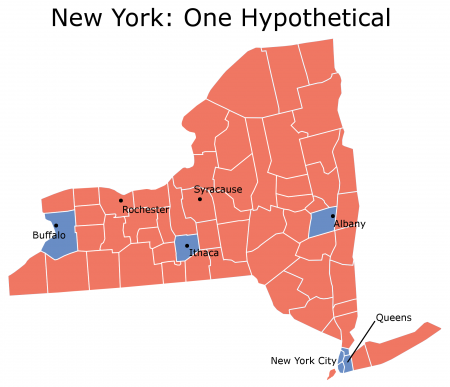
If New York is close next November, it will probably look something like this:

Previewing Senate Elections: New York

This map can indicate anything from a 5% Democratic victory to a 5% Republican victory, depending on turn-out. Perhaps the best barometer will be the Queens borough in New York City. Look to it next November – it might literally determine the fate of the Democratic Senate majority.
Analyzing Obama’s Weak Spots – Part 3: Appalachia, South Central and the 2010 Midterms

This is the final part of three posts analyzing the congressional districts President Barack Obama underperformed in. It will focus on the movement in Appalachia and the South Central United States. The previous parts can be found starting here.


The 2010 Midterms

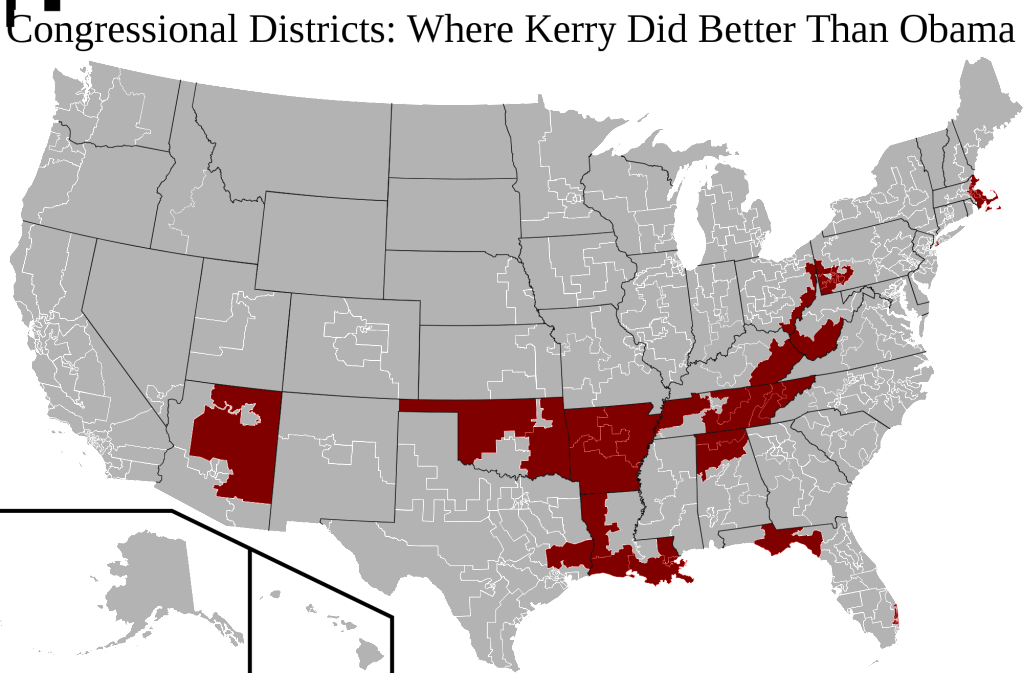
Let’s take one last look at those districts in which Mr. Obama did worse than Senator John Kerry:

Analyzing Obama's Weak Spots

One sees again, as clear as ever, the diagonal pattern of Republican movement in South Central America and the Appalachians.

These districts differ from the northeastern and Florida-based regions examined in the previous post. Unlike those congressional districts, the districts in South Central and Appalachia vote strongly Republican.

More below.

Many of them were never much loyal to the Democrats in the first place; those that did vote Democratic generally stopped doing so after President Bill Clinton left the ticket.

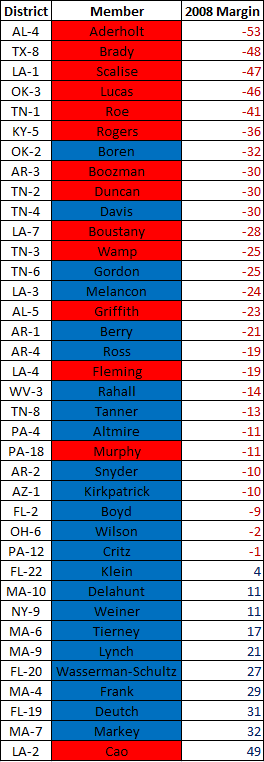
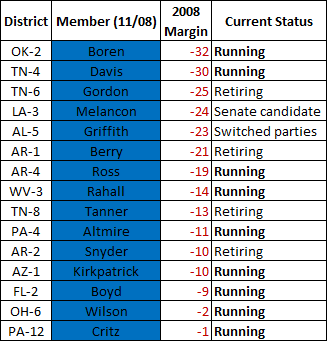
Nevertheless, a number of these South Central and Appalachian districts are still represented by Democratic congressmen. This is readily apparent if one looks at a list of congressional districts in which Mr. Obama underperformed Mr. Kerry:

South Central and the 2010 Midterms

There are a surprisingly high number of Democrats on this list.  As one might expect, the Democratic-voting districts all elect Democrats (except, ironically, for the most Democratic one). Yet more than half of the Republican-voting districts on the list also are represented by Democrats.

That is actually an amazing statistic. These are places in Appalachia and South Central which are already voting Republican, which are fast becoming even more Republican, and which are electing Democratic congressmen.

For Democrats, congressional districts like these constitute ticking time bombs. They will be the first to fall in a Republican wave. There is literally no way the party can continue holding the majority of seats in Arkansas, Tennessee, and West Virginia.

And 2010 looks like a Republican wave year. Democratic-controlled districts in Appalachia and South Central are in deep trouble already:

South Central and the 2010 Midterms

In congressional districts that vote Republican and are becoming Republican, only half the Democratic incumbents are running again. The open seats will likely elect Republican representatives this fall, even in the best forseeable Democratic environment.

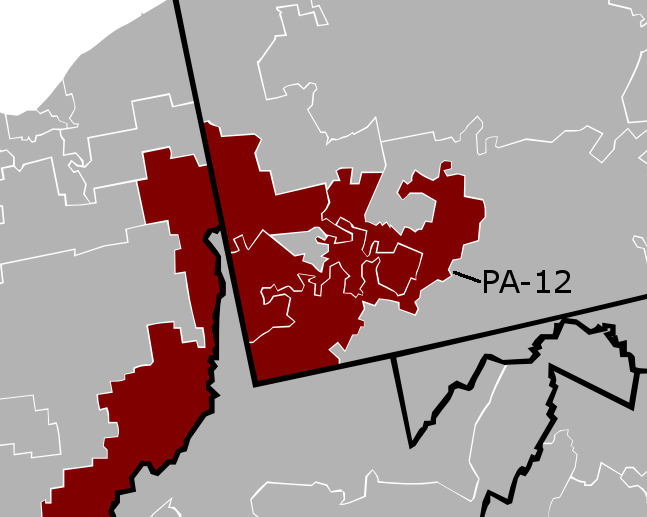
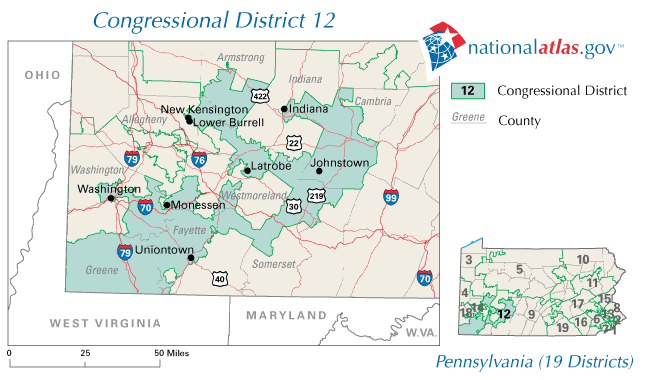
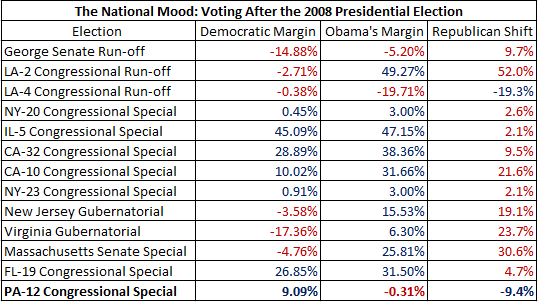
There is good news, however, judging from the PA-12 election results. On May 18th Pennsylvania held a special election for a new representative of the 12th congressional district, after incumbent John Murtha’s death:

South Central and the 2010 Midterms

Like many Democratic representatives in South Central and Appalachia, Mr. Murtha had constituted a relic of an earlier time – when southwest Pennsylvania voted Democratic. His continued re-elections were due to his personal popularity and the power of incumbency, even as his district moved more and more Republican.

It was a minor miracle that Democratic candidate Mark Critz won. Until then, no Democratic candidate had ever done better than Mr. Obama since his election. Mr. Critz did just that, given that the president lost PA-12 (the only seat in the nation to support Kerry and the McCain). In a district with double-digit disapproval ratings of Mr. Obama, this constituted an arduous task.

It is the same task that awaits more than a dozen Democrats in Appalachia and South Central America come November 2010.

Best in Show: The Top 10 Places For Horse Race Analysis On The Web (and 5 sites you can ignore)

I thought this might be a fun little distraction from the normal give and take on poll results and political shenanigans this site usually deals with. All of us on SSP are political junkies by definition, and I decided it might be a fun exercise to list my favorite sites for Horse Race analysis.

A couple of points: When I say Horse Race, I am not taking into account policy analysis, or anything else that is not related to elections and campaigns. I care only about how well the site in question covers the day-in and day-out of candidates, poll numbers and campaigns in general. I don’t care about bias, as long as that bias doesn’t interfere to much with the actual analysis. So, keep this in mind when you look at my top 10. I base this ranking on three criteria, which I call HRR or HR squared, if you prefer:

Honesty If the site has a bias, is it still up front with its partisans when a polling result is bad? Does it try to hide or downplay situations which might hurt the candidates the hardcore readers of the site would tend to support?

Reliability Is the site reliable in terms of what it tells you? Or, through carelessness or bias, does it not give you the whole picture when it comes to a specific election?  

Realism Is the site realistic in terms of what a specific polling or election result means or will mean, or when they look at the state of the race in general? Or does it try to spin the result to comfort readers of the site?

Obviously, my number one site would be Swing State, but since I’m writing this diary on the site it seemed prudent to leave it out of consideration. But I truly think it’s the best, and it’s the only one I post on.

With that out of the way, let’s get to the rankings:

The 10 Best Horse Race Sites:

1). Five-Thirty Eight (Nate Silver). Nate has been a game changer since he started his own blog a couple of years ago. Consistently the best analysis on the web, backed by the zeal of a true statistician. His fellow commentators are pretty good as well, although I occasionally have qualms about Tom Schaller (who I think sometime phones it in). But Silver himself is the real attraction here, and in a class by himself.

2). Post Politics (Chris Cillizza) The Post has some halfway decent commentators in Dan Balz and (with some major qualifications) Dana Milbank, but Cillizza is the real attraction here. He’s not always right, but he’s always interesting to read, and more than often right on target in his analysis. Bonus points for fun things like his Friday rankings, which make his commentary go down smoothly. Minus points for his commentators, which used to be very amusing in how off-topic they could get, although things are a bit better lately.  

3). Real Clear Politics A right-of-center compilation blog that usually has something for everybody, and some good original commentary (if occasionally too Rassmussen believing) from Jay Cost and the Real Clear Politics Blog. Probably the most comprehensive site for politics on the web. Bonus points for their daily Best Of the Blogs, which guides you to a lot of stuff you might not otherwise look at.

4). Politico (esp. Ben Smith and Josh Kraushaar) Let the hate posts begin. About a month ago I read someone on SSP post that Politico posts nothing but right wing talking points. Interesting, because just a couple of weeks before, I had read on a conservative blog how Politico was nothing but a left wing hack job. Here’s the truth: Politico is biased toward gossip and conflict and gets lead astray by its sources on both sides of the aisle. But it’s second only to Real Clear Politics in terms of the breadth of its political information, Ben Smith is a terrific commentator, Josh Kraushaar’s 2010 area gives you almost all the information you need on the races that matter this year, and Mike Allen is the first thing the White House reads every day. “Nuff said.

5). The Rothenberg Political Report Rothenberg is probably the best individual political commentator on the web, and although he can be wrong, he’s always pretty insightful. Demerits for most of his stuff being subscriber only, but what he actually posts on his blog for the public is worth reading.

6). National Journal/Charlie Cook Most of National Journal’s best work is subscriber only, as is true of their occasional contributor Charlie Cook. Cook has also been a tad too pessimistic about the Democrats for my tastes this cycle, although that may be changing with PA-12. But Cook’s weekly column is usually worth a read, if only to give you the state of Beltway wisdom in its purest form, and National Journal occasionally lets good things out from behind its firewall for the public to see.

7). Daily Kos (Kos/Steve Singiser) I know, this blog is descended from Kos, so of course it’s going to be on here. But here’s the scoop: while Kos pugnacious progressivism leads him to make some very wrong predictions (e.g. his guarantee that John Corzine was going to win the New Jersey’s governor race), when he’s on, he’s very on and very prescient. He was one of the first to predict Charlie Crist would never get the nomination for Senate on the Republican side, back in the days when the likes of Cillizza were predicting Crist’s money advantage would prevail. Steve Singiser, Kos’ other main political guy, writes well about specific races, but his real strength is his take on the weekly state of the nation poll, which is both spin-free and always worth reading.

8). National Review/Jim Geraghty – The Campaign Spot Geraghty certainly prints his share of right wing talking points (and is the source for some of them) and like Real Clear Politics has a tendency to believe every Rassmussen polll, but if you can look past that he is often very insightful and unpredictable: he doesn’t neccesarily tell his readers what they want to hear. He also is very well connected among Republican professional political types, giving their sometimes brutally honest perspectives on the races. And if you want to see what the worst nightmare could look like for this fall, don’t forget to check out his analysis of 90 Dem held seats and how the Republicans could theoretically win them.

9). Pollster.com The most comprehensive site for polling information. Mark Blumenthal and team rival Nate Silver in their ability to go deep in analysing what the polls actually mean.

10). CQ Politics/Taegan Goddard CQ Politics is a comprehensive, if uninspired site for political news and opinion. The true reason to go there is Taegan Goddard’s Political Wire, a listing of the political happenings of the day with pithy, often snarky and always readable thoughts on what it might all mean.

And the 5 sites you can avoid

Washington Examiner (Michael Barone) This pains me to say it, because Barone is one of the most storied political guys around: the man behind the seminal Almanac of American Politics. Too bad his commentary these days seems to be picked up mostly from RNC talking points when its not just repeating the same thing you can find in half a dozen other places.

Huffington Post The most popular political site, Huff Po has apparently made a decision not to invest much in election coverage, probably because no celebrity wants to write about it.

Red State Okay, so I’m a hypocrite – of course I go to Red State, for two reasons. First to find out who the tea party is backing these days, and secondly to take in Erik Erickson’s unintentionally hilarious writings and rantings. My recent favorite: when he announced that Carly Fiorna had to get out of the race for Cal Senate in favor of wingnut Chuck DeVore, despite reprinting a poll in the same column in which Fiorna was winning and DeVore was a far away third. Priceless. The rest of the commentary on Red State is a toxic stew of angry prose and right wing propaganda and not worth anyone’s time.

Talking Points MemoTPM is one of my favorite sites to go to for Josh Marshall’s always excellent take on the day’s news and the great reporting on various political (mostly Republican) scandals. That said, I find the horse race writing (contained mostly in the TPMDC part of the site) pretty uninspired. I think Josh and his team need to kick it up a notch.

The Atlantic/Marc Ambinder Ambinder is one of the most respected members of the political commentariat. So why does his writing leave me “meh”? Too much of the “on the one hand, on the other,” type of prose. Of the rest of the team, Chris Goode is, well, good, and Josh Green is a rising star but its not a must-read the way it should be, and does not measure up to the great Atlantic bloggers such as Ta-Nehisi Coates.  

Analyzing Obama’s Weak Spots – Part 2: The Northeast

This is the second part of three posts analyzing the congressional districts President Barack Obama underperformed in. It will focus on his relative weakness in the northeast. The third part can be found here.

The Northeast

In my previous post I created a map of congressional districts in which Mr. Obama performed worse than Senator John Kerry:

Analyzing Obama's Weak Spots

In this map the most obvious pattern is a roughly diagonal corridor of Republican-shifting congressional districts, stretching from Oklahoma and Louisiana through the Appalachians. This area has long been seen as a place in which the electorate is moving away from the Democratic Party.

The post then looked at the Northeast, another region in which Mr. Kerry did better than Mr. Obama.

More below.

Unlike Applachia and the Mississippi Delta, the conventional wisdom characterizes the Northeast as a stable Democratic stronghold. Yet, as the map below indicates, six northeastern congressional districts shifted Republican in 2008:

Analyzing Obama's Weak Spots - Part 1

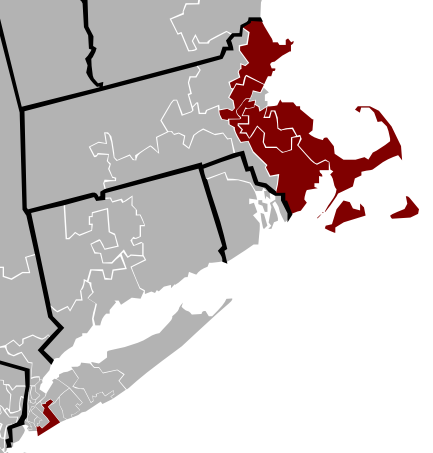
Much of the movement in Massachusetts, of course, occurs due to the loss of Mr. Kerry’s home-state advantage. Yet the districts in Massachusetts (MA-4, MA-6, MA-7, MA-9, and MA-10) also share a number of commonalities. All are quite suburban, quite wealthy, and quite white. Unlike the Appalachian districts above, these places vote substantially Democratic. Neither Mr. McCain nor former President George W. Bush came within single-digits in any of these districts (I suspect 1988 was the last time a Republican presidential candidate did so). Yet this is also Scott Brown territory; the Republican candidate won four of these  districts.

Notice, too, the highlighted New York district (NY-9). Like those in Massachusetts, this district is inhabited mainly by middle-class, Democratic-voting whites. The effect of 9/11, which convinced many New Yorkers to vote Republican, was particularly strong in places like these (in fact, it was probably greater here than anywhere else in the nation). Orthodox  Jews, an increasingly Republican demographic heavily represented in this district, have shifted strongly Republican since then.

Indeed, Long Island as a whole was relatively lukewarm towards Obama. Apart from the fighting ninth, Republicans did respectably in NY-3 and NY-5, holding Obama’s improvement to less than 1% in both districts. Like NY-9, these places are wealthy and suburban.

One wonders whether this change is merely a temporary blip or the start of something more worrisome for Democrats.  The case of Florida is probably not reassuring:

Photobucket

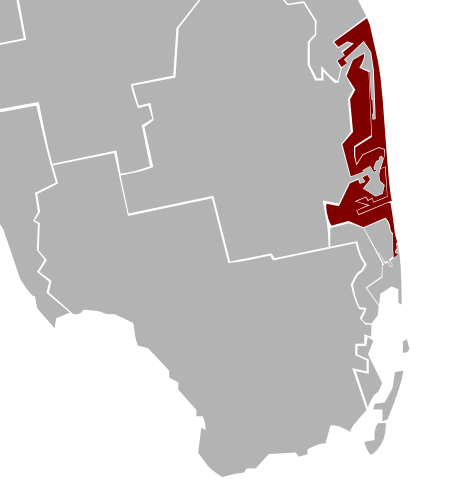
This is Florida’s Gold Coast – a Democratic stronghold – and three districts here (FL-19, FL-20, FL-22) voted more Republican than in 2004. Mr. McCain’s age probably helped him along here; the large population of retirees may have empathized with one of their own.

Ironically, a large number of these retirees probably came from NY-9 or eastern Massachusetts. Like both areas, these districts vote Democratic but have been slowly moving Republican. FL-22 is the exception, having been not very Democratic to begin with. In FL-19 and FL-20, on the other hand, Democratic candidate Al Gore did substantially better than both Obama and Kerry. This was a function of the substantial Jewish population in these districts; Jews strongly supported Joe Lieberman, his Jewish nominee for Vice President.

Fortunately for Democrats, almost none of the Florida or northeast districts represent a 2010 pick-up opportunity for Republicans. Except for FL-22, all have voted Democratic by double-digits for at least three consecutive presidential elections. A few weeks ago a special election in FL-19 resulted in a 27% Democratic margin victory. It is the long-term that is worth concern for Democrats.

In the short term, Democrats must worry about Appalachia and the Mississippi Delta. There Democrats are in deep, deep trouble for 2010. There are a surprising amount of Democratic representatives in these Appalachian seats where Mr. McCain did better than Mr. Bush. Their predicament will be the subject of the next post.

The Meaning of PA-12

By: Inoljt, http://mypolitikal.com/

On Tuesday night Pennsylvania’s 12th congressional district held a special election, pitting Democratic candidate Mark Critz against Republican Tim Burns.

The Meaning of PA-12

Mr. Critz won solidly: a nine percent margin of victory off 53.4% of the vote. Several polls had predicted a very close, photo-finish election; this result contradicted that assumption.

This victory constitutes good – very good – news for Democrats.

More below.

His district, PA-12, was one of the few countrywide that voted more Republican from 2004 to 2008, as the rest of the nation shifted substantially left. Districts such as these are prime targets for Republicans in 2010.

Indeed, PA-12 constituted the only seat in the entire nation that supported Senator John Kerry and then switched its vote to Senator John McCain. For reasons such as this, I wrote a week ago that:

It will be a minor miracle if Democratic candidate Mark Critz wins.  [Almost] no Democratic candidate has ever done better than Mr. Obama since his  election. Mr. Critz will have to do that, given that the president lost  PA-12 (the only seat in the nation to support Kerry and the McCain). In a  district with double-digit disapproval ratings of Mr. Obama, this  constitutes an arduous task.

As it turned out, Mr. Critz did far better than Mr. Obama. Indeed, his victory constitutes the first time a Democratic candidate has improved on the president’s performance since December of 2008, when Democrat Paul Carmouche barely lost LA-4 to Congressman John Fleming.

The Meaning of PA-12

Mr. Critz won by appealing to local issues, emphasizing his independence from the president, and sounding like a fiscally liberal, socially conservative Democrat – the type of Democrat places like PA-12 have traditionally voted for.

This is a strategy that Democrats have long used, to great success, in winning congressional districts that they should not be winning. It is how both Mississippi and Arkansas elect three Democratic versus one Republican congressional representative, and how Texas elected more Democratic than Republican congressman right until 2004. It is partly how the party won such great congressional victories in 2006 and 2008.

There has been much fear amongst Democrats that, in light of Mr. Obama’s presidency, this strategy will no longer work. State Senator Creigh Deeds tried running a rural-style candidacy for Virginia’s governorship; he failed quite miserably.

Mark Critz, on the other hand, succeeded where many – including this individual – thought for sure he would fail. His performance certainly does not mean that Democrats are in for an easy time come November, but it does give the party something to work with in the tough days ahead.

Analyzing Obama’s Weak Spots – Part 1

This is the first part of three posts analyzing the congressional districts President Barack Obama underperformed in.

Congressional Districts

By most accounts, Senator Barack Obama dominated the 2008 presidential  election. He won an electoral landslide, winning Republican-leaning states such as Indiana and North Carolina which his campaign targeted. Compared to 2004, the nation shifted almost ten points more Democratic.

Mr. Obama improved from Senator John Kerry’s performance almost everywhere. More than 90% of congressional districts voted more Democratic than in 2004. Yet this means that at least several dozen congressional districts were more friendly to Mr. Kerry than the Illinois Senator. I have mapped these districts below:

Analyzing Obama's Weak Spots

More below.

(Click here for a much better view of the map).

There is a clear pattern here: Republican-shifting congressional districts are found along a diagonal line stretching from Louisiana and Oklahoma to southeastern Pennsylvania, roughly along the Appalachian mountains. This is not exactly startling news; ever since the primaries, Mr. Obama’s weakness in these regions has been well-noted. The five states that shifted Republican from 2004 – Arkansas, Louisiana, Oklahoma, Tennessee, and West Virginia – are all located here.

The exceptions to this pattern, however, constitute items of considerable interest. Some of these have fairly simple explanations. Arizona’s 1st district voted more Republican, for instance, mainly because Arizona was Senator John McCain’s home state.

Other districts, however, go against commonly-held political wisdom. Take LA-2: a black-majority, inner-city district located in New Orleans (represented, ironically, by Republican congressman Joseph Cao). While LA-2 strongly supported Mr. Obama, black depopulation in the aftermath of Katrina made this support less than that in 2004.

Another example can be found in the northeast:

Analyzing Obama's Weak Spots - Part 1

Republicans do better in five Massachusetts districts and one New York district.

This movement stands in contrast to the narrative of Democratic dominance in the northeast. Most in the beltway have ignored this trend, or dismissed it as simply the loss of Mr. Kerry’s home-state advantage. Whether this is true or not, there is quite a lot of interesting stuff to be said on these districts. The next post will be devoted solely to exploring this pattern.

–Inoljt, http://mypolitikal.com/

Analyzing Britain’s 2010 General Election

By: Inoljt, http://mypolitikal.com/

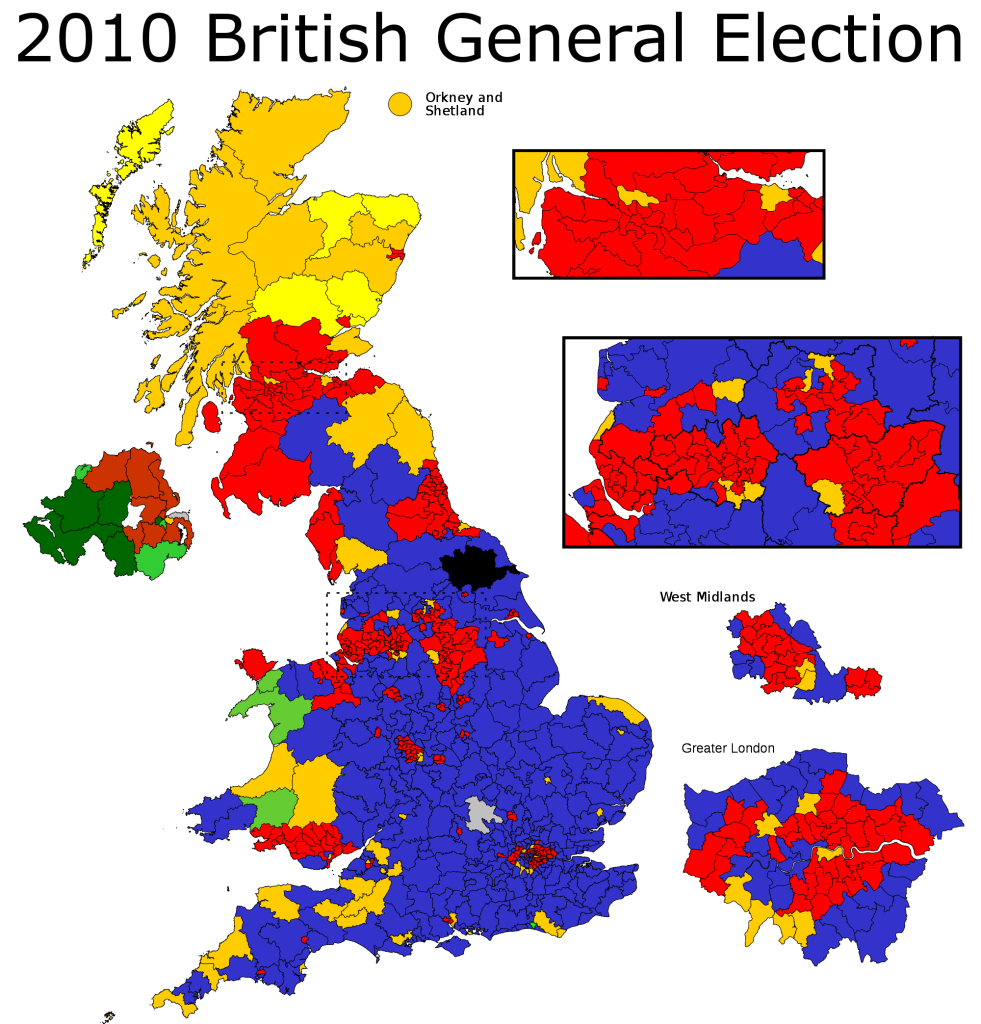
Several days ago Great Britain held a general election to decide the country’s government over the next few years. Facing discontent and a nation thirsty for change, Prime Minister Gordon Brown and the governing Labor Party were soundly defeated. The challenging Conservative Party, led by David Cameroon, gained 97 seats but failed to take a majority in Parliament. Meanwhile the Liberal Democrats, who had surged after a strong performance in the first debate by their leader Nick Clegg, badly underperformed their expectations.

This election offers a useful study of a political system outside of the United States. While more similar to the United States than most countries, Great Britain’s electorate also offers a number of intriguing differences.

A map of the results illustrates several aspects of this system:

Analyzing Britain's 2010 General Election

Note: In Britain and most of the world, the party of the left – Labour – is traditionally represented by the color red (symbolizing the revolution and the so-called blood of the workers). The Conservatives are represented by blue; the Liberal Democrats by yellow.

More below.

At first, it seems that the Tories swept the board. One can’t help but notice the sheer landmass covered by conservative-won seats.

Indeed, the Conservative Party did do quite well; with 36.1% of the vote, they won 306 out of 650 seats. Labour dropped to 29.0% and 258 seats; the Liberal Democrats took 57 seats on 23.0% of the vote.

Yet the map overstates Tory strength. Like the Republican Party of the United States, the Conservative Party does best in rural areas. Winning these seats looks good on a map but doesn’t guarantee winning an election.

The Labour Party, on the other hand, has traditionally dominated Great Britain’s densely populated cities – much like the Democrats in the United States. Much of its base lies among cities such as Sunderland, Birmingham, Manchester, Liverpool, and – of course – London. These places look small on maps but elect quite a lot of MPs.

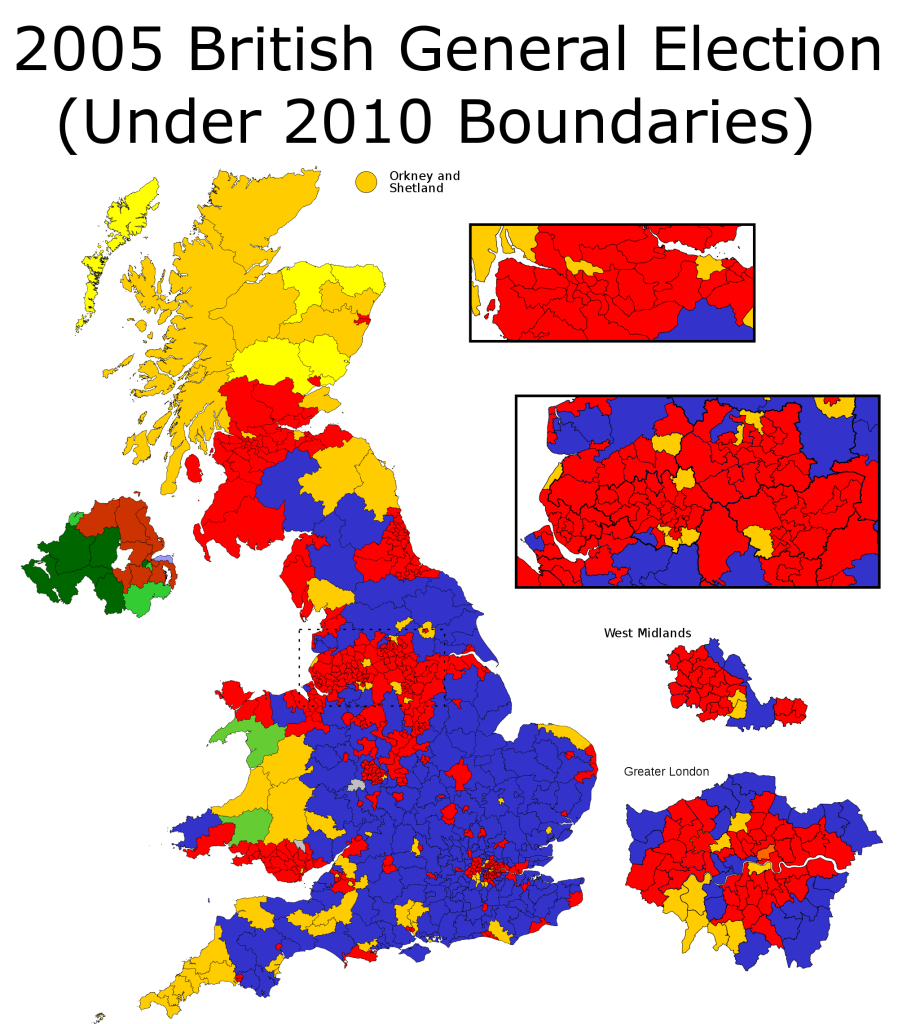
To illustrate this point, here is a map of the 2005 general election under redrawn boundaries for 2010:

Analyzing Britain's 2010 General Election,Analyzing Britain's 2010 General Election

Labour did quite a bit better in 2005, as this map indicates. Yet one might be inclined to guess, by the geographic spread of Conservative seats, that they lost the election. In reality, Prime Minister Tony Blair had led his party to win 35.3% of the vote and 356 seats – a governing majority.

Interestingly, Labour majorities in cities tend to be somewhat thinner than Tory majorities in the countryside. This constitutes the opposite of the situation in the United States – where Democrats often win cities by 75-25 margins and Republicans win rural regions by 60-40  margins.

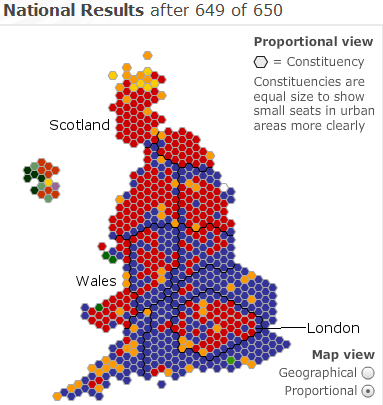
A proportional map, therefore, offers a more accurate visualization:

Analyzing Britain's 2010 General Election,Analyzing Britain's 2010 General Election

One sees another interesting pattern emerge here; the electorate exhibits a coherent North-South divide. In the poorer North Labour does quite well, winning a good majority of seats. In the wealthier South the Conservatives are dominant. With the exception of London, Labour wins almost no seats in southern Great Britain.

There is also a substantial difference between England, Scotland, and Wales. While England votes strongly Conservative, the latter two remain Labour strongholds. In Scotland the Tories actually come in fourth, winning only one seat – a legacy of Prime Minister Margaret Thatcher, who to this day remains extraordinarily unpopular in Scotland. Labour Prime Minister Gordon Brown’s Scottish heritage also probably also helped Labour and hurt the Tories. While the Conservatives do better in Wales, winning eight seats, they still run ten points behind Labour.

It is in South England where the Conservatives do best. Labour runs in third place in the Southwest, Southeast, and East regions. In the Southeast region, for instance, Labour wins a mere 16.2% of the vote; the Tories win 49.9% of it.

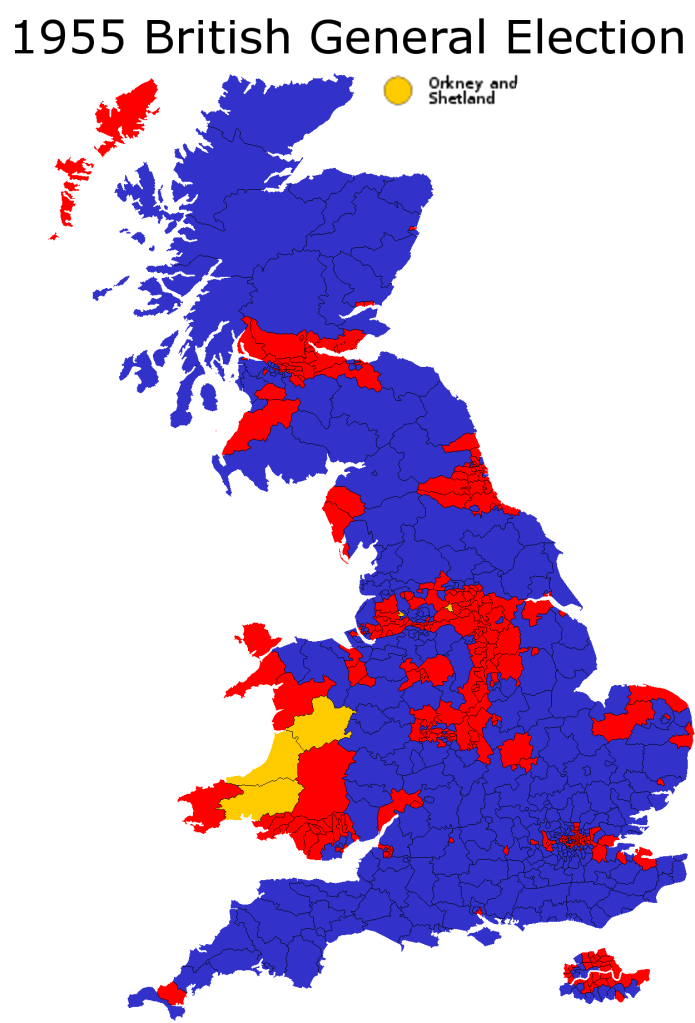
These patterns go back for a long time. Take the 1955 general election:

Analyzing Britain's 2010 General Election

There are some differences, for sure. In 1955 Conservatives had a base in rural Scotland; that has vanished today. The strength of third parties is noticeably less.

Yet what strikes the eye is the degree of similarity between 1955 and 2010. By and large, the bases of the Labour and Conservative Parties remain the same as they were half a century ago. Britain’s regions exhibit a remarkable degree of stability in which party they support – something which can not be said for the United States.

Finally, perhaps the most interesting difference between the United States and the United Kingdom is the strength of third parties in the latter. Both countries follow a first-past-the-post system, which makes the presence of a non-regional third party almost impossible. Yet in Great Britain the Liberal Democrats have somehow managed to gain legitimacy and a respectable amount of seats, through careful targeting. In the aftermath of this election, with a hung parliament, there has even been substantial discussion about changing the electoral system. Meanwhile the two-party system remains iron strong in America. Despite all their similarities, cultural and systemic, the electorates of the United States and the United Kingdom are following sharply divergent paths.

Comparing Barack Obama, John Kerry, and Mike Dukakis

By: Inoljt, http://mypolitikal.com/

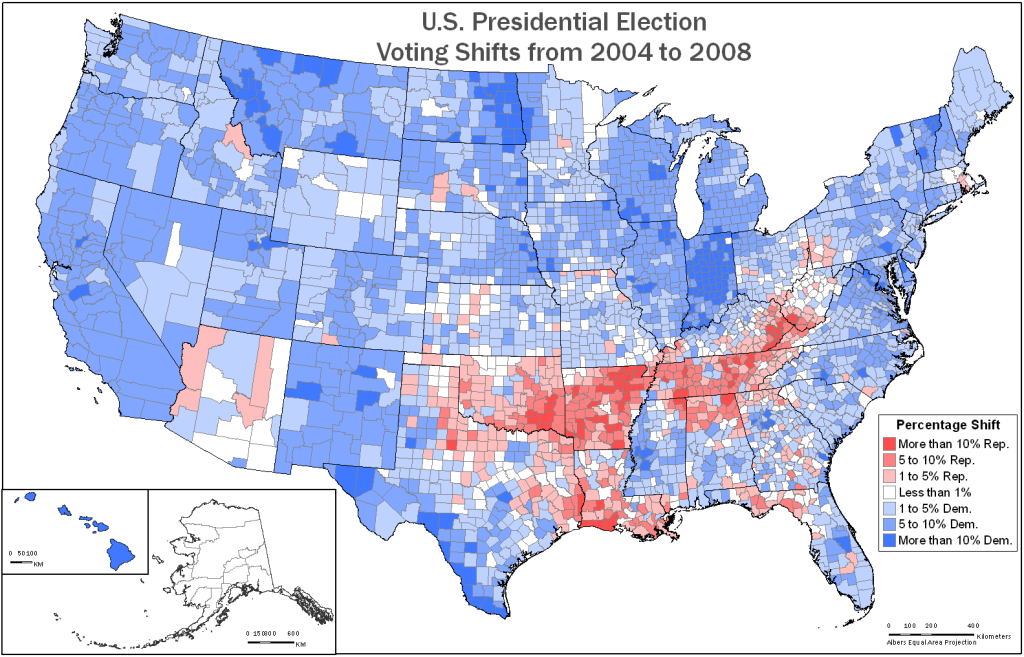
In the aftermath of the 2008 presidential election, the New York Times famously posted a map depicting county-by-county changes from the 2004 election. A different version of this map is below:

Comparing Barack Obama,John Kerry,and Mike Dukakis

What is remarkable about this map is the evenness of the Democratic movement – a 9.72% shift to them from 2004. With the exception of a diagonal patch of Appalachia, President Barack Obama improved throughout the country. It did not matter if a county was located in Utah or California, whether it belonged to a dense city or a thinly populated farm, or whether it was poor or rich – almost every county still voted more Democratic than it did in 2004.

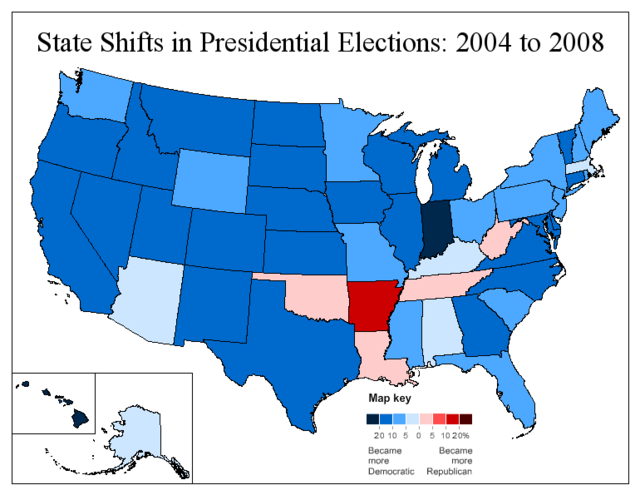
If one moves to a statewide basis, the shift is still fairly uniform.

Comparing Barack Obama,John Kerry,and Mike Dukakis

Compared to the county-by-county map, this map lends itself more easily to analysis.

More maps below.

Once again, Mr. Obama does well everywhere except for Appalachia. His improvement, however, is noticeably less in the traditionally Democratic Northeast. The South is strangely divided between the friendly Atlantic coast and the hostile inland states (with the exception of Texas). There is also a fairly apparent split between east and west: in the latter, Obama’s improvements are almost uniformly strong. The movement east is far more variable.

In addition, the color of several states can be explained through local factors. Clinton-loving Arkansas appears dark red, while Senator John McCain’s home state Arizona stands out amidst its dark blue neighbors. Obama’s home states Hawaii and Illinois also appear dark blue, but Governor Sarah Palin’s Alaska stays more Republican. Massachusetts, home state of Senator John Kerry, does not shift Democratic by much; Indiana, where Obama’s campaign led a massive turn-out effort, shifts massively.

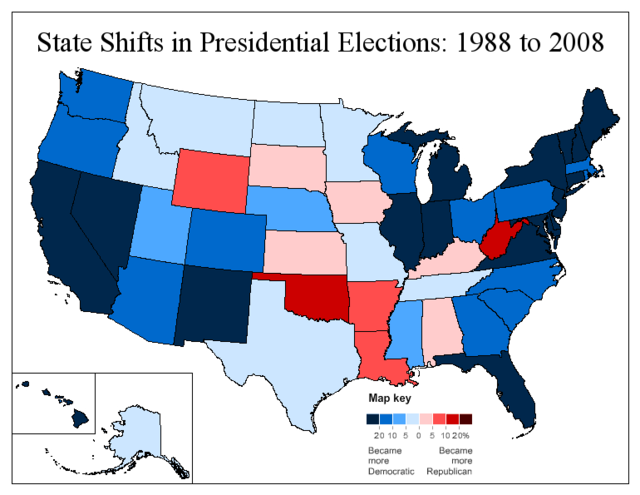
In playing around with these maps I also took a look at the 1988 presidential election. In that election, Democratic candidate Mike Dukakis lost by 7.73% to Vice President George W. Bush. Because Mr. Obama won by 7.26%, the nation voted 14.99% more Democratic than in 1988. Here is Obama’s performance compared to that of Mr. Dukakis:

Comparing Barack Obama,John Kerry,and Mike Dukakis

What this map reveals is far less uniformity. Compared to the previous ones, this is much more a depiction of structural political changes.

Perhaps most obviously, much of South Central America swings against Obama, illustrating the decades-long Republican shift of this region. Dukakis still was able to win a number of white Democratic counties in places like Louisiana and Oklahoma. Today those places have largely abandoned the party.

There are other patterns. A number of Plains states, such as Kansas and the Dakotas, have very little or no movement to Obama. He actually does worse in Iowa. This reflects a relatively strong Dukakis performance in rural America, which was in the midst of an agricultural crisis in 1988.

Most interestingly, one can see the 2008 electoral map in the map; the dark blue states almost all voted Democratic in 2008. Democratic-voting states today tended to shift most to Obama; Republican-voting states today tended to move less. Only two states that voted for Obama haven’t shifted strongly Democratic since 1988: Iowa and Minnesota. Out of all the states John McCain won, on the other hand, only Arizona, Georgia, and South Carolina shifted strongly Democratic – and Democrats came quite close in Georgia. A similar trend has been observed in previous posts.

I am not certain if this pattern suggests electoral polarization: Democrats improve greatly in a number of 1988 Republican-leaning states (such as New Jersey or North Carolina), and Republicans do the opposite in places like West Virginia or Iowa. Instead, it appears to make sense for a candidate to win a state he or she does best in. Thus, this pattern seems to illustrate the electoral coalition Democrats have carved since 1988.

The farther one looks back, it seems, the more a map reveals.

Maps of Virginia Elections

By: Inoljt, http://mypolitikal.com/

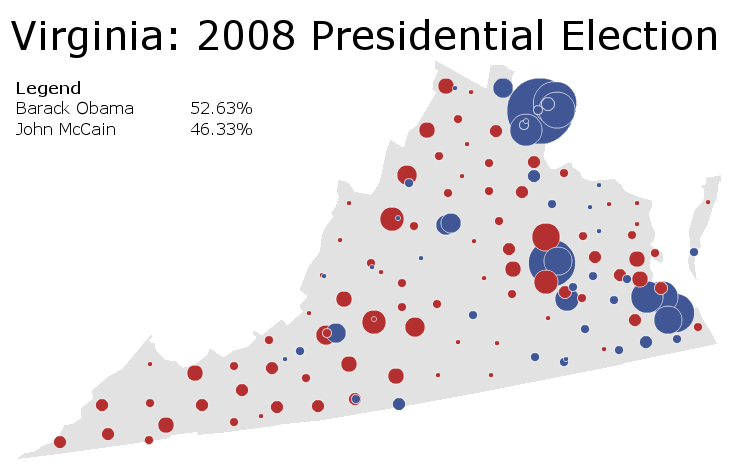
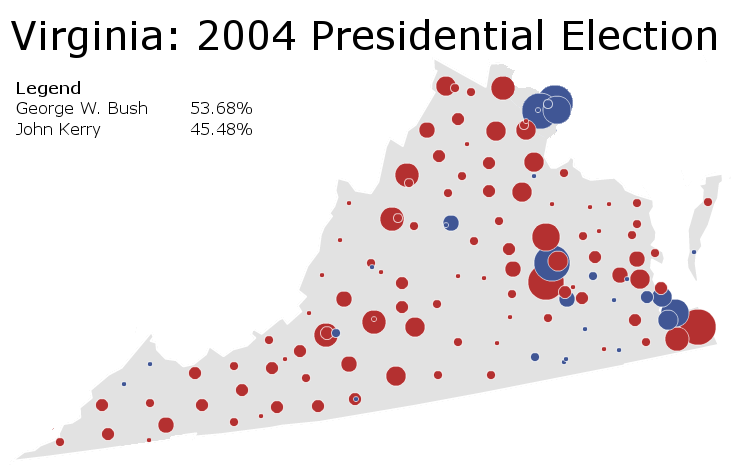
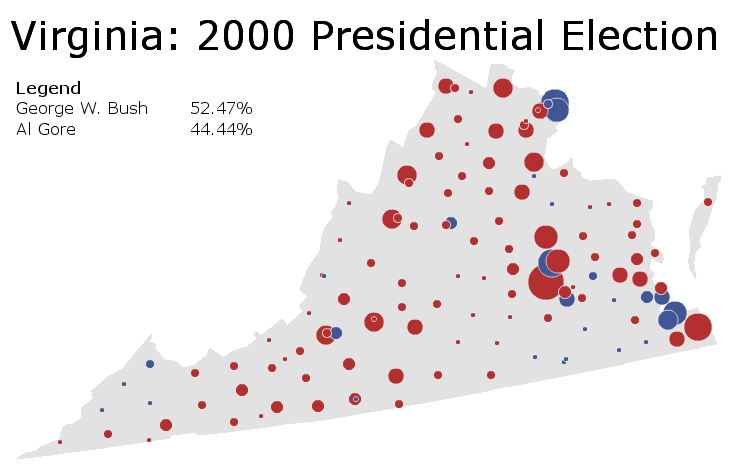
To follow up the series on Virginia, I’ve posted a few recent presidential elections in the state (courtesy of the New York Times). Each map comes with some brief analysis.

Maps of Virginia Elections

Capitalizing on a decade of Democratic movement, Senator Barack Obama becomes the first Democratic presidential candidate to win Virginia since 1964. The Senator performs best in eastern Virginia, especially the fast-growing northern Virginia metropolis. Western Virginia is not as enamored; parts of it even vote more Republican.

More below.

______________________________________________________

Maps of Virginia Elections

Nobody pays attention to Virginia in 2004, and for good reason: incumbent George W. Bush cruises along to a comfortable victory. Amid all the hoopla in Ohio, Republicans fail to notice a disquieting trend. Fairfax County, the populous heart of Northern Virginia, goes blue in the first time for decades.

______________________________________________________

Maps of Virginia Elections

Governor George W. Bush sails to an 8% victory. He artfully weaves together a classic Republican coalition: wealthy suburbs combined with Republican-trending rural Virginia.

______________________________________________________

Maps of Virginia Elections

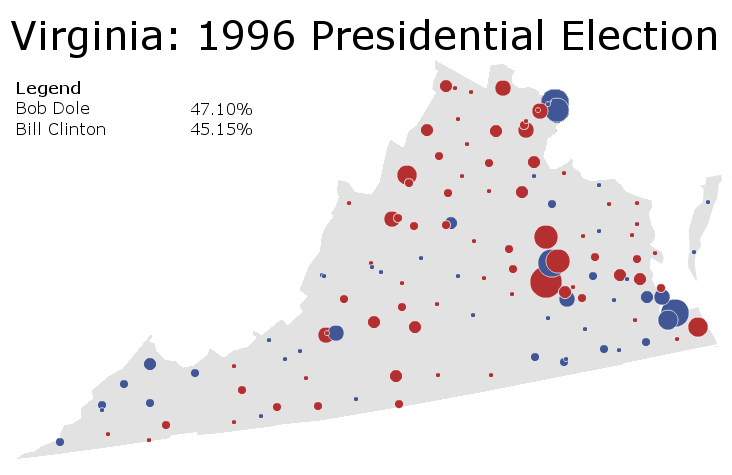
Expecting to win the state, incumbent Bill Clinton is surprised to see Virginia slip from his grasp. He does better than in 1992 – performing well amongst Democratic constituencies in the Appalachian west, the black southeast, and the rich inner-core suburbs of Northern Virginia. But it’s not enough: a strong Republican vote in Richmond’s suburbs denies Mr. Clinton his victory.

______________________________________________________

Maps of Virginia Elections

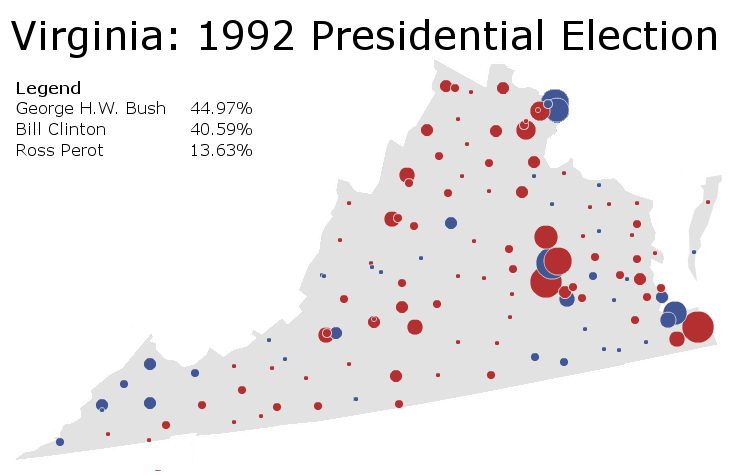
Another presidential election, another Republican victory in Virginia powered by suburbs and small towns. Yet Governor Bill Clinton does relatively well. Compared to the 20.5% beating George H.W. Bush gave to Democratic nominee Mike Dukakis in 1988, a 4.4% loss ain’t nothing.

Assessing the National Mood: A Special Election in Florida and its Implications

By: Inoljt, http://mypolitikal.com/

Believe it or not, Tuesday was election night. Several million Americans voted (or more accurately, did not vote) in mostly local races.

These results provide a helpful snapshot of the national mood. Polls may be inaccurate, or – more commonly – different pollsters may have different pictures of the public mood. Unlike polls, elections have that useful tendency of never being wrong.

Special elections for congressional districts are especially convenient, because there is already a wealth of accumulated data about them. Moreover, because name recognition of both candidates is generally very low, they come as close as one can get to “generic Democrat versus generic Republican.”

Quite happily, a special election occurred on Tuesday in one such congressional district. Specifically, voters in Florida’s 19th congressional district went about replacing retired House Representative Robert Wexler. Here are the results:

Photobucket

More below.

Of course Democrats do not and have – almost – never have enjoyed a majority anything close to that pictured here. These results must be placed in the context of the congressional district’s political lean. If, for instance, FL-19 constituted a Democratic stronghold, this result would be fairly unremarkable. It might even be quite worrisome for Democrats, depending on the district’s Democratic lean (there are some very, very, very Democratic congressional districts out there). On the other hand, if FL-19 usually voted Republican, Democrats would have some reason to celebrate a victory of this magnitude.

As it turns out, FL-19 constitutes a reliable Democratic stronghold. Located in the Miami metropolis, elderly and Jewish voters compose much of the district’s population. The latter accounts for Democratic strength, making Florida’s 19th 15% more Democratic than the nation as a whole.

With this in mind, last night’s election results do not look so impressive for Democrats. In fact, it appears that the party underperformed relative to the district’s lean.

But this is not news at all – in recent months the public mood has shifted quite strongly against the Democratic Party. Almost the entire Beltway agrees that Democrats will lose seats in November’s midterm elections; the only question is the degree of their loss. Republicans are hoping for a repeat 1994-type landslide; Democrats would be happy to retain control of the House.

Due to the unfavorable public mood, Democrats have had a terrible batting average in the most recent special elections; they most famously lost the state of Massachusetts to an unknown Republican State Senator:

Photobucket

In this context, Florida’s result looks positively respectable. The Democratic Party can take heart in the relatively small drop-off since 2008 – especially compared to their previous performances. Given that President Barack Obama won the election by more than 4.65%, it even suggests that Democrats hold a slight lead on the national level.

Indeed, in recent weeks Democratic fortunes have been on the rise. The passage of health care, alongside a slowly but surely improving economy, has led to an ever-so-slight uptick in their polling. Florida’s result substantiates these polls.

Finally, the very nature of FL-19 can lead Democrats to be optimistic. Mr. Obama’s strongest supporters, young and minority voters, are not present in large numbers in FL-19. Instead, this district – whiter and much more elderly than the nation at large – is composed of the very groups which have been moving away from the Democratic Party. Although it still votes strongly Democratic, Fl-19 is not as blue as it once was:

Photobucket

That Democrats performed as well as they did in a district such as this provides further reason for Democratic optimism. Elderly and white voters have not all abandoned the party; it still can do well with constituencies outside the Obama coalition.

The national mood is still fairly unfavorable towards the Democratic Party; certainly the public is more antagonistic than it was when electing Mr. Obama. If an election were held today, there is a good chance Republicans would end up controlling at least one chamber of Congress. But perhaps, if these results are to be believed, the Democrats are climbing out of the hole the recession has dug for them.