Analyzing Swing States: Pennsylvania, Part 2.5

This is part of an analysis of the swing state Pennsylvania. Part three can be found here.

(A note: There will be a lot of maps in this post.)

Philadelphia: Precinct Results

My first post on the swing state Pennsylvania focused on the city Philadelphia, an incredibly Democratic city. At the time, I looked for detailed ward and precinct results but was unable to find any. Recently, however, I have come across a website which maps Philadelphia precinct results across a whole range of elections; it is a literal gold mine. This offers the opportunity to substantially deepen the previous analysis.

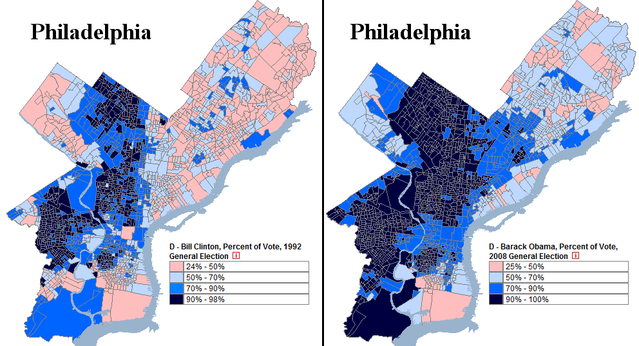
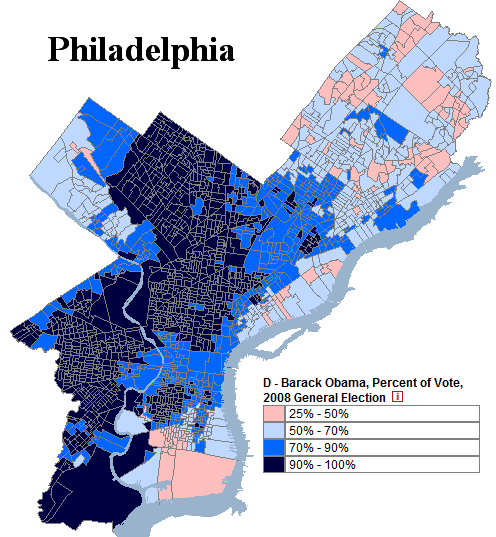
Below is a map, derived from the website, of the 2008 presidential election in Philadelphia (by precinct!)
Photobucket

An analysis of this result below.

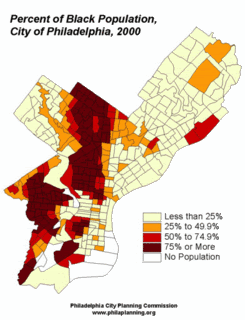
The legend ranges from President Barack Obama’s weakest precinct (25% of the vote) to his strongest (literally every single person voted for him). In total, Mr. Obama won 83.00% of the county’s vote – an amazingly high figure. For reference, below is a map of Philadelphia’s black population.

Photobucket

There is, of course, a distinct parallel between the two demographic maps; blacks vote heavily Democratic and will continue to do so in the foreseeable future.

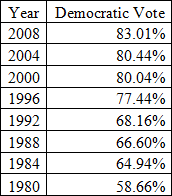
For decades, the city Philadelphia has trended Democratic. In percentage terms, its Democratic vote has increased for the past seven consecutive elections. In 1992, for example, former President Bill Clinton won 68.16% of the county. A comparison to Obama’s performance is revealing:

Photobucket

If there is any consolation for Republicans in all this, it is northeast (and parts of south) Philadelphia. Notice that in both maps above, Mr. Clinton and Mr. Obama perform distinctly worse here. This area of the city is populated mostly by white Catholics and Jews, although white flight has weakened their numbers. Nevertheless, northeast Philadelphia remains far whiter than the rest of the city, and as assimilated Catholics lose their traditional Democratic loyalties, Republicans have been gradually improving their percentages. John McCain actually did better than Bush in parts Northeast Philadelphia, supported by voters uncomfortable with Barack Obama’s race.

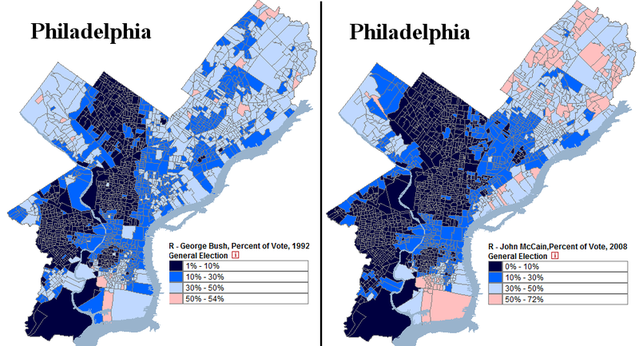
The above map hides this trend; many northeast Philadelphia voters cast their ballots for Ross Perot in 1992, so the Democratic percentage vote was artificially low that year (minority voters, on the other hand, generally did not vote for Mr. Perot). Comparing the Republican vote is more useful:

Photobucket

In general, Senator John McCain (who won 16.33% of the vote) does worse than former President George H.W. Bush (who won 20.19%). In the northeast, however, the opposite trend occurs. The shift is gradual and slow – not like West Virginia’s rapid red turn – but enough to be noticeable.

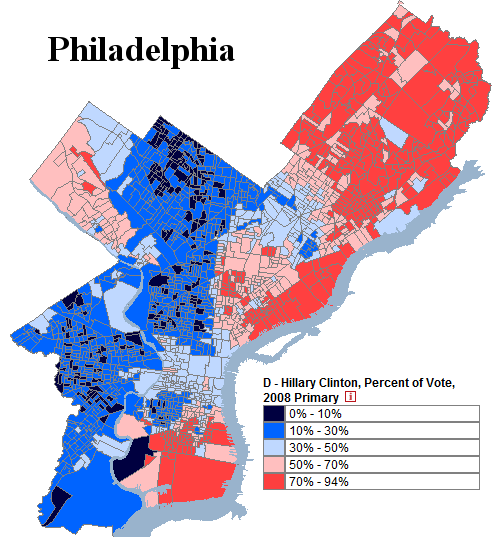
Under perfect conditions, growing Republican strength might result in something like this:

Photobucket

This is Secretary of State Hillary Clinton’s performance during the Pennsylvania primary. The senator won a respectable 34.80% of Philadelphia’s vote, fueled by support amongst white Catholics in the northeast. As evident in the map, the city contained extensive polarization; the majority of precincts gave over 70% of the vote to one candidate. In effect, Philadelphia split into two different blocs.

To be clear, Republicans will have a very difficult time achieving a result like this. It would take a momentous change for white Catholics to cast more than 70% of their ballots for Republicans. If this happened, moreover, winning Philadelphia would be the least of Democratic worries.

The other possibility would be for Republicans to improve their percentage amongst African-Americans. Statistically, 90+% support for any party seems untenable over a long period of time. Republicans, however, do not appear anywhere close to achieving this goal. The fact that they are more likely to reach 60% support amongst white Catholics than 15% support amongst blacks says a lot about the state of the Republican Party (and the state of America, too).

–Inoljt, http://mypolitikal.com/
Electoral Polarization

By: Inoljt, http://mypolitikal.com/

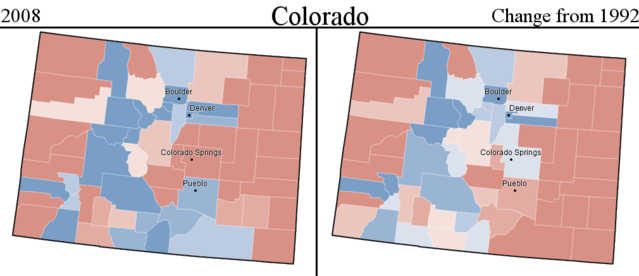
In my previous post, I noted that almost all the counties President Barack Obama won have become more Democratic since 1992, while almost all the counties Senator John McCain won have become more Republican since 1992.

In fact, comparing maps of the 2008 presidential election and the county changes from 1992 indicates a striking correlation.

Here is the 2008 presidential election:

Photobucket

Here are the changes from the 1992 presidential election:

Photobucket

This hints at a disturbing picture of electoral polarization. More analysis below.

On the one hand, all this is somewhat intuitive. If a Democratic candidate does well in a specific place, he or she probably improved on a previous Democrat’s performance there – and vice versa. Moreover, these maps do not imply that all blue regions became more Democratic (nor the opposite); rural Appalachia, in the most famous instance, has trended sharply Republican, while much of suburban American has gone in the opposite direction.

On the other hand, this phenomenon does not constitute a mathematical rule. If a Democratic candidate wins a county, that doesn’t necessarily imply that he or she improved upon a previous Democrat’s performance. He or she could have done worse but still won; the previous Democrat might have overperformed, or the Republican might have encouraged cross-over voting.

Yet by and large, this has not been the case. Obama practically always outperformed former President Bill Clinton in today’s Democratic counties. Mr. McCain practically always overperformed former President George H. W. Bush in today’s Republican counties.

Taking a look at selected states provides a powerful illustration of this fact.

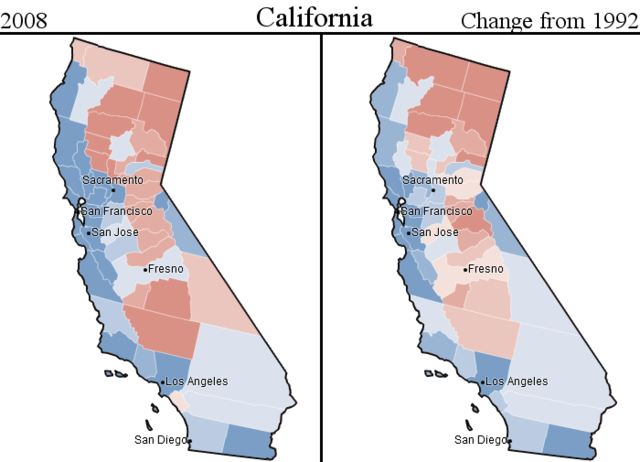
Here is California:

Photobucket

Here is Colorado:

Photobucket

All this implies something rather disturbing: electoral polarization has been steadily increasing. Obama only improved on Mr. Clinton’s performance in the counties Obama won. McCain only improved on Mr. Bush’s performance in the counties McCain won. The almost total lack of cross-over gain suggests that each party has come to depend on deepening their base, rather than widening the electorate and appealing to moderates.

That America is getting more divided has, of course, been known for a fairly long time. In some ways the maps exaggerate the polarization: 1992 Clinton appealed to many Republicans, while Obama’s strength lay amongst the Democratic base. Then there is the Ross Perot effect, which lowered margins in both party strongholds (e.g. New England, the Plains states).

But perhaps a bit of exaggeration is needed. Polarization has rarely been good for any country, and its increasing prevalence bodes poorly for the future of the United States. A map like this provides a potent illustration of polarization in action; indeed, I have never encountered a more striking image of its increase. Such a picture might do us some good.

(Note: Credit for all maps is given to the NYT; some images have been modified.)

Analyzing Swing States: Pennsylvania, Part 2

This is the second part of a series of posts analyzing the swing state Pennsylvania. The next part can be found here.

Photobucket

Like Florida, and unlike Ohio, Pennsylvania’s political geography can be divided into three. The industrial southwest is reddening, the populous southeast is bluing, and Pennsyltucky remains, as James Carville memorably described it, “Alabama without the blacks.” (Actually, Pennsyltucky is a fair bit less conservative.)

The following section will concentrate on Philadelphia, the region upon which Democrats draw the most votes.


Philadelphia the City

Although cities always vote Democratic, different cities contain different political characteristics. Not all big cities are liberal (see Houston, Phoenix), nor are all liberal cities are big (see San Francisco, Boulder).

Fortunately for Democrats, Philadelphia is both America’s sixth largest city and one in which four out of five inhabitants regularly choose the Democrat. It is, moreover, a city which has become bluer for eight straight elections.

(A note: All my statistics are taken from http://www.uselectionatlas.org/)

Photobucket

More below.

Philadelphia’s decades-long movement towards Democrats has corresponded with six decades of population decline; white flight has gradually weeded out Republican voters. Machine politics – characterized by such practices as street money – continues to play a major role in elections.

Demographics underlie Democratic strength in the city (as they do throughout American cities). A full 44.8% of the city’s population is black, a heavily Democratic voting bloc. Latinos (another Democratic voting bloc), while fewer than elsewhere, comprise a solid 11.8% of Philadelphia.

A large majority of Philadelphia’s white voters must vote Democratic, too. In 2008 Obama took 83% of the vote, in a city whose non-Hispanic white population was 39.0% according to the census. Assuming minority turn-out proportional to their actual population, and assuming every single non-white person voted Democratic, then at a minimum, 56.4% of Philadelphia whites supported Obama. Under a more realistic assumption (e.g. 90% non-whites voting Democratic), 72.08% of Philadelphia whites would be supporting Obama. (The equation to get this is simple: 83.01 = 0.90*61.00 + x*39.00).

Philadelphia’s white vote revolves around two factors: liberal whites moving in through gentrification, and long-standing white ethnic communities. The former voting group – often young, single, and gay or gay-friendly – is liberal by orientation; the latter group, a consequence of long-gone anti-Catholic sentiment, still votes Democratic on economic issues but is slowly treading Republican.

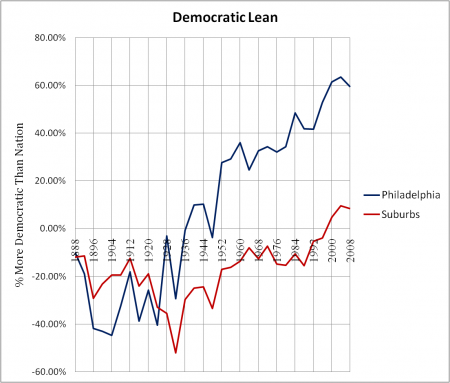
All in all, Philadelphia’s existence constitutes an enormous advantage for Democrats. For the past three presidential elections, it has been around 60% more Democratic than the nation as a whole. If George W. Bush had won 80% of the vote in 2008 (and John Kerry had won 20% of the vote), he still would have lost Philadelphia by 3.60%. That is a shocking (and sad) statistic. As long as Republicans keep on losing the city by 4-1 margins, they’ll have a very difficult time winning Pennsylvania as a whole.

Photobucket

Finally, notice how – for the first time in history – Philadelphia’s suburbs now lean Democratic. That shift, which I will cover next, should disturb even the most confident Republican.

–Inoljt, http://mypolitikal.com/
What Is This Map?

By: Inoljt, http://mypolitikal.com/

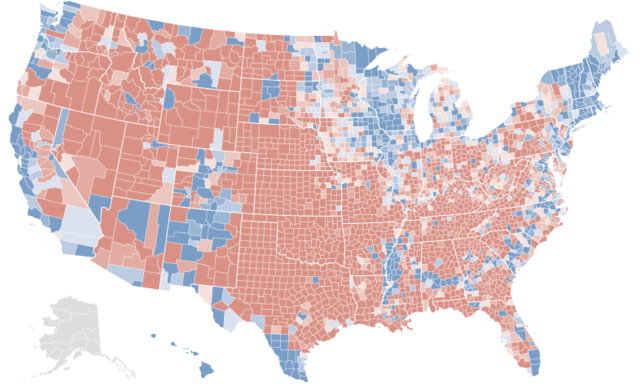
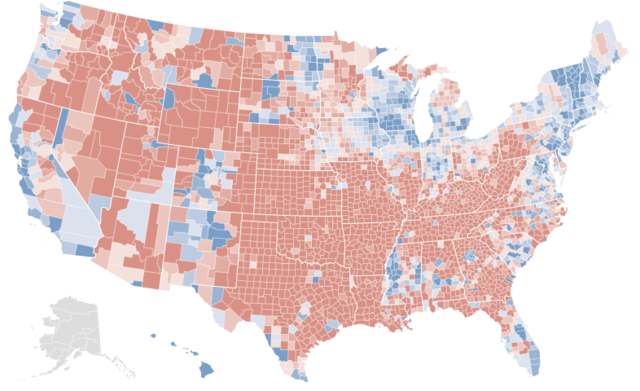
This map is not what you think it is. Take a moment to guess what it represents.

Photobucket

The answer below the flip.

At first glance, it looks a lot like the results of the 2008 presidential election. The northeast and midwest are all blue. Then there’s the west coast – a long line of blue counties. One could be quite easily forgiven if one took this map for a county-by-county map of the 2008 presidential election.

In fact, here are the real election results:

Photobucket

[Note: If you want to better compare the two maps, open two tabs of this (the first map) and

this (the actual results). Then switch between them.]

There is an extremely strong correlation between the two maps. Almost all the same counties are blue or red. Peering closer only cements this impression. Nevada has three blue counties – the exact three Democrats won. In Texas, only the cities and the Hispanic southwest are blue – a precise replication of the real results. One can go on and on, spotting these types of similarities.

Yet there are minor anomalies. Central Indiana and southern Florida are uniformly blue; President Barack Obama generally lost these areas. More significantly, the vast majority of Minnesota shows up red – strange, given that Democrats won the state by double-digits.

Minnesota should provide a clue of what the first map represents. Although the Democratic candidate won the state, it has been trending red for several elections. Before reading more, take a minute to refine your first guess.

.

.

.

If you haven’t figured out what the first map represents by now, here’s a bigger hint: look at Arkansas. Notice how uniformly red it appears in the first map, despite the several counties Mr. Obama won. Try to guess again – you probably can figure it out now.

.

.

.

Here’s the answer: the first map represents voting shifts between the 1992 presidential election and the 2008 presidential election.

As you have seen, there is quite a startling correlation between the two maps. Over the past four elections, the vast majority of counties President Barack Obama won have become more Democratic, while the vast majority of counties Senator John McCain won have become more Republican.

In the next post, I will attempt to analyze the meaning of this.

Why Did Hillary Clinton Win Massachusetts?

By: Inoljt, http://mypolitikal.com/

I think we all remember the 2008 Democratic primaries, that exciting and epic battle. In many ways the campaign caused more excitement than the general election, whose result was never really in doubt (especially after the financial crisis).

Both candidates drew upon distinctly different coalitions. In an influential article, Ronald Brownstein analyzes the difference this way:

Since the 1960s, Democratic nominating contests regularly have come down to a struggle between a candidate who draws support primarily from upscale, economically comfortable voters liberal on social and foreign policy issues, and a rival who relies mostly on downscale, financially strained voters drawn to populist economics and somewhat more conservative views on cultural and national security issues.

President Barack Obama assembled a coalition from the former, these “wine-track” Democrats. When most Americans think of liberals, they think of wine-track Democrats. Mr. Obama, then, was the liberal candidate; Mrs. Clinton the “beer-track,” working-class representative.

So candidate won the most liberal place in America?

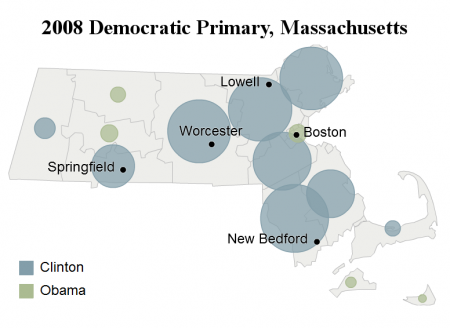
In fact, Secretary of State Hillary Clinton won the state of Massachusetts (you may have realized this by reading the title of this post). The result wasn’t even close; Mrs. Clinton’s margin was 15.37%.

Photobucket

These results are most strange. Barack Obama supposedly built a coalition upon liberal Democrats – yet he lost Massachusetts, the very image of liberalism. He then proceeded to win the nomination.

I will attempt to explain this puzzling result below.

There are several elements to it. Firstly, the state Massachusetts does not contain as many wine-track Democrats as most Americans tend to think. Rather, it includes a number of working-class, beer-track Democrats. These voters support Democrats based upon economic issues (which is not to say they are socially conservative). The state holds a strong union presence along with a high percentage of Catholics, numbering almost half the population. While in many places Catholics no longer vote Democratic, in Massachusetts they still are loyal to the party. According to exit polls, Catholics (45% of voters) went for Clinton by a 2-1 margin, while union households (27% of voters) supported Clinton 60-35.

Nevertheless, Clinton’s overwhelming victory remains surprising. Taking working-class support for Clinton into account, one still would expect Obama to do relatively well.

Remember, however, that this is Hillary Clinton we are talking about. Hillary Clinton, the champion of women’s rights. Hillary Clinton, the powerful and polarizing First Lady conservatives absolutely hated. Though the memory has dimmed, Hillary Clinton once stood at the forefront of “wine-track” liberalism. In February 5th, 2008 many liberal Democrats still remembered Hillary the feminist. Only later did Hillary the working-class fighter emerge.

Moreover, at that time Barack Obama continued to be a relative unknown, a bolt of lightning who had come out of nowhere. Hillary Clinton, therefore, made substantial inroads into Obama’s coalition, just as Obama took away a central pillar of working-class Democrats (blacks). Exit polls indicated that 62% of women supported Clinton (36% supported Obama); progressive white women probably went for her even more strongly. Throughout the primaries, Jews and gays (both deeply liberal groups) tended to support Clinton.

I am not terribly satisfied with this analysis; it does not seem to fully explain how the most liberal state in the union supported the more conservative candidate. The result perplexes me even today.

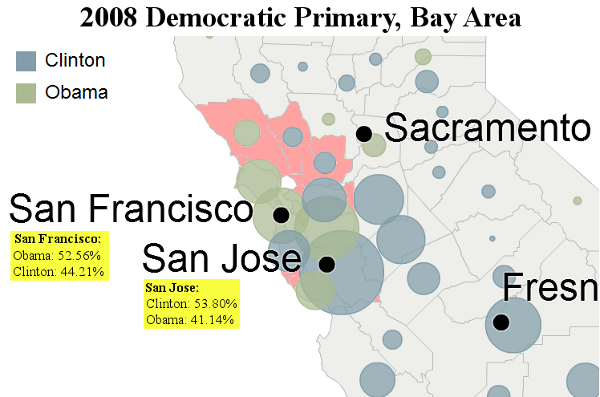
Nor did Massachusetts constitute an anomaly; Clinton did well in other liberal areas. She and Obama, for instance essentially tied the San Francisco Bay Area:

Photobucket

Reasonable explanations behind this result also exist. Working-class Latinos gave Clinton strong support; thus her large margins in heavily Latino San Jose and Fresno. Moreover, upper-class Asians – a major Bay Area constituency – supported her 3-1.

Yet the fact remains that, out of the two most liberal regions in the nation, Hillary Clinton won a landslide in one and tied another (if one adds together the Bay Area’s nine metropolitan counties, Obama actually wins by 1.2%). All this against an opponent whose base lay amongst liberal Democrats. It is all very puzzling.

Note: All images are modified pictures taken from the NYT.

Analyzing Swing States: Pennsylvania, Part 1

This is the first part of an analysis of the swing state Pennsylvania. Part two can be found here.

Photobucket

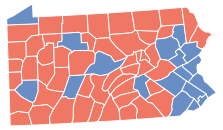
In the dying days of his campaign John McCain mounted a quixotic attempt to win Pennsylvania. Despite his efforts, Obama cruised to a double-digit victory; from May to November 4th, only one poll showed McCain leading.

Two years previously, Pennsylvania Senator Rick Santorum – a Republican politician who had ambitions of becoming president – ran for re-election. A hard-line, nationally known conservative, he was overwhelmingly defeated by challenger Robert Casey.

These two instances provide a sense of Pennsylvania’s political climate; the state, while not exactly liberal, naturally leans towards Democratic candidates. The average Republican must overcome a formidable Democratic machine to win Pennsylvania.

More below.

There used to be a time when the opposite was the case; Republicans could usually count on Pennsylvania turning up in their column. If, by chance, the state didn’t go red – well, it didn’t really matter, because they were probably losing a landslide anyways.

This state of affairs ended in 1952.

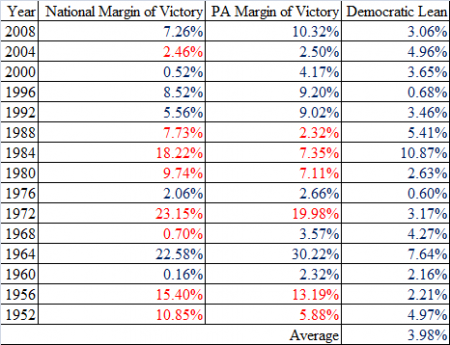
Photobucket

Since then Pennsylvania has been an average of four percent more Democratic than the nation at large. Structurally, the state is a tough nut for Republicans to crack – tougher than most Republican strategists realize. There are several very tall obstacles a Republican must overcome to win.

The first is Philadelphia, a very big and very Democratic city. The second is Pittsburgh, another fairly big and Democratic-leaning city. Either Republicans must do well in Philly and Pittsburgh, or they must overcome their margins elsewhere. The first option is a non-starter; most Republicans don’t even try winning big cities anymore. Twenty years ago, Republicans could use Philadelphia’s suburbs to balance Democratic margins from the city itself (that was how George H. W. Bush won the state). Not anymore: the suburbs voted Democratic for the past five elections. Republican candidates are therefore forced to rely on exurban and rural votes along the “T” and – sometimes, but not often – in the dying industrial west.

So Republicans are in trouble right off the bat in Pennsylvania.

–Inoljt, http://mypolitikal.com/
Two Trends on Election Night

By: Inoljt, http://thepolitikalblog.wordpr…

Last night’s election exhibited two trends: one positive for the country as a whole, and one more ominous for Democrats. Firstly, Americans rejected negative campaigning and extremism – whether it be in Virginia, New Jersey, NY-23, or Maine. Secondly, the electorate as a whole shifted quite profoundly to the right.


Negative Campaigning and Extremism

In the most-watched races, voters chose the side that espoused moderation and ran a positive message. The Democratic candidates in both Virginia and New Jersey focused on the negative: state congressman Creigh Deeds of Virginia spent most of his time attacking Attorney General Bob McDonnell’s college thesis, while Governor Jon Corzine of New Jersey launched a barrage of negative ads. Both candidates lost.

The other races featured the victory of moderate politics over extremism. In NY-23,  a Republican-represented district since the Civil War, conservatives sabotaged the moderate Republican candidate in favor of hard-line Doug Hoffman. Fortunately, voters in upstate New York rejected the Glenn Beck nominee and instead chose Democrat Bill Owens, an independent turned Democrat.

Thus the election results enforced a positive trend in politics – one of moderation and positive campaigning focused on the issues, rather than divisive personal attacks. For Democrats like myself, however, the other trend – a rightward shift – is more worrisome.

A Rightward Shift

For Democrats, the election’s most worrying result was not in Virginia, New Jersey, or Maine. It was the special election in CA-10.

At first glance, this might seem a bit puzzling. Democrats won that election, after all – and they won it by a comfortable 10% margin.

Yet, when compared to previous elections, this result is quite an underperformance. Barack Obama, for instance, won this congressional district by three times that margin. Since 2002, moreover, former Democratic congressman Ellen Tauscher had never polled below 65% of the vote.

Moreover, the election revealed more about the national mood than, say, Virginia or New Jersey. Those races were heavily dependent on local factors (e.g. the quality of the Deeds campaign, the unpopularity of Governor Jon Corzine). In CA-10, you had two low-recognition candidates and little publicity; it was closer to a generic ballot poll.

If  CA-10 could be characterized as a generic ballot poll, then Democrats should be extremely worried. In 2009, CA-10 went from a 30% Democratic victory to a 10% one: a 10-point shift to the right. Similar shifts were seen in New Jersey and Virginia; the electorate as a whole moved substantially to the right. The Democrats were very fortunate that Tuesday did not constitute a full-blown congressional election; they would have been crushed.

There is good news, however. Democratic weakness two days ago resulted more from an energized Republican base than a fundamental shift in the national mood. Republicans, motivated and unhappy, turned out; President Barack Obama’s coalition did not. The president still attains approval ratings in the low 50s – hardly the sign of an unpopular incumbent.

The bad news is that I am not sure if Mr. Obama’s coalition will turn out for the 2010 congressional elections. His voters have been curiously lethargic ever since his election; their low turn-out was how Senator Saxy Chambliss in Georgia went from a 3% general victory to a 14% run-off victory. Republicans, then, may do well next year.

In fact, I am not even sure Mr. Obama’s coalition will re-emerge in 2012, when he goes up for re-election. The president, after all, ran on a campaign of hope, change, and idealism. The difficult compromises forced by governing have tainted this brand, and it will inevitably continue to be diluted over the next three years. Obama’s 2008 coalition may go down as unique in American history, much like former President Jimmy Carter’s coalition.

I hope it will not. There is that word again.

Communism in Italy

This is the third part of a series on Communism in Western Europe; this section focuses on Italy in particular. The previous parts can be found here.

Photobucket

The Italian Communist Party (PCI) formed in 1921, as a break-away faction of the socialist party. In many respects, its early years were similar to those of the PCF. Like the French Communists, the Italian Communist Party (PCI) fared poorly in national elections, winning less than five percent of the popular vote. Its time to grow, moreover, was cut short by Benito Mussolini’s dictatorship; he outlawed the party in 1926.

In another parallel to their French colleagues, the Italian Communists (PCI) fought fiercely against the Nazis during WWII and won major acclaim for their efforts. After the war, the PCI took part in the new government, playing a major role in writing the new Italian constitution. As in France, however, America’s Marshall Plan curbed their influence; to gain access to U.S. aid, the Italian government kicked out the Communists. They would never again hold power in Italy.

Continued below.

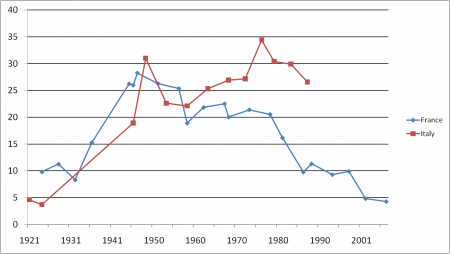
Here the paths of the French and Italian Communists diverge. In France the Communist story is one of steady decline, until the PCF no longer constituted a viable political force. In Italy the story is different.

Photobucket

Before getting into it, however, another tale must be told – that of the 1948 general elections. This contest was the most important election in Italian history, pitting the Italian Communist Party (the PCI, allied with the socialists) against the Christian Democrats (Democrazia Cristiana, DC). It literally determined Italy’s side on the Cold War, whether it would ally with the United States or the Soviet Union. Many feared that if the Communists won, Italy would go red, never to turn back.

The election was fiercely fought; both sides were discretely funded by their respective superpowers. The Catholic Church came out strongly against the Communists (PCI), using slogans such as, “In the secrecy of the polling booth, God sees you – Stalin doesn’t.”

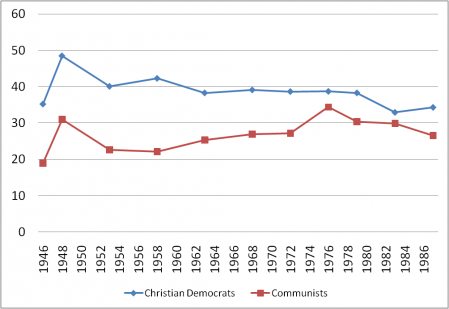
Christian Democracy (DC) blew away the Communists (PCI). While the PCI won a 31.0% vote share, their second-best performance ever, the Christian Democrats took 48.5% of the vote. Italy allied with the United States.

For nearly half a century thereafter, Christian Democracy governed Italy. The PCI never managed to win more votes than the Christian Democrats, although they continued to fare respectably in general elections.

Photobucket

Here a crucial distinction between the French Communists and the Italian Communists occurs: while the PCF gradually declined throughout the 50s to 70s, the PCI actually strengthened itself during this era. Unlike the French Communist Party, the PCI publicly and dramatically distanced itself from the Soviet Union. Instead, the party was the most vocal advocate of eurocommunism, a far different philosophy than that espoused by the Soviet Union.

Thus, the Italian Communist Party was perceived as more acceptable and moderate than other communist parties, and its share of the vote steadily increased. In 1976, they won 34.37% of the vote, their best performance in history and a mere 4.34% behind DC. The PCI achieved this result by doing “all they could to appear as a respectable, rather conservative party committed to sensible change by constitutional means…[and] emphasise how moderate, democratic and uncorrupt they were.”

In the end, however, the PCI was still Communist, irrevocably tied to the fate of the Soviet Union no matter how distant their ties. When the USSR fell, the Italian Communist Party was broken up – though, as in eastern Europe, many parties of Italy’s left have roots from the PCI. Within a few years, DC – its reason for existence now dead – imploded under a shroud of corruption scandals.

That was the end of the old system. Today, for better or for worse, one man – Silvio Berlusconi – dominates the political arena. Yet, even with the PCI long gone, Berlusconi still invokes anti-communism to win votes. The shadow of the PCI is long indeed.

–Inoljt, http://thepolitikalblog.wordpr…

The Strange Case of New Jersey

By: Inoljt, http://thepolitikalblog.wordpr…

The New Jersey governor’s election is less than two weeks away, and it deserves far more attention than I have been giving it. Nevertheless, I will now belatedly share some thoughts that have been stewing in my head.

Here is a snapshot of the race as of 10/25:

Photobucket

There are several unmistakable trends here. The challenger Attorney Chris Christie gains a double-digit lead over the incumbent, for fairly obvious reasons. Then, mysteriously, he proceeds to lose it. Incumbent Governor Jon Corzine’s share of the vote mostly remains flat but – and this is important – trends slightly upward. While the two main candidates blast each other, third-party candidate Chris Daggett draws support at an accelerating rate.

Mr. Corzine’s positive trend should encourage Democrats; it indicates that he is actually building support, not just tearing down Mr. Christie. In addition, expect Mr. Daggett to overperform on election day as he reaches viability. Normally, third-party candidates perform below their polling; this election, however, with both major candidates highly unpopular, constitutes anything but a normal situation.

The strangest and most interesting part of the campaign, however, has been the story of Mr. Christie.

More below.

He challenged an unpopular incumbent, under hugely favorable macropolitical conditions, and by summer had attained a double-digit lead. Then Mr. Christie’s support began sliding, a trend that continues to this day. He went from polling barely below 50% to polling barely below 40%.

I am at a loss to explain why this has happened. The fundamentals behind the race haven’t changed; the economy remains weak and Mr. Corzine much disliked. Scandal has not upended Christie; if anything, it has hurt Corzine more. Obviously the governor has run the better campaign, but campaigns generally do not erase double-digit leads.

Indeed, this race runs counter to a fundamental theme of politics: if a challenger of an unpopular incumbent attains a substantial lead, it is almost always a futile effort eroding the advantage. The unpopular incumbent – whether it be Herbert Hoover, Jimmy Carter, or Rick Santorum – will inevitably lose. In fact, I cannot name a single election in which a candidate with a double-digit edge, facing a disliked incumbent, has lost that edge barring major scandal.

Part of the answer may lay with Chris Christie himself. The man seems, plain and simple, a bad candidate. For some reason or other, the inhabitants of New Jersey just don’t like the guy. It’s the same problem that cursed John Edwards and Mitt Romney during the primaries. No matter how well-run their campaigns, no matter how good their ideas, people just wouldn’t vote for them. Christie perfectly fits this description – an irony, given that Republicans nominated him because he appeared a strong candidate.

The same, of course, could be said for Corzine; both nominees have tremendous weaknesses. That is why this race is so close less than two weeks before election day.

Communism in France

This is the second part of a series on Communism in Western Europe; this section focuses on France in particular. The third part (Italy) can be found here.

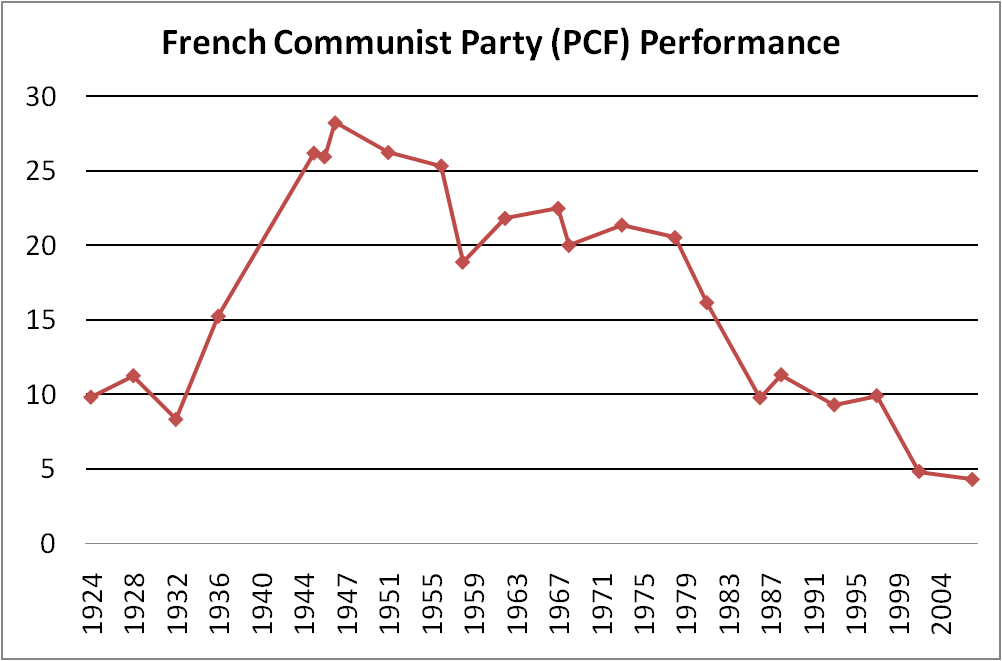
In France, the Communist Party was founded in 1920 by revolting members of its socialist party, then called the French Section of the Workers’ International (Section Française de l’Internationale Ouvrière, SFIO). Their new party initially did fairly poorly, only one of the numerous parties out there. In 1928, for instance, the Communists (PCF) won 11.26% of the vote.

Nevertheless, by 1936 – the depths of the Great Depression – the Communists (PCF) were making gains. Then came WWII – the best thing that ever happened to the PCF. Out of all the parties in occupied France, the Communists fought the Nazis hardest and suffered the most for it. They earned the nickname le parti des 75 000 fusillés – the party of the 75,000 executed people – and immense popularity.

Following the war, the PCF joined the new government led by Charles de Gaulle. Unfortunately for it, however, the U.S. government demanded a Communist-free government as a precondition for accepting the Marshall Plan. The French Communist Party was summarily booted out.

This did not prevent the PCF from channeling its wartime record into electoral success; from November 1946 to 1956, the Communists won a greater share of the popular vote than any other party. Their base lay amongst France’s working class, which remained a loyal and reliable constituency, and they constituted the dominant force on the French left.

Communist Party in France Performance

Continued below the flip.

This state of affairs could not last forever, however. After 1956, the French Communists entered a slow decline. With the slow, gradual destruction of the Soviet Union’s credibility in the West, the PCF – tightly linked to the USSR – reached a ceiling of support. Many French voters simply would never vote communist.

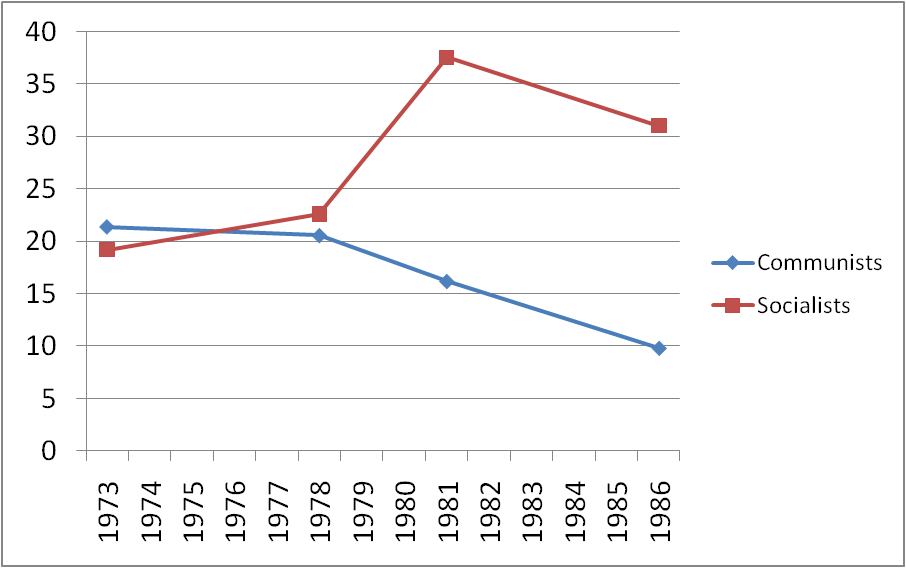
Then, in 1969, the Socialist Party (Parti socialiste, PS) was founded, sounding the death knell of the Communists. Led by François Mitterrand, the socialists quickly took over the mantle as the leader of the left. Communist voters abandoned the PCF in droves, seeking a party that could actually win a majority of the popular vote – which the Communists could not. Thus, by 1988, the PCF won a mere 3.43% of the popular vote in run-off legislative elections.

Communists in France Decline

Interestingly, it was not the fall of the Soviet Union that ended the Communist Party in France, but the emergence of an acceptable alternative to the PCF. That was not the case with Italy.

— Inoljt, http://thepolitikalblog.wordpr…