Maryland, my Maryland. The Democrats currently have a 6-2 edge in representation in this fairly blue state, and with redistricting just around the corner, the question on Democrats’ minds is how can we make this an even larger edge? An 8-0 map has seemed impossible to make where it would sufficiently protect the incumbent Democrats, although I’m confident that someone will make one. I know there have been recent attempts but those created an essentially perfect swing district in MD-01 to get us to 7-1 (or 8-0).
My goal is to create a 7-1 map where MD-01 is sufficiently blue so that a moderate Democrat like Frank Kratovil can retake the district and hold it while accounting for:
1.Based on Nathaniel90’s recent “Redistricting Outlook” that discussed Maryland, it appears that I need to keep two minority-majority black districts while I pursue the goal of 7-1.
2. Keeping the Democratic incumbents’ hometowns in their respective districts (I actually ended up drawing both Republicans out of their residences).
3. Increasing the partisan advantage of the more “vulnerable” incumbents.
As for how this map turned into a monstrosity…When you add together the sandbox atmosphere of Dave’s Redistricting App with the already crazily drawn districts in Maryland, you can end up with an absurd map like this one.
NOTE: I used the new population estimates with voting precincts.
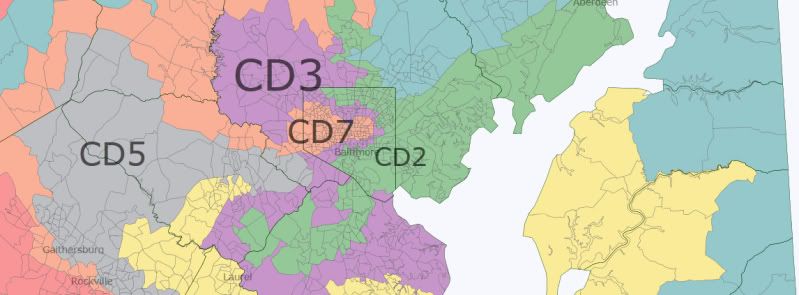
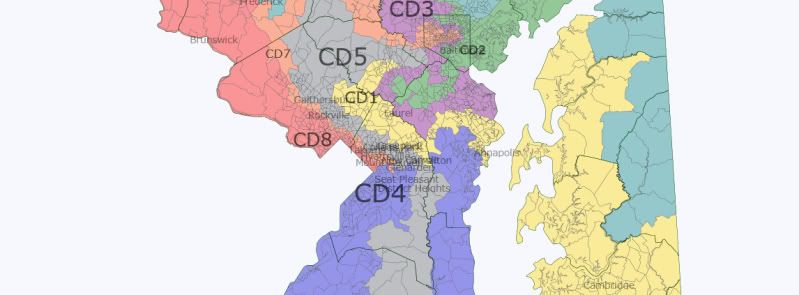
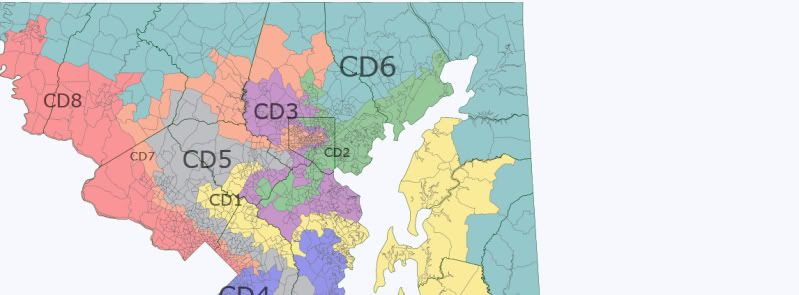
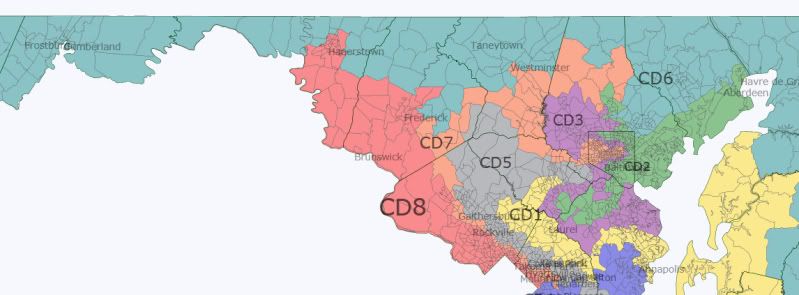
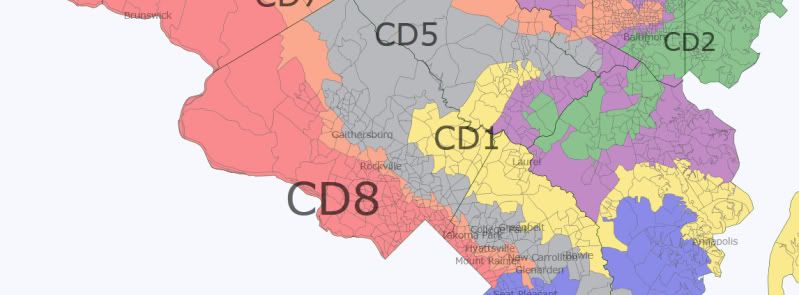
So here’s what I came up with:
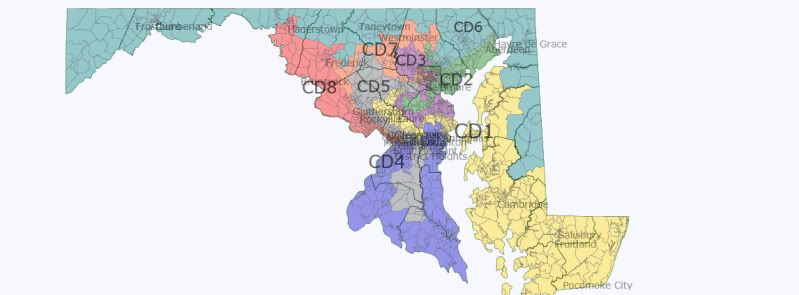
Clearly, there are some ridiculous districts on this map. But let’s break them down.
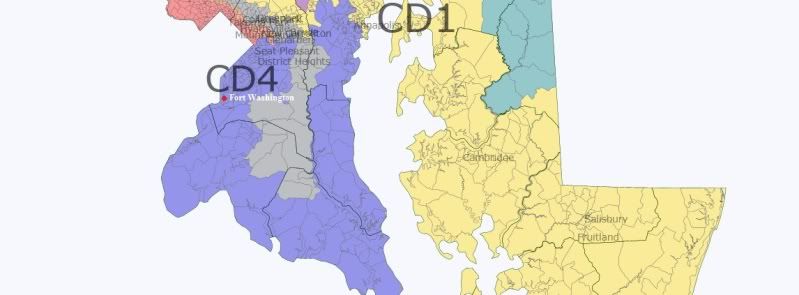
MD-01 (Yellow)
Naturally, we’ll start with MD-01.
Here’s the data on Mr. Kratovil’s old and hopefully new district:

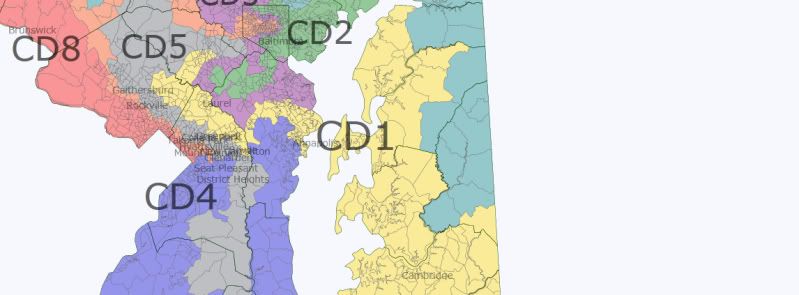
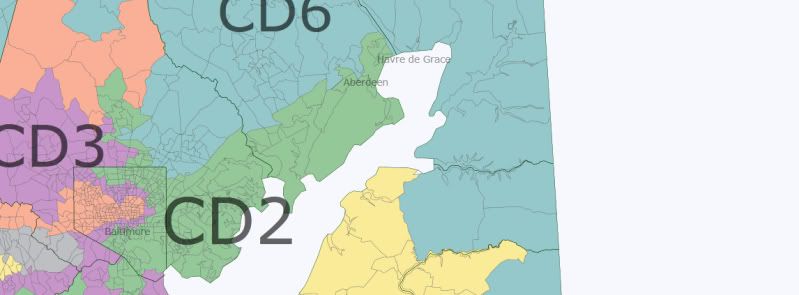
A zoom in on this district’s mainland “hook”:
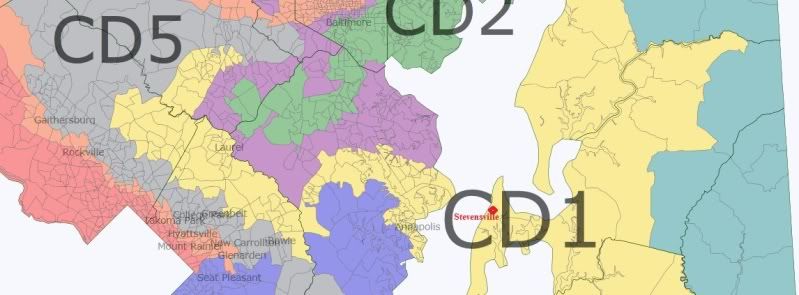
Based on Wikipedia, the old PVI for this district was R+13. With the President’s numbers from 2008, the new district would be a solid D+5, thus very winnable for a candidate like Kratovil (whose hometown Stevensville is shown above). Most importantly, Kratovil’s hometown is in this district whereas GOP incumbent Andy Harris’ is not (it’s in the new 7th and he would have to challenge Elijah Cummings to return). The only question mark about this district is whether or not crossing the Chesapeake Bay allows the district to still be considered “contiguous.”
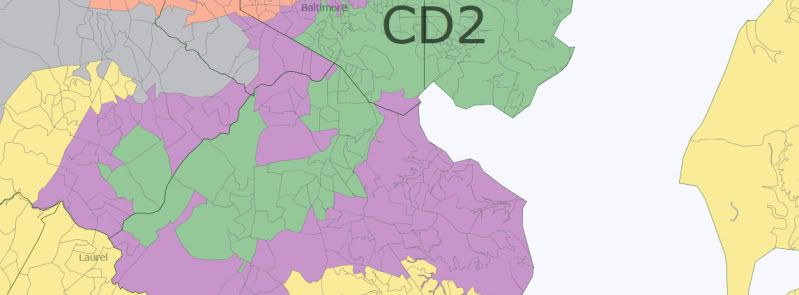
MD-02 (Green)
Now, for MD-02. Dutch Ruppersberger’s new district looks like this:
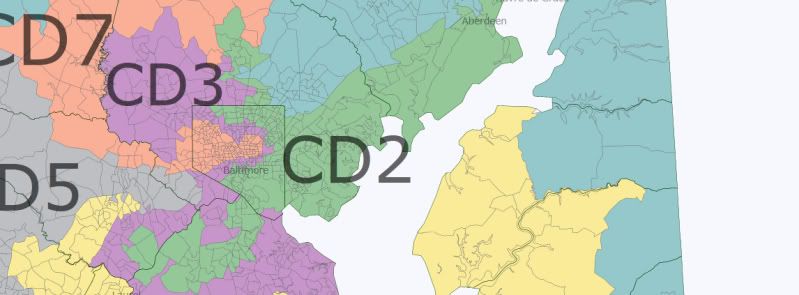
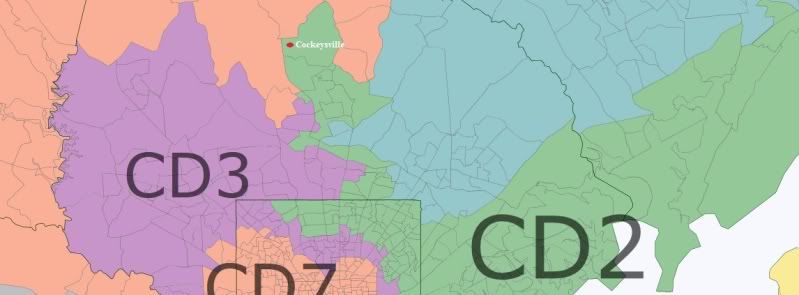
The most north-central part stretches up to snare Cockeysville, Ruppersberger’s hometown (Andy Harris lives somewhere in the vicinity as well because his hometown is listed there, too). The rest of the district is based somewhat on his current set up except that now his seat is even more secure. The data:

Some more pictures of the new MD-02. Here’s the most northern part so you can actually see its fullest extent:
The central part where Cockeysville is:
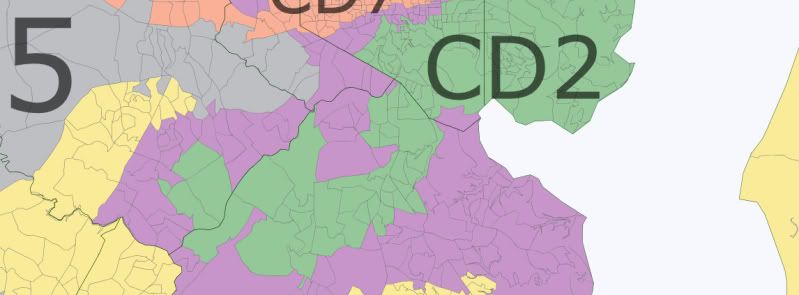
And the southern section:
MD-03 (Purple)
Now, the other non-minority-majority Baltimore district, MD-03. Incumbent John Sarbanes is fairly safe but I’ve made his work even easier.
And the data for MD-03:

While I know which district on this redistricting map is the “worst,” this one is certainly competing for the second most meandering. Like Ruppsberger’s hometown, Sarbanes’ Towson is barely in his district.
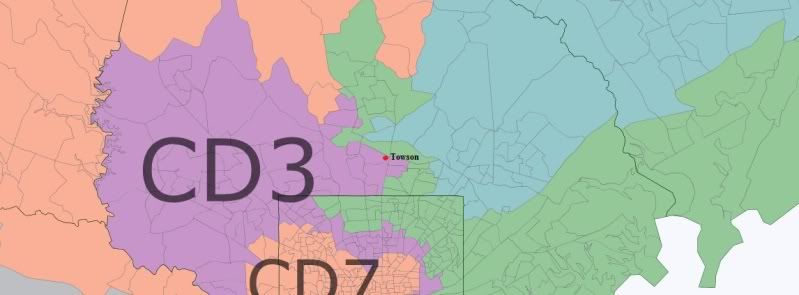
And the most southern part of the MD-03, curling in with MD-02 and MD-01:
MD-04 (Blue)
Moving on, we have MD-04, represented by Donna Edwards. It’s the first minority-majority district to discuss. Basically, much of the district is Steny Hoyer’s old district, forming a large U from D.C. to suburban Annapolis for reasons to be explained shortly in the MD-05 (gray) section. Edwards lives in Fort Washington, so that’s not an issue.
The data for MD-04:

Fifty-one percent African American puts it over the hump for continuing to be a minority-majority district. Although it loses some PVI, it had plenty to lose in the first place.
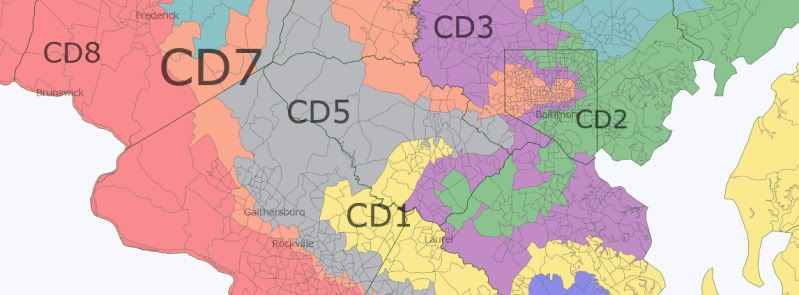
MD-05 (Gray)
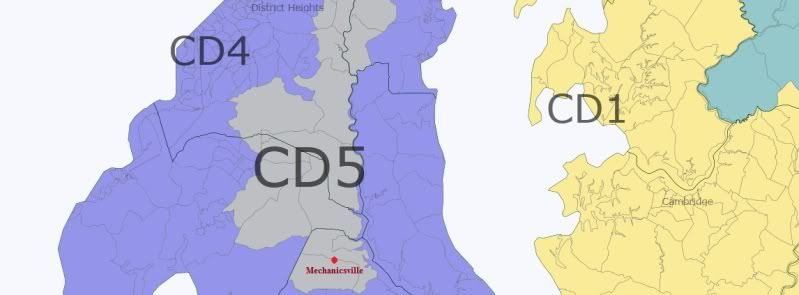
Originally when I was drawing up this map, I gave Donna Edwards all of southeastern Maryland because I thought Steny Hoyer lived closer to College Park. Turns out his home is in Mechanicsville, and I don’t think you can draw the Democratic Minority Whip out his district. Thus, the even more extended nature of his district, which I had going into the suburbs of Annapolis first. Now Edwards goes there and Hoyer stretches down to his hometown.
More specifically, the southern part of the district and Hoyer’s hometown:
Hoyer’s district, like the prospective MD-01, crosses through the D.C. suburbs and stretches northwest. That stretch looks like this:
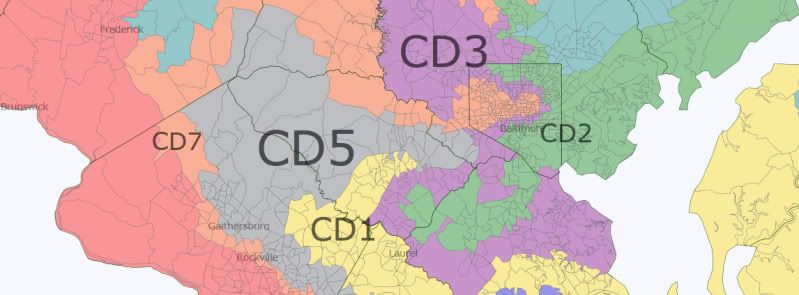
The northern-most part looks like this:
And MD-05’s overall result? A safer district for Steny:

MD-06 (Teal)
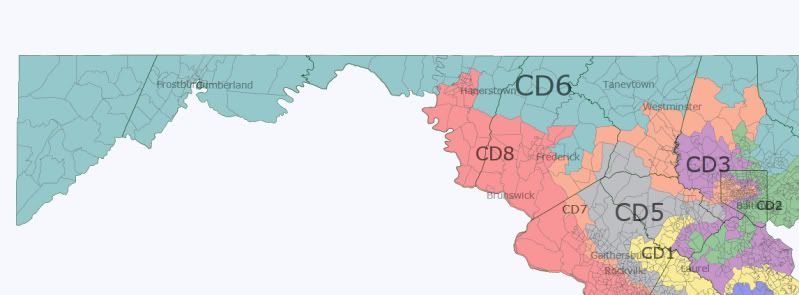
Now for the lone safe Republican seat on this map. The giant L of a district has to violate any rules about compactness but it sure isolates the Republicans. As Roscoe Bartlett lives in Frederick, this map actually draws him out of his district because Frederick is now in Chris Van Hollen’s MD-08.
The western part of the district:
And the eastern part:
MD-06’s data:

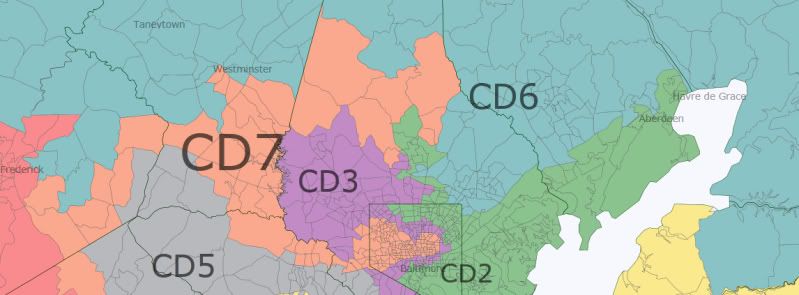
MD-07 (Orange)
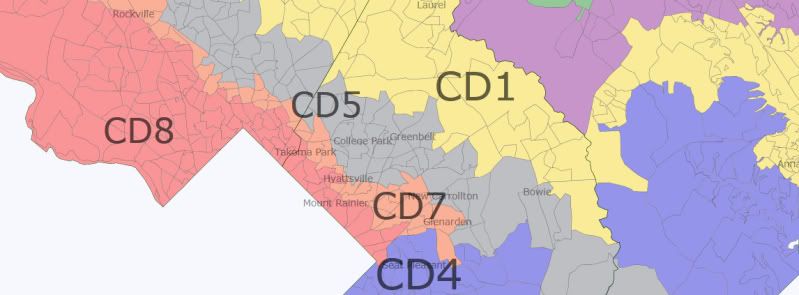
People are going to ask how in the hell did I end up sending this district from central Baltimore all the way to Prince George’s County. Basically, I was having trouble keeping the 7th over 50% black because it is the other minority-majority district. My original draw out had made MD-04 nearly 60% black so I decided I would “steal” African American voters from it, and at the same time I could leave more of the less-black Democratic areas of greater Baltimore to Sarbanes and Ruppersberger. At the same time, I managed to eat up a lot of blank GOP space that wouldn’t have to go into Hoyer or Van Hollen’s district as I stretched it west. I also drew Andy Harris into the 7th, forcing him to either move or find something else to run for. The end result was the “claw.”
Obviously, this would seem to break any rule on “communities of interest” as we’d have central Baltimore coupled with part of Laurel in suburban D.C. But it satisfied the minority-majority clause as we can see from the data:

The northern part of the district:
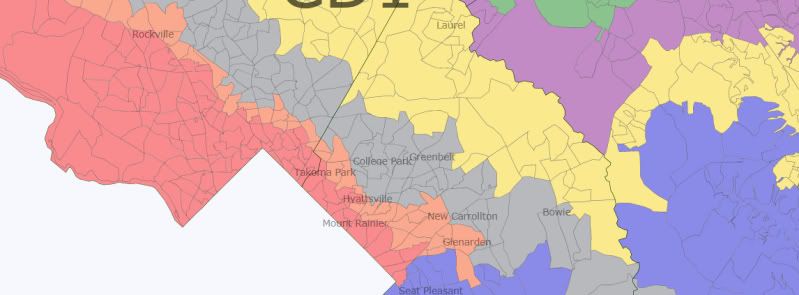
The narrow stretch curling down into greater D.C.:
And the suburban D.C. area:
MD-08
Lastly, we have Chris Van Hollen’s MD-08 which now stretches well beyond suburban D.C. all the way to Hagerstown, capturing the few very Democratic areas in Frederick and Hagerstown.
In the southern part of the district, it mixes in with MD-04 and MD-07:
And lastly, MD-08’s data:

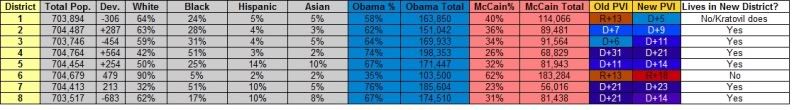
In conclusion, here is the data from all eight districts:
Thanks for reading!


