CA-AG: Improvement for Kamala

Update: Err. DCal points out a good point that Santa Clara’s reported an extra 86k votes since their last update. That means, well, Kamala doesn’t stand to gain as much. Revised, we’re saying Kamala will gain about 55,000 votes…leaving her about 7,300 short.

Hate to pull the roller coaster on y’all, but I’d rather be realistic than unrealistically optimistic.


After combing through the individual county websites and aggregating the information with the latest Unprocessed Ballots Report (UBR), Kamala Harris is actually down 62,258 votes thanks to a large number of votes of San Diego and Orange Counties reporting beyond the latest UBR.

We’ve adjusted the UBR for the new results from each County on top of the latest SoS report – for example, the UBR lists 84,005 votes left to process in the OC, but 29,651 more votes were added in today’s OC update; therefore, we’re using 54,354 ballots left outstanding in Orange. Given all this, we actually project Kamala Harris to pick up 70,612 votes in the ballots left outstanding (again, assuming the same breakdown in the Abs/Prov/VBM ballots as the ballots already counted) – meaning she’d win by 8,354.

But even then, Harris has been outdoing that in the few examples where counties have more fully reporting. I don’t buy into the “bellwether” theory, but consider San Benito. On Saturday, Harris was trailing by 41 votes in San Benito; today, she’s winning San Benito by 226 votes. Just one example, but – if you buy the bellwether theory – a powerful one!

We’ll keep updating as more results roll in – we think a county-by-county update encompasses results more fully than just using the SoS update, and lets us better manage the timeframe issue.

Better yet, not all of Harris’ improvement is attributable to the methodology switch – by yesterday’s method, Harris would lose by only 48 votes!

Movers and shakers below:


County Total Harris Cooley Unproc Harris Cooley Margin
Los Angeles 1,883,468 1,004,737 743,482 322,428 171,999 127,276 44,724
Alameda 329,011 218,539 86,461 108,257 71,908 28,449 43,459
Santa Clara 459,996 251,940 168,327 108,000 59,152 39,521 19,631
Santa Clara 459,996 251,940 168,327 21,526 11,790 7,877 3,913
Contra Costa 236,809 125,361 93,978 85,000 44,997 33,732 11,265
Sonoma 138,383 79,052 45,321 40,000 22,850 13,100 9,750
Santa Cruz 67,290 41,786 18,478 27,905 17,329 7,663 9,666
Marin 83,391 51,689 25,850 27,050 16,767 8,385 8,382
San Mateo 168,055 95,316 59,945 26,812 15,207 9,564 5,643
Monterey 70,549 38,040 26,600 29,470 15,890 11,111 4,779
Mendocino 19,097 10,321 6,159 12,358 6,679 3,986 2,693
Solano 106,516 54,321 43,701 25,522 13,016 10,471 2,545
Humboldt 35,966 18,011 13,436 13,104 6,562 4,895 1,667
Yolo 47,516 25,421 18,162 10,536 5,637 4,027 1,610
Napa 28,480 14,229 11,711 17,877 8,932 7,351 1,581
Imperial 19,488 9,432 8,213 7,953 3,849 3,352 497
Lake 14,980 6,585 6,430 5,372 2,361 2,306 56


County Total Harris Cooley Unproc Harris Cooley Margin
Fresno 127,070 45,013 72,289 79,748 28,250 45,368 -17,118
Orange 798,056 245,400 484,693 54,354 16,714 33,011 -16,298
San Diego 766,960 294,759 402,289 80,000 30,746 41,962 -11,216
Kern 159,058 42,875 100,947 22,953 6,187 14,567 -8,380
San Bernardino 382,526 141,174 202,961 36,000 13,286 19,101 -5,815
Shasta 47,590 12,778 29,737 16,200 4,350 10,123 -5,773
Riverside 444,463 161,930 246,523 28,800 10,493 15,974 -5,481
Sacramento 304,620 135,123 145,080 101,722 45,122 48,447 -3,325
San Joaquin 113,918 46,769 55,184 39,715 16,305 19,239 -2,934
Butte 56,937 20,635 29,626 18,007 6,526 9,370 -2,844
Tulare 70,879 20,762 44,573 7,475 2,190 4,701 -2,511
Ventura 234,659 91,180 126,123 16,648 6,469 8,948 -2,479
Tehama 13,013 3,527 7,798 7,354 1,993 4,407 -2,414
Madera 27,635 8,130 16,872 5,806 1,708 3,545 -1,837
Placer 107,703 31,998 66,112 4,800 1,426 2,946 -1,520
Calaveras 14,501 4,168 8,236 4,918 1,414 2,793 -1,380
San Luis Obispo 93,036 34,907 49,042 8,291 3,111 4,370 -1,260
Stanislaus 110,462 41,587 59,205 6,980 2,628 3,741 -1,113
Sutter 22,671 6,642 13,871 2,384 698 1,459 -760
Santa Barbara 110,837 47,845 53,209 14,537 6,275 6,979 -704
Nevada 37,088 14,129 19,126 4,730 1,802 2,439 -637
Amador 14,112 3,963 8,306 1,741 489 1,025 -536
Yuba 14,555 4,312 8,484 1,209 358 705 -347
Siskiyou 16,827 5,455 9,196 993 322 543 -221
Del Norte 6,876 2,520 3,562 1,008 369 522 -153
Tuolumne 21,104 6,629 11,962 524 165 297 -132
Mariposa 7,010 2,096 4,051 267 80 154 -74
Merced 38,323 15,435 19,618 400 161 205 -44
Inyo 6,649 2,084 3,758 115 36 65 -29

WA-02: AP Calls the Race for Rick Larsen (D)

Another dose of good news:

Democratic U.S. Rep. Rick Larsen has held off a challenge by Republican challenger John Koster to win re-election to Washington state’s 2nd Congressional District.

With nearly all of the expected vote counted in early returns, Larsen led by 4,408 votes, and held 51 percent of the vote, compared to Koster’s 49 perent.

Larsen trailed Koster by less than 1,500 votes after the initial count on election night last week, but took the lead on Wednesday and has steadily increased it.

VA-11: WaPo Says Fimian Will Concede

Gerry Connolly survives by the skin of his teeth:

Republican Keith Fimian will concede defeat Tuesday in the congressional race in Virginia’s 11th district, paving the way for Rep. Gerald Connolly (D) to serve a second term in the seat.

Fimian’s campaign has said only that he plans to release a statement about his plans Tuesday, and had not responded to a request for further comment as of this posting. But two sources familiar with Fimian’s decision confirmed that he would concede the race, choosing not to ask for a recount.

Connolly leads Fimian by 981 votes — or .4 percent of all votes cast — according to the Virginia state board of elections site. That margin entitles Fimian to ask for a recount after state election officials certify the results Nov. 22, but operatives from both parties who monitored the vote-counting process in the week since Election Day said they saw no glaring flaws in the numbers, and no clear path that would enable Fimian to make up the difference in a recount.

We included this race in our predictions contest because we figured it could surprise. From a quick glance at the data, it looks like many of you thought the same. (We’ll have to wait for the finalized data to be released before we can announce who gets the babka, of course.)

SSP Daily Digest: 11/8

MA-Sen: Well, that was a nice week off from forward-looking horse-race reporting. On to 2012: one of the first Dem names being floated as a potential challenger to Scott Brown is someone I’d never heard of till now, but who seems to have ‘rock star’ frequently appended to his name: Setti Warren, the mayor of the very affluent yet very liberal suburb of Newton. Warren, who is African-American, has been mayor of the city of 93,000 (which is 3% black) for only a year.

NV-Sen: In case it just wasn’t clear what an astoundingly well-handled re-election effort came from Harry Reid’s camp this year, check out Jon Ralston’s re-cap. He recounts how the groundwork was laid years ago, lopping off potential challengers until the weakest one was left standing, details the post-primary ad blast that defined Angle permanently, and also goes into how Reid’s team never lost faith that their own internal polls (the same ones Ralston saw) were right and the public polls were wrong.

And then there’s the 2012 race, already fascinating, with the first question being whether the unpopular and impoverished John Ensign even tries to run again. The LVRJ looks at the four top Dem contenders and six potential GOP challengers as well, including (could lightning strike twice?) Sharron Angle. The article also looks at potential musical chairs and open seats in the House, given the imminent creation of a Dem-leaning NV-04 and the possibility of multiple House members running for Senate.

UT-Sen: One guy who shouldn’t feel too confident going into 2012 is Orrin Hatch, despite his state’s GOP lean: Bob Bennett’s death by teabagging is a huge red flag, and now a poll from Mason-Dixon for the Salt Lake Tribune has him at a 40% re-elect, with 48% saying “someone else.” (Of course, that 48% no doubt includes both Dems and Tea Partiers.) No head-to-head numbers in the general or primary, though.

VA-Sen: Jim Webb has sounded notably ambivalent about the prospect of a run for re-election in 2012; it’s also been evident in his fundraising so far. A recent interview has him still continuing that tone, say he’s “still sorting that out” and seeing him venting about the White House.

WV-Sen: I suspect this isn’t likely to have the desired effect, but it certainly can’t hurt them to ask: the GOP is already leaning on newly-elected West Virginia Senator Joe Manchin to change parties. They’re offering him his pick of committee assignments (in the minority, natch) and citing the difficulty of running downticket from Obama in 2012 in WV.

CA-Gov: Here’s a nice bit of early perceptions-setting: Jerry Brown has ditched the offer of swank transition headquarters on Sacramento’s K Street (apparently Sacto has its own K St. that serves a similar purpose?) in favor of keeping operations at his old campaign HQ in Oakland. Shades of the old Plymouth Duster from 35 years ago! (Although it’s worth noting that the Duster, though considered an econobox at the time, today holds a minor place in the muscle car pantheon.)

IN-Gov: So this Mike Pence for Governor thing may not be a done deal yet. Moving to Gov was clearly done with an eye toward an eventual run for President (as nobody, if you’re not named James Garfield, gets elected Prez straight out of the House). But he still seems to be gauging the possibility of a 2012 run straight from the House, buoyed by his popularity at the last Value Voters Summit and the lack of a dominant player in the current GOP field. He says he’ll make a decision by the end of the year.

MT-Gov: This small state will have a big gubernatorial race in 2012, with Brian Schweitzer term-limited. Former Republican Rep.-at-large Rick Hill has just announced he’s running; Hill served from 1997 to 2000 before retiring because of health issues which he says have been resolved. Two other GOPers, former state Sens. Corey Stapleton and Ken Miller, are also running; no Dem has thrown his hat in yet.

KY-AG: This could be an interesting matchup, of the Senate race that could have been. The Kentucky off-year elections are in just one year, and Trey Grayson (the SoS, and loser of the GOP Senate primary) is looking for a promotion of sorts, to AG. That would put him up against Dem Jack Conway (loser of the Seante general), who presumably will be running for re-election.

DGA: One committee that can feel pleased with its mild overperformance (not that -5 seats is a good thing, of course, especially what with the heartbreaker in Florida, but there was some definite beating of the spread going on here) is the DGA. Director Nathan Daschle lays it out in a memo that’s worth reading if you need something to feel good about, pointing out that the GOP’s gain is explicable purely by the races that the DGA didn’t financially contest (KS, MI, OK, TN, and WY).

Leadership: It looks like we can call off the Pete Sessions Deathwatch. He’ll be back for another term at the helm of the NRCC (after abandoning plans to run for majority whip, which looks like it’ll fall effortlessly to Kevin McCarthy). Whether he can maintain the NRCC’s gains this next cycle will be the real test of Sessions’ abilities; although he’ll get some aid from redistricting, there’s an awful lot of deadwood washed up on the beach that’ll need protecting. Also, John Cornyn will almost certainly also be back at the NRSC, eager to finish what he got halfway through this cycle.

Meanwhile, as we mentioned last night, the DSCC chair is the hot potato that no one, even Charles Schumer, wants to hold. The main unresolved issue for the Dems is the minority whip race, which pits Steny Hoyer and Jim Clyburn against each other in the #2 spot on the truncated leadership ladder in the minority. Surpisingly, it seems like Hoyer may (despite what looks like Nancy Pelosi efforts to box him out) be able to pull this out, given some crossover support from many members of Pelosi’s camp (notably Ed Markey and Jerry Nadler). Progressive Caucus leadership (like Lynn Woolsey and Raul Grijalva) has lined up behind Clyburn, though. Here’s one weird suggestion for breaking the stalemate (from Jesse Jackson Jr.): both should get out of the whip race, and co-run the DCCC together (which, with Chris Van Hollen out, is also without a head right now).

CT-Gov: Foley Concedes

The second-to-last gubernatorial race (with the exception of Minnesota) still outstanding has been wrapped up, with a graceful concession today from Republican Tom Foley in Connecticut:

Republican gubernatorial candidate Tom Foley conceded the race for governor to Democrat Dannel Malloy Monday afternoon.

After his legal team examined the results and his options through the weekend, he said, “the election on Tuesday was a conclusive victory for Dan Malloy and should not be questioned.”….

His team gave him two options, he said: to challenge the photocopied ballots in Bridgeport and six other towns that, he said, could change the outcome of the race; and to look for a recount and revote, “given the irregularities in Bridgeport and several other towns.”

But in the end, he said, “I am happy for Connecticut that, despite irregularities … there is no credible evidence of fraudulent voting.”

He said a “chaotic” situation in Bridgeport led to unreliable results, “but not from willful behavior.”

That comes on top of a concession last Friday from Bill Brady in Illinois in a similar nail-biter where the Democratic victory comes as a bit of a surprise. That leaves one Senate race (Alaska) and nine or so House races outstanding; we’ll have a more thorough overtime post later today.

One other concession happened today that’s worth mentioning, if only for its sheer douchiness (in a race that nobody was really considering “on the table” anymore): Ed Martin finally conceded in MO-03. His concession alleges all manner of voter fraud and electoral malfeasance (in the form purely of hearsay and conjecture), and, by the way, adds a short congratulations to Russ Carnahan somewhere there near the end.

Fair Redistricting California

EDIT: I thought I used the proper population estimate, but I didn’t, so I’ll have to do this over shortly.

Photobucket

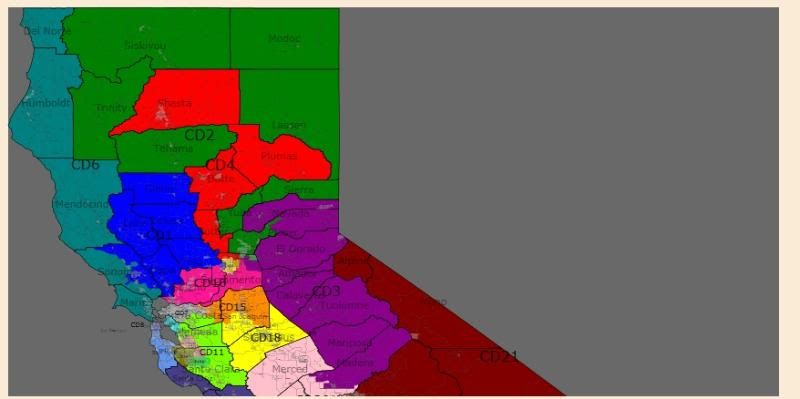
CA-1 (BLUE): Mike Thompson

Includes all of Colusa, Glenn, Lake and Napa Counties, along with portions of Yolo and Sonoma Counties. This district is about 50% different than his old one, but he’s still more than safe, as his district now includes Santa Rosa, as well as Davis and Napa, all heavily Democratic places. Probably about 60-65% Obama, maybe more.

CA-2 (GREEN): Tom McClintock

Includes Lassen, Modoc, Sierra, Siskiyou, Tehama, Trinity, Yuba and portions of Placer and Sacramento Counties. McClintock takes in much of rural California, because my goal was to consolidate most of those areas into one district (communities of interest). I would imagine this district would be around the same percentage that it was in 2008, 55% McCain.

CA-3 (Purple): Dan Lungren

Includes Amador, Calaveras, El Dorado, Mariposa, Nevada, Tuolumne and portions of Madera, Placer and Sacramento Counties. This district is very different that his former one, as it includes more rural territory and less of suburban Sacramento. I would say it around 55-56% McCain.

CA-4 (RED): Wally Herger

Includes Butte, Plumas, Sutter and Shasta Counties and portions of Sacramento County. This includes Herger’s base of Redding and his hometown of Chico. My goal was to consolidate the more populated parts of counties in these parts together. Estimated 56-57% McCain.

CA-5 (YELLOW GOLD): Doris Matsui

Contained in Sacramento County. Doris Matsui will be fine here, this district remains that same and would be around 68-70% Obama.

CA-6 (TEAL): Lynn Woolsey

Includes Del Norte, Marin and Mendocino Counties, along with portions of Sonoma. The North Coast should be in one district and that’s exactly what I did. Woolsey will not having any problems here, the district will still be 70% plus for Obama.

Photobucket

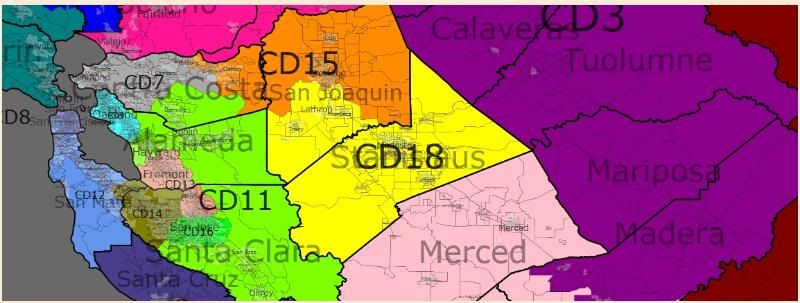
CA-7 (GRAY): George Miller

Contained within Contra Costa. My goal here was to clean up Contra Costa, give it more consolidation between districts. George Miller keeps Richmond, but add other interior areas, like Walnut Creek. Again, another Democratic incumbent with modifications, but still perfectly safe. 65-70% Obama.

CA-8 (VIOLET): Nancy Pelosi

Contained within San Francisco County. Not much change here, except the district covers more of San Francisco. 80-85% Obama.

CA-9 (LIGHT BLUE): Barbara Lee

Contained within Alameda County. This district is slightly different, as it includes Alameda and San Leandro in addition to Oakland and Berkeley. 80-90% Obama.

CA-10 (PINK): John Garamendi

Contains Solano County and portions of Yolo and Sacramento Counties. This is one of the biggest modifications I made. Garamendi’s district no longer sprawls and is now neat. My best estimate on this one would be 60% Obama, close to a good bellwether for the state.

CA-11 (LIGHT GREEN): Jerry McNerney

Contains portions of Alameda, Contra Costa and Santa Clara Counties. McNerney keeps all of the Alameda portion of his old district and most of the Contra Costa and Santa Clara parts, while shedding the San Joaquin portions. He picks up Hayward. I felt that this looked very compact compared to the old one. 65-66% Obama.

CA-12 (SKY BLUE): Jackie Speier

Contains portions of San Mateo County and a portion of San Franscisco. The biggest difference here is that Speier has more of San Mateo County, making for a much more compact district. 70%+ Obama.

CA-13 (SALMON): Mike Honda or Pete Stark

Portions of Alameda and Santa Clara Counties. Alameda County didn’t grow much since last census, so it was very difficult to retain CA-13. Pete Stark and Mike Honda would likely face off in a primary here, unless Stark opted for retirement. Either way, still a safe Democratic district, 70%+ Obama.

CA-14 (CAMOUFLAGE): Anna Eshoo

Portions of San Clara and Santa Mateo Counties. This district shrinks and is confined neatly within the Silicon Valley. 70%+ Obama.

CA-15 (ORANGE): OPEN

Portions of Contra Costa and San Joaquin counties. Stockton is finally contained within one district and the district overall is very compact. I’m not sure who would run here, but the district would be winnable for the right Democrat. 60% Obama, a pretty good bellwether.

CA-16 (BRIGHT GREEN): Zoe Lofgren

Contained within Santa Clara County. A nice compact district that takes in San Jose and some adjacent communities. 69-70% Obama.

CA-17 (PURPLE): Sam Farr

Includes San Benito and Santa Cruz Counties, along with portions Monterey County. This district in a compact form is slightly more Democratic than the old one. 70+ Obama.

CA-18 (YELLOW) : Dennis Cardoza or Jeff Denham

Includes portions of San Joaquin County and all of Stanislaus. Cardoza’s hometown is Atwater in Merced County, which I moved to CA-20, but CA-18 holds lots of his old territory. This district was only 51% Obama and it would be a swing one which he would likely face incoming GOP Rep. Jeff Denham in, since Denham’s old district was dismantled. Cardoza may opt to run in the new CA-15, which would be has more of a Democratic tilt or he could run in CA-20, if Jim Costa doesn’t maintain his seat or if he does, run against him in the primary.

Photobucket

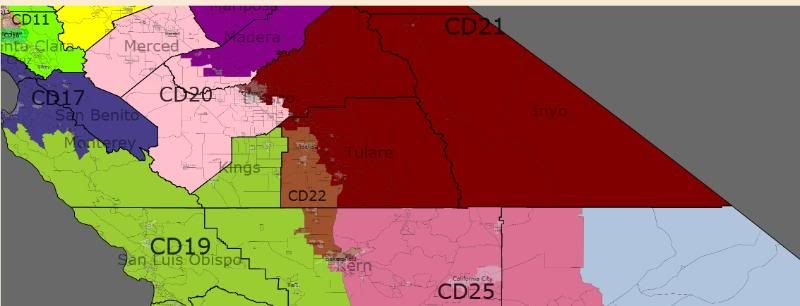
CA-19 (LIME GREEN): OPEN

Portions of Kern, Monterey and Santa Barbara Counties, with all of San Luis Obispo and Kings Counties. This district would about 51% McCain and 40% Hispanic, which would be a perfect fit for Abel Maldonado, who just lost the Lt. Gov’s race. North Santa Barbara County is hugely dysfunctional with South Santa Barbara County, so they’d be thrilled to have separate representation in Congress.

CA-20 (LIGHT PINK): Jim Costa or Andy Vidak

Portions of Fresno County and all of Merced County. Depending on how that race is decided, Costa would have a reasonbly safe district or Vidak would have one that wasn’t very favorable. I could have put Fresno in one district, but it would have been difficult to bring the sparsely populated places together in a compact way. About 58-60% Obama.

CA-21 (DARK RED): Devin Nunes

Portions of Fresno and Tulare Counties, plus Alpine, Mono and Inyo Counties. Not a drastic change, just sheds Visalia to CA-22 and picks up more of Fresno. Still about 56-57% McCain.

CA-22 (BROWN): Kevin McCarthy

Portions of Kern and Tulare Counties: Takes in most of Bakersfield and goes into Tulare and Visalia About 60% McCain.

Photobucket

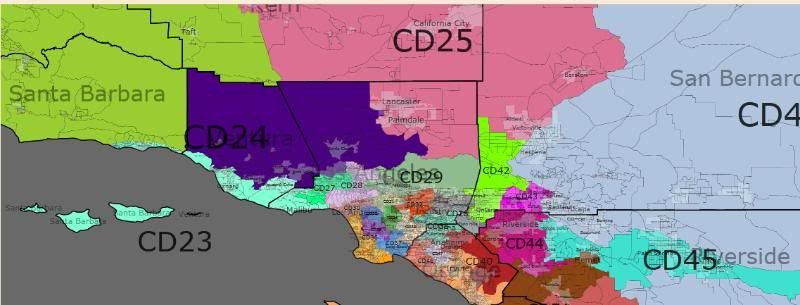
CA-23 (AQUA): Lois Capps

Portions of Los Angeles, Santa Barbara and Ventura Counties. I tried to make this district mainly coastal, while remaining compact and significantly smaller than the old one. The coastal cities have much of the same environmental and economic interests, while Thousand Oaks just ended up in there to balance out population. Probably about 60% Obama.

CA-24 (DARK PURPLE): Elton Gallegly

Portions of Los Angeles and Ventura Counties. I was worked very hard to make this one compact and put together places that made sense. Some parts of the San Fernando Valley are included. Probably about 50% or so McCain, maybe a little more or less.

CA-25 (MAGENTA): Buck McKeon

Portions of  Kern, Los Angeles and San Bernardino Counties. I wanted to create a High Desert district that consolidated the fast growing communities in these counties. I had bit of a hard time doing that, but I managed to pull it off. Probably around 54-55% McCain.

Photobucket

CA-26 (DARK GRAY): David Dreier

Portions of Los Angeles and San Bernardino Counties. This district is now quite different that it was before, including only a few areas from the old one and picking up Democratic voting Pomona. This part of Los Angeles County was very gerrymandered and this is how I best came up with how to undo it. 56% Obama.

CA-27: Brad Sherman

Portions of Los Angeles County. It pretty much stays the same, except for shedding some territory to CA-24 and not going into Burbank. 65%+ Obama.

CA-28: Howard Berman

Portions of Los Angeles County. Another one that is almost the same, it wasn’t difficult to make it compact without huge changes. 70%+ Obama.

CA-29: Adam Schiff

Portions of Los Angeles County. I included the entire city of Burbank in the district, as opposed to just half as in the previous map, along with some places from the old CA-26. Still probably 65%+ Obama.

CA-30: Henry Waxman

Portions of Los Angeles County. This one sheds parts of the San Fernando Valley and takes in more of Los Angeles. It looks much better and more compact than before. 70%+ Obama.

CA-31: Xavier Becerra

Portions of Los Angeles County. This district remains almost entirely within Los Angeles city limits and is still very Hispanic. Well over 70% Obama.

CA-32: Judy Chu

Portions of Los Angeles County. It shrinks some in size, but keeps much of the same territory. 60%+ Obama.

CA-33: Karen Bass

Portions of Los Angeles County. Now contained mostly within Los Angeles city limits, with most of the same territory. 80% Obama.

CA-34: Lucille Roybal-Allard

Portions of Los Angeles County. East Los Angeles and outlying communities, very Hispanic. Probably well over 75% Obama.

CA-35: Maxine Waters

Portions of Los Angeles County. Compton, Gardena, Hawthorne, Inglewood and some parts of Los Angeles. 80%+ Obama.

CA-36: Jane Harman

Portions of Los Angeles County. This district is about the same, except it consolidates the South Bay and Palos Verdes Peninsula. 60%+ Obama.

CA-37: Laura Richadson

Portions of Los Angeles County. This Long Beach dominated district doesn’t change much, except for removing Compton and adding some other communities in it’s place. Still 75%+ Obama.

CA-38: OPEN

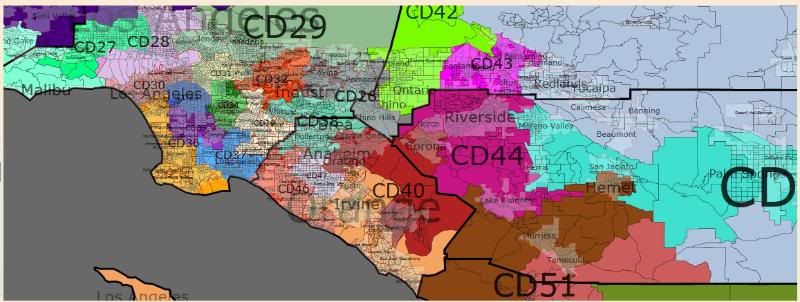
Portions of Los Angeles and Orange Counties. This district was one of the most egregious gerrymanders. I broke up lots of territory and shifted other places. I formed the new CA-38 from Brea, Buena Park, Diamond Bar and Fullerton, along with some portions of Anaheim. Seeing as current 38th district holder, Grace Napolitano, is from Norwalk, which is in the 39th district now, and that this new 38th is an even PVI, she might attempt to primary Linda Sanchez or, shift to CA-26, which now includes the anchor of the old CA-38, Pomona. Republicans Ed Royce and Gary Miller’s hometowns are both in this district, so they could obviously run here, but might face stiff competition from a competent Democrat. They may opt to run in the new CA-40, which is heavily GOP. Overall, the district would be about 53% Obama.

CA-39: Linda Sanchez

Portions of Los Angeles County.  Another gerrymander that I opted to undo. This one is now a proper Gateway Cities district and looks more sensible. Probably still well over 60% Obama.

CA-40: OPEN

Portions of Orange and Riverside Counties. This was almost a leftover’s district, but I didn’t compact it well. It takes in strongly Republican Orange and Yorba Linda, along with Corona. I think all these areas would have a reasonably similar median income, so the pairings make sense. Ed Royce, Gary Miller and Ken Calvert would likely face off here in the primary. 56% McCain.

Photobucket

CA-41: Jerry Lewis

Portions of Riverside and San Bernardino Counties. It basically keeps it’s population centers, but wraps around and picks up more lightly populated parts of Riverside County. 56% McCain.
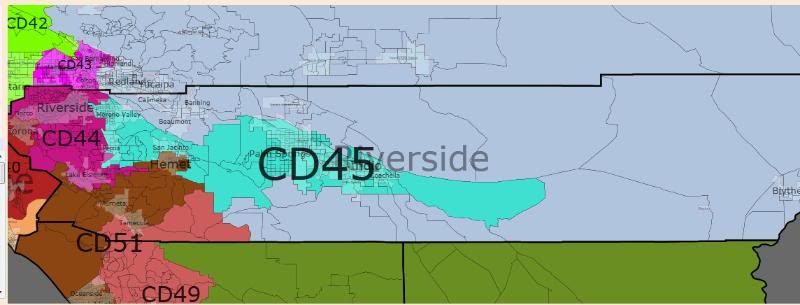
CA-42: OPEN

Portions of Los Angeles and San Bernardino Counties. I had couldn’t get the population just right with this one, but by my estimation, it would be right on the mark or close with these lines under the new census numbers as there has been lots of growth around these parts. This district is 49% Hispanic. It pairs Democratic voting Ontario with Republican Rancho Cucamonga and Chino. About 52-53% Obama.

CA-43: Joe Baca

Portions of San Bernardino County. More or less the same as it was before, but with big population growth, it would shift some of it’s territory to CA-42 and even out it’s population. Still would be 60%+ Obama.

CA-44: Ken Calvert

Portions of Riverside County. The City of Riverside, plus Norco and Lake Elsinore forms the new CA-44. Ken Calvert could try his luck here, but without Corona and the parts of Orange County from his old district, he’d likely lose to Bill Hedrick. It’d be easier for him to try his luck in the CA-40 primary, where he may have an edge with his hometown of Corona.

CA-45: Mary Bono Mack

Portions of Riverside County. This one shrinks down, confined strictly to a few communities. I combined Indio, Moreno Valley and Palm Springs for the population anchor, with smaller places like Perris and Coachella. Without Hemet and Murrieta, Bono Mack would be at a disadvantage. She could try her luck in CA-41 against ethically challenged Jerry Lewis. Steve Pougnet would be able to win this incarnation of CA-45, as it’s about 56% Obama.

CA-46: Dana Rohrabacher

Portions of Los Angeles and Orange Counties. Combines Huntington Beach and Newport Beach, along with other communities in that corner of Orange County. I estimate it’s about 55% McCain.

CA-47: Loretta Sanchez

Portions of Orange County. I made it slightly more compact, by adding more of Garden Grove. It’s about the same as before, although a bit less Obama than before, around 59% now.

CA-48: John Campbell

Portions of Orange County. Costa Mesa gets added to this district, as well San Clemente. About 50% Obama now. Might be promising for a Democrat in the future.
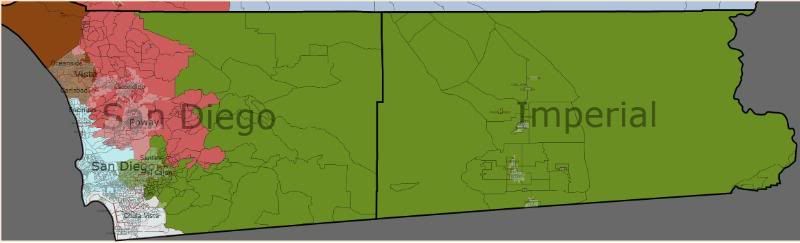
Photobucket

CA-49: OPEN

Portions of San Diego and Riverside Counties. Although Issa is from Vista, much of his old district is here. It’s very Republican (55% or more McCain) and he would have no problems, but he’d probably run in CA-51.

CA-50: Susan Davis

Portions of San Diego County. There was a lot of gerrymandering in these parts too, so I undid it and now Davis takes in about half of her old territory and a lot from CA-50. It’s a few points less Obama than her old district (probably about 63%), but she shouldn’t have any problems here.

CA-51: Brian Bilbray or Darrell Issa

Portions of Riverside and San Diego Counties. Bilbray and Issa may face off here, or one may opt for the new CA-49. Around 55-56% McCain, maybe more.

CA-52: Duncan Hunter Jr.

The whole of Imperial County and portions of San Diego County. My push for compactness made this one less Republican than it originally was, which wasn’t my intention. I wanted to make the lines that split San Diego looks more even and stick Imperial County in neatly, which resulted in a district that voted very narrowly for Obama. It would still have Republican lean, but be a lot more swingy.

CA-53: Bob Filner

Portions of San Diego County. Sheds Imperial County and picks up more of San Diego and Imperial Beach. Likely still around 60% or so Obama. Filner would be fine here.

The 10 best (and five worst) campaigns of the 2010 cycle

So here we are at the end of the 2010 race (well, almost at the end – there are still a couple of uncalled races). These are my picks for best and worst campaigns of this cycle. What are yours? And tell me if you agree or disagree with any of these

BEST CAMPAIGNS

Harry Reid – NV-SENATE This was a masterpiece, one of those campaigns that will be studied for decades as an example of how to win in a negative environment. Reid’s ads were brilliant, his strategy was forward thinking (i.e. he started knocking out potential opponenents in 2008) and he did a great job with GOTV and the other essentials. Yes, he got lucky in his opponent (and very unlucky in the cycle he was running), but given how at one point it looked like the Republicans could run a ferret against Harry Reid (oh wait, I guess they did) and still win, this still was an amazing comeback story.

Ron Johnson – WI-SENATE Yes, Feingold had underperformed in the past, but he had also survived a Republican year in 2004, and his outsider cred had beaten Republicans three times before. But Johnson ran a canny campaign that turned Feingold into a Washington insider, and managed to pull the biggest upset of an incumbent Senator of the cycle.

Rick Scott – FL-GOVERNOR This one pains me, because I think Scott is a loathsome individual. But the fact of the matter is, to get such a loathsome individual across the finish line against an incumbent Attorney General and the respected CFO of the state, you have to have a pretty good campaign. Best move: tarring Sink with the same corruption brush that had been used against Scott, even though the cases weren’t even close to similar.

National Republican Campaign Committee The NRCC and Pete Sessions got ridiculed a fair amount on this site and others for their poor fundraising compared to the DCCC, but it turns out they were probably the smartest of any of the big campaign committees, opening up new opportunities throughout September and October. They certainly outperformed the more respected RGA.

Barbara Boxer – CA-SENATE Boxer is thought to be in trouble every campaign cycle, and everytime she outperforms expectations. Give the woman some respect.

John Kasich – OH-GOVERNOR Yeah, Portman blew his opponent away, whereas Kasich race was much closer, and yes Ohio’s economy is in the crapper, but he still had a tough job in beating Ted Stickland, who’s unpopularity never reached the level of some other Midwestern governors. Along with Scott’s win, the biggest victory (in terms of influence) for the Republicans on election night.  

Marco Rubio – FL-SENATE Rubio showed some mad (and for us Dems, potentially scary) political skills in first driving Crist out of the Republican party, and secondly, beating both his opponents with just under 50 percent of the vote.

Bob Dold – IL-10 It’s hard to single out one House campaign as being better than the others in a wave year, but Dold won a seat almost none of the pundits thought he could win, and (with Costa apparently holding on) pulled off the most Democratic seat of the cycle. Gotta give the guy props for that.

Lisa Murkowski – AK-SENATE (write in campaign only). Murkowski ran one of the worst campaigns up until the primary, but the fact she seems about to win as the first write in candidate for Senate since the 1950’s is pretty amazing, and deserves some credit.

Ben Chandler One of the few Dems to survive Tuesday’s apocalypse. In a R+9 district, no small feat.

WORST CAMPAIGNS

Meg Whitman, CA-GOVERNOR How could you spend so much money, and lose so badly?

Lee Fisher, OH-SENATE Fisher’s campaign was basically all downhill after he won the primary.

DCCC We all loved Chris Van Hollen after the 2008 cycle, but I think he made a huge strategic error in not cutting more Democrats loose when he realized how bad the wave was going to be.

Alan Grayson, FL-08 One last thing to say about Grayson – when is the last time a Democrat was responsible for the most sleazy, misleading ad of the campaign?

Jim Oberstar, MN-08 Of all the committee chairs to lose this cycle, Oberstar was the only one to lose in a Democratic district (according to PVI). He should have seen this one coming.  

Ohio Congressional Districts In 2012 – A GOP Centric POV

So as you all have probably heard, a dark red tide has washed over Ohio in last week’s election.  We lost ALL of the state wide races that were up (six out of seven were up).  We lost five congressional districts, two state senate seats and 12 state house seats (with two more going to automatic recounts).

Our company lost three state rep clients and may lose one more based on an automatic recount.

A bloodbath.

But things CAN get worse.

Currently we have 18 congressional districts here in Ohio but we are likely to lose two of these in next years redistricting.  Not only that, but the GOP now controls all aspects of redistricting Ohio for both Congressional seats and for state legislative seats.  

Keep in mind that while we’re down to five congressional seats, we were one Nazi uniform wearing idiot (OH-09) and one double rape charge idiot (OH-13) away from only having three Dem seats coming out of this election. Dem share in OH-09 went from 74.37% down to 59.01% and it went from 64.55% down to 55.46% in OH-13 from 2008 to 2010.

Using Dave’s redistricting tool, I took a stab at what 16 districts could look like if the GOP really turns the screws and tries to maximize GOP seats.

Combining state house voting patterns, the demographic info on the redistricting tool and my knowledge of Toledo and Columbus, I believe the only reliably Democratic district is the dark blue one in Cuyahoga county.  It is majority minority (42% white) as required by the voting rights act.

As for other city centers, Toledo is split down the middle based on my knowledge of the neighborhoods.  I think I defused the rest of Cuyahoga county fairly well but some of the greater Youngstown area is in the dark purple district.  Hard to say here.  A lot of the African American population is in the green district (can’t see partisan breakdown but can see demographic) which is separated into the more affluent parts of Cuyahoga county.

Franklin county is in four pieces, each one reaching out to LOTS of rural areas.  The salmon colored district at the western part of Franklin County (the more GOP parts of Dublin, Hilliard and Grove City) stretch to take in the more urban parts of Montgomery County which central area is broken into both the salmon and the olive green districts.  The light green part of Montgomery county (which are more affluent) curves down to get some of the urban parts of Hamilton county, leaving the remaining parts of that in the slate blue district.

The population breakout is within tolerance based on my knowledge of how this works.  Each district (based on 2008 population data) is to have 717,869 people.  The highest deviation is -926 and the lowest is +5.

Mapping the exit polls: Obama job approval and Democratic favorability

So I was browsing through the exit poll results, as one does after an election, especially one gone badly wrong. And I thought I'd map out some of the state-by-state results. (I really hope someone else here hasn't already been doing this; if so – my apologies.)

Arguably, part of the usefulness of exit polls is that they are a kind of substitute for regular opinion polls, just with a massively larger sample, and conducted strictly among actual voters, rather than a likely or registered voter screen. So what did they say about Obama's job approval? And what did they say about how the voters looked upon the Democratic and the Republican Party?

Moreover, what do those things look like on a map? Because you need maps. Maps are cool.

According to the national exit poll, with some 17,5k respondents, a combined 45% of voters somewhat or strongly approve of how Obama is handling his job as President.

I thought this was surprisingly high. After all, the population that turned out to vote was a relatily hostile selection: only 45% of the voters said that they had voted for Obama in 2008, while another 45% said they had voted for McCain. So you would expect that these voters approved less of Obama than a wider registered voter or voting-age population sample would. Yet the 45% approval rate the exit poll found is right in line with what opinion polls have been finding since July.

The national exit poll found that 43% of the voters had a favorable opinion of the Democratic Party. Almost the same share, 42%, had a favorable opinion of the Republican Party. Those numbers are roughly in line with what the last two polls on the question that are listed at Polling Report, by CNN and CBS, found. Those found a 46% favorability rating for the Dems, and 44% and 41% ratings for the Republicans.

While job approval and favorability aren't the same thing and Obama's favorability rating would probably have been a couple of percentage points higher, I still thought it was striking that these three numbers are so close to one another.

How do the numbers vary from state to state (here's Arizona)? I tabulated the values for these questions for all the states that were covered in the exit poll in a Google Docs spreadsheet.

I used the Google Charts Wizard to create the below maps. They're really, really plain. Annoyingly, I didn't figure out how to include legends. Or titles for that matter. If someone knows how to tweak the URL to include them, or has a better easy mapping tool to suggest, thank you very much! Some of you guys make amazing maps. (I tried Manyeyes, but its color range doesn't quite work for these values, other than in the bottommost map; plus, ManyEyes and SSP don't work well together, since SSP doesn't accept the "style" tag).

Obama job approval:

Obama job approval by state, according to 2010 exit polls

In lieu of a legend: basically, I set bright green to reflect a 33% approval; yellow to relfect a 50% approval; and bright red to reflect a 67% approval.

There is only one state that falls just outside this range: West-Virginia, where Obama's job approval among mid-term voters was in the tank at just 30%. I set bright blue to reflect a 17% approval, so that's why WV appears as a blueish green.

Democratic Party favorability:

Democratic party favorability by state, according to 2010 exit polls 

I used the same colour range as above, so they are directly comparable. This does mean that this map doesn't have a lot of color range. First off, in some of the states with the highest Obama job approval (VT, NY, HI), this question wasn't asked. Secondly, interestingly, opinions about the Democratic Party are less polarized.

In some of the states with a high Obama job approval (CA, OR, DE), opinions about the party were less favorable. Whereas in some of the states with a low Obama job approval (IN, KY, AR, and above all, WV), the party was viewed more favorably. So it all levels out a bit more.

The Manyeyes mapping tool did do a good job in neatly illustrating this contrast. Where does Obama's job approval outdo the party's favorability rating, and where is it the other way round?

Ae3b88b2-eaaf-11df-a03e-000255111976

In short, the West likes Obama better than it does the Democratic Party; but the Appalachian Midwest (for lack of a better label) probably doesn't, even taking into account the apples/oranges aspect of comparing job approval and favorability. West-Virginia really doesn't. While Obama's job approval, as noted, is down at 30%, the Democratic Party's favorability rating is up at a decent 45%. That 15-point difference compares to difference of at most 7 points in all the other exit poll states.

I want to do more maps focusing on exit polls results on opinions about the Tea Party; the shares of the electorates identifying themselves as liberal and conservative; opinions about the health care law; the Democratic share of the white electorate with under and over $50,000 incomes; and opinions on whether the government should do more or is already doing too much. Please warn me if this has all already been done. 🙂

Optimistic Take On Minnesota’s Political Future

Shocking as it may be to see an expression of optimism from me, I’m gonna do exactly that regarding Minnesota’s political future for Democrats.  Particularly now, less than a week after the DFL supermajorities were transformed into Republican majorities in the state legislature, this may seem counterintuitive, but having crunched the numbers over the past five days, I feel as though the condition of the state’s politics is less troublesome that it may look from an outsider’s perspective.

Bad news first.  The DFL got vaporized in the legislative races.  This is effectively the fourth wave election out of five with the current legislative district lines and to an extent, should have been predicted.  Back in 2002, after months of feuding over redistricting between the DFL Senate, the Republican House, and the Independence Party Governor, the stalemate was broken when the process was handed over to a nonpartisan panel of judges.  They drew up a genuinely competitive map that proved to be very volatile to the political mood of the time.  In 2002, shortly after the Wellstone memorial debacle, the GOP scored a supermajority in the House and came within two seats of taking over the Senate.  In 2004, in a generally neutral political climate, Democrats shocked everybody and gained 13 seats, one short of a majority.  In 2006, a Democratic tsunami hit Minnesota and they ended up with massive and unsustainable gains deep into red territory.  With just the House up in 2008 and the wind still at the their back, Democrats gained a few more seats.  

We were overdue for a correction in 2010, but it was largely than even I suspected.  Looking at the breakdown of legislative races, however, it really shouldn’t have been that big of a surprise.  With the current district lines, the vast majority of terrain in rural and suburban Minnesota consists of districts that fall somewhere between the range of 52-48% DFL advantage and 52-48% GOP advantage.  Just the slightest of breezes is enough to trigger dramatic change, and this year’s Republican tide was far more than just a slight breeze.  As a result, there were few surprises among the legislators that were felled, and as usually happens in wave elections, just about all the close races went to the party on the winning side of the wave.  

The unfortunate and obvious downside is that the Republicans will now commandeer redistricting.  Dayton, likely the next Governor, will veto anything too overreaching, provided Pawlenty doesn’t follow through with his “martial law” gambit while the Republicans delay a recount.  I wouldn’t be surprised if the end result is another nonpartisan judge-drawn redistricting plan, most likely resulting in another 10 years of dramatic swings from left to right and back in Minnesota’s local politics.  Sadly, however, we blew our chance to get rid of Michele Bachmann as the new legislature will never agree to a map that doesn’t keep her safe in her exurban cocoon.

So what gives me cause for optimism?  There were four statewide races in Minnesota this year and the Democrats won all of them, even with a weak-performing Mark Dayton at the top of the ticket.  Three of the four races were close, and frankly I’m surprised the DFL held onto both the Secretary of State’s office and especially the Auditor, but they stayed in the Democratic fold because population centers Hennepin and Ramsey Counties continue to harden for Democrats.  I’ve always considered second-ring Hennepin County suburbs Bloomington and Minnetonka to be Minnesota’s bellwethers.  If the DFL candidate wins them, they win the state.  All four statewide DFL candidates were victorious there in a year where conventional wisdom was they’d lean Republican.  When Democrats are winning Hennepin County by more than 15 points and Ramsey County by more than 25 points, as occurred this year in every statewide race, it’s a herculean lift for Republicans to make up that much elsewhere.

Aside from Hennepin and Ramsey Counties, two other places stand out as cause for Democratic optimism.  The first is suburban Dakota County in the southeastern metro area and the third most populous county in Minnesota.  It’s historically been a swing county, became more Republican than the statewide average last decade, but now seems to be slowly moving back to the center.  Republicans did win here in 2010, but by nowhere near the size of the margins they did back in 2002.  In the close Mondale vs. Coleman Senate race, Coleman won Dakota County by 16 points.  In a similar close race this year, Emmer was only able to win Dakota County by 9 points, which is comparable to what both Pawlenty scored in his 2006 re-election and what Coleman beat Franken by in the 2008 Senate race.  Largely due to the rising ethnic diversity in Dakota County, it now seems as if the Republican ceiling in the county is a nine-point victory, and in the other three statewide races, the Democrat won there in the Attorney General’s race, and the Republicans were victorious in the other two with four-point margins.  It’s almost impossible to win statewide in Minnesota as a Republican if you’re only winning Dakota County by four points.

Next on my list of causes for optimism is Rochester, now Minnesota’s third largest city.  It’s a city that is historically the Republican stronghold of the state but in the past 10 years, demographics have been pushing it to the left.  It’s population is exploding with young educated professionals as well as ethnic minorities, and is now pretty close to being a 50-50 town.  Now old-school GOP moderates can still do very well here, even among the newcomers, but as the Republican Party continues its deranged march to either social conservatism or economic Know-Nothingism, Rochester won’t be around for the ride, at least not with the numbers it has been historically.  Tim Pawlenty represented this decade’s high-water mark for Republicans in Olmsted County, winning the county by 17 points in 2006.  Emmer won it by 10 points.  That’s nothing to sneeze at, but in a Republican year, I would have expected Emmer to overperform Pawlenty’s numbers in a Democratic year.  Furthermore, I haven’t yet crunched the numbers exclusive to the city of Rochester, which is typically several points less Republican than Olmsted County at large.  Based on the numbers I’ve seen in Greater Olmsted County, I’m betting the city of Rochester itself was no better than a five-point win for Emmer.  And like Dakota County in the last paragraph, if a Republican is winning Rochester by only five points, an inside straight is required to come up with the votes in the rest of the state necessary to win a statewide election.

Exurbia continues to be a big problem for Democrats in Minnesota, but less of a problem than I anticipated it to be in 2002 and 2004 when it looked as though the growth in exurban Minnesota would be endless and the raw numbers of new Republicans would ultimately swamp Democrats.  Since 2004, however, the housing bubble has burst and the blistering growth rates in these Twin Cities collar counties have slowed.  And with the slowed population growth has come a stalled Republican insurgency.  Emmer is the perfect exurban candidate if there ever was one.  He’s from the heart of Michele Bachmann country out in Wright County and espouses the “we got ours…to tell with the rest of the state” ethos articulately.  Yet he didn’t overperform Pawlenty in these areas, at least not by much.  And the Republican margins in the other three statewide offices were on par with traditional voting patterns even in a strong Republican year.  Unless these counties become even more Republican and restore their growth rates from the early part of the decade, the GOP’s ability to win statewide races will be diminished.

Outstate Minnesota was pretty much split again this year, although leaning towards Republicans perhaps a little more than usual.  The 2000 election was the ugliest showing outstate Minnesota gave Democrats in my lifetime, with Bush burying Gore in counties where Democrats frequently win by double-digit margins.  Nowhere did we see Democratic candidates perform that poorly in 2010, and if Democrats are performing generally on par with recent trendlines this year, it bodes well that rural Minnesota is not gonna undergo the same rightward transformation that rural Missouri did anytime soon.

I can’t finish the diary with commenting on the state of affairs in northeastern Minnesota, one place where I maintain some pessimism.  As I feared, a perfect storm finished off Jim Oberstar.  His district has been slowly trending Republican for a generation now but has still been virtually impossible for a Republican to win even in the most perfect situation up until now.  With that said, Oberstar underperformed all four statewide DFL candidates in the 8th district, all of whom won the district.  In Dayton’s case, his victory is the direct result of overperformance in northeastern Minnesota.  With MN-08’s growth zones becoming more Republican by the day and it’s Democratic strongholds losing population, it’s not a good sign for the Democrats’ prospects in snuffing out Oberstar’s successor Chip Cravaack.  The great white hope is legislator Tony Sertich, but he’s a native Iron Ranger who will run with the baggage of the Minnesota Legislature and is a native Iron Ranger which isn’t gonna be an asset in the south side of the district.  State Senator Tony Lourey from further south in the district might be a better bet, at  least demographically.  Either way, it’s an almost certainty that the district will inherit even more Republican areas after redistricting, so it could well take a Democratic wave to install another Democrat in the Congressional seat, and his or her hold on the seat will most likely be far tenuous than was Oberstar’s.  

Generally speaking, the Democratic Party looks poised to have the upper hand in Minnesota, although by far narrower margins than in its 1970s and 1980s heyday.  But interestingly, as the state becomes less lopsided in its Democratic advantage, it’s strangely harder for a Republican to win a statewide election than it was back in the days when Dave Durenberger and Rudy Boschwitz were winning handily.  In the very long-term, if my predictions of a political realignment almost exclusively on generational and ethnic lines comes to pass, then all bets are off and majority white Minnesota could very well turn crimson red.  For the foreseeable future, however, I like my odds running as a Democrat in Minnesota much more than I would running as a Republican.