Who Should Succeed Bob Menendez as DSCC Chair?

The Hill is reporting that John Cornyn will likely seek to stay on for another term as head of the NRSC. That of course raises the question of who will lead our senate campaign committee next cycle. It’s not just that I think Bob Menendez did an ineffectual job as DSCC chair – the guy is also up for re-election in 2012, and it’s hard to balance both jobs. (Click here to see who else is up.)

So who should lead the DSCC?

UPDATE: In comments, TheGradyDem passes along a link from Politico, in which a whole host of Dems say they aren’t interested in the job.

LATER UPDATE: Chuck Schumer doesn’t sound particularly interested

Bipartisan Redistricting in Virginia

With the election over, I thought I’d take a stab at what a bipartisan incumbent protection map might look like in Virginia. The plan is to protect all 11 incumbents; the only district that would likely be competitive in an open seat situation under this map is VA-10.

Click for huge.

VA-01 (Rob Wittman – R) – Hasn’t changed a whole lot; takes in some more of Prince William, loses part of Stafford/Spotsylvania, and adds the two Eastern Shore counties (they were in VA-01 prior to the 2000 map).

VA-02 (Scott Rigell – R) – Snakes up the shore to take in some Republican territory (Poquoson, parts of York and Gloucester), picks up the VA-01 bit of Hampton, and loses the Eastern Shore. Should move the needle to the Republicans by a couple points.

VA-03 (Bobby Scott – D) – Takes Petersburg out of VA-04, mostly unchanged. 62% black.

VA-04 (Randy Forbes – R) – Also not changed a whole lot, aside from losing Petersburg, which should flip the district to McCain.

VA-05 (Robert Hurt – R) – Removes Charlottesville and most of Albemarle, adds the rest of Bedford, Lynchburg, and Amherst. Should be no trouble at all for the Republicans to hold now.

VA-06 (Bob Goodlatte – R) – Snakes up from Roanoke, where Goodlatte lives, through the Shenandoah Valley, and pulls in Charlottesville and Albemarle and some outer NoVa counties. Shouldn’t endanger Goodlatte.

VA-07 (Eric Cantor – R) – Actually a little less ridiculous now, it’s a solidly-Republican suburban Richmond/Fredericksburg area district. Still should be solidly Republican.

VA-08 (Jim Moran – D) – Remains solidly Dem; continues to hold the trifecta of Alexandria, Arlington, and Falls Church, but goes west instead of south. Maybe a couple points less Democratic, but still a safe D district.

VA-09 (Morgan Griffith – R) – Not much changed here; added Salem, Martinsville, and some more of Roanoke County. Safe R.

VA-10 (Frank Wolf – R) – Added almost all of Shenandoah County, and removes some parts of Fairfax. Retains the most Republican parts of Fairfax. Safe for Wolf, should lean Republican in an open seat, unless it’s a particularly good Dem year.

VA-11 (Gerry Connolly – D) – Replaces the Republican PW County parts with the solidly-Dem SE PW County. Should be a pretty safe Dem seat.

A Regional Party Limited to the South: The Democrats in the 1920s, Part 1

This is the first part of three posts analyzing the Democratic Party’s struggles during the 1920s, when it lost three consecutive presidential elections by landslide margins.

The second part can be found here.

A Regional Party Limited to the South

The biggest presidential landslides are two elections you’ve probably never heard of: the 1920  presidential election, and the 1924 presidential election.

More below.

In the 1920 presidential election, Democratic candidate James M. Cox lost by 26.2% to Republican candidate Warren G. Harding. Four years later, Democratic candidate John Davis would get barely more than one-fourth the vote in another landslide defeat. These two elections constitute the biggest victories in the popular vote in the history of American presidential elections.

In the aftermath of President Barack Obama’s victory, Democratic strategists liked to boast that the Republican Party was becoming a regional party restricted to the South. This meme has become less popular in light of Republican gains during the 2010 mid-terms, in which Republicans did quite outside the South (especially in the Midwest).

Yet during the 1920s, the Democratic Party really was a regional, Southern-based party that had great difficulty competing outside the South. It was a party that was completely unrecognizable today: a proudly racist, white supremacist organization in which its two main constituencies refused to back the same candidate not for one, not for two, but for three consecutive elections.

The story begins with World War I and President Woodrow Wilson.

— Inoljt, http://mypolitikal.com/

Dodging a Bullet: Oregon 3-2

As we all know, Republicans very, very narrowly fell short of taking the governorship of Oregon. Oregonians instead opted to send former Gov. John Kitzhaber back to the governor’s mansion over Republican Chris Dudley, best known for playing basketball.

Republicans also came extremely close to capturing slim majorities in both the State House and the State Senate. The State House is now evenly split, while it appears Democrats will hang onto a majority of one or two in the Senate.

If Republicans had garnered just another point in the statewide popular vote, it seems likely they would have flipped both houses of the Oregon state legislature and installed Chris Dudley as governor, giving them a trifecta in the Beaver State. As a left-leaning independent and an Oregonian expat, let me just take a moment to editorialize by way of gagging.

With redistricting coming up, Republicans could have taken control and gerrymandered Oregon, provided they could agree on a map (otherwise, Secy. Kate Brown, Oregon’s Democratic secretary of state, would have been constitutionally empowered to draw one up – which, as it is, puts considerable pressure on Republicans to compromise with Democrats). Here’s one they might have liked.

I’ve done what any self-respecting, all-powerful Republican trifecta would do, and I’ve just handed Democrats the Willamette River Valley while giving Republicans two seats in the rest of the state.

There should be little controversy about the Portland metropolitan area. The new OR-01 I’ve drawn would have been, if Republicans had won and drew this map, one of the most Democratic districts in the entire country; Rep. Blumenauer’s Republican opponent, Delia Lopez, picked up three percent of the vote in the portion of Multnomah County in Blumenauer’s district, currently OR-03. Note: I spent so much time playing around with the district lines that some of the district numbers are mixed up.

OR-01 here includes some of the most liberal parts of Clackamas County, including Milwaukee. Rep. Blumenauer would thrive here, obviously.

As for OR-05, it includes most of Portland’s western suburbs, as well as some of the most swingy parts of Clackamas County. It’d probably be a Democratic district, but an Oregonian answer to Reps. Reichert or Tiberi might be able to flip it in a good year.

I originally had OR-05 reaching up into Columbia County to encompass St. Helens and Scappoose, but I decided against it. They were instead awarded to OR-04, which thus holds the entire Oregon Coast. OR-04 also reaches inland to western Washington, Yamhill, and Polk counties. It’s almost entirely rural, and despite Astoria and a few other lean Democratic cities in northwestern Oregon, it would be safely Republican.

The reason OR-04 would be safely Republican is simple: Eugene has been gerrymandered into a district with the lean Democratic cities of the Willamette River Valley, including the capital of Salem and its suburbs. Conservative Albany is left to OR-04. Because of the way OR-03 is drawn, it would be a pretty safe Democratic district, especially considering the surging Latino population in and around Salem.

OR-02, currently Rep. Walden’s district, remains safely Republican, soaking up the swingy population centers of Bend, Medford, Ashland, and Hood River with the entirety of hard-right eastern Oregon, as well as most of fairly conservative central and southern Oregon.

In plain speech, OR-02 and OR-04 would be safely Republican, while OR-01, OR-03, and OR-05 would be Democratic. Definitely a good thing Republicans didn’t manage to take over Salem this year.

BONUS: Just for kicks, here’s a picture of the way I originally gerrymandered OR-03:

I decided Bend would be fine in OR-02 and it would be best to keep the district more compact and inclusive of the Salem suburbs, not just the I-5 corridor down the Willamette River Valley. The way this district is drawn would force OR-03 to spill into Clackamas County. While it’s funny (and hideous), I decided it wasn’t practical.

CA-AG: Looking Bad for Kamala Harris

Update: A few more counties have added results, Harris’s deficit has grown to 36,800 votes. This was a result of 85,000 new votes in Orange, 17k in Riverside, and 35.5k in San Francisco. I’ve subtracted these from the “unprocessed” totals, and the new projection says Harris stands to gain 1,500 in the remaining ballots uncounted.

However, there is a time gap between the ballots outstanding estimate and the number of votes counting – more likely than not, we’re overestimating the number of Orange, San Diego, and Riverside ballots outstanding – which of course means that Harris has more upside potential in the remaining ballots.  We’ll keep a close eye on the situation and will update accordingly as more data are released tomorrow.


As of last update, San Francisco DA Kamala Harris (D) is trailing Los Angeles County DA Steve Cooley by 22,817 votes out of 7,659,341 counted so far.

According to the Unprocessed Ballot Report (PDF), there are still 2,342,664 ballots uncounted. Sidenote: Don’t you love Debra Bowen and what she’s done with the SoS’s office? Susan Bysiewicz, take notes!

What does this mean?

Well, we can analyze the relative composition of the remaining outstanding ballots, and the news isn’t the best for Harris.

Harris’ statewide weighted average performance for the unprocessed ballots (weighted by the number of votes outstanding) is 45.55% to Cooley’s 45.95%. This is actually a notch down from the 45.64% Harris has received in all counties so far.

This is mostly due to a large number of outstanding ballots in San Diego and Orange Counties. While LA, SF, Alameda, Santa Clara, and Contra Costa will help to offset this, they will be offset by Riverside, San Bern, and also possibly death-by-thousand-cuts in the various counties in the Central Valley.

From this – provided we assume that unprocessed ballots break down the same as the counties they are from thus far – we can estimate that Harris is on pace to fall another 9,486 votes behind Cooley.

For Harris to overcome her 23k deficit, we can also say that Harris will need to do 0.69% better among the uncounted ballots than she has thus far.

Here are the top 12 counties that will pad Cooley’s margin:


County Total Harris Cooley Unproc Harris Cooley Margin
Orange 683,073 208,780 416,466 233,196 71,276 142,178 -70,902
San Diego 639,695 246,542 335,071 240,000 92,497 125,712 -33,214
Kern 116,811 31,861 73,293 65,200 17,784 40,910 -23,126
Fresno 127,070 45,013 72,289 79,748 28,250 45,368 -17,118
San Bernardino 341,011 127,276 179,477 99,000 36,950 52,105 -15,155
Riverside 427,254 155,953 236,923 78,100 28,507 43,308 -14,801
Placer 107,703 31,998 66,112 28,056 8,335 17,222 -8,886
Stanislaus 110,462 41,587 59,205 40,430 15,221 21,670 -6,448
Ventura 209,561 81,543 112,402 40,279 15,673 21,604 -5,931
Shasta 47,590 12,778 29,737 16,200 4,350 10,123 -5,773
Tulare 61,150 18,200 38,109 17,204 5,120 10,722 -5,601
El Dorado 51,608 15,335 31,061 17,400 5,170 10,472 -5,302

And where we estimate Harris to get an advantage:


County Total Harris Cooley Unproc Harris Cooley Margin
Los Angeles 1,883,468 1,004,737 743,482 411,960 219,760 162,617 57,143
Alameda 315,268 207,519 83,738 122,000 80,304 32,404 47,900
San Francisco 176,573 125,063 35,847 67,754 47,989 13,755 34,234
Santa Clara 371,287 203,177 136,071 108,000 59,100 39,580 19,520
Contra Costa 236,809 125,361 93,978 107,000 56,643 42,463 14,180
Marin 83,391 51,689 25,850 38,050 23,585 11,795 11,790
San Mateo 168,055 95,316 59,945 48,102 27,282 17,158 10,124
Sonoma 138,383 79,052 45,321 40,000 22,850 13,100 9,750
Santa Cruz 66,757 41,428 18,356 28,080 17,426 7,721 9,705
Monterey 60,308 32,664 22,522 40,256 21,803 15,034 6,770
Mendocino 19,097 10,321 6,159 12,358 6,679 3,986 2,693
Solano 93,164 47,383 38,272 25,522 12,980 10,485 2,496

The 34 counties we haven’t listed are expected to lose Harris another 23,531 votes, margin-wise.

Again, this analysis is fraught with assumptions, but gives us a useful picture of where things stand. We’re not taking into account any macro influences – such as the possibility of provisional ballots skewing Democratic – here, and given the sheer number of outstanding ballots – 23% of the total cast – much remains uncertain.  

Jim Costa will probably win CA-20

On Tuesday night we were all (including me) counting Jim Costa amongst the casualties of the 2010 GOP wave. After all he was trailing Republican challenger Andy Vidak by 1823 votes with 100% of precincts reporting.

Fortunately that judgement seems to have been  premature. 🙂

Below the fold for all the details…….

CA-20 comprises part of Fresno and Kern counties and all of Kings.

Whilst votes cast in district on election day have all been counted there are still a large number of vote by mail, provisional and “other” ballots to be counted. Other ballots include ballots that are damaged, ballots that could not be machine read and ballots diverted by optical scanners for further review.

Of course some of these have been processed and counted since Tuesday and as of the close of counting on friday Costa has narrowed the gap to only 1091 votes!

Here is how I think the remaining votes will shape out.

Firstly Fresno County.

Fresno thus far has voted 60/40 in favour of Costa and it has about 80000 votes left to count. The number of 20th District votes left in Fresno is approximately 16000. If these break for Costa as the votes counted have thus far then that is a net gain for Costa of about 3200 votes.

Secondly Kern County.

Kern has thus far split 62/38 in favour of Costa and it has about 65000 votes to count. About 13000 of these are in the 20th. If they shape out the way votes counted thus far have then Costa stands to gain about another 2500 votes.

Lastly Kings County.

Kings is all in the 20th and has voted thus far 70/30 in favour of Vidak. However Kings has only another 500 odd votes to count which would give Vidak a gain of only 200 votes.

So…..

-1100 (current Vidak lead)

-200 (Kings gain to Vidak)

+3200 (Fresno Gain to Costa)

+2500 (Kern Gain to Costa)

That leaves Costa in front when all is said, done and counted by about 4400 votes. Assume my numbers are overly optimistic. (They are approximate for ease of calculation but otherwise no heroic or unrealistic assumptions have been made.)

Then Costa should have an ample lead to win.

Your thoughts at this seemingly great news?  

California: Comparing My Predictions with the Actual Results

I was originally typing this as a comment in the open thread, but saw it grow and grow to the point that I decided to write a diary comparing my predictions to the actual results. Overall, my predictions statewide were pretty much spot-on. I may have been off by a few percentage points in the statewide races, but not too shabby. The district races and ballot measures, on the other hand, some were way off due to lack of polling and information. Without further Apu, here goes.

Governor – Likely to Strong Brown; Brown by 14.33% in my number predictions – (Brown by 11.9%) – pretty close though a little less than I was hoping for with the way voters were pissed at Whitman running ads nonstop

Lt. Gov. – Lean Newsom – (Newsom by 10.4%) – looks like I underestimated Newsom, especially with a rare moderate and Hispanic Republican who was also the quasi-incumbent. Being associated with “16%” Arnold likely turned out to be the drag I predicted

Attorney General – Toss-Up – (Still not yet called with Cooley leading by 0.3%) – right on the mark here, regardless of whether it ends up being Harris (please!) or Cooley; I’m a nervous wreck watching this one seesaw back and forth!

Secretary of State – Solid Bowen – (Bowen by 15.8%) – little less than predicted but still good

Treasurer – Solid Lockyer – (Lockyer by 19.7%) – almost on the mark

Controller – Strong to Solid Chiang – (Chiang by 18.1%) – almost on the mark here too

Insurance Commissioner – Likely to Strong Jones – (Jones by 12.6%) – another one that was reasonably on target

School Superintendent – Toss-Up – (Torlakson by 9.4%) – didn’t have much information so I just threw a prediction out there

The ballot measures I was mostly WAY off; they were mostly shots in the dark due to a dearth of information about how they were faring, because 19, 23, and 25 stole the show. Maybe from now on I’ll just give my recommendations.

Prop 19 – Lean Yes – (No by 8%)

Prop 20 – Toss-up/lean No – (Yes by 22.8%)

Prop 21 – Toss-up – (No by 16.8%)

Prop 22 – Toss-up/lean No – (Yes by 22%)

Prop 23 – Likely No – (No by 22.4%) – wow, this of all ballot measures was where I was actually close!

Prop 24 – Toss-up – (No by 17.2%)

Prop 25 – Likely Yes – (Yes by 9.4%) – then again, with this, 19, and 23 gobbling up all the airtime, it should have been easier to predict these than the other 6

Prop 26 – Toss-up – (Yes by 4.6%) – not too shabby for a ballot measure that received little attention

Prop 27 – Toss-up – (No by 19.2%)

U.S. Senate – Lean Boxer; Boxer by 6.67% – (Boxer by 9.4%) – I knew all along that Boxer would put up a helluva fight and win similar to 1998.

CA-03 – Toss-Up/Tilt Lungren; Lungren by 3.75% – (Lungren by 7.9%) – a little off, but I knew it was still a fight, and putting resources into this race may have helped us downticket in AD-05

CA-11 – Lean McNerney; McNerney by 2.75% – (McNerney by 0.3%; by 421 votes with thousands more still to be counted) – closer than predicted

CA-18 – Likely Cardoza; Cardoza by 10.75% – (Cardoza by 15%) – better than predicted

CA-20 – Lean Costa; Costa by 2.75% – (Vidak by 0.2% pending absentee ballot counts)

CA-44 – Lean to Likely Calvert; Calvert by 13.17% – (Calvert by 11%) – another bull’s-eye; a shame we didn’t invest more here after 2008

CA-45 – Likely Bono Mack; Bono Mack by 15% – (Bono Mack by 10.1%) – a little less than predicted but hey, I’m not complaining!

CA-47 – Lean Sanchez; Sanchez by 8.25% – (Sanchez by 8.7%) – pretty close to the mark here

SD-12 – Toss-up/tilt Caballero – (Cannella (R) by 6%) – have to look into this one a bit more deeply

SD-34 – Likely Correa – (Correa (D) by 27%) – guess I took his near-loss in 2006 a bit too seriously

AD-05 – Toss-up – (Pan (D) by 2.8%) – one of those toss-ups that is great to see…one that breaks our way!

AD-10 – Toss-up/tilt Huber – (Huber (D) by 7.8%) – similar to Correa

AD-15 – Tilt/lean Buchanan – (Buchanan (D) by 5%) – another bull’s-eye

AD-30 – Lean Valadao – (Valadao (R) by 24.6%) – way off here. I guess from now on, anybody but a Florez or a Parra! Not sure if Dean Florez plans on running for CA-20 if Vidak does win or when Costa retires (if he does hold on this year).

AD-33 – Lean Achadjian – (Achadjian (R) by 21.2%) – looks like I was right in saying we have a long way to go in the southern Central Coast outside Santa Barbara.

AD-36 – Lean to Likely Knight – (Knight (R) by 15.8%) – should have gone with police officer Watkins in the primary

AD-68 – Lean Mansoor – (Mansoor (R) by 11.8%) – Nguyen was a great candidate, but we still have a lot of work to do to win in OC outside Santa Ana/Anaheim.

AD-70 – Lean to Likely Wagner – (Wagner (R) by 20.9%) – I thought a close race in this district with Fox’s stronger-than-average campaign and Wagner’s presence (or lack thereof) seemed too good to be true. While Obama won this Newport Beach-centric district, we still have work to do to build up the D bench here.

And finally, some races that were not on my radar screen but from what I had heard may have been in trouble should have been paid more attention:

AD-35 – (Williams (D) by 8%) – This is a very Democratic area; what happened? Was turnout here very low too? The Dem numbers in Santa Barbara seem much smaller than usual; usually SB is about on par with California as a whole. A California political neophyte who only saw these election results would think Santa Barbara was a swing county, rather than being a bellwether for how the state goes.

AD-53/54 – (Butler (D) by 7%/Lowenthal (D) by 13%) – Was turnout in the normally Democratic South Bay L.A., despite fellow South Bayers Bowen and Chiang winning in landslides at the top of the ticket, depressed too?

Michigan Redistricting 2012: 9-5 GOP

Quick History

The Republicans controlled the redistricting process in 2000, shifting the map from a 9-7 Democratic advantage to a 9-6 Republican one. (Michigan lost a seat in reapportionment.) They did this by redistricting three seperate pairs of Democratic incumbents into the same districts, thereby creating two new open Republican seats elsewhere. Architect of this plan? None other than then-state-senator Thaddeus McCotter, who oh-so-thoughtfully created one of those new open districts around his home base.

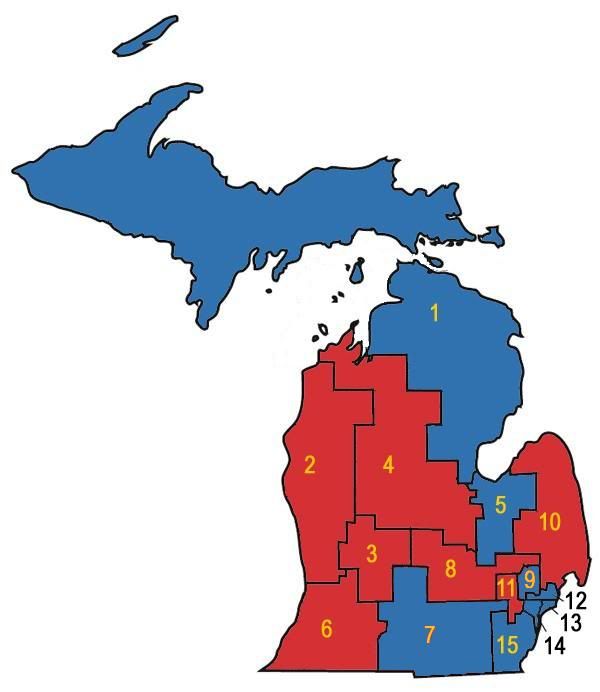
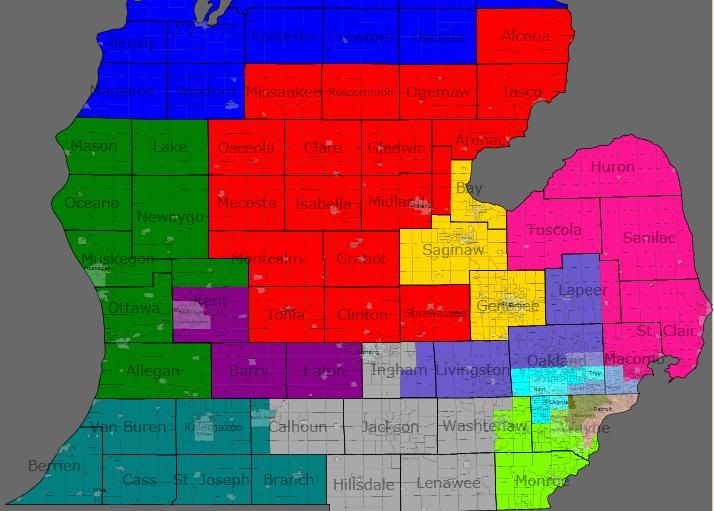
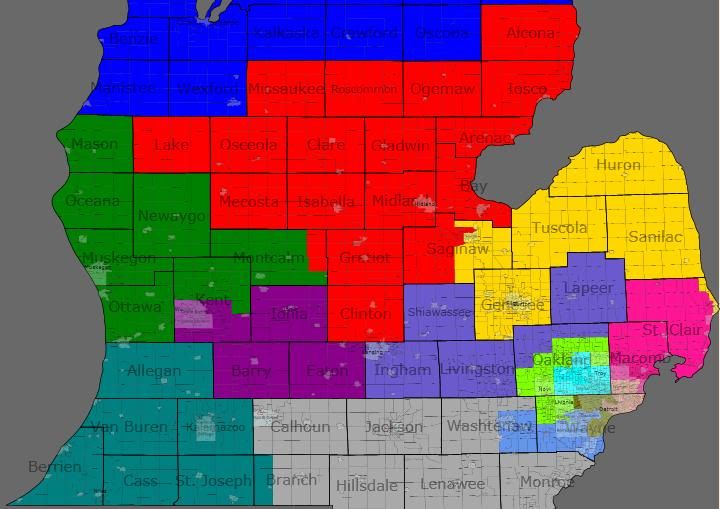
The GOP plan had turned into a little bit of a dummymander, since by 2008 the Democrats had flipped two districts to get an 8-7 advantage. This week's election, however, has restored the Republican's 9-6 edge. The 1st and 9th districts are in opposite hands from the 2002 elections; all other districts are controlled by the same party that won them eight years ago. (Wikipedia’s version of the pre-Tuesday districts is above for reference.)

The Genesis of this Plan: Failed Attempts

One of my consolations on election night was the idea that even with control over redistricting again, the Republicans couldn't really make it any worse. At the time, it looked the the Democrats were going to be down to five districts: Dearborn-Ann Arbor, Flint-Saginaw, Southfield-Warren, and the two Detroit districts. That seemed like pretty much the rock bottom base of support for the Democrats in Michigan. But then Gary Peters pulled out a narrow victory, and I started to look to see whether the Republicans could get the Democrats down to five after all. Michigan is almost certainly losing another district, so let's see if it can be made a Democratic one.

Four of the six Democratic seats seemed pretty much untouchable. The VRA-protected Detroit-based 13th and 14th districts are, of course, ridiculously Democratic. Sander Levin's 12th district pulls together an only somewhat less-ridiculously-Democratic set of inner suburbs on Detroit's north side. And despite Dale Kildee's narrower-than-expected win on Tuesday, Flint is big enough to dominate pretty much any district you could conceivably put it in. That leaves Gary Peter's 9th district and John Dingell's 15th district as the remaining targets.

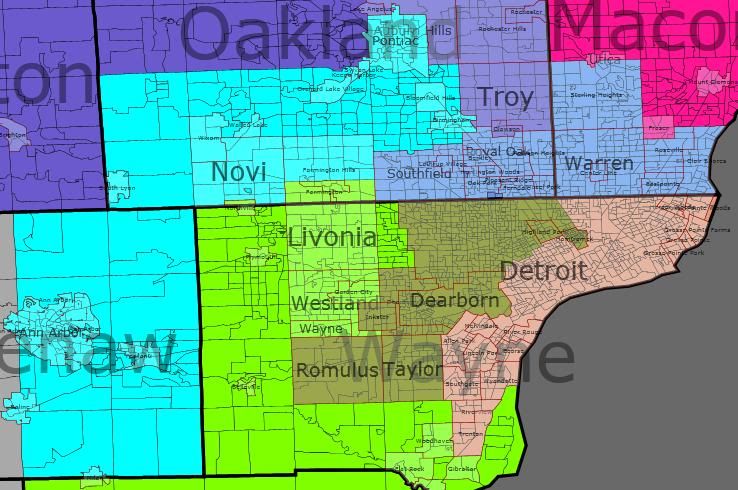
My first attempt actually took on John Dingell's district. Stretching from blue collar Dearborn to the university town of Ann Arbor, it was created as one of the three "pairing" districts, setting up then-Representive Lynn Rivers against Dean of the House Dingell. Dearborn was easy to move into John Conyer's 14th district. Ann Arbor has to end up in Democratic district, so I swung Gary Peter's 9th district around to pick it up. Thad McCotter's 11th then mostly gives up its claim on Oakland county to pick up the rest of the dismembered 15th.

The problem with this plan from a GOP perspective is what it does to McCotter. The distict is probably about 60% – 70% new to him, and it's not nearly as Republican as his old district. I haven't run the numbers, but just from eyeballing it, I would be surprised if this version of the 11th district didn't have a Democratic PVI.

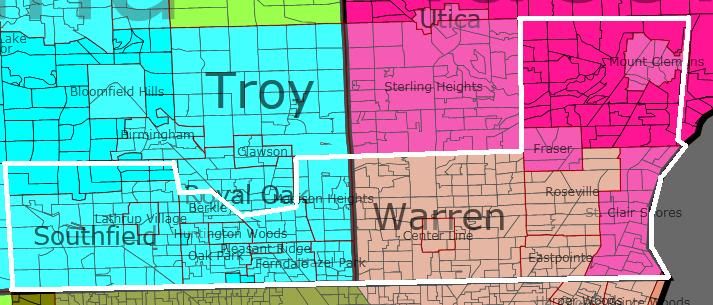
My second attempt left Dingell's district more-or-less alone. (As pictured, all of Dingell's hometown of Dearborn ends up in Conyer's district, but this could possibly be played with.) Instead I merged McCotter's 11th district with Peter's 9th district. The resulting district has about half of its population come from each district. (Old Peters in blue; old McCotter in green.) It cuts out the most Democratic parts of each district (Wayne, Westland, and Garden City for the 11th; Pontiac, Auburn Hills, and Royal Oak for the 9th). Again, I haven't run the numbers for PVI; I suspect it's a Bush '04-Obama '08 district.

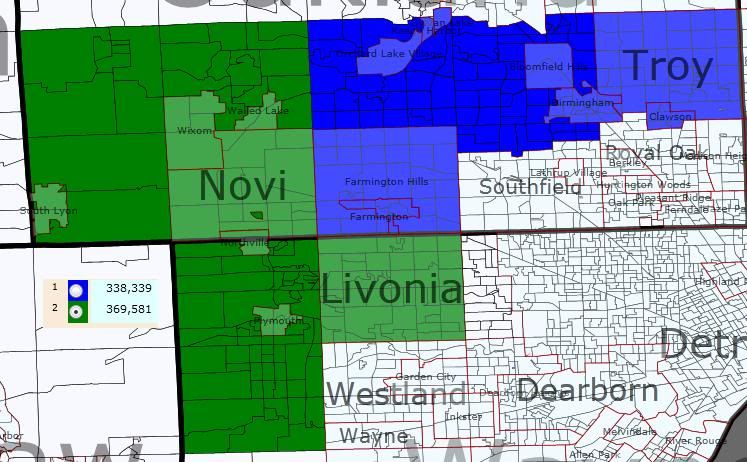
McCotter probably isn't the best candidate for an incumbent vs incumbent race, but this district — in isolation — would probably suit the state GOP fine.

The problem is what the rest of the state looks like.

Merging the 9th and 11th pulls Mike Roger's 8th district further east and north. This saddles the already swingy 7th district just won by Tim Walberg with heavily Democratic Lansing. The 7th, in turn, now donates Democratic-leaning Battle Creek to Fred Upton's already even-PVI 6th district.

The Solution

So if I couldn't dismantle Dingell's district without giving McCotter too much hostile territory, and if merging McCotter's district and Peter's district resulted in weaker districts for Walberg and Upton, then what?

I was stumped for about a day, when the answer occured to me: attack Sander Levin's 12th district instead.

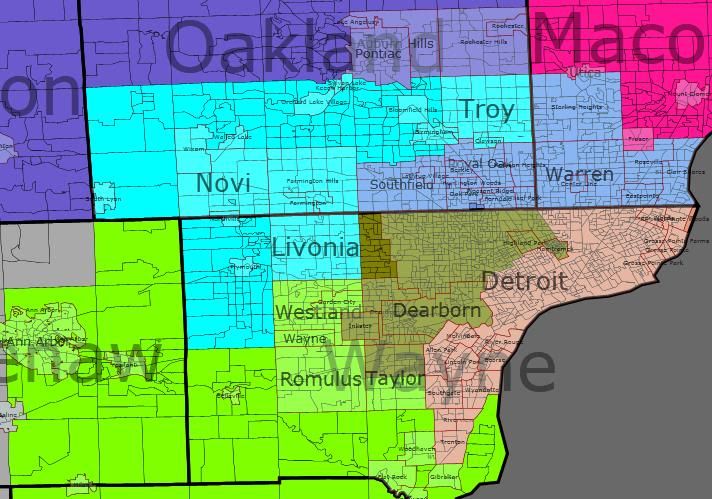
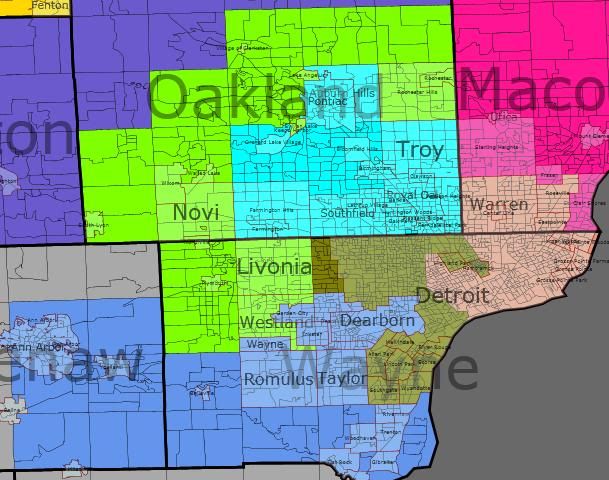
By bringing the Detroit-based 13th district north across Eight Mile into Macomb county, I could merge the Oakland portion of the 12th district into the 9th. (The old 12th is roughly outlined in white.)

Brief District-by-District Rundown

I'm considering working through the data to get firm PVIs for the proposed districts. For now, you have eyeballing-it. I did refer to the 2004 and 2008 numbers while drafting; I just never actually ran the calculations.

1st District (Blue)

This district is newly captured by Republican Dan Benishek. In the 2000 redistricting, this district was pulled down the Lake Huron coast towards Bay City as part of the dismantling of then-Representative Jim Barcia's district (he got paired with Dale Kildee in the 5th). Without such concerns, I pulled it down the Lake Michigan shoreline instead. Adding the Traverse City area instead of the upper Saginaw Bay area should make this district just slightly more Republican. Traverse is also a better cultural fit for the district. (Note that everything not pictured in the north of the state is in this district.)

2nd District (Green)

This district is currently Michigan's most Republican district by PVI. I don't think my alterations will change that. It gives up its northern reaches to the new 1st and stretches inland, taking in Grand Rapids' northern suburbs and exurbs.

3rd District (Purple)

The primary Republican concern with this district is making sure it has enough suburban/exurban territory to overwhelm the Democratic urban core in Grand Rapids. It gives up some territory north of the city and gains Eaton county to the east. I think this will be slightly more Republican than the existing 3rd.

4th District (Red)

As currently configured, this district is something of a left-overs district, taking in the northern counties not in the Upper Peninsula-based 1st or the Lake-Michigan-coast-based 2nd. Under my proposal, it becomes a somewhat more focused Central Michigan district. Largest city (and hometown of incumbent David Camp) Midland is now in the center of the district instead of on its eastern fringe. It takes in all of Democratic Bay county, but I think the rest of the territory is Republican enough to handle it.

5th District (Yellow)

The proposed 5th district is much like its 1990s-district-plan predecessor, taking in much of the Thumb instead of Bay City. This is because eliminating Levin's 12th district pulled Candice Miller's 10th district out of the Thumb. Since it's over that way anyway, it runs a tendril down the St Clair River to relieve Miller of smallish-but-heavily-Democratic Port Huron.

6th District (Teal)

Not much changes for the 6th. It exchanges a few townships in Calhoun county for a few in Branch, and takes in the rest of Allegan county. That last change should make it slightly more Republican. Incumbent Fred Upton should remain fine here.

7th District (Grey)

This proposal's greatest weakness. Newly re-elected Tim Walberg has a district with a PVI of R+2. Getting Monroe county from the dismantled-by-reapportionment 15th in exchange for giving the new 3rd Eaton county is essentially a wash. I just don't think that there's much the Republicans can really do to shore this district up.

8th District (Slate Blue)

Still subsumes Lansing in a sea of Republican-heavy exurbs. This configuration gives up somewhat-Republican Clinton county to gain very-Republican Lapeer county, so Mike Rogers should be happy.

9th District (Cyan)

The new 9th is one of the center-pieces of the plan. It combines most of Gary Peter's current 9th with about half of Sander Levin's current 12th. If it came to a primary, I'm not sure what would happen. Where the current 9th was designed as a Republican seat that's just slipped away, this 9th would be a Democratic safe seat, anchored by Southfield, Royal Oak, and Pontiac.

10th District (Deep Pink)

Candice Miller's 10th is pulled south by the elimination of the old 12th. Losing most its rural hinterland, the new 10th is definitely more Democratic than the old one, but I don't think it's that much more. I think Miller should still be fine. In one of the rare set of calculations I did do, the portions of Macomb county not in the district (ie, in the new 13th) voted for 63% for Obama. The portions of Macomb in the district voted only 52% for Obama. That probably means that Bush won the new 10ths portion of the county in 2004 (here, we're back to no calculations.)

11th District (Lime Green)

In order to shore up McCotter, the district loses three of its inner surburbs and snakes around the north side of the new 9th to pick up some more heavily Republican territory. McCotter should put up much better numbers in this reconfigured district.

12th District (Cornflower Blue)

With the dismantling of the old 12th, I reused the district designation for the reinvention of Dingell's dismantled-by-reapportionment 15th. The new 12th loses Monroe county to pick up the southern portions of Downriver. I'm pretty sure this will push its PVI in an even-more Democratic direction, and Dingell (and/or his successors) should be safe here all decade.

13th District (Salmon?)

The other centerpiece of this plan. It takes in roughly similar portions of Detroit as its predecessor (along with the Grosse Pointes and Harper Woods.) Instead of stretching into Downriver, though, it crosses over into southern Macomb, snatching away the eastern half of Levin's district and saving Miller from having to take on the most Democratic parts of the county. VRA: 53% black, 42% white.

14th District (Olive Drab)

Conyers' new district takes in basically the same portions of Detroit as his old one. The primary difference are the addition of Redford township, the subtraction of any part of Dearborn, and the taking in of the northern half of the Downriver communities instead of the western half. VRA: 53% black, 34% white.

Pre-Conclusionary Note

I was originally concerned about whether this was too much county-splitting in the Detroit area, but it's actually less than currently exists. Currently, the tri-county Detroit metro area has the following configuration:

Wayne: 2 full districts (13th, 14th), 2 partial districts (11th, 15th)
Oakland: 1 full district (9th), 3 partial districts (8th, 11th, 12th)
Macomb: 2 partial districts (10th, 12th)
for 10 total county-fragments.

Under this new configuration, the tri-county Detroit metro area looks like this:

Wayne: 1 full district (14th), 3 partial districts (11th, 12th, 13th)
Oakland: 1 full district (9th), 2 partial districts (8th, 11th)
Macomb: 2 partial districts (10th, 13th)
for 9 total county-fragments.

Conclusion (TL;DR version)

By eliminating Levin's 12th district, I created four packed super-safe districts for the Democrats in the metro Detroit area, with one other safe Democratic district in the Flint-Saginaw area. Republican incumbents in the 1st, 3rd, 6th, and 11th districts are shored up. Republican incumbents in the 4th and 10th districts take minor hits. The Republican incumbent in the 2nd district needed no help; and the one in the 7th district is unhelpable. This plan would more or less lock in an 8 GOP – 5 Dem – 1 swing district pattern for the rest of the decade.