Louisiana Redistricting: New Pres Numbers by CD

With the Louisiana redistricting map one of the first to emerge intact from the sausage-making process, it’s time to crunch the numbers and see just what kind of districts we wound up with. (Notice that I’m not saying the map is a done deal… the Obama DOJ might still weigh in and shake things up, as they could conceivably push for a second African-American plurality district under the VRA.) Our resident data guru, jeffmd, has sliced and diced the shapefiles on the state House’s website, overlaid that onto the VTDs available from the Census Bureau, matched the VTDs to 2008 and 2010 election results available from the Louisiana SoS website, and voila:


District Obama # McCain # Obama % McCain % Fayard % Dardenne % Melancon % Vitter %
LA-01 81,515 233,789 25.34 72.68 25.30 74.70 24.89 69.79
LA-02 235,554 81,703 73.36 25.44 73.01 26.99 70.38 24.72
LA-03 111,831 210,951 34.06 64.25 39.36 60.64 31.40 62.55
LA-04 126,899 187,020 39.94 58.86 45.78 54.22 36.29 57.54
LA-05 124,119 209,705 36.69 61.98 40.04 59.96 32.98 60.31
LA-06 103,071 225,094 30.90 67.49 33.04 66.96 32.45 62.02

The full precinct-by-precinct dataset, courtesy of Google Docs, is available here.

If you aren’t familiar with the contours of the new map, you can take a look here. In a nutshell, the 1st remains the New Orleans suburbs, the 2nd remains New Orleans proper (although now it reaches into Baton Rouge’s African-American neighborhoods as well), the 4th is still centered on Shreveport, the 5th is still Monroe and Alexandria, and the 6th is still centered on Baton Rouge (even if its core is now missing). The big difference is the 3rd, which now mostly occupies what used to be the 7th, across Lake Charles and Lafayette; the old 3rd, in Cajun country south of New Orleans, has been parceled out to the 1st, new 3rd/former 7th, and also the 6th and 2nd.

As you can see, the redistricting result is very, very likely to result in a 5-1 map. The friendliest district for Dems, after the 2nd, is now the Shreveport-based 4th, but even it didn’t even see Barack Obama hit 40%. That’s not much different from the current setup (where he did hit 40%); the old 6th was the friendliest for Dems, but barely more so (with 41% for Obama).

Greg Giroux has some other interesting tidbits available on how the 3rd district (which is now poised to become a battleground between incumbent GOPers Charles Boustany and Jeff Landry) got neatly dismantled: Boustany represents 575K of the 3rd’s residents, while Landry represents only 180K of them, a nearly 3:1 advantage for Boustany. Of the old 3rd, 29% of it wound up in LA-01, 28% in new LA-03, 24% in LA-06, and 18% in LA-02. (The Daily Kingfish has picked up on this, and speculates that Landry might be better off challenging Steve Scalise in the 1st instead.)  

Louisiana with 2 “VRA” districts?

A few days ago in the discussion of the proposed Louisiana map someone drew a map with two majority-black districts but nothing else filled in. I drew this map to see (a) if I could get the New Orleans district to be more compact and (b) what the other districts would look like. As it turns out, the answer to (a) is yes, but it’s plurality black as opposed to majority black, and the answer to (b) is ugly.

Here’s the map.

louisiana

In district descriptions, the percentages are for voting age population. w is non-Hispanic white, b is black, h is Hispanic, and a is Asian.

LA1 (blue): 77.6w-12.3b-6.0h-1.7a. Still mostly a suburban New Orleans seat, but it was forced to move into the Thibodaux-Houma area by the positions of the VRA districts. Safe R.

LA2 (green): 41.7w-46.5b-7.3h-3.0a. Because of the depopulation of New Orleans, this district has to extend west and then south to pick up some heavily black areas. Probably likely D to safe D, as it’s still 58% minority and its white population is probably relatively moderate compared to the rest of the state. While less compact than a typical district, it’s far more compact than either its current or proposed versions.

LA3 (purple): 74.0w-20.7b-2.4h-0.9a. Ugh. It’s geographically impossible for it to take all of Cajun country, so it has to extend much further north. It wasn’t possible for it to take everything along the west side of the state up to and including Shreveport so I had to take it practically to the northeast corner of the state to avoid splitting up the Shreveport area. The result is a sprawling, incoherent mess that takes up maybe 40% of the state’s land area. Safe R.

LA4 (red): 59.8w-35.6b-2.4h-1.0a. The one clean district, the I-20 district. Likely R.

LA5 (yellow): 79.6w-13.9b-3.5h-1.7a. This ugly district with nodes in Baton Rouge and Cajun country connected by a narrow strip was necessary because the two VRA districts pass so close to each other. Safe R.

LA6 (teal): 44.6w-50.2b-2.6h-1.3a. The Baton Rouge-based majority-black district is nice and compact, but it has some community-of-interest issues as it takes pieces of Lafayette, Ville Platte, and Alexandria in addition to part of the capital city. Probably close to safe D even though it’s likely only D+6 or so: it looks like it would be easy for a Republican to get to 40% but nearly impossible to get over the hump. Compare it to Sanford Bishop’s current district, which is probably about as polarized as this LA6 would be but has black-white percentages that are basically the reverse of what this district has. It’s D+1.

I’m pretty sure that a court would accept this proposed LA6 if the state submitted it, as courts have accepted some really ugly and incoherent districts.  But here’s the question: would a court compel a state to draw something like the proposed LA6–which looks ok but slices and dices some widely separated cities–if the state isn’t inclined to draw it in the first place? Perhaps someone with a better understanding of the VRA can weigh in on this. Thoughts?

By what margin will Bob Shamansky win?

View Results

Loading ... Loading ...

3 VAP African-American Districts in Louisiana!

It seemed way too easy to make 2 VAP (Voting Age Population) black districts in Louisiana. I feel like even if there wasn’t 3 VAP districts, there could easily be two with another heavily leaning Dem district, making the new delegation a 3-3 split with LA losing one seat this year.

As I gerrymandered through New Orleans, Baton Rouge and LaFayette, I realized I didn’t even have to really go to Shreveport to Monroe for 2 districts, and it seemed there were quite a few black precincts left so I decided to try to make 3 VAP districts. It took a lot of maneuvering and one area of water contiguity over the lake, but I did it! It’s the most horrible map, though, and would never obviously be drawn.

My other goals were to not use touch-point contiguity, which I did not, and also not use water contiguity, which I failed to do, but oh well.

All racial numbers are VAP, if it was simply out of all population, the black percentage numbers are a few points higher in all districts. Also, the biggest deviation from target population is the blue district, which has 5,691 more than the target.

Enjoy!

LA-01: The Green district here is the first VAP black district. It is centered on New Orleans, of course, and carefully zigzags around to avoid highly white voting districts and also to pick up extra black precincts outside of New Orleans. I have a feeling this district would have been much easier to create 7 years ago.

38.8% White, 50.1% Black, 6.5% Hispanic, 2.8% Asian

LA-02: The Blue district is where I used water contiguity. It takes in very, very white areas in Eastern Louisiana outside of Baton Rouge, and every white area imaginable inside New Orleans. Look at the big map I first posted for larger look of where the arms extend outside of the city.

79.0% White, 10.0% Black, 7.9% Hispanic, 2.3% Asian

LA-03: The purple district is the second VAP district, and this one is nasty. This district takes in virtually every black precinct imaginable without breaking contiguity, taking in parts of LaFayette, Baton Rouge, Lake Charles, New Iberia and Opelousas. I avoided every area I could that was extremely white (I would take places that were, say, 65% or 70% instead of 80% or 90%. This makes a HUGE difference.)

44.4% White, 50.1% Black, 2.8% Hispanic, 1.4% Asian

LA-04: The red district takes up everything in Southern Louisiana that isn’t black along the coast, and also LaFayette white areas. It also reaches some into Eastern Louisiana, but most of the district is along the coastal parishes. This is the whitest district.

81.9% White, 9.3% Black, 3.4% Hispanic, 1.4$ Asian

LA-05: The yellow district is almost as white as LA-04. It takes in everything that is white in Western and Central Louisiana. It was really annoying to make this contiguous with the last district, but I finally managed to do it without making the final VAP district go under 50.1%.

81.0% White, 12.8% Black, 3.0% Hispanic, 1.0% Asian

LA-06: Dark Green district. This was soooo hard to make VAP for awhile. I kept swapping territory to shed whiter areas to even just a few percentage points lower white areas, and also swapped territory with the purple district and I finally got it. It takes in black areas of Shreveport and Monroe, and also black areas further south in and around Alexandria in the central part of the state. This may be the ugliest district, along with LA-05.

45.7% White, 50.2% Black, 2.0% Hispanic, 0.7% Asian

Louisiana with 2 Black Majority VRA Districts, and a third “influence” district

Photobucket

I realize that this map is probably not politically feasible.  It would undoubtedly create two seats – perhaps even three – where Democratic candidates would stand a very good chance of winning.  But I drew it because I wanted to see a map made, using actual 2010 census data, that stayed as close as possible to the spirit of the VRA.  The VRA is not designed to ensure the election of particular minority candidates; it is to maximize the electoral chances of minority voters, where it is possible to create compact districts (part of the Gingles test), to choose candidates of their choice.  I believe this map does this with the 2nd and 4th districts.  I also wanted to see whether the already VRA-protected 2nd district needed to go to Baton Rouge as has been talked about a lot ever since it became apparent in the aftermath of Katrina that Louisiana would almost certainly lose a congressional seat.  It turns out that the answer is probably not – I say probably because I am not sure whether a VRA district needs to have just 50.0%+1 of total population be black or 50.0%+ of the voting age population.  If the latter is the standard, I am sure the districts can be tweaked somewhat to comply.  Follow me in the jump over to look at the six districts individually.

District 1 (blue)  SAFE GOP

W 81.9%, B 9.2%, H 5.7%, A 1.5%, NA 0.3%, Other 1.4% (W 83.9% of VAP)

Photobucket

Not many changes from current map. Extends all the way to Baton Rouge with the addition of Livingston County.

District 2 (green) SAFE DEMOCRATIC VRA PROTECTED

W 35.7%, B 51.8%, H 7.8%, A 2.9%, NA 0.4%, Other 1.4%

W 38.9%, B 48.8%, H 7.7%, A 2.9% VAP

Photobucket

I believe this would past judicial muster because the 48.8% Black voting age population (VAP), combined with Hispanics, “Other” (which undoubtedly is mixed or multiple races) and Asians, clearly is majority-minority.  If it needs another 1.2% African-Americans the map can probably be tweaked.  I wanted to see whether you needed to go to Baton Rouge, and the answer to me seems clearly not.  Thus, if a post-2010 map of Louisiana has the 2nd district going into downtown Baton Rouge, that is for GOP partisan purposes, not because it has to be drawn that way.

District 3 (purple) LIKELY GOP

W 72.6%, B 18.4%, H 4.1%, A 1.9%, NA 1.4%

W 75.1% VAP

Photobucket

I only hesitate to label this “Safe Republican” because until recently this third district elected a conservative Democrat to congress.  Probably with the addition of white areas of Baton Rouge and Lafayette, though, it is more Republican.

District 4 (red) LIKELY DEMOCRATIC NEW VRA DISTRICT

W 42.9%, B 51.7%, H 2.6%, A 1.3%, NA 0.3%, Other 1.2%

W 46.3%, B 48.7%, H 2.5%, A 1.3%, NA 0.3%, Other 0.9% VAP

Photobucket

Again the same caveat applies as in District 2: I am not sure whether, to pass VRA muster, a district merely needs to be above 50% population and meet the other Gingles criteria, or also has to have a VAP above 50%.  However, I believe this map would pass the retrogression test because it creates two Black-majority districts rather than just one (and comes close to the proportion of a state that is almost one-third black).  If it needs to be tweaked to get the VAP over 50%, it would probably involve a few more country splittings.

District 5 (light green) LIKELY GOP

W 75.9%, B 17.9%, H 2.7%, A 0.9%, NA 0.8%, Other 1.6%

W 77.7% VAP

Photobucket

I hesitate only in labeling this a safe GOP seat because it does contain the Cajun Country part of Louisiana, that until recently elected a Democrat to Congress.

District 6 (teal green) “Black influence” district LEAN DEMOCRATIC OR JUST TOSS-UP?

W 52.9%, B 41.9%, H 2.7%, A 0.9%, NA 0.4%, Others 1.3%

W 56.0%, B 39.4% VAP

Photobucket

Not sure whether this should be properly classified as a lean Democratic district or as a toss-up.  My caution comes from the stark degree of racial polarization in Deep South states like Louisiana, as witnessed in the 2008 election.  But it would give African-American voters the possibility to influence the choice of candidates in Louisiana’s jungle primary, thus meeting one of the Gingles tests.  And it does this with only one county being split.  A minority-majority district in this area of the state is probably possible, but might fail the compactness portion of the Gingles test (aka Cleo Field’s 1992 Z-shaped district).

Will this map likely be enacted?  Probably not.  But it should at least be considered given the VRA’s requirements, which it falls to the Obama Justice Department to insist on.  It seems clearly possible in my view to create two VRA-compliant districts in Louisiana that are relatively compact and adhere to communities of interest (in other words, recognizing that Baton Rouge residents have different concerns than those of New Orleans).

Redistricting Louisiana: Deep fried, heavily seasoned and served hot

Drawing from a rather long comment I had on a previous diary, I’ve decided to expand my one part diary on redistricting in the Bayou State to two.

The first part will run through recent developments in state politics and who controls the redistricting process, while the second will include my proposed map for Louisiana’s 6 congressional districts.

In my honest opinion, Louisiana is the state least alike the other 47 states that make up the continental United States.

Administrative subdivisions are called parishes, not counties. It is a civil law state, as opposed to the other 49 common law states.

Politics in the state are no different.

Party labels are very fluid. In state government, there are conservative Democrats – although less so now – and some fairly moderate Republicans, especially for standards of the Deep South.

In the past few months, Democrats have taken a hit, and in Louisiana, it has been no different.

For the first time since Reconstruction, Republicans control the state house. There is a Republican governor, and after Attorney General Buddy Caldwell’s party switch last week, the only statewide elected Democrat is Sen. Mary Landrieu.

That leaves the state senate, which currently is split right down the middle, 19 Democrats and 19 Republicans.

This gridlock is a result of party switchers, notably state Sen. John Alario, and a single vacancy.

Redistricting in the state is done by the legislature and the governor and it seems the last chance for Democrats to be at the table, outside the Holder DOJ, is the state senate.

Let’s look at that vacancy.

The 26th district is vacant after Sen. Nick Gautreaux resigned to become Bobby Jindal’s commissioner of the Office of Motor Vehicles.

(Just an aside, this appointment and that of a former independent state senator as the Commissioner of the Office of Alcohol and Tobacco Control was smart politically by the governor and is VERY reminiscent of President Obama’s appointments of Jon Huntsman and John Mchugh)

The 26th district includes all of Vermillion parish and parts of Acadia, Lafayette and St. Landry parishes.

The district takes in areas of Cajun country west of Lafayette and stretches down south to include Vermillion parish, ending at the Gulf. To better understand the region, the 2000 census reported about a quarter of people in Vermillion speak French or Cajun French at home.

This area is historically Democratic. In the jungle primary in the 2003 gubernatorial election, 3 of the 4 parishes in district 26 were won by Kathleen Babineaux Blanco, who would win only 7 parishes and grab only 18% of the vote but squeak into the general election against Bobby Jindal.

This small chunk of Acadiana will decide which party will control the state senate.

After Gautreaux’s announcement that he would resign, Republican state Rep. Jonathan Perry, who represents much of the sparsely populated coastal parts of Vermillion and Cameron parishes, entered the race.

Soon thereafter, Democrat Nathan Granger, a member of the Vermillion Parish Police Jury and owner of an oilfield services company, entered the race.

At this stage in the race, both camps have released dueling internals showing each with about a 10 point lead.

Anecdotally, I have heard from a friend from Crowley that the area is swamped with advertisements from Granger and after reviewing campaign finance reports, it appears that is the case.

As of Jan. 31, campaign finance reports show Granger raised about 280k, of which 220k was self-funded, with 100k COH.

Perry has raised 90k and has 30k COH.

Take all this with a grain of salt, but it appears that this Blue Dog might just dispatch a Tea Partier in a very important race for Louisiana politics.

In part 2, the map I unveil will show why Democrats need to have a seat at the redistricting table as I attempt to create a VRA district based in New Orleans that DOES NOT stretch all the way to Baton Rouge.

Redistricting outlook: Kansas-Maryland

Now that it’s 2011, the redistricting games will soon begin in earnest, with more detailed Census data expected in the coming weeks and some states holding spring legislative sessions to deal with drawing new maps. Long ago I planned to do state-by-state rundowns of the redistricting process as soon as 2010 election results and Census reapportionment were clear. Now that time has arrived, and it’s time to look at Kansas, Kentucky, Louisiana, Maine, and Maryland.

Previous diary on Alabama, Arizona, and Arkansas

Previous diary on California, Colorado, and Connecticut

Previous diary on Florida, Georgia, and Hawaii

Previous diary on Idaho, Illinois, Indiana, and Iowa

The rest below the fold…

Kansas

Photobucket

Districts: 4

Who’s in charge? Republicans

Is that important? Nope

With an all-Republican delegation, GOP mapmakers may simply try to ensure that Kevin Yoder avoids a close race in the next decade.

Kentucky

Photobucket

Districts: 6

Who’s in charge? Split (Dem Governor and House, GOP Senate)

Is that important? Perhaps

I have heard rumors that Republicans hope to stall the redistricting process past the 2011 state elections, expecting to topple both Gov. Beshear and the Democratic House majority this November. But assuming a continuation of the status quo, Ben Chandler should get a slightly more favorable district than the one he nearly lost in 2010.

Louisiana

Photobucket

Districts: 6, down from 7 in 2002

Who’s in charge? Split (GOP Governor and House, Dem Senate)

Is that important? Not really

The outcome of reapportionment in Louisiana has scarcely been in doubt since Jeff Landry was elected last November. He will be forced against fellow Republican Rep. Charles Boustany in a coastal district. Meanwhile, Cedric Richmond’s VRA-protected seat will have to absorb a lot of new population near Baton Rouge, and Rodney Alexander’s underpopulated northern seat will expand southwest a bit.

Maine

Photobucket

Districts: 2

Who’s in charge? Nonpartisan commission

Is that important? No

Maine does not even traditionally redraw its maps before the election year ending in 2. Sometime in 2013, the commission will make some boundary adjustments, and both Mike Michaud and Chellie Pingree should remain reasonably secure should they still be in office two years from now.

Maryland

Photobucket

Districts: 8

Who’s in charge? Democrats

Is that important? Perhaps

The question here is how aggressive Democrats perceive they can afford to be. They already constructed a master gerrymander in 2002, moving the delegation from a 4-4 split to a thoroughly safe 6-2 Democratic edge. Now, some are pushing for a 7-1 map that remakes Andy Harris’s Eastern Shore seat for a moderate Dem like Frank Kratovil. However, such a map presents serious issues: how to maintain VRA-mandated black majorities in the 4th (represented by Donna Edwards) and 7th (Elijah Cummings)? How to keep the four other Dem incumbents completely safe? With today’s redistricting technology, it can probably be done, but the 1st cannot be made securely Dem lest other districts be jeopardized…only politically competitive enough for Kratovil to stage a comeback.

LA, MS, NJ, VA: Population by CD for First Four States

As devoted Swingnuts are aware by now, the Census Bureau has produced its first batch of redistricting-level data. Because Louisiana, Mississippi, New Jersey and Virginia all have state-level elections this year, they get bumped to the head of the line. So that means we now know the current population of each congressional district as presently drawn. While the Census Bureau didn’t exactly make this data available in the most accessible format, the greasemonkeys down in the Skunkworks at SSP Labs have crunched the numbers, and here’s what they look like. Note that the “Deviation” column means how far off each current district is from the new ideal (and in the case of LA and NJ, we divided by their new seat totals of 6 and 12 respectively):


District Population Deviation
LA-01 686,961 (68,601)
LA-02 493,352 (262,210)
LA-03 637,371 (118,191)
LA-04 667,109 (88,453)
LA-05 644,296 (111,266)
LA-06 727,498 (28,064)
LA-07 676,785 (78,777)
Total: 4,533,372


District Population Deviation
MS-01 788,095 46,271
MS-02 668,263 (73,561)
MS-03 756,924 15,100
MS-04 754,015 12,191
Total: 2,967,297


District Population Deviation
NJ-01 669,169 (63,489)
NJ-02 692,205 (40,453)
NJ-03 680,341 (52,317)
NJ-04 724,596 (8,062)
NJ-05 666,551 (66,107)
NJ-06 668,806 (63,852)
NJ-07 672,885 (59,773)
NJ-08 660,424 (72,234)
NJ-09 661,379 (71,279)
NJ-10 634,343 (98,315)
NJ-11 674,349 (58,309)
NJ-12 701,881 (30,777)
NJ-13 684,965 (47,693)
Total: 8,791,894


District Population Deviation
VA-01 786,237 58,871
VA-02 646,184 (81,182)
VA-03 663,390 (63,976)
VA-04 738,639 11,273
VA-05 685,859 (41,507)
VA-06 704,056 (23,310)
VA-07 757,917 30,551
VA-08 701,010 (26,356)
VA-09 656,200 (71,166)
VA-10 869,437 142,071
VA-11 792,095 64,729
Total: 8,001,024

Just Whistling Dixie: Unlikely Pro-Democratic Maps for Four Southern States (AL, KY, LA, VA)

After the jump, I present a survey of maps that are demographically possible if political improbable. They are presented mostly for holiday slow-time discussion fodder. The states covered are Alabama, Kentucky, Louisiana, and Virginia. Republicans will control the process in Alabama; the Democrats control a single house of the legislature in the other three states. So the Democrats are unlikely to get maps as good as these. My redistricting instincts tend towards “good government” aesthetics, so these maps are about what’s possible with relatively compact districts.

Alabama

Top-line results: 5 R – 2 D. (Neutral year, open seat, quality candidates, my impression)

This map creates two majority-black districts in Alabama, while pushing the Huntsville-based 5th in slightly more Democratic direction.

The estimates in Dave’s App put Alabama at 4.66M people. The actual Census figure is 4.78M.

The 1st and 2nd engage in extensive territory swapping with the 2nd. The 1st gains gains the southeastern corner of the state; the 2nd gains much of Mobile proper. This roughly doubles the black percentage of the 2nd, taking it to 53% black, 43% white. Martha Roby should be in trouble. The 7th is very slightly diluted, dropping from 61% to 59% black. Making the 2nd majority black also let me shore up Mike Roger’s 3rd, which lost about 8 points off its black percentage.

In the north, the 5th needed to shrink. Glancing over the last decades worth of county-level results, the eastern side of the district seemed slightly more Democratic than the western side, so I lopped off Jackson County. Mo Brooks would probably still be fine here, but I’d rate this as the district most likely to flip to the Democrats outside of the majority-black ones.

I’m not entirely sure what the Republican will do with their control. The current 4th and 6th are R+26 and R+29 respectively, so a well-executed unpacking of those districts should end shoring up the other four GOP-held districts.

Kentucky

Top-line results: 3 R – 2 D – 1 S (Neutral year, open seat, quality candidates, my impression)

This map shores up Ben Chandler’s 6th district, while pushing the Paducah-based 1st into a potentially swingy seat. (I might be over-estimating Democratic chances there.)

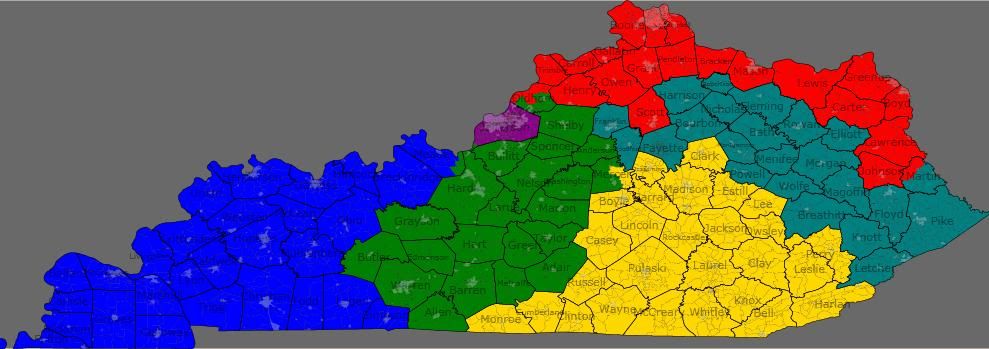
The estimates in Dave’s App put Kentucky at 4.04M people. The actual Census figure is 4.34M.

Looking at recent governor and US senator races, I noticed that the geographically largest areas of Democratic support in Kentucky is in the central portion of western eastern half of the state. That support is currently cracked into parts of three districts. I consolidated that support into Chandler’s 6th (teal), which should go from swingy to solidly Democratic.

In doing so, I forced the 5th (yellow) to the west, eating up areas that are contributing to Republican margins in the 1st (blue). (The new 5th is very Republican — it’s the only district without a single county that went Democratic in either of the last two US Senate races.) This new 1st should be winnable for a Democrat under the right circumstances — for example, by eyeballing it, I estimate that Mongiardo probably won in the 2004 Senate race.

I actually think that my 6th might have a decent shot of being created if the state House Democrats can force incumbent-protection. It’s just that the first will need to be solidified for the Republicans by some territory swaps with the 2nd and 5th.

Louisiana

Top-line results: 3 R – 2 D – 1 S. (Neutral year, open seat, quality candidates, my impression)

This map creates two majority-black districts in Louisiana, while trying to make the Shreveport-based 4th as Democratic as possible.

The estimates in Dave’s App put Louisiana at 4.41M people. The actual Census figure is 4.53M.

The 2nd (green) and 6th (teal) are the intended majority black districts. The actual figures are more like 49.6% in each. The 4th (red) is 54% white, 41% black. I hope that’s enough to make the 4th competitive for the Democrats.

Most speculation I’ve seen indicated the Republicans will be trying to make a single Baton Rouge-to-New Orleans majority-black district. Given the recent rate of party switching in the Louisiana state legislature, I imagine they’ll probably succeed.

Virginia

Top-line results: 5 D – 4 R – 2 S (Neutral year, open seat, quality candidates, my impression)

I originally presented this map in a comment in diary by drobertson. It fits the theme though, so I’m reposting it for consideration. This map is probably the most “good government” of these maps – each district basically corresponds to an existing political/cultural region of Virginia.

Its most notable feature is that presents two plurality black districts in the southeastern part of the state.

The estimates in Dave’s App put Virginia at 7.77M people. The actual Census figure is 8.00M.

1st (blue) – Peninsulas – Obama 46, McCain 54

2nd (green) – Suburban Hampton Roads – Obama 49, McCain 51

3rd (purple) – Urban Hampton Roads – Obama 69, McCain 31 — VRA: 49% black, 42% white

4th (red) – Richmond, Petersburg, and South Virginia – Obama 61, McCain 39 — VRA: 50% black, 44% white

5th (yellow) – Piedmont – Obama 47, McCain 53

6th (teal) – Shenandoah – Obama 43, McCain 57

7th (grey) – Richmond suburbs – Obama 42, McCain 58

8th (slate blue) – Arlington, Alexandria, north Fairfax- safe D

9th (cyan) – southwest Virginia – Obama 40, McCain 60

10th (magenta) – Prince William and Loudoun – Obama 56, McCain 44

11th (lime) — south Fairfax and Manassas – ???

The presidential percentages are back-of-the-envelope style. I used the 2008 figures to the nearest hundred and counted split cities/counties as if they were wholly within the district they were most in. I didn’t feel like delving into Fairfax precincts for the 8th/11th. The 8th should be just as safe as it is now, and I think, though I’m not 100% certain, that this version of the 11th is more Democratic than the current one. (Drobertson questioned this assertion at the time I made it, but agreed that this new district ought to be better for Gerry Connolly if not Generic D.)

The 2nd is more Republican than listed, but I don’t know how much more. I counted Isle of Wight and Suffolk as if they are wholly in it, but they are both donating their most heavily black precincts to the neighboring 4th and 3rd, respectively.

There’s a similar dynamic for the 4th and 7th, which are probably even more firmly in their respective parties’ control than it appears. I counted all of Richmond and Henrico in the 4th, but the majority white parts of each are actually in the 7th.

Notes on incumbents: Wittman, Scott, Cantor, Goodlatte, Moran, and Connolley are all fine. Rigell and Forbes would share the 2nd. Hurt lives in the new 4th. Griffith lives in the new 6th. Wolf lives in the new 8th. I assume all three of them would continue to run in the same districts anyway — all of them are in counties adjacent to their districts.

In the real world, the Virginia state senate Democrats should be able to force incumbent-protection, but seperating Richmond from Hampton Roads for two black opportunity districts won’t be happening.

LA Lt Gov: Race to the Bottom

The race to fill the position of Lt. Gov. is heating up here in the Pelican State.

The winner fills the seat now held by Lt. Gov. Scott Angelle, a Democrat who was appointed by Gov. Bobby Jindal to replace Mitch Landrieu, now Mayor of New Orleans.

The position has very few powers, but it provides a clear path to higher office and is first in the line of succession to the governor’s office. Specifically, the job of Lt. Gov. is “to promote culture, recreation and tourism,” according to The (Baton Rouge) Advocate.

To fill the seat, Louisiana will use a jungle primary. If none of the eight candidate receive a majority of the vote, then the top two vote getters, regardless of political party, will enter a runoff held on Nov. 2.

The first round of election occurs Oct. 2; however, as both LSU and Southern University play at home that day (a Saturday), more voters are expected to turnout during the early voting period, which ends today, than usual.

Turnout so far has been very light. According to the Secretary of State’s Office and reported by The Advocate, only 50,540 of the state’s 2.92 million registered voters have turned out to vote as of Thursday. Election forecasters expect turnout to hover around 20% of registered voters.

Due to the number of candidates, the race will certainly head to a runoff. Secretary of State Jay Dardenne, a Republican from Baton Rouge, will almost surely be the top vote getter.

Thus, next week’s election will determine who will face him for the seat. A poll conducted Aug. 15-16 for WWL-TV of New Orleans shows that country music singer and perennial Republican candidate Sammy Kershaw in second.

The poll gave 20% to Jay Dardenne (R), 15% to Rep. Sammy Kershaw (R), 8% to St. Tammany Parrish President Kevin Davis (R), 4% to state Republican Party Chairman Roger Villere (R) and 2% to each of the other remaining candidates.

Notably in the poll, no Democrat tops 2%. That is because up to recently, the Democrats in the race had very little name recognition. The Democrats in the race are State Sen. Butch Gautreaux, New Orleans lawyer Caroline Fayard and former Caddo Parish Police Juror Jim Crowley.

Since then, a couple of news developments seem to have changed this. First off, former President Bill Clinton endorsed and hosted a fundraiser for Caroline Fayard, a former congressional page and intern in the Clinton White House.

Additionally, campaign finance reports were released from the latest period, showing Ms. Fayard raised more money than all other candidates. Those reports do not include money raised during the New York fundraiser with Mr. Clinton.

Finally, Ms. Fayard has gotten on the airways with television buys in New Orleans, Baton Rouge and Shreveport.

The goal of this campaign is to finish second to Mr. Dardenne.

Mr. Dardenne will almost surely win. He has a decent record, statewide name recognition and comes off as experienced and friendly. He is the closest thing to a generic Republican I can think of.

He is probably slightly to the left of the state Republican party but has the type of ideology that would be typical of establishment Republicans across the U.S.

This race for second place does, however, carry some significance.

Rumors around the state suggest that the party is grooming her to run against Gov. Jindal in 2011. Right now, there are no viable democrats up to the job, and a strong second place showing by Ms. Fayard would certainly help.

Most likely, Ms. Fayard would not win against Mr. Dardenne or Mr. Jindal, but at age 32, she could be a viable candidate for future higher office.

Please, if you would, support Caroline Fayard for Lt. Gov. of Louisiana, and if you are a registered voter in Louisiana, please vote for Caroline next Saturday.

(Just to be clear, I am in no way connected to the state Democratic Party or the campaign of Caroline Fayard)

Louisiana and West Virginia Primary Results

Swing State Project came down with a rare case of Saturday Night Fever over the weekend, with regularly scheduled primaries in Louisiana and the Senate special primary in West Virginia.

Louisiana: For a brief moment there, back in June, David Vitter vs. Chet Traylor looked like it was going to be a fascinating GOP primary. In the end, though, Traylor’s failure to raise money or increase his profile, along with Louisianans’ decidedly laissez-faire (or is it laissez-les-bons-temps-rouler?) approach to their politicians’ peccadilloes, let Vitter escape with an 88-7 victory. That’s actually better than Charlie Melancon’s 71% against no-name opposition.

Two House races also had some drama. In LA-02 the question was more one of whether state Rep. Cedric Richmond could avoid a runoff against Juan LaFonta, rather than whether he could get the most votes. In the end, he did, winning 60-21 — despite a late financial onslaught from a deep-pocketed LaFonta-backing attorney, Stuart Smith, who created an anti-Richmond PAC called Louisiana Truth PAC — and will face endangered GOP accidental incumbent Joe Cao in November. In LA-03, former state House speaker Hunt Downer was the presumed frontrunner, but barely even squeaked into a runoff with attorney Jeff Landry; Landry got 49.6% to Downer’s 36%. Maybe it’s not that surprising, as Downer got in late and Landry had been running and fundraising all cycle; also, Landry had the teabagger cred while Downer was dragged down by the twin lead zeppelins of “establishment” and “former Democrat.” Downer has shrugged off calls for him to withdraw and avoid prolonging the fight, so the battle in the runoff (for the right to face Dem Ravi Sangisetty) will be for those 14% of voters who went for fellow teabagger Kristian Magar.

West Virginia: Not much drama was expected here, and none was to be found. Gov. Joe Manchin won the Democratic nomination against a challenge from the left from former Rep., former SoS, and former Truman (!) administration official Ken Hechler, 73-17. He’ll face John Raese, whom you may remember spending millions of his own money in 2006 to finish in the mid-30s against Robert Byrd. Raese won the 10-person GOP field, drawing 71%. (The only other GOPer to break double-digits, at 15, was Mac Warner, last seen losing the WV-01 primary this spring.)