DE-AL: We Can Bank On At Least One Pickup Next Year

Public Policy Polling (pdf) (11/30-12/2, registered voters):

John Carney (D): 47

Fred Cullis (R): 24

Undecided: 29

John Carney (D): 44

Charlie Copeland (R): 32

Undecided: 24

(MoE: ±4.1%)

With lots of ominous numbers in the polls for Democrats these days, here’s a ray of sunshine: the GOP’s decision to take a gamble on a Senate pickup by running Mike Castle all but assures them of losing his House seat. Former Lt. Governor (and loser of the 2008 gubernatorial primary) John Carney is poised to  pick this one up. He almost doubles-up on the only announced candidate, never-before-elected businessman Fred Cullis, and has a double-digit lead over the GOP’s best shot at holding the seat, former state Sen. and former Lt. Governor candidate Charlie Copeland. (In the only other poll of this race, R2K had Carney beating Copeland 44-21 in October.)

As one might expect, everyone here, even Carney, is pretty much unknown: Carney is at 27/18 favorables, while Copeland is at 15/19 and Cullis is basically Generic R at this point, which is good for 3/10. PPP points out in a separate release that 24% of Delawareans have a positive impression of congressional Republicans (not coincidentally, the same number who are voting for Cullis), which shows us what we’re up against in terms of Castle’s personal appeal and his ability to transcend his party’s brand in his home state. Delaware pols not up for election in 2010 are in fine shape: Gov. Jack Markell is at 40/31 faves, and Sen. Tom Carper’s at 44/31.

RaceTracker Wiki: DE-AL

NV-03: Rep. Titus Tied with GOP Challenger in New M-D Poll

Mason-Dixon for the Las Vegas Review-Journal (11/30-12/2, likely voters, no trendlines):

Dina Titus (D-inc): 40

Joe Heck (R): 40

Undecided: 20

Dina Titus (D-inc): 48

Rob Lauer (R): 32

Undecided: 20

(MoE: ±6%)

This is one of the first media polls we’ve seen of a 2010 House race, and things don’t look so hot: Rep. Dina Titus is tied against former state Sen. Joe Heck. Heck, you may recall, dropped down from the gubernatorial race to sub in for highly touted rich guy banker John Guedry. (Guedry claimed he bailed on the race for allegedly personal reasons – not long after it came out that his bank received $400 million in TARP funds while cutting him a fat bonus check.) Titus herself was a replacement candidate, joining the race last year after prosecutor Robert Daskas dropped out.

Heck doesn’t have the primary field to himself, though. Real estate “investor” (is that like developer?) Rob Lauer looks to be running to Heck’s right and has said he’ll put $100,000 of his own money into the race. Heck’s biggest sin appears to be his initial refusal to sign an anti-tax pledge (he later changed his mind); with the Republican base exceedingly intolerant of any apostasy these days, this may wind up hurting him. It’s still very early (the primary is June 8th), but we’ll see if Lauer can gain any traction among the teabagger set.

In the meantime, Titus has plenty to be concerned about. One bit of good news is that she leads among independents, 46-37. But the real story is among self-identified Democrats, where she only has a 68-9 margin. Heck, on the other hand, gets the support of Republicans at an 80-2 rate. The fact that 23% of the members of Titus’s own party aren’t sure that they want to support her speaks to broader concerns about the energy and excitement (or lack thereof) within the Democratic base. She’ll need to consolidate those voters in order to secure a second term.

Mase-Dix also asked if voters approved of Titus’s vote in favor of the healthcare reform bill. By a 41-47 margin, they said no. The fact that indies were opposed 38-50 yet she still leads them in the horserace is also a good sign – this vote isn’t a dealbreaker. Dems also approve of healthcare reform by wide margins. The difficulty is that Republicans disapprove of it by even wider margins. Will touting healthcare reform therefore motivate the other side more than your own? It’s a tough situation.

Furthermore, as Tim Sahd points out, the Las Vegas area has been especially hard-hit by the recession and the housing bust. This isn’t helping Titus either. Obviously this is just one poll, and we’re a long way off from election day. Still, she’s in the bottom half of Frontline Dems when it comes to fundraising, and like a lot of members of Team Blue, she has a lot of hard work ahead of her.

Open Seats Lost by Dems Since 1994

Alright, here’s sort of a group trivia question: Which open seat House races (including special elections) have the Democrats lost since 1994? I’m sure that together, we can name them all.

UPDATE: I think this chart covers it. Let me know if I’ve missed any.


Year District Incumbent Status Successor Opponent Results
1995 CA-15 Norm Mineta Retired Tom Campbell Jerry Estruth 59-36
1996 AL-03 Glen Browder Ran for Senate Bob Riley Ted Little 50-47
1996 AL-04 Tom Bevill Retired Bob Aderholt Bob Wilson 50-48
1996 IL-20 Dick Durbin Elected to Senate John Shimkus Jay Hoffman 50.3-49.7
1996 LA-05 Cleo Fields Retired John Cooksey Francis Thompson 58-42
1996 MS-03 Sonny Montgomery Retired Chip Pickering John Eaves 61-36
1996 MT-AL Pat Williams Retired Rick Hill Bill Yellowtail 52-43
1996 OK-03 Bill Brewster Retired Wes Watkins Darryl Roberts 51-45
1996 SD-AL Tim Johnson Elected to Senate John Thune Rick Weiland 58-37
1996 TX-05 John Bryant Ran for Senate Pete Sessions John Pouland 53-47
1996 TX-12 Pete Geren Retired Kay Granger Hugh Parmer 58-41
1997 NM-03 Bill Richardson Named UN Ambassador Bill Redmond Erica Serna 43-40
1998 CA-03 Vic Fazio Retired Doug Ose Sandra Dunn 52-45
1998 CA-36 Jane Harman Ran for Governor Steven Kuykendall Janice Hahn 49-47
1998 KY-06 Scotty Baesler Ran for Senate Ernie Fletcher Ernesto Scorsone 53-46
1998 NC-08 Bill Hefner Retired Robin Hayes Mike Taylor 51-49
1998 PA-15 Paul McHale Retired Pat Toomey Roy Afflerbach 55-45
2000 MI-08 Debbie Stabenow Elected to Senate Mike Rogers Dianne Byrum 48.8-48.7
2000 MO-06 Patsy Danner Retired Sam Graves Steve Danner 51-47
2000 NY-01 Michael Forbes Lost Primary Felix Grucci Regina Seltzer 56-41
2000 PA-04 Ron Klink Ran for Senate Melissa Hart Terry Van Horne 59-41
2000 VA-02 Owen Pickett Retired Ed Schrock Jody Wagner 52-48
2000 WV-02 Bob Wise Elected Governor Shelley Moore Capito Jim Humphreys 49-46
2001 VA-04 Norm Sisisky Died Randy Forbes Louise Lucas 52-48
2002 IN-02 Tim Roemer Retired Chris Chocola Jill Long Thompson 50-46
2002 MI-10 David Bonior Ran for Governor Candice Miller Carl Marlinga 63-36
2002 MI-11 Jim Barcia Elected to State Senate Thad McCotter Kevin Kelley 57-40
2002 OH-03 Tony Hall Named to UN Post Mike Turner Rick Carne 59-41
2002 PA-06 Bob Borski Retired Jim Gerlach Dan Wofford 51-49
2002 PA-18 Frank Mascara Lost in PA-12 Primary Tim Murphy Jack Machek 60-40
2004 KY-04 Ken Lucas Retired Geoff Davis Nick Clooney 54-44
2004 LA-07 Chris John Ran for Senate Charles Boustany Willie Mount 55-45
2004 TX-02 Jim Turner Retired Ted Poe Nick Lampson 56-43
2004 TX-10 Lloyd Doggett Elected in TX-25 Michael McCaul 79-0
2004 TX-11 Chet Edwards Elected in TX-17 Mike Conaway Wayne Raasch 77-22
2004 TX-24 Martin Frost Lost in TX-32 Kenny Marchant Gary Page 64-34

The Michigan and Pennsylvania races in 2002, the Texas races in 2004 and the LA-05 race in 1996 were all due to redistricting. Obviously the Texas races pose a bit of a definitional problem, since most of the affected Dem incumbents ran in different districts (or at least, renumbered districts). But I’ve left TX-10, 11 & 24 on the list because there were indeed no incumbents who ran in those races. TX-02 is a little trickier, because Jim Turned retired outright, but incumbent Nick Lampson ran in the 2nd CD (albeit a very different-looking 2nd CD). But I think it merits inclusion.

And here’s an interesting tidbit: Not counting losses attributable to redistricting, Dems have lost 27 open seats and 12 incumbents since 1994, for a total of 39 over a 15-year period. To take back the House, the GOP needs to win two more than that total – 41.

Bold Maryland Gerrymanders

I was playing around with the newly-updated Dave’s Application that has partisan numbers and was inspired to draw a few new maps for fun !  (I think I like doing this just a little too much …)

MattTX2 inspired me in this post when he said: “One other thing I recently noticed is that in the southern half of the Eastern Shore there are some strong GOP areas have high relatively high African American populations but are still pretty strongly GOP (Talbot, Dorchester, and everything to the South). Those could theoretically be given to Donna Edwards MD-04, bringing it down to the mid/high 60s Obama% while following the voting rights act. That frees up some more heavily Democratic areas in Prince George’s County for other districts. Then MD-01 can stretch around most of the rest of the northern part of the Chesapeake Bay, and into Baltimore to make that seat Democratic.”

At first glance, I thought the same thing as others (and what I’ve always though too) that the Eastern Shore shouldn’t be split and that it would be a very tough sell for the Legislature to do during redistricting – and probably this conventional wisdom is still correct … BUT, what if the Shore can be split ?  the way to do it would be to neatly split the Upper Shore from the Lower Shore … if the Legislature went for any splitting of the Shore, it might be when done in such a manner, as the two parts of the Shore are somewhat distinct when split along this line.  

MattTX2 is correct that drawing the lines this way would be the most economical way for Democrats to free up more Democratic areas in PG Co. to be used for other districts on the western shore.  The plan here keeps both MD-4 and MD-7 majority African-American (50%+) while making every other district either 59% Obama (MD-1, MD-3, and MD-6) or 60% Obama (MD-2, MD-5 and MD-8).  This is marginally even better than the plan I originally drew in September, where I had Obama with at least 58% in each district:  http://www.swingstateproject.c…  It appears that the only way to get to at least 59%-60% Obama for each Maryland district, WHILE keeping the two majority black districts intact, is to use the Lower Eastern Shore in this manner.  

Here’s the map:

MAP 1: At least 59% Obama in each district; both black-majority districts preserved

Photobucket

This is advantageous in that all districts now will be solidly Democratic.  MD- 3 currently is itself 59% Obama, so it will be just as Democratic under the new lines as it currently is. MD-1 and MD-6 will, ofcourse, be a lot more Democratic than they currently are — at 59% Obama under the new lines.  MD-2 is now at 60% Obama, and that will not change.  In MD-5 and MD-8 the Democratic percentage will go down ofcourse, but at 60% Obama, they will still be very safe districts for us.  Interestingly, both Hoyer and Van Hollen are near the top of the Democratic power hierarchy, so they should have the resources to win in 60% Obama districts.  Hoyer might even like this less-Democratic district better, as it’s also less African-American and thus the lesser likelihood of a Democratic primary challenge for Hoyer in the future.  Van Hollen’s new district is one, btw, where the John Kerry percentage would be around 55% even under the new lines, as Obama’s improvement on Kerry was not as great in Montg. Co. and western MD as in other parts of the state (in all other districts drawn here, Kerry would have received at least approx. 53% of the vote).

While the black percentage in the new MD-4 and MD-7 will only be 50%+ black (which will satisfy the VRA), these districts will also be guaranteed to have continued black representation because in both districts, blacks as a percentage of the Democratic primary will still be at around 70%, and when it comes to the general election, the new MD-4 and MD-7 voted 70% Obama and 67% Obama, respectively.  

I have also kept the home of each incumbent in the district in which they currently are under the new lines.  Although my “TTP” scores are lower than in an ideal situation, each district manages to preserve at least 30% of the territory of the current district (but in most cases here, hovers around 40%, with the new MD-8 being an exception in that a full 56% of the population is preserved – although, ironically, the new MD-8 “looks” quite different on a map).

The second map I drew for fun is an EVIL 5-3 Republican gerrymander !  It’s possible to redraw Maryland in a manner where McCain wins 5 districts (albeit all 5 by the slightest margin) while Obama wins MD-4 and MD-7 by 92% and 90%, respectively, while MD-8 is 75% Obama.  Here it is:

MAP 2: Evil 5-3 GOP gerrymander

Photobucket

Under the map above, MD-4 and MD-7 are 68% and 69% black, respectively, while the new MD-8 is only at 49% white (blacks and Hispanics both at 17% and Asians at 13%).  This would be a GOP dream come true.  Perhaps Kratovil or Hoyer could still win the new MD-1 but it wouldn’t be guaranteed.  The GOP could draft Ehrlich to run for his old MD-2 again, or perhaps the new MD-3, as Ehrlich grew up in Arbutus.  Bartlett could still face a strong Democratic challenge in his new MD-6, but another GOPer could be a lot stronger there.  The new MD-5 could easily go Republican if they ran an Anne Arundel-based moderate to conservative candidate.  It’s interesting to note that under the EVIL GOP plan, the districts appear fairly compact and overall seem to respect county lines and “communities of interest” (!) a lot more than the first map I drew.

Weekly Open Thread: What Races Are You Interested In?

Here’s another fun map link: the 50 largest metro areas, carved out of their respective states and resized (along with the diced-up states) by population. No surprise that NYC, L.A., and Chicago are the three biggest, and even without their major metro areas, Texas and California are the two biggest states. The third-largest state, though, is interesting. Click and have a look.

Also, check out this bit of awesomeness from the WaPo:

Correction

Thursday, December 3, 2009

A Nov. 26 article in the District edition of Local Living incorrectly said a Public Enemy song declared 9/11 a joke. The song refers to 911, the emergency phone number.

NV-Sen, NV-Gov: More Trouble for the Reid Boys

Mason-Dixon for the Las Vegas Review-Journal (11/30-12/2, likely voters, 10/6-8 in parens):

Harry Reid (D-inc): 42 (43)

Danny Tarkanian (R): 48 (48)

Harry Reid (D-inc): 41 (39)

Sue Lowden (R): 51 (49)

(MoE: ±4%)

Them ol’ Reid Boys got themselves a heap of trouble. Harry Reid trails both Sue Lowden and Danny Tarkanian by significant margins. Reid also has bad favorables of 38/49, compared with blank-slate-ish results for the GOPers: 33/13 for Lowden and 32/12 for Tarkanian.

Former state party chair Lowden, who now has prominent GOP strategist Dick Wadhams in her cheering section, has a lot of noisy detractors in the GOP screaming “RINO” (mostly from Paulists ticked off over her anti-Ron Paul chicanery at the 2008 caucus). But she still has enough establishment support for a small plurality in the primary, as seen below. Note that the big gainer is, as I expected, right-wing Assemblywoman Sharron Angle, who seems to be carrying the movement conservative flag in this race. But contrary to what I expected, this may be more of a three-way race than a five-way, though: rich guy John Chachas and state Sen. Mark Amodei are down at 1% with the nobodies.

Sue Lowden (R): 25 (23)

Danny Tarkanian (R): 24 (21)

Sharron Angle (R): 13 (9)

Bill Parson (R): 1 (1)

Robin Titus (R): 1 (1)

Mike Wiley (R): 1 (1)

John Chachas (R): 1 (NA)

Mark Amodei (R): 1 (NA)

Undecided: 33 (44)

(MoE: ±6%)

Political Wire also has a leaked look at the same poll’s gubernatorial numbers. UPDATE (DavidNYC, 12/5): The full numbers are now available from the LVRJ:

Jim Gibbons (R-inc): 18

Brian Sandoval (R): 39

Michael Montadon (R): 6

Undecided: 37

(MoE: ±6%)

Rory Reid (D): 34 (33)

Brian Sandoval (R): 49 (50)

Undecided: 17

Rory Reid (D): 48

Jim Gibbons (R-inc): 34

Undecided: 18

Rory Reid (D): 24 (25)

Brian Sandoval (R): 32 (33)

Oscar Goodman (I): 35 (33)

Undecided: 9

Rory Reid (D): 25

Jim Gibbons (R-inc): 25

Oscar Goodman (I): 38

Undecided: 12

(MoE: ±4%)

The younger half of the Reid boys, Clark County Commissioner Rory Reid, isn’t faring well either, getting pasted by Republican former AG Brian Sandoval in a two-way and finishing third behind Las Vegas mayor Oscar Goodman and Sandoval in a three-way. My personal wish list is to see a Goodman/Reid Dem primary matchup and a Goodman/Sandoval general polled — Goodman is a Dem as Las Vegas mayor, and running as a Dem would probably only increase his chances of winning the general as he’d probably pick up most of those Reid votes in the general (however, he’s been pretty adamant that if he runs, it’s as an indie). Not that we might necessarily want the, um, “colorful” Goodman to be governor, but that’s a whole ‘nother kettle of fish.

I’m not sure if the LVRJ didn’t leak numbers of a Reid/Gibbons and Goodman/Reid/Gibbons matchup like they did last time, or if they didn’t even bother polling it. (UPDATE: They did poll Gibbons.) This time (unlike last time), they tested the GOP primary, finding a mighty edge for former AG Brian Sandoval, so maybe they decided just not to bother polling Gibbons in the general. Problems abound on every front today for Gibbons, whose soon-to-be-ex-wife Dawn is interviewed in Reno Magazine and paints an entirely unsympathetic portrait of the governor.

RaceTracker Wiki: NV-Sen | NV-Gov

SSP Daily Digest: 12/4

MA-Sen: We’re half a week away from the primary special election in Massachusetts, and AG Martha Coakley is still in the catbird’s seat, at least according to an internal poll from her own camp (conducted by Celinda Lake) that got leaked to Chris Cillizza. Coakley’s at 41, with Rep. Michael Capuano at 21 (consistent with other polls seeing a last-minute surge by the Congressman), Stephen Pagliuca at 10, and Alan Khazei at 7.

TX-Sen, TX-Gov: This has been broadly telegraphed already, but Houston mayor Bill White made it official today at a press conference: he’s dropping out of the Senate special election that looks less likely to ever happen, and getting into the Governor’s race instead. A Democrat has not won statewide office in Texas since 1994, but White is well-funded and, assuming he faces Rick Perry in the general, his centrist competence may match up well against Perry’s quick-draw conservatism. Also, I’m not the first wag to notice this, but it’s snowing today in Texas, so cue up all the jokes about hell freezing over and Democrats getting elected. (UPDATE: Former Ag Commissioner candidate Hank Gilbert is dropping out of the Dem field in the governor’s race today and heading for another Ag Comnissioner race, which probably isn’t a surprise. However, this part is a surprise: he’s endorsing hair-care guru Farouk Shami instead of White.)

MN-Gov: Rumors were starting to pop up (via Politico, natch) that Republican ex-Sen. Norm Coleman was trying to raise his profile in preparation for a gubernatorial run. Coleman himself, however, said that’s not the case; he’s focusing on some think-tank work in Washington for now and will look at the “political horizon” later.

OR-Gov: Here’s a surprise on the fundraising front: Republican Chris Dudley, who’s never run for office before and whose main claim to fame is being the Portland Trail Blazers’ designated free-throw-misser in the late 90s, filed records he already has $340K banked for a still-unannounced gubernatorial run (more than John Kitzhaber’s $280K). Worth noting, though: more than half of that came from only three huge donations, including $100,000 from Dudley’s ex-agent. (An interesting tidbit: $5,000 came from ex-teammate Terry Porter.) Also, Dudley is quickly swinging establishment endorsements his way, including from moderate state Sen. Frank Morse, who was briefly rumored as a candidate himself, and former House majority leader Wayne Scott, who is trying to walk back his previous endorsement of Allen Alley. However, as the Oregonian’s Jeff Mapes points out: “None of them have a firm idea of where Dudley will come down on the issues.”

PA-Gov: Dan Onorato has been teasing a big endorsement this weekend, but he pulled aside the curtain a day ahead: it’s Rep. Patrick Murphy, which is especially helpful for Onorato as he seeks to gain ground in the Philly suburbs to expand beyond his own Pittsburgh base. On the GOP side, there have been growing calls from newspaper editorial boards for Tom Corbett to either resign as AG or get out of the gubernatorial race, citing the conflict of interest in Corbett having accepted donations from those he’s now charging with crimes in the Bonusgate saga. Yesterday, the Lancaster Intelligencer-Journal joined in.

SC-Gov: Two items of sort-of-good, or at least somewhat-less-bad, news for Mark Sanford: first, most of the 37 ethics charges against Sanford were dismissed by a state legislative panel. Nine of the charges (involving use of state aircraft) still stand, though, and on Monday, the panel meets again on whether to refer impeachment charges to the full Judiciary committee. And second, a Rasmussen poll finds a narrow plurality saying “no” to the issue of whether he should resign (41-42), and a 36-49 response to the question of whether he should be impeached if he doesn’t resign. 54% say he is “about as ethical” as other politicians.

TN-Gov: The Democratic gubernatorial field in Tennessee is rapidly shrinking this week: not only did state Sen. Roy Herron jump out to pursue TN-08 instead, but businessman Ward Cammack pulled the plug yesterday after no progress on the fundraising front. That leaves beer baron and gubernatorial progeny Mike McWherter, state Sen. minority leader Jim Kyle, and former state House majority leader Kim McMillan in the hunt.

CO-07: There’s another Republican entrant in the 7th, where Aurora city councilor Ryan Frazier recently dropped down from the Senate race to take on sophomore Democratic Rep. Ed Perlmutter. Lang Sias, an Iraq vet who worked on veterans’ outreach for the McCain campaign, is getting in the race; he’s also getting some big-name help, including former RNC press secretary Alex Conant.

IA-03: State Sen. Brad Zaun officially kicked off his campaign yesterday; he’ll face wrestling coach Jim Gibbons for the GOP nod to take on the perpetually shaky Leonard Boswell in the Des Moines-based 3rd.

IL-14: The GOP field is getting re-arranged in the 14th, and there’s some strategic thinking behind it. Businessman Jim Purcell dropped out, probably because nobody knew who he was, but specifically argued that he didn’t want to split the anti-Ethan Hastert vote, saying that the Hastert name would be poison in the general election. Presumably, his absence will benefit Hastert’s main challenger, state Sen. Randy Hultgren.

TN-08: TPM has a nice expose of the NRCC’s efforts to not-so-subtly gay-bait state Sen. Roy Herron, who just took over the helm for the Dems in the race in the 8th. They’re trying to get mileage out of Herron’s personal blog, asking why he’s allegedly so focused on his “body image” and then asking (on the issue that Herron has never been a businessman) “So why can’t Roy Herron just be straight with West and Middle Tennesseans and admit it?”

Polling: I know Rasmussen gets a lot of grief in the comments (and on the front page sometimes, too), so it’s worth taking a look at a recent piece of Mark Blumenthal wondering “Why is Rasmussen So Different?” His answers center on their likely voter model (which should come as no surprise to SSP readers) and also the way they ask their approve/disapprove questions. The article also has a very helpful chart showing the “house effects” of all the major pollsters, showing Rasmussen one of the rightmost, right next to Zogby and Harris. (Interestingly, the graph also shows PPP skewing right-of-center… and Fox News skewing a bit left.)

Maps: I also know that SSPers like maps, so here are some maps courtesy of the Seattle Times of last month’s King County Executive and Seattle mayor’s races. The KCE results are kind of a no-brainer — the more rural you are, the more likely you were to vote for losing quasi-Republican Susan Hutchison. The Seattle mayor results are very interesting, though, showing the more likely you are to have a scenic view from your house, the more likely you were to vote for Joe Mallahan, showing some class-based fissures between the coalitions of establishment progressive Mallahan and anti-establishment victor Mike McGinn.

WI-7 GOP primary obsesses over gay marriage

The 7th Congressional District in Wisconsin is generating a smackdown centered over the issue of gay marriage.  Sean Duffy who stared on the MTV show “The Real World” has been attacked by Republican primary opponent Dan Mielke because he appeared on the “homosexual lifestyle affirming” show The Real World.  The link below details how GOP primary hopeful, Dan Mielke is attempting to force the Chair of the Wisconsin Republican Party, Reince Preibus, a strong ally of the national Republican Chairman Michael Steel, to affirm the state Republican Party stands behind the most extreme issues and attitudes on gay marriage.

Duffy opposes gay marriage for the record, he just does not oppose any and all attempts to allows gay couples access to the over 1400 rights and privileges linked to the institution of marriage by lawmakers over the years.

here is the link to the entire article: http://www.spooneradvocate.com…

AR-Sen: Polls Show Serious Lincoln Vulnerability – in General & Primary

Research 2000 for Daily Kos (11/30-12/02, likely voters, 9/8-10 in parens):

Blanche Lincoln (D-inc): 42 (44)

Gilbert Baker (R): 41 (37)

Undecided: 17 (19)

Blanche Lincoln (D-inc): 44 (45)

Curtis Coleman (R): 39 (37)

Undecided: 17 (18)

Blanche Lincoln (D-inc): 45 (46)

Tom Cox (R): 31 (29)

Undecided: 24 (25)

Blanche Lincoln (D-inc): 46 (47)

Kim Hendren (R): 30 (28)

Undecided: 24 (25)

(MoE: ±4%)

Rasmussen (12/1, likely voters, 9/28 in parens):

Blanche Lincoln (D-inc): 39 (39)

Gilbert Baker (R): 46 (47)

Undecided: 9 (8)

Blanche Lincoln (D-inc): 40 (41)

Curtis Coleman (R): 44 (43)

Undecided: 9 (11)

Blanche Lincoln (D-inc): 40 (40)

Tom Cox (R): 43 (43)

Undecided: 10 (11)

Blanche Lincoln (D-inc): 39 (41)

Kim Hendren (R): 46 (44)

Undecided: 9 (10)

(MoE: ±4.4%)

These are Moe Szyslak numbers – plug-fugly. In fact, Tom Jensen says things are actually worse than they appear: In PPP’s recent poll of AR-02, undecided voters in that district gave Lincoln wretched 11-58 favorables (yeah, you read that right). It’s starting to make me wonder how Lincoln can survive, especially if Baker winds up being the GOP nominee – and it makes these other numbers from R2K all the more interesting:

Bill Halter (D): 34

Gilbert Baker (R): 42

Undecided: 24

Bill Halter (D): 35

Curtis Coleman (R): 40

Undecided: 25

Bill Halter (D): 36

Tom Cox (R): 32

Undecided: 32

Bill Halter (D): 36

Kim Hendren (R): 31

Undecided: 33

(MoE: ±4%)

Lt. Gov. Bill Halter is mooting a primary challenge to Lincoln, and as you can see, all of the Republican candidates fare identically against him as they do against the incumbent. The big difference, though, is that Lincoln’s overall favorables are underwater at 41-50, while Halter is in positive territory at 36-25 – and two-fifths of the state doesn’t even know him yet. On account of that, I have to believe Halter would do better than Lincoln once he’s better-known. But the first question is, can he win a primary?

Blance Lincoln (D-inc): 42

Bill Halter (D): 26

Undecided: 32

(MoE: ±5%)

Forty-two percent is not where an incumbent wants to be in a potential primary matchup, especially against a guy who’s unknown to a third of Democrats. Lincoln’s numbers among members of her own party are fairly decent, 62-32. But among Dems, Halter clocks in at a nifty 55-11, and he clearly has room to grow

I’d also like to point out that Halter is hardly some unelectable left-wing gadfly. To the contrary: He won statewide office in 2006 with a higher share of the vote than even super-popular Gov. Mike Beebe. And while I certainly wouldn’t expect Halter to be a progressive standard-bearer, there’s little question he’d be better on healthcare than Lincoln, given that’s how he’s hoping to get traction against her.

In the end, I don’t see how we wouldn’t be better off with Halter, whose negatives almost surely wouldn’t wind up as awful as Lincoln’s, and who can’t be tied to DC in quite the same way. It wouldn’t be an easy fight – waging war against an incumbent seldom is. But I’d like to see him try.

(Note: According to the SSP calendar, Arkansas’s filing deadline is March 8th and the primary is May 18th.)

RaceTracker Wiki: AR-Sen

Electoral Polarization

By: Inoljt, http://mypolitikal.com/

In my previous post, I noted that almost all the counties President Barack Obama won have become more Democratic since 1992, while almost all the counties Senator John McCain won have become more Republican since 1992.

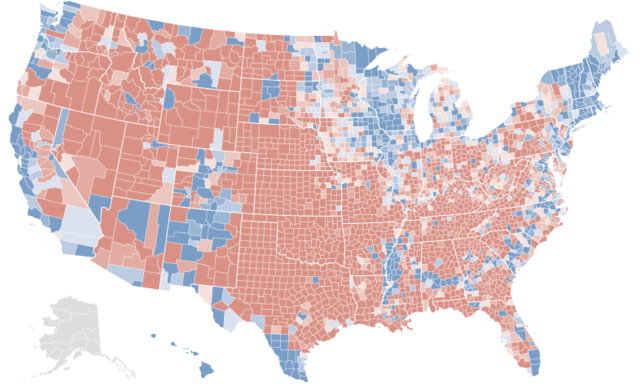
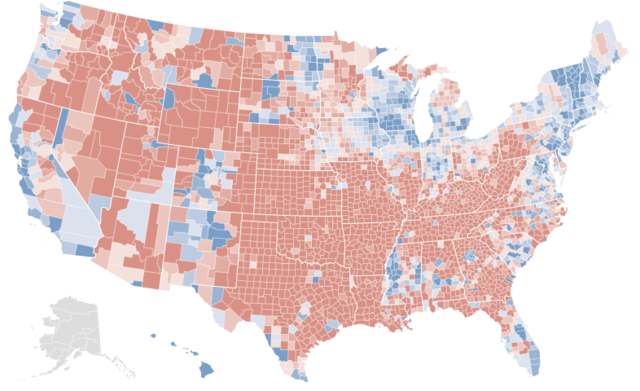
In fact, comparing maps of the 2008 presidential election and the county changes from 1992 indicates a striking correlation.

Here is the 2008 presidential election:

Photobucket

Here are the changes from the 1992 presidential election:

Photobucket

This hints at a disturbing picture of electoral polarization. More analysis below.

On the one hand, all this is somewhat intuitive. If a Democratic candidate does well in a specific place, he or she probably improved on a previous Democrat’s performance there – and vice versa. Moreover, these maps do not imply that all blue regions became more Democratic (nor the opposite); rural Appalachia, in the most famous instance, has trended sharply Republican, while much of suburban American has gone in the opposite direction.

On the other hand, this phenomenon does not constitute a mathematical rule. If a Democratic candidate wins a county, that doesn’t necessarily imply that he or she improved upon a previous Democrat’s performance. He or she could have done worse but still won; the previous Democrat might have overperformed, or the Republican might have encouraged cross-over voting.

Yet by and large, this has not been the case. Obama practically always outperformed former President Bill Clinton in today’s Democratic counties. Mr. McCain practically always overperformed former President George H. W. Bush in today’s Republican counties.

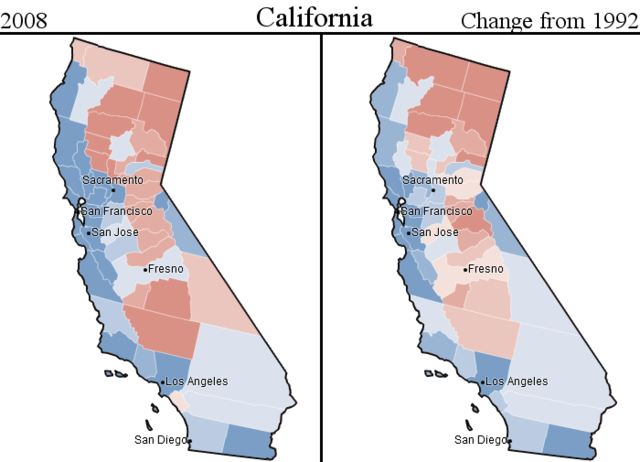
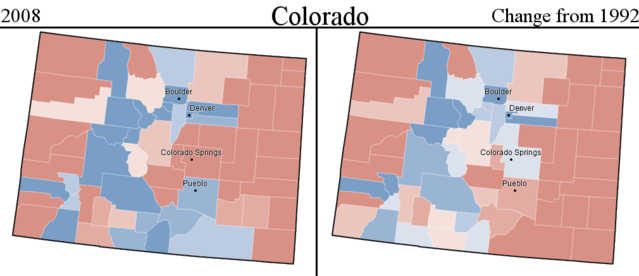
Taking a look at selected states provides a powerful illustration of this fact.

Here is California:

Photobucket

Here is Colorado:

Photobucket

All this implies something rather disturbing: electoral polarization has been steadily increasing. Obama only improved on Mr. Clinton’s performance in the counties Obama won. McCain only improved on Mr. Bush’s performance in the counties McCain won. The almost total lack of cross-over gain suggests that each party has come to depend on deepening their base, rather than widening the electorate and appealing to moderates.

That America is getting more divided has, of course, been known for a fairly long time. In some ways the maps exaggerate the polarization: 1992 Clinton appealed to many Republicans, while Obama’s strength lay amongst the Democratic base. Then there is the Ross Perot effect, which lowered margins in both party strongholds (e.g. New England, the Plains states).

But perhaps a bit of exaggeration is needed. Polarization has rarely been good for any country, and its increasing prevalence bodes poorly for the future of the United States. A map like this provides a potent illustration of polarization in action; indeed, I have never encountered a more striking image of its increase. Such a picture might do us some good.

(Note: Credit for all maps is given to the NYT; some images have been modified.)