Analyzing Orange County: Why America’s Most Conservative County is Trending Blue (part 1/2)

(Note: This is a two-part diary on analysis of Orange County, i am writing up analysis of the effect of Prop 8 tomorrow. I apologize if it seems too long, but this is from a perspective of an OC resident. Comments and criticisms are welcomed.)

In 2008, Barack Obama accomplished something no other Democrat statewide could do: Keep Orange County within single digits (47-50%). While everyone knew he would win California (maybe not by the double-digit margin he did it by), no one including many OC Democrats here would imagine him being on the cusp of a symbolic victory: Winning in territory the media calls “America’s most conservative county”, the home of Richard Nixon and the center of Conservatism in California.

Well, how did he do it? Well, much like the so-called “Obama Wave” swamped the entire country, it also hit ground here in Orange County, taking the top three populated cities (Santa Ana, Anaheim and Irvine) and making large inroads in normally-conservative areas. President Obama wasn’t the only major change to Orange County politics, the controversional ballot measure known as Proposition 8 also broke-down boundaries, and you wouldn’t believe which cities voted for (or narrowly against) and against it, but first let’s take a look at each cities performance for the 2008 Presidential election (08′ only):

City PVI % ’08 Notes
(Orange County) R+4 47/50 Whole county.
Aliso Viejo D+1 53/45 Incorporated after 2000 Census
Anaheim R+1 51/47 Minority-majority; Second-largest city
Brea R+10 42/56
Buena Park D+1 53/44 Large Asian and Latino populations.
Costa Mesa EVEN 52/46
Cypress R+5 47/51
Dana Point R+5 47/51
Fountain Valley R+9 43/55
Fullerton R+3 48.6/49.8 College town; Minority-majority
Garden Grove R+5 48/51 Minority-majority; Large Vietnamese population
Huntington Beach R+6 46/52 Libertarian-leaning
Irvine D+5 57/41 College town
La Habra R+3 49/48.6 Minority-majority
La Palma R+3 48.4/49
Laguna Beach D+11 63/35 Well known for large LGBT community
Laguna Hills R+7 45/53
Laguna Niguel R+6 46/52
Laguna Woods EVEN 52/46 Extremely high percentage of Senior citizens
Lake Forest R+7 46/53 Large evangelical presence; Added communities after 2000 census
Los Alamitos* R+4 49/50
Mission Viejo R+8 44/54
Newport Beach R+12 40/58 Libertarian-leaning
Orange R+7 45/53
Placentia R+9 43/55 Large Hispanic population
Rancho Santa Margartia R+9 43/55
San Clemente R+10 42/56 Home of Ronald Reagan
San Juan Capistrano R+10 42/56
Santa Ana D+14 66/32 Largest city; Hispanic-majority; Most Democratic
Seal Beach R+5 48/51
Stanton D+2 54/44 Minority-majority
Tustin EVEN 52/46
Villa Park R+25 27/71 Most Republican; Least populated city
Westminster R+10 42/56 Large Vietnamese population, home to Little Saigon
Yorba Linda R+18 32/66 Birthplace of Richard Nixon

*Number 12 on the map, wasn’t added to the list.

If your one who prefers visuals (and tolerates crappy novice-style use of paint :P), then look below:

Angry face

This result shows that Obama made a large impact on Hispanic voters (OC was very Pro-Clinton during the primaries, as well as Hispanics), winning the heavily hispanic cities of Santa Ana, Buena Park, Stanton and Anaheim. He also made inroads with more conservative areas in the south, losing Huntington Beach by only 6 points (46-52) while it has a majority GOP registration edge, and Lake Forest by a similar margin (46-53), known for its strong evangelical presence such as the Saddleback Church and its pastor Rick Warren. Obama also gained huge support amongst young voters, handily carring Irvine (home to UC Irvine), and narrowly (48.6-49.4) losing Fullerton (home to Cal State Fullerton). From here, we’re going through a city-by-city analysis of how it votes, demographics and whether its going to be competitive in the elections to come:

(Note: I will detail the important cities to look for below, so not all 34 cities will be listed below.)

Aliso Viejo:

Population: 46,123

Analysis: Nestled in the fast-growing area of South Orange County, Aliso Viejo (the youngest city as of 2001) is an example of a city that is trending Democratic. Not only did it vote for Obama by a comfortable 6 point margin, it was one of only 4 cities here in Orange County that voted AGAINST Proposition 8 (48.5-51.5) and the second-strongest showing against the measure, Laguna Beach being the strongest. It is the stereotypical “Country club” Republican city, fiscally conservative on most issues (Also voting against the state’s High speed rail initative, which passed) but fairly moderate-to-liberal on social issues, voting against Propositon 4 which sought to restrict contraceptives to minors unless a parent has consent. If any Democrat statewide seriously plans to turn Orange County blue, winning Aliso Viejo is a must.

Anaheim:

Population: 353,643

Analysis: The second largest city in the county and the main entertainment hub, home to Disneyland. Anaheim is a city that is easily classified by geography. Most of Anaheim is fairly urban and very Hispanic, mainly around the Downtown area. But to the East, lies a whole different kind of Anaheim: the community of Anaheim Hills. Already hearing the name, and you’re correct to guess that its a more wealthy, upscale area far different than its neighbor to the west. Home to mansions and a getaway for celebrities, Anaheim Hills is strongly GOP turf, fiscally and socially conservative but more so on the fiscal side. For someone to want to turn Orange County blue, they would need to keep their margins down in Anaheim Hills and fairly high in the rest of Anaheim.

Brea:

Population: 40,377

Analysis: This one is personal since this is where i live, but its also the most descriptive as well. Surrounded by large cities (Fullerton, Chino Hills and Diamond Bar), Brea is a sanctuary to escape from the bigger more urban cities in and around LA County. Politically, however Brea is strongly conservative, especially socially. There is a large and very influential Mormon presence here (There’s two LDS places of worship here alone!) along with large Catholic, and Baptist faiths. To the south is the even-more conservative city of Yorba Linda, who uses the city of Brea’s Police since they don’t have their own department. However there is a steadily growing Hispanic population, mainly from neighboring La Habra and cities near Brea in LA County, but like with Mormons they are socially-conservative as well, so its a double-edged sword. No Democrat will win here, but cracking 40% here is an accomplishment in its own.

Buena Park:

Population: 84,141

Analysis: It shares similarities with its neighbor Anaheim in that: Both have large Hispanic populations, and both are known for its amusement parks (Knott’s Berry Farm for Buena Park). Yet Buena Park is slightly more Democratic due to its large Asian population (most likely from nearby Cerritos in L.A County) and its higher turnout rates than Anaheim. Buena Park is a must win city, and getting around 55% would be enough for a squeaker county-wide.

Costa Mesa:

Population: 117,178

Analysis: Surrounded by larger cities, Costa Mesa is a popular city to live in due to its close proximity to Huntington/Newport Beach, and close to UC Irvine. But Costa Mesa has made the news for declaring itself a “Rule of Law” city, taking a hard line against illegal immigration. The person most responsible for bringing it up for a vote? The Mayor, Allan Mansoor, who is also running for the State Assembly (Gee, see how that all works out?) in 2010. Despite this, Costa Mesa is trending Democratic because of its large Latino population, along with people from nearby Irvine moving to Costa Mesa. Another must-win to turn the OC Blue.

Fullerton:

Population: 106,335

Analysis: Home to Cal State Fullerton (the largest in the state by enrollment), Fullerton is a fast-growing suburb of Los Angeles and an overall enjoyable city. Gaining a larger Latino population due to its close proximity to Whittier and South Los Angeles, makes Fullerton a swing city for elections to come.

Garden Grove:

Population: 174,715

Analysis: Garden Grove is home to a very large Vietnamese population, much like nearby Westminster is as well. In terms of voter registration, Republicans edge Democrats by around 3,000 voters but gave John McCain a solid 52%. The reason being because Garden Grove is very conservative on social issues, and viewed Obama as too liberal for them. Along with their generally anti-communist views, Garden Grove is also home to a small, but noticable Latino population, mainly from nearby Santa Ana.

Huntington Beach:

Population: About 200,000

Analysis: A well-known tourist destination for those looking for great surfing, Huntington Beach symbolizes a “Live free and Die” mentality, and its voting record is one to notice carefully. Voting for McCain 52-46% while subsequently voting against Prop 4 by 3 points and narrowly voting for Prop 8 by 2 points. If this trend continues, Huntington Beach will be poison for social conservatives.

Irvine:

Population: 212,184

Analysis: Irvine is a city that is rapidly turning Democratic, due to the extremely large influence the University of California, Irvine campus has on the city. In fact, all of the precincts in and around UC Irvine went around 80% for Obama. The city council has a Democratic majority, along with the Mayor, and has implemented many progressive policies. Democrats, Republicans and Decline to State voters all have around 30,000 voters each, meaning Irvine is a solid tossup for elections to come, but give it a Democratic edge due to its large youth voters.

Laguna Beach:

Population: 23,727

Analysis: Laguna Beach is the major LGBT scene in Orange County, and was one of the first cities to sponsor a resolution opposing Proposition 8, so its no surprise that Obama carried Laguna Beach by a landslide. Laguna Beach is the second most Democratic city in Orange County, and will likely overpower Santa Ana as #1 in the near future. Any Democratic candidate can easily win here.

Lake Forest:

Population: 78,720

Analysis: Home to the Saddleback Church and its pastor, Rick Warren, Lake Forest is situated within Southern Orange County and is close to the cities of Mission Viejo and Irvine. Despite its reputation as being home to major evangelical groups, Obama did surprisingly well, keeping his loss within single digits. Could he win here in 2012? It depends on a number of factors, but it can’t be ruled out.

Santa Ana:

Population: 355,662

Analysis: Santa Ana is ground zero for Democrats, its strongest (being the most populated city in the county) and safest city politically. Home to an extremely large (almost 80%) Hispanic population, Democrats routinely poll in the high 60’s and all of the currently elected officials (State Senate/Assembly/Congress) have Santa Ana as their major base.
Analyzing Obama’s Weak Spots – Part 2: The Northeast

This is the second part of three posts analyzing the congressional districts President Barack Obama underperformed in. It will focus on his relative weakness in the northeast. The third part can be found here.

The Northeast

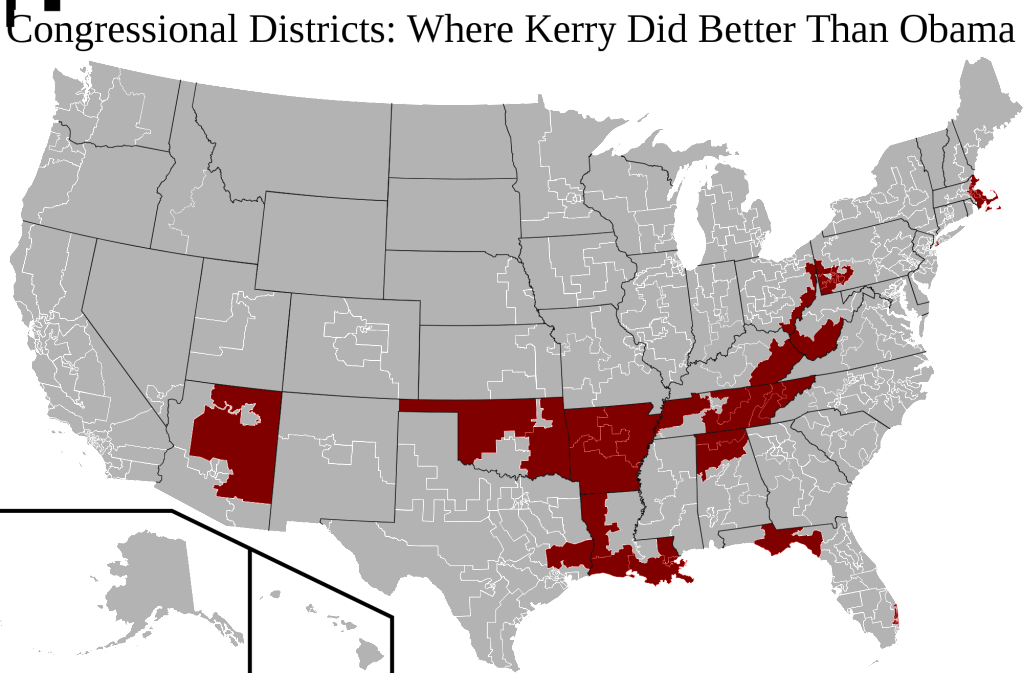
In my previous post I created a map of congressional districts in which Mr. Obama performed worse than Senator John Kerry:

Analyzing Obama's Weak Spots

In this map the most obvious pattern is a roughly diagonal corridor of Republican-shifting congressional districts, stretching from Oklahoma and Louisiana through the Appalachians. This area has long been seen as a place in which the electorate is moving away from the Democratic Party.

The post then looked at the Northeast, another region in which Mr. Kerry did better than Mr. Obama.

More below.

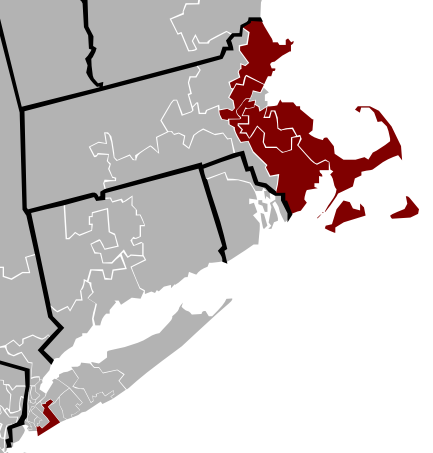
Unlike Applachia and the Mississippi Delta, the conventional wisdom characterizes the Northeast as a stable Democratic stronghold. Yet, as the map below indicates, six northeastern congressional districts shifted Republican in 2008:

Analyzing Obama's Weak Spots - Part 1

Much of the movement in Massachusetts, of course, occurs due to the loss of Mr. Kerry’s home-state advantage. Yet the districts in Massachusetts (MA-4, MA-6, MA-7, MA-9, and MA-10) also share a number of commonalities. All are quite suburban, quite wealthy, and quite white. Unlike the Appalachian districts above, these places vote substantially Democratic. Neither Mr. McCain nor former President George W. Bush came within single-digits in any of these districts (I suspect 1988 was the last time a Republican presidential candidate did so). Yet this is also Scott Brown territory; the Republican candidate won four of these  districts.

Notice, too, the highlighted New York district (NY-9). Like those in Massachusetts, this district is inhabited mainly by middle-class, Democratic-voting whites. The effect of 9/11, which convinced many New Yorkers to vote Republican, was particularly strong in places like these (in fact, it was probably greater here than anywhere else in the nation). Orthodox  Jews, an increasingly Republican demographic heavily represented in this district, have shifted strongly Republican since then.

Indeed, Long Island as a whole was relatively lukewarm towards Obama. Apart from the fighting ninth, Republicans did respectably in NY-3 and NY-5, holding Obama’s improvement to less than 1% in both districts. Like NY-9, these places are wealthy and suburban.

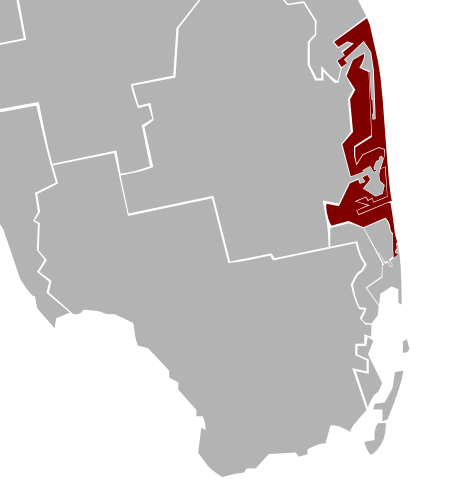
One wonders whether this change is merely a temporary blip or the start of something more worrisome for Democrats.  The case of Florida is probably not reassuring:

Photobucket

This is Florida’s Gold Coast – a Democratic stronghold – and three districts here (FL-19, FL-20, FL-22) voted more Republican than in 2004. Mr. McCain’s age probably helped him along here; the large population of retirees may have empathized with one of their own.

Ironically, a large number of these retirees probably came from NY-9 or eastern Massachusetts. Like both areas, these districts vote Democratic but have been slowly moving Republican. FL-22 is the exception, having been not very Democratic to begin with. In FL-19 and FL-20, on the other hand, Democratic candidate Al Gore did substantially better than both Obama and Kerry. This was a function of the substantial Jewish population in these districts; Jews strongly supported Joe Lieberman, his Jewish nominee for Vice President.

Fortunately for Democrats, almost none of the Florida or northeast districts represent a 2010 pick-up opportunity for Republicans. Except for FL-22, all have voted Democratic by double-digits for at least three consecutive presidential elections. A few weeks ago a special election in FL-19 resulted in a 27% Democratic margin victory. It is the long-term that is worth concern for Democrats.

In the short term, Democrats must worry about Appalachia and the Mississippi Delta. There Democrats are in deep, deep trouble for 2010. There are a surprising amount of Democratic representatives in these Appalachian seats where Mr. McCain did better than Mr. Bush. Their predicament will be the subject of the next post.

The Myth of Anti-Incumbent Elections Part I: 2006 elections

Cross-posted at Politics and Other Random Topics

A little while back, ThinkProgress’s Matt Yglesias made a very good point about how it’s kinda weird that the media and many others are arguing that there is some sort of broad “anti-incumbency” mood going on in the country.

Yglesias writes:


There’s something inherently odd about the concept of an anti-incumbent wave in a country wherein the overwhelming majority of incumbents are invariably elected. In the 2008, for example, 23 House incumbents were defeated in an unusually eventful election. A year in which “only” 75 percent of incumbents running for re-election were successful result in a shockingly large amount of change in the House. Indeed, I think everyone regards such a scenario as wildly unrealistic. And yet it would be hard to describe a universe in which 75 percent of incumbents are re-elected as all that gripped by anti-incumbent sentiment.

The interesting thing is that both 2006 and 2008 are largely seen as being both anti-Republican and anti-Incumbent (2008 moreso than 2006), but by absolute numbers, the number of incumbents who lost and the number of seats where the incumbent party switched are actually pretty low. A lot of people might be asking the obvious question; how can you say that 2006 and 2008 weren’t extremely anti-incumbent? After all, those two years saw the House, the Senate, and the Presidency switch from the Democrats to the Republicans. Before delving further, I’m not saying that the most recent elections weren’t extremely significant and that there wasn’t a massive change in control of government, but I am saying that this did not happen because incumbents had been thrown out left and right (especially in the House of Representatives). I’m going to work on a series which involves looking at the last two elections (both of which were Democratic wave elections) to try and give some perspective to the “anti-incumbent” myth which pervades the House of Representatives.

(I’m going to insert the charts a bit later in this post, for now, just follow the cross-posted link, that will give you the pictures)

So, how well did incumbents (and incumbent parties) fare in 2006? According to the electoral compilation site The Green Papers, in the 2006 House elections, there were 390 incumbents running in the general election. Of those 390 incumbents, 22 lost their bid for re-election, of 435 seats, 31 seats were not held by the incumbent party (1 belonging to now-Senator Bernie Sanders (I-VT)).  Roughly 94% of incumbents who were renominated by their parties ultimately went on to win the election. When including all seats, 368 incumbents won re-election to the House of Representatives out of 435, which means that the 110th congress started out being made up of 85% of members who had served in the previous congress. Looking at the seats in which the incumbent party retained control of the seat they had before the election, that number is 404 out of 435 seats, or roughly 93% of all seats (meaning only 7% of seats switched control in 2006).

If we look at it from the perspective of the two parties, there were 202 Democratic incumbents, 232 Republican incumbents, and 1 independent incumbent. Of the 202 Democratic incumbents, 186 got their party’s nomination, and all of them won re-election (or 100% of all Democratic incumbents who were re-nominated won re-election). Of the 233 seats the Democratic party won after the elections, roughly 80% of those would be held by an incumbent member. Looking at the Republicans, out of 232 incumbents, 204 of them were successfully re-nominated and of those who were re-nominated, 182 won won re-election (or roughly 89% of those running for re-election). Of the 202 seats the Republican party won after the elections, roughly 90% of them were held by were held by incumbents.

Some of you might be asking why I’m not talking about incumbents who lost their primaries? After all that might skew these numbers. The reason is pretty simple, only 2 incumbents who sought re-nomination lost their bids (Republican Joe Schwarz (MI-07) and Democrat Cynthia McKinney (GA-04). That means that over 99% of incumbents who sought re-nomination by their party were successful (all the primaries haven’t ended yet yet, but 2010 appears to be heading in that direction again).

One might argue that 2006 wasn’t really an “anti-incumbent” year so much as it was an “anti-Republican” year (not even necessarily an anti-Republican incumbent year) but even granting that, it’s still pretty telling that what many considered to be a giant wave election, when only 7% of all seats (13% of all Republican seats) changed party hands. This should give a little more insight into American elections.

Next time: the 2008 House races.

The Meaning of PA-12

By: Inoljt, http://mypolitikal.com/

On Tuesday night Pennsylvania’s 12th congressional district held a special election, pitting Democratic candidate Mark Critz against Republican Tim Burns.

The Meaning of PA-12

Mr. Critz won solidly: a nine percent margin of victory off 53.4% of the vote. Several polls had predicted a very close, photo-finish election; this result contradicted that assumption.

This victory constitutes good – very good – news for Democrats.

More below.

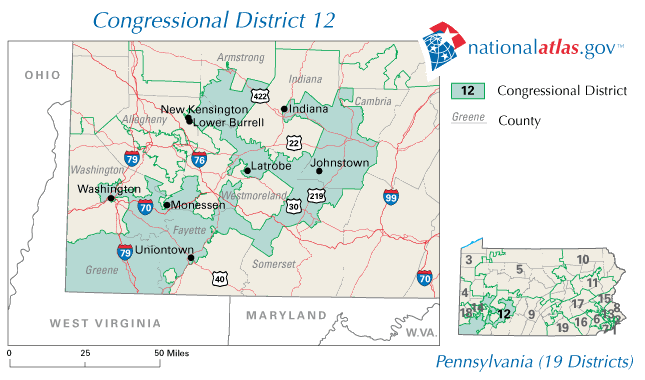
His district, PA-12, was one of the few countrywide that voted more Republican from 2004 to 2008, as the rest of the nation shifted substantially left. Districts such as these are prime targets for Republicans in 2010.

Indeed, PA-12 constituted the only seat in the entire nation that supported Senator John Kerry and then switched its vote to Senator John McCain. For reasons such as this, I wrote a week ago that:

It will be a minor miracle if Democratic candidate Mark Critz wins.  [Almost] no Democratic candidate has ever done better than Mr. Obama since his  election. Mr. Critz will have to do that, given that the president lost  PA-12 (the only seat in the nation to support Kerry and the McCain). In a  district with double-digit disapproval ratings of Mr. Obama, this  constitutes an arduous task.

As it turned out, Mr. Critz did far better than Mr. Obama. Indeed, his victory constitutes the first time a Democratic candidate has improved on the president’s performance since December of 2008, when Democrat Paul Carmouche barely lost LA-4 to Congressman John Fleming.

The Meaning of PA-12

Mr. Critz won by appealing to local issues, emphasizing his independence from the president, and sounding like a fiscally liberal, socially conservative Democrat – the type of Democrat places like PA-12 have traditionally voted for.

This is a strategy that Democrats have long used, to great success, in winning congressional districts that they should not be winning. It is how both Mississippi and Arkansas elect three Democratic versus one Republican congressional representative, and how Texas elected more Democratic than Republican congressman right until 2004. It is partly how the party won such great congressional victories in 2006 and 2008.

There has been much fear amongst Democrats that, in light of Mr. Obama’s presidency, this strategy will no longer work. State Senator Creigh Deeds tried running a rural-style candidacy for Virginia’s governorship; he failed quite miserably.

Mark Critz, on the other hand, succeeded where many – including this individual – thought for sure he would fail. His performance certainly does not mean that Democrats are in for an easy time come November, but it does give the party something to work with in the tough days ahead.

Analyzing Obama’s Weak Spots – Part 1

This is the first part of three posts analyzing the congressional districts President Barack Obama underperformed in.

Congressional Districts

By most accounts, Senator Barack Obama dominated the 2008 presidential  election. He won an electoral landslide, winning Republican-leaning states such as Indiana and North Carolina which his campaign targeted. Compared to 2004, the nation shifted almost ten points more Democratic.

Mr. Obama improved from Senator John Kerry’s performance almost everywhere. More than 90% of congressional districts voted more Democratic than in 2004. Yet this means that at least several dozen congressional districts were more friendly to Mr. Kerry than the Illinois Senator. I have mapped these districts below:

Analyzing Obama's Weak Spots

More below.

(Click here for a much better view of the map).

There is a clear pattern here: Republican-shifting congressional districts are found along a diagonal line stretching from Louisiana and Oklahoma to southeastern Pennsylvania, roughly along the Appalachian mountains. This is not exactly startling news; ever since the primaries, Mr. Obama’s weakness in these regions has been well-noted. The five states that shifted Republican from 2004 – Arkansas, Louisiana, Oklahoma, Tennessee, and West Virginia – are all located here.

The exceptions to this pattern, however, constitute items of considerable interest. Some of these have fairly simple explanations. Arizona’s 1st district voted more Republican, for instance, mainly because Arizona was Senator John McCain’s home state.

Other districts, however, go against commonly-held political wisdom. Take LA-2: a black-majority, inner-city district located in New Orleans (represented, ironically, by Republican congressman Joseph Cao). While LA-2 strongly supported Mr. Obama, black depopulation in the aftermath of Katrina made this support less than that in 2004.

Another example can be found in the northeast:

Analyzing Obama's Weak Spots - Part 1

Republicans do better in five Massachusetts districts and one New York district.

This movement stands in contrast to the narrative of Democratic dominance in the northeast. Most in the beltway have ignored this trend, or dismissed it as simply the loss of Mr. Kerry’s home-state advantage. Whether this is true or not, there is quite a lot of interesting stuff to be said on these districts. The next post will be devoted solely to exploring this pattern.

–Inoljt, http://mypolitikal.com/

Analyzing Britain’s 2010 General Election

By: Inoljt, http://mypolitikal.com/

Several days ago Great Britain held a general election to decide the country’s government over the next few years. Facing discontent and a nation thirsty for change, Prime Minister Gordon Brown and the governing Labor Party were soundly defeated. The challenging Conservative Party, led by David Cameroon, gained 97 seats but failed to take a majority in Parliament. Meanwhile the Liberal Democrats, who had surged after a strong performance in the first debate by their leader Nick Clegg, badly underperformed their expectations.

This election offers a useful study of a political system outside of the United States. While more similar to the United States than most countries, Great Britain’s electorate also offers a number of intriguing differences.

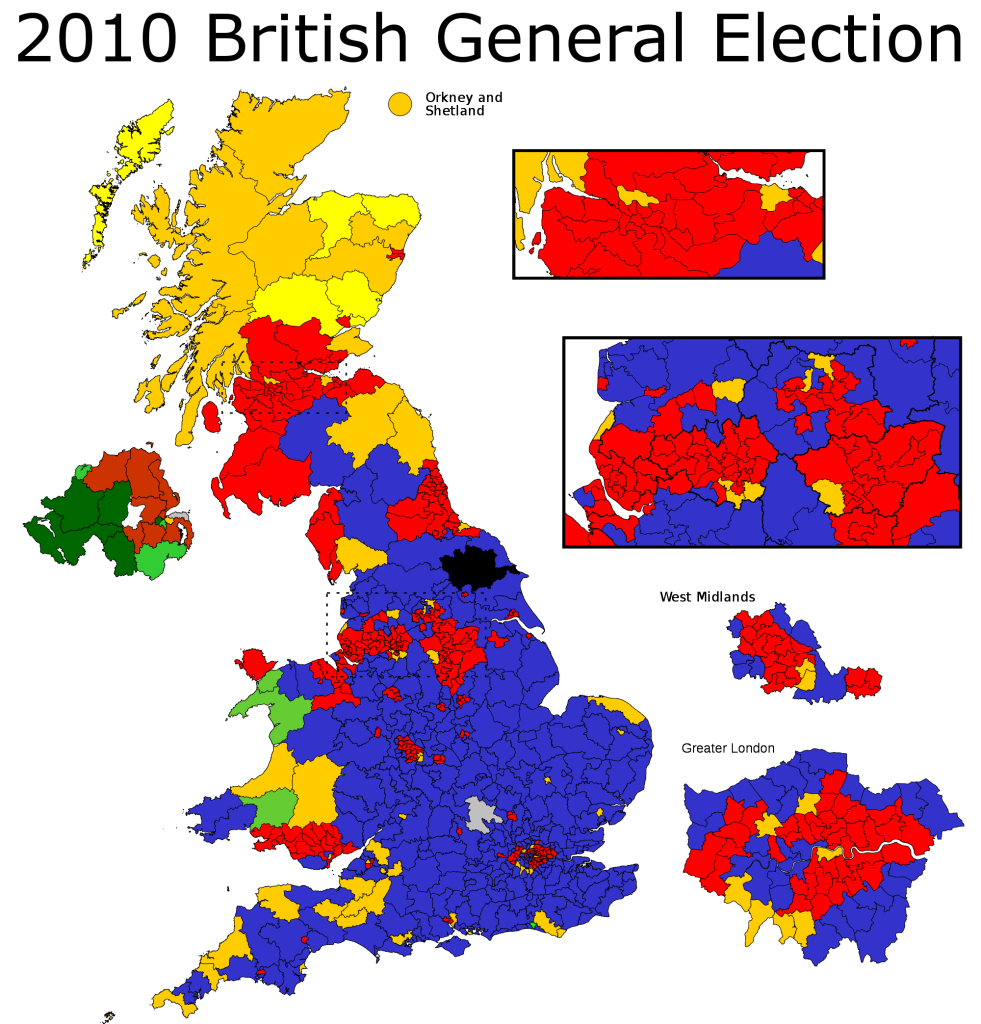
A map of the results illustrates several aspects of this system:

Analyzing Britain's 2010 General Election

Note: In Britain and most of the world, the party of the left – Labour – is traditionally represented by the color red (symbolizing the revolution and the so-called blood of the workers). The Conservatives are represented by blue; the Liberal Democrats by yellow.

More below.

At first, it seems that the Tories swept the board. One can’t help but notice the sheer landmass covered by conservative-won seats.

Indeed, the Conservative Party did do quite well; with 36.1% of the vote, they won 306 out of 650 seats. Labour dropped to 29.0% and 258 seats; the Liberal Democrats took 57 seats on 23.0% of the vote.

Yet the map overstates Tory strength. Like the Republican Party of the United States, the Conservative Party does best in rural areas. Winning these seats looks good on a map but doesn’t guarantee winning an election.

The Labour Party, on the other hand, has traditionally dominated Great Britain’s densely populated cities – much like the Democrats in the United States. Much of its base lies among cities such as Sunderland, Birmingham, Manchester, Liverpool, and – of course – London. These places look small on maps but elect quite a lot of MPs.

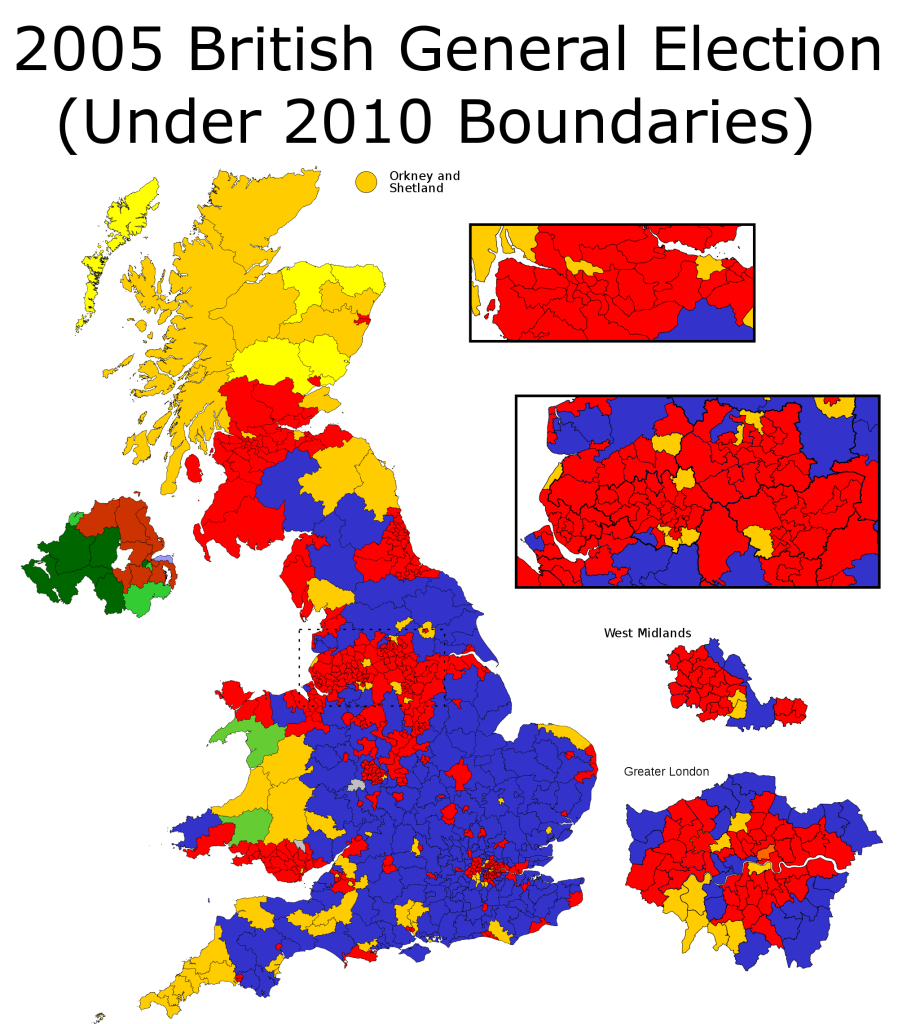
To illustrate this point, here is a map of the 2005 general election under redrawn boundaries for 2010:

Analyzing Britain's 2010 General Election,Analyzing Britain's 2010 General Election

Labour did quite a bit better in 2005, as this map indicates. Yet one might be inclined to guess, by the geographic spread of Conservative seats, that they lost the election. In reality, Prime Minister Tony Blair had led his party to win 35.3% of the vote and 356 seats – a governing majority.

Interestingly, Labour majorities in cities tend to be somewhat thinner than Tory majorities in the countryside. This constitutes the opposite of the situation in the United States – where Democrats often win cities by 75-25 margins and Republicans win rural regions by 60-40  margins.

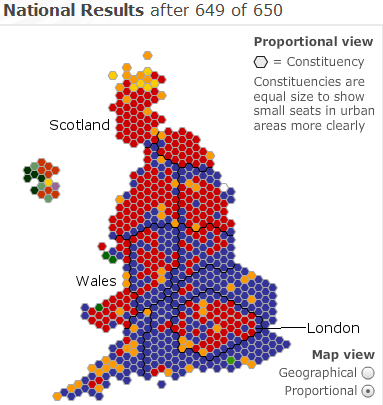
A proportional map, therefore, offers a more accurate visualization:

Analyzing Britain's 2010 General Election,Analyzing Britain's 2010 General Election

One sees another interesting pattern emerge here; the electorate exhibits a coherent North-South divide. In the poorer North Labour does quite well, winning a good majority of seats. In the wealthier South the Conservatives are dominant. With the exception of London, Labour wins almost no seats in southern Great Britain.

There is also a substantial difference between England, Scotland, and Wales. While England votes strongly Conservative, the latter two remain Labour strongholds. In Scotland the Tories actually come in fourth, winning only one seat – a legacy of Prime Minister Margaret Thatcher, who to this day remains extraordinarily unpopular in Scotland. Labour Prime Minister Gordon Brown’s Scottish heritage also probably also helped Labour and hurt the Tories. While the Conservatives do better in Wales, winning eight seats, they still run ten points behind Labour.

It is in South England where the Conservatives do best. Labour runs in third place in the Southwest, Southeast, and East regions. In the Southeast region, for instance, Labour wins a mere 16.2% of the vote; the Tories win 49.9% of it.

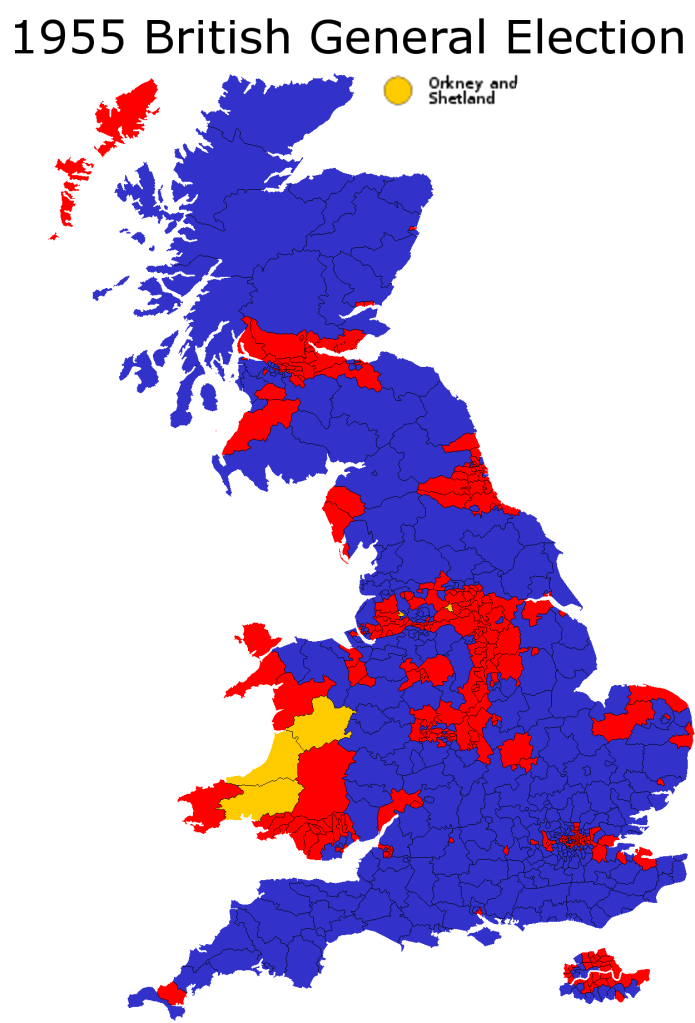
These patterns go back for a long time. Take the 1955 general election:

Analyzing Britain's 2010 General Election

There are some differences, for sure. In 1955 Conservatives had a base in rural Scotland; that has vanished today. The strength of third parties is noticeably less.

Yet what strikes the eye is the degree of similarity between 1955 and 2010. By and large, the bases of the Labour and Conservative Parties remain the same as they were half a century ago. Britain’s regions exhibit a remarkable degree of stability in which party they support – something which can not be said for the United States.

Finally, perhaps the most interesting difference between the United States and the United Kingdom is the strength of third parties in the latter. Both countries follow a first-past-the-post system, which makes the presence of a non-regional third party almost impossible. Yet in Great Britain the Liberal Democrats have somehow managed to gain legitimacy and a respectable amount of seats, through careful targeting. In the aftermath of this election, with a hung parliament, there has even been substantial discussion about changing the electoral system. Meanwhile the two-party system remains iron strong in America. Despite all their similarities, cultural and systemic, the electorates of the United States and the United Kingdom are following sharply divergent paths.

Comparing Barack Obama, John Kerry, and Mike Dukakis

By: Inoljt, http://mypolitikal.com/

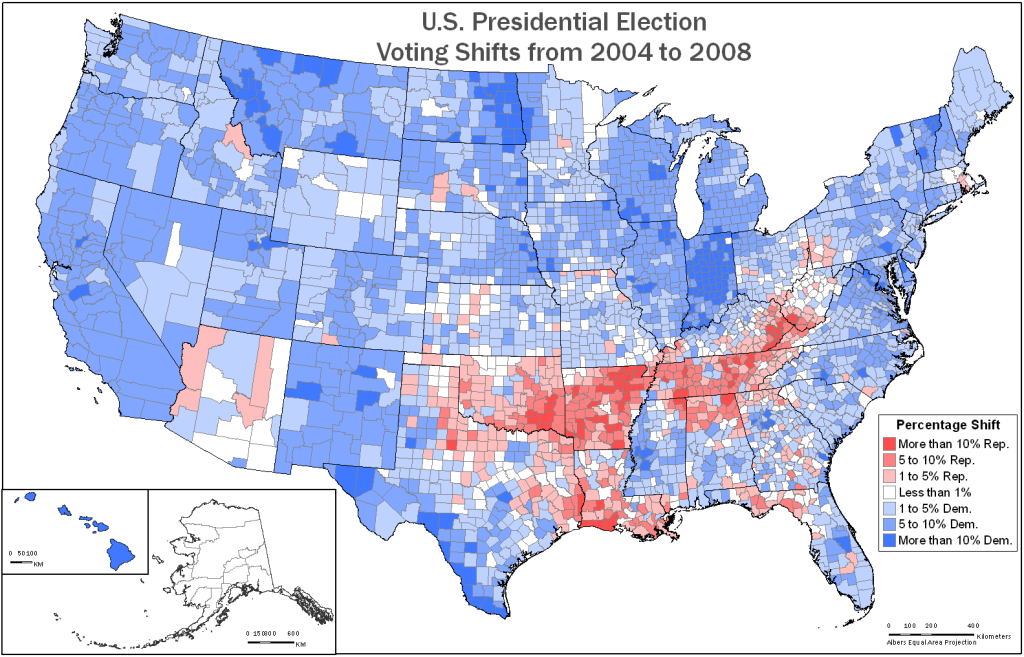
In the aftermath of the 2008 presidential election, the New York Times famously posted a map depicting county-by-county changes from the 2004 election. A different version of this map is below:

Comparing Barack Obama,John Kerry,and Mike Dukakis

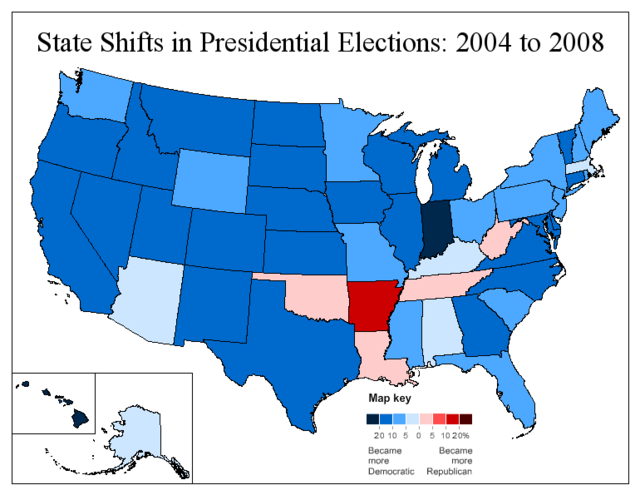
What is remarkable about this map is the evenness of the Democratic movement – a 9.72% shift to them from 2004. With the exception of a diagonal patch of Appalachia, President Barack Obama improved throughout the country. It did not matter if a county was located in Utah or California, whether it belonged to a dense city or a thinly populated farm, or whether it was poor or rich – almost every county still voted more Democratic than it did in 2004.

If one moves to a statewide basis, the shift is still fairly uniform.

Comparing Barack Obama,John Kerry,and Mike Dukakis

Compared to the county-by-county map, this map lends itself more easily to analysis.

More maps below.

Once again, Mr. Obama does well everywhere except for Appalachia. His improvement, however, is noticeably less in the traditionally Democratic Northeast. The South is strangely divided between the friendly Atlantic coast and the hostile inland states (with the exception of Texas). There is also a fairly apparent split between east and west: in the latter, Obama’s improvements are almost uniformly strong. The movement east is far more variable.

In addition, the color of several states can be explained through local factors. Clinton-loving Arkansas appears dark red, while Senator John McCain’s home state Arizona stands out amidst its dark blue neighbors. Obama’s home states Hawaii and Illinois also appear dark blue, but Governor Sarah Palin’s Alaska stays more Republican. Massachusetts, home state of Senator John Kerry, does not shift Democratic by much; Indiana, where Obama’s campaign led a massive turn-out effort, shifts massively.

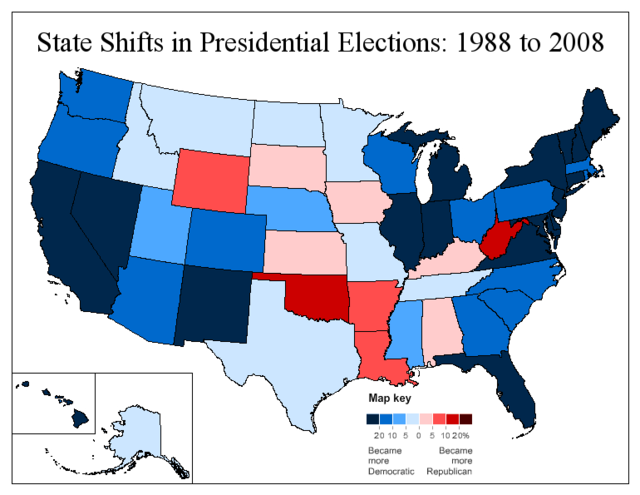
In playing around with these maps I also took a look at the 1988 presidential election. In that election, Democratic candidate Mike Dukakis lost by 7.73% to Vice President George W. Bush. Because Mr. Obama won by 7.26%, the nation voted 14.99% more Democratic than in 1988. Here is Obama’s performance compared to that of Mr. Dukakis:

Comparing Barack Obama,John Kerry,and Mike Dukakis

What this map reveals is far less uniformity. Compared to the previous ones, this is much more a depiction of structural political changes.

Perhaps most obviously, much of South Central America swings against Obama, illustrating the decades-long Republican shift of this region. Dukakis still was able to win a number of white Democratic counties in places like Louisiana and Oklahoma. Today those places have largely abandoned the party.

There are other patterns. A number of Plains states, such as Kansas and the Dakotas, have very little or no movement to Obama. He actually does worse in Iowa. This reflects a relatively strong Dukakis performance in rural America, which was in the midst of an agricultural crisis in 1988.

Most interestingly, one can see the 2008 electoral map in the map; the dark blue states almost all voted Democratic in 2008. Democratic-voting states today tended to shift most to Obama; Republican-voting states today tended to move less. Only two states that voted for Obama haven’t shifted strongly Democratic since 1988: Iowa and Minnesota. Out of all the states John McCain won, on the other hand, only Arizona, Georgia, and South Carolina shifted strongly Democratic – and Democrats came quite close in Georgia. A similar trend has been observed in previous posts.

I am not certain if this pattern suggests electoral polarization: Democrats improve greatly in a number of 1988 Republican-leaning states (such as New Jersey or North Carolina), and Republicans do the opposite in places like West Virginia or Iowa. Instead, it appears to make sense for a candidate to win a state he or she does best in. Thus, this pattern seems to illustrate the electoral coalition Democrats have carved since 1988.

The farther one looks back, it seems, the more a map reveals.

UK Elections Open Thread

For the ultra-hardcore political junkies whose electoral cravings can never be satisfied, we’re offering up this open thread on today’s elections in the United Kingdom. Polls close at 10pm local time, which is 5pm Eastern (ie, right about now). While most constituencies start counting votes right away, some won’t begin until tomorrow morning, meaning who controls Parliament might not be known tonight if the election is close.

Some sites where you can follow the results (if you have others, please suggest them in comments):

Politics.co.uk | BBC | The Economist | Economist Liveblog

And for your viewing pleasure:

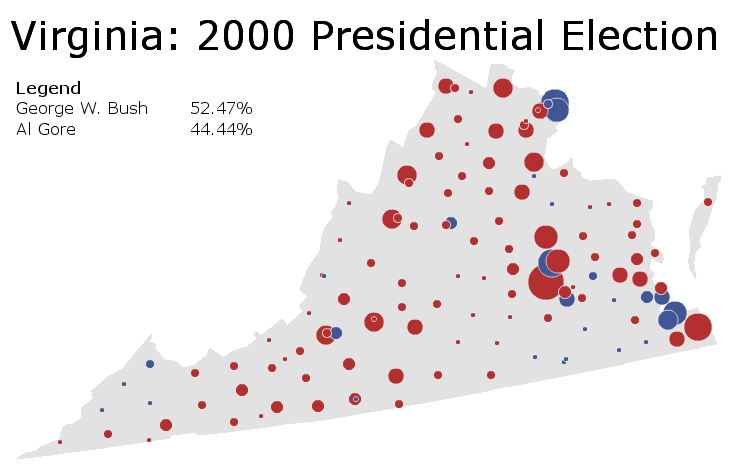
Maps of Virginia Elections

By: Inoljt, http://mypolitikal.com/

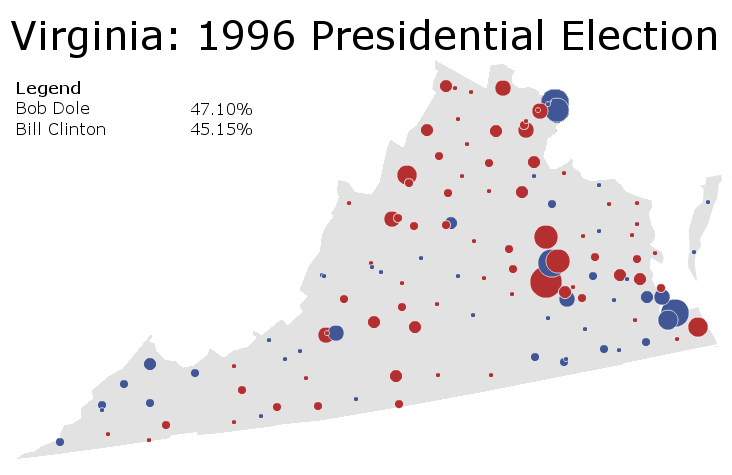
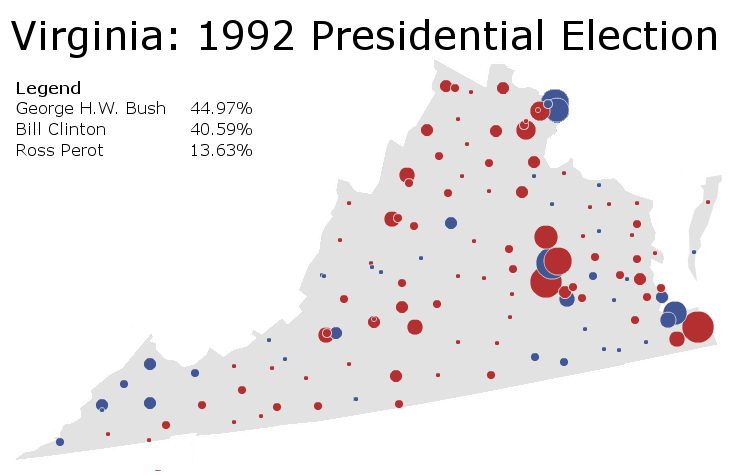
To follow up the series on Virginia, I’ve posted a few recent presidential elections in the state (courtesy of the New York Times). Each map comes with some brief analysis.

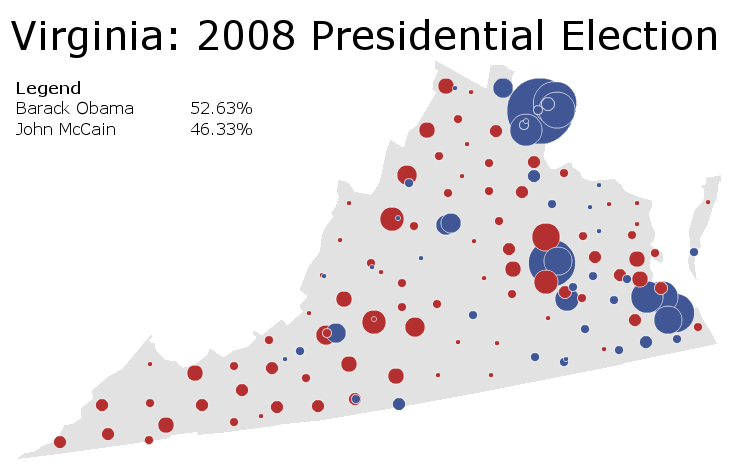
Maps of Virginia Elections

Capitalizing on a decade of Democratic movement, Senator Barack Obama becomes the first Democratic presidential candidate to win Virginia since 1964. The Senator performs best in eastern Virginia, especially the fast-growing northern Virginia metropolis. Western Virginia is not as enamored; parts of it even vote more Republican.

More below.

______________________________________________________

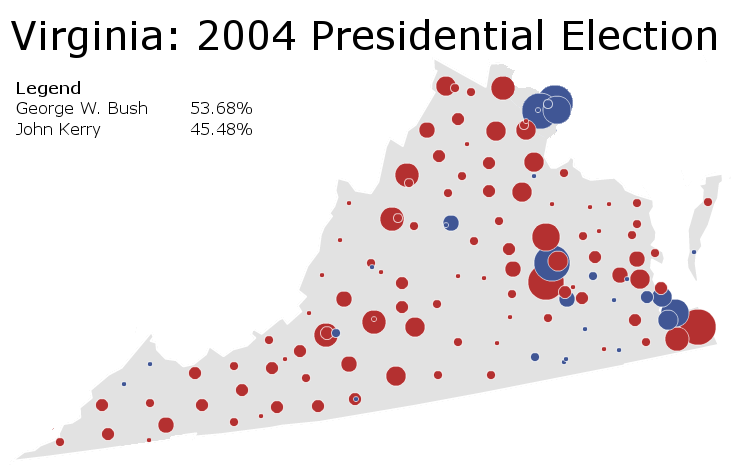
Maps of Virginia Elections

Nobody pays attention to Virginia in 2004, and for good reason: incumbent George W. Bush cruises along to a comfortable victory. Amid all the hoopla in Ohio, Republicans fail to notice a disquieting trend. Fairfax County, the populous heart of Northern Virginia, goes blue in the first time for decades.

______________________________________________________

Maps of Virginia Elections

Governor George W. Bush sails to an 8% victory. He artfully weaves together a classic Republican coalition: wealthy suburbs combined with Republican-trending rural Virginia.

______________________________________________________

Maps of Virginia Elections

Expecting to win the state, incumbent Bill Clinton is surprised to see Virginia slip from his grasp. He does better than in 1992 – performing well amongst Democratic constituencies in the Appalachian west, the black southeast, and the rich inner-core suburbs of Northern Virginia. But it’s not enough: a strong Republican vote in Richmond’s suburbs denies Mr. Clinton his victory.

______________________________________________________

Maps of Virginia Elections

Another presidential election, another Republican victory in Virginia powered by suburbs and small towns. Yet Governor Bill Clinton does relatively well. Compared to the 20.5% beating George H.W. Bush gave to Democratic nominee Mike Dukakis in 1988, a 4.4% loss ain’t nothing.

Assessing the National Mood: A Special Election in Florida and its Implications

By: Inoljt, http://mypolitikal.com/

Believe it or not, Tuesday was election night. Several million Americans voted (or more accurately, did not vote) in mostly local races.

These results provide a helpful snapshot of the national mood. Polls may be inaccurate, or – more commonly – different pollsters may have different pictures of the public mood. Unlike polls, elections have that useful tendency of never being wrong.

Special elections for congressional districts are especially convenient, because there is already a wealth of accumulated data about them. Moreover, because name recognition of both candidates is generally very low, they come as close as one can get to “generic Democrat versus generic Republican.”

Quite happily, a special election occurred on Tuesday in one such congressional district. Specifically, voters in Florida’s 19th congressional district went about replacing retired House Representative Robert Wexler. Here are the results:

Photobucket

More below.

Of course Democrats do not and have – almost – never have enjoyed a majority anything close to that pictured here. These results must be placed in the context of the congressional district’s political lean. If, for instance, FL-19 constituted a Democratic stronghold, this result would be fairly unremarkable. It might even be quite worrisome for Democrats, depending on the district’s Democratic lean (there are some very, very, very Democratic congressional districts out there). On the other hand, if FL-19 usually voted Republican, Democrats would have some reason to celebrate a victory of this magnitude.

As it turns out, FL-19 constitutes a reliable Democratic stronghold. Located in the Miami metropolis, elderly and Jewish voters compose much of the district’s population. The latter accounts for Democratic strength, making Florida’s 19th 15% more Democratic than the nation as a whole.

With this in mind, last night’s election results do not look so impressive for Democrats. In fact, it appears that the party underperformed relative to the district’s lean.

But this is not news at all – in recent months the public mood has shifted quite strongly against the Democratic Party. Almost the entire Beltway agrees that Democrats will lose seats in November’s midterm elections; the only question is the degree of their loss. Republicans are hoping for a repeat 1994-type landslide; Democrats would be happy to retain control of the House.

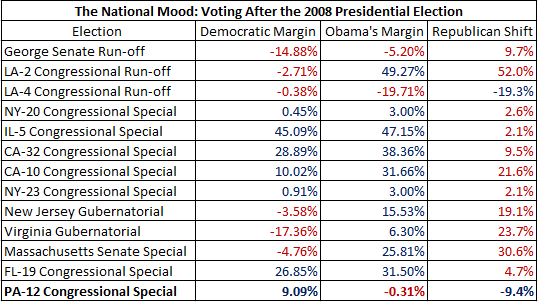
Due to the unfavorable public mood, Democrats have had a terrible batting average in the most recent special elections; they most famously lost the state of Massachusetts to an unknown Republican State Senator:

Photobucket

In this context, Florida’s result looks positively respectable. The Democratic Party can take heart in the relatively small drop-off since 2008 – especially compared to their previous performances. Given that President Barack Obama won the election by more than 4.65%, it even suggests that Democrats hold a slight lead on the national level.

Indeed, in recent weeks Democratic fortunes have been on the rise. The passage of health care, alongside a slowly but surely improving economy, has led to an ever-so-slight uptick in their polling. Florida’s result substantiates these polls.

Finally, the very nature of FL-19 can lead Democrats to be optimistic. Mr. Obama’s strongest supporters, young and minority voters, are not present in large numbers in FL-19. Instead, this district – whiter and much more elderly than the nation at large – is composed of the very groups which have been moving away from the Democratic Party. Although it still votes strongly Democratic, Fl-19 is not as blue as it once was:

Photobucket

That Democrats performed as well as they did in a district such as this provides further reason for Democratic optimism. Elderly and white voters have not all abandoned the party; it still can do well with constituencies outside the Obama coalition.

The national mood is still fairly unfavorable towards the Democratic Party; certainly the public is more antagonistic than it was when electing Mr. Obama. If an election were held today, there is a good chance Republicans would end up controlling at least one chamber of Congress. But perhaps, if these results are to be believed, the Democrats are climbing out of the hole the recession has dug for them.