Analyzing Swing States: Virginia, Part 1

This is the first part of a series of posts analyzing the swing state Virginia. The second part can be found here.

Analyzing Swing States: Virginia,Part 1

During the ’08 campaign, the political beltway famously defined Virginia as a Republican stronghold gone Democratic. For ten straight presidential elections, the state had reliably turned up in the Republican column. President Barack Obama, however, promised to change that – and he did.

More below.

Virginia indeed is becoming bluer – but not as much as one might think. The state moved Republican sooner than the rest of the South, but never became as deep red as places like Alabama. The actual trend from ’04 to ’08 is less prominent than one might think:

Analyzing Swing States: Virginia,Part 1

I think this in fact slightly understates Republican strength. Mr. Obama, after all, fit extremely well with Virginia’s Democratic base – blacks and rich NoVa residents. He might have overperformed. In many ways, Virginia still constitutes a purple state, perhaps even a red-leaning one. Democrats must run competent candidates and/or do this in favorable national environments; if both conditions are missing, they may get pummeled ala Creigh Deeds.

This may change in the future. As its wealthy, diverse, and Democratic-leaning NoVa suburbs continue growing; Virginia may soon become more Democratic than even Pennsylvania. This trend was much noted in 2008.

What is less noted is the degree to which the media has overstated this change. These demographic shifts are the work of decades, not one election; they occur very gradually. Moreover, even as bluing NoVa expands, Virginia’s western regions continue to redden – especially the once Democratic-leaning panhandle. This blunts the NoVa effect. Virginia may be turning Democratic, but Democrats should not underestimate continued Republican strength.

–Inoljt, http://mypolitikal.com/

VA-09: Boucher says he’s running again

The National Republican Congressional Committee has been trying to get 14-term incumbent Rick Boucher (D, VA-09) to retire, but he disappointed them today:

“I am planning to seek reelection. I have given no consideration to retiring,” Boucher said in a statement Wednesday. “While I never make political announcements this early in the year, due to the press inquires we are receiving, it is time to remove any doubt anyone has about my intentions.”

Holding this R+11 district would be a challenge if the seat opened up, but most election forecasters don’t expect Boucher to have any trouble.

If Republicans do recruit a prominent challenger to run in this district, Boucher’s vote for the Waxman-Markey American Clean Energy and Security Act last June will probably become a major issue in the campaign. Coal interests are big employers in Boucher’s district. He backed the climate change bill after securing amendments to make sure that coal usage would continue to grow between now and 2020 even if the bill became law.

Analyzing Virginia’s 2009 Gubernatorial Election, Part 2

This is the second part of two posts analyzing Virginia’s 2009 gubernatorial election. The previous part can be found here.

When Democrats nominated State Senator Creigh Deeds, they nominated a rural, moderate Democrat designed to win the small towns and rural regions of western Virginia. In an ideal situation, Mr. Deeds would have carved out a coalition similar to former Governor Mark Warner’s.

Photobucket

In 2001, Mr. Warner won a 5.13% victory over Attorney General Mark Earley, based largely upon rural support in western Virginia.

Mr. Warner is famous among Democrats for this achievement (remember, this was just two months after 9/11). He went on to become a successful and very popular governor; in 2008, Mr. Warner ran for Senate and won double his opponent’s vote. Since Mr. Warner, no other Democratic candidate has ever built a coalition similar to his.

More below.

Below is Virginia’s political lean during the 2001 gubernatorial election:

Photobucket

These maps indicate the results of a hypothetically tied election, which is useful to determine the political lean of each county (i.e. whether a certain place voted more Democratic or Republican than the state as a whole). For example, last year Indiana voted for President Barack Obama – but relative to the country as a whole, it leaned Republican.

For comparison, here is the correlating map for Creigh Deeds (if Mr. Deeds had tied Mr. McDonnell), which I mapped in my last post:

Photobucket

As the maps indicate, Creigh Deeds failed miserably at recreating the rural Warner coalition. Despite being a rural candidate, Mr. Deeds did far worse in rural western Virginia.

Instead, Mr. Deeds appears to have done best in urban Virginia: Northern Virginia, Richmond, and the Norfolk-Virginia Beach metropolitan area. Rather than repeating Mark Warner’s coalition, the performance of Creigh Deeds appears far closer to that of President Barack Obama’s:

Photobucket

Mr. Obama won through a urban-suburban alliance, compared to the urban-rural alliance of Mr. Warner.

Here is Mr. Obama’s performance without the lean:

Photobucket

To be fair, I would prefer the Obama coalition to the Warner coalition: suburban strength is more lasting than votes built upon dying small towns.

Nevertheless, it is discomfiting to note the extent to which a candidate like Creigh Deeds – a rural, moderate Democrat who distanced himself from Mr. Obama – replicated the president’s performance. For better or for worse, it seems, Democratic candidates will from now on be attached hip-to-hip with Mr. Obama.

(Note: All statistics are derived from http://www.uselectionatlas.org/ ).

–Inoljt, http://mypolitikal.com/

Analyzing Virginia’s 2009 Gubernatorial Election, Part 1

This is the first part of two posts analyzing Virginia’s 2009 gubernatorial election. The second part can be found here.

Photobucket

A normal observer might see the above map and naturally conclude that the Democratic candidate lost a landslide election. This is not always the case. In the 1968 presidential election, for instance, the state of New York looked like this:

Photobucket

Although it does not look like it, Democratic candidate Hubert Humphrey won the state: 49.76% to 44.30%.

In November 2009, however, State Senator Creigh Deeds did in fact receive a thorough pummeling from Attorney General Bob McDonnell. An unappealing candidate running in a tough national climate, Mr. Deeds lost the race 41.25% to 58.61%.

More below.

Creigh Deeds only won two types of counties: his home district and Democratic strongholds. The former include the two blue counties along the state’s eastern border. The latter are populated by two Democratic constituencies: firstly, blacks in Virginia’s 3rd congressional district and secondly, wealthy suburbanites south of Washington (Virginia’s 8th congressional district).

Surprisingly (and disturbingly) Mr. Deeds lost Fairfax County, the key to recent Democratic success in Virginia. Rich, diverse, and heavily populated – Northern Virginia suburban voters were largely responsible for Democratic victories by Governor Tim Kaine, Senator Jim Webb and President Barack Obama.

Mr. McDonnell’s victory in Fairfax indicates one of two things. Either the Democratic Party has not entrenched itself in NoVa – or it is moving back to the Republicans. The latter possibility is highly worrisome and not simply confined to Virginia.

There is little more that the above map indicates – one cannot tell much from a map that just shows red counties. Differentiating the mass of red reveals more:

Photobucket

This image maps the results based on degree of support. It shows a substantial east-west divide hidden in the first map. Western Virginia voted Republican with far more intensity; eastern Virginia tended to be more moderate in its support of Mr. McDonnell.

Notice how intensely Republican the western panhandle is voting. These voters – poor, white, rural Appalachian folk – used to vote Democratic based on economic appeals. This trend subsisted even in fairly recent times: John Kerry won a couple counties; Senator Jim Webb took three. Former president Bill Clinton did even better (he lost the state by 1.96%):

Photobucket

Creigh Deeds, a moderate politician representing an Appalachian district, was supposed to appeal to the rural voters populating western Virginia; as the map makes evident, he failed to do so (outside his home districts). I suspect Barack Obama  may have something to do with this; his poor performance amongst Appalachian voters may be affecting Democratic candidates everywhere. Given the many Democratic politicians elected from Appalachia, this – if true – would definitely be a bad thing for Democrats.

Finally, it is possible to map the results if Mr. Deeds had tied Mr. McDonnell:

Photobucket

This indicates the relative Democratic or Republican lean of each county – a county may vote Republican but still lean Democratic compared to the overall result, and vice versa. Massachusetts, for example, voted Republican in Ronald Reagan’s 1984 landslide – but nobody would accuse it of being a Republican state. It went red, but relative to the rest of the nation was more Democratic.

The next section will compare this map with similar images derived from previous Democratic coalitions.

(Note: All statistics are derived from http://www.uselectionatlas.org/).

–Inoljt, http://mypolitikal.com/

Two Trends on Election Night

By: Inoljt, http://thepolitikalblog.wordpr…

Last night’s election exhibited two trends: one positive for the country as a whole, and one more ominous for Democrats. Firstly, Americans rejected negative campaigning and extremism – whether it be in Virginia, New Jersey, NY-23, or Maine. Secondly, the electorate as a whole shifted quite profoundly to the right.


Negative Campaigning and Extremism

In the most-watched races, voters chose the side that espoused moderation and ran a positive message. The Democratic candidates in both Virginia and New Jersey focused on the negative: state congressman Creigh Deeds of Virginia spent most of his time attacking Attorney General Bob McDonnell’s college thesis, while Governor Jon Corzine of New Jersey launched a barrage of negative ads. Both candidates lost.

The other races featured the victory of moderate politics over extremism. In NY-23,  a Republican-represented district since the Civil War, conservatives sabotaged the moderate Republican candidate in favor of hard-line Doug Hoffman. Fortunately, voters in upstate New York rejected the Glenn Beck nominee and instead chose Democrat Bill Owens, an independent turned Democrat.

Thus the election results enforced a positive trend in politics – one of moderation and positive campaigning focused on the issues, rather than divisive personal attacks. For Democrats like myself, however, the other trend – a rightward shift – is more worrisome.

A Rightward Shift

For Democrats, the election’s most worrying result was not in Virginia, New Jersey, or Maine. It was the special election in CA-10.

At first glance, this might seem a bit puzzling. Democrats won that election, after all – and they won it by a comfortable 10% margin.

Yet, when compared to previous elections, this result is quite an underperformance. Barack Obama, for instance, won this congressional district by three times that margin. Since 2002, moreover, former Democratic congressman Ellen Tauscher had never polled below 65% of the vote.

Moreover, the election revealed more about the national mood than, say, Virginia or New Jersey. Those races were heavily dependent on local factors (e.g. the quality of the Deeds campaign, the unpopularity of Governor Jon Corzine). In CA-10, you had two low-recognition candidates and little publicity; it was closer to a generic ballot poll.

If  CA-10 could be characterized as a generic ballot poll, then Democrats should be extremely worried. In 2009, CA-10 went from a 30% Democratic victory to a 10% one: a 10-point shift to the right. Similar shifts were seen in New Jersey and Virginia; the electorate as a whole moved substantially to the right. The Democrats were very fortunate that Tuesday did not constitute a full-blown congressional election; they would have been crushed.

There is good news, however. Democratic weakness two days ago resulted more from an energized Republican base than a fundamental shift in the national mood. Republicans, motivated and unhappy, turned out; President Barack Obama’s coalition did not. The president still attains approval ratings in the low 50s – hardly the sign of an unpopular incumbent.

The bad news is that I am not sure if Mr. Obama’s coalition will turn out for the 2010 congressional elections. His voters have been curiously lethargic ever since his election; their low turn-out was how Senator Saxy Chambliss in Georgia went from a 3% general victory to a 14% run-off victory. Republicans, then, may do well next year.

In fact, I am not even sure Mr. Obama’s coalition will re-emerge in 2012, when he goes up for re-election. The president, after all, ran on a campaign of hope, change, and idealism. The difficult compromises forced by governing have tainted this brand, and it will inevitably continue to be diluted over the next three years. Obama’s 2008 coalition may go down as unique in American history, much like former President Jimmy Carter’s coalition.

I hope it will not. There is that word again.

Redistricting Virginia 7-4 Democrats

I know this is not very realistic but I decided to go for a 7-4 Democratic plan. Democrats should control at least the State House but it would unlikely if they had total control of everything. Most Republicans would probably like most of the plan except that I weaken Frank Wolf from the 10th district. He claims to be a moderate but he is actually a Conservative. My other main priority was to strengthen all the Democratic incumbents. On a different note, this is the first time in awhile I have asked you which state I should do next. Here are the maps:

Virginia State Map

Western (not west) Virginia

Northern Virginia

Hampton Roads

Here is a link to the current Congressional map of Virginia: http://www.nationalatlas.gov/a…

1st District (Blue) Robert Whitman (R)

Even if Republicans do not like the plan, they should be happy about this district. I removed all of Prince William County which is trending Democratic quickly. I also removed the slivers of Hampton and Newport News because Obama easily won those two areas. I also removed Caroline, Essex and King and Queen Counties because Obama barely won those counties and I wanted to put them in the 5th district. The new counties in the district were Hanover (which McCain won by 19,000 votes,) Orange and New Kent. The latter two are Republican. Even though the district looks rural, it is mostly concentrated on fast growing Republican suburbs. Stafford and Spotsylvania counties might be marginal in the 2012 presidential election as minorities and voters from D.C move there. Whitman should be safe here in a district where McCain probably won 56% of the vote, up from 51% under the old plan. The demographics are 15% Black (down from 18%) and 76% White. Status is Safe Republican.

2nd District Glenn Nye (D) Green

Nye barely won and Obama barely won the old district too. Even though Nye is a blue dog, a strong Republican could easily unseat him, especially in a year like 2010. So I added all of Hampton and Newport News to the district. Those two cities voted for Obama by a combined 51,000 votes. I may have overprotected Nye by creating a grotesque gerrymander including Black neighborhoods in Virginia Beach and White neighborhoods in Norfolk. The parts of Norfolk I included may not be heavily Democratic. I did at least remove Republican parts of Virginia Beach. Anyway, the district becomes heavily Democratic while the 3rd district is still majority Black. The only problem is that 3rd district Congressman Bobby Scott’s home is in the district. Since the 3rd contains most of his old territory, he could just run there and be safe. Obama probably won 61% of the vote here. The demographics are 34% Black, 5% Hispanic and 54% White. Status is Safe Democrat.

3rd District Bobby Scott (D) Purple

The district changes a bit and no longer jumps over the river. It loses all of Hampton and Newport News while scooping up every Black precinct on the southern bank of the James River. Most of the new precincts are from the current 4th district. Also, the 3rd drops Republican New Kent County while extending an arm into Hopewell which leans Democratic and Petersburg where Obama won 89% of the vote. Besides these changes, I added a few more precincts in Richmond City and Henrico County. I also added some in Chesterfield County which had high Black turnout but McCain still won it. Basically, all the new additions came in here so I could strengthen the 4th district. With these small changes, Scott should be safe. Obama probably won 75% of the vote here. Demographics are 55% Black and 36% White. Status is Safe Democrat.

4th District Randy Forbes (R) Red

I mentioned this map would be a gerrymander. I definitely made this district convoluted even though it is nothing compared to (you can probably figure that out.) Still, I kept in most of Chesapeake where Forbes lives. Since the 3rd district and the 5th took away all the heavily Black precincts, I sent this district west to take away Republican areas in the 5th and 9th districts. The district has a long string along the Virginia/North Carolina border to a clump of Republican counties formerly in the 5th and 9th districts. I see no reason for Forbes to complain unless he wanted a more compact district. Since I reduced the Black population from 33% to 20%, Forbes should be safe. McCain probably won 59% of the vote here. Demographics are 20% Black and 72% White. Status is Safe Republican.

5th District Tom Perrillio (D) Yellow

First, I am sorry about this extremely convoluted gerrymander that should not be on this map. I do not see Republicans objecting to it because it helps shore up possibly endangered incumbents such as Whitman, Forbes and Cantor. The district’s new changes include a finger into the old 1st district to take some Democratic areas. The district then goes toward Richmond. The last major change was extending the district up to Rappahannock County which is 83% White but Democratic Senator Jim Webb still carried it in 2006. What is amazing is that Black percentage remains stagnant. The areas the district picks up such as Harrisonburg in the Shenandoah Valley are filled with white Democrats. Perrillio should face a major challenge in 2010 but if he survives, this plan will protect him. Obama probably won 54% of the vote here. Demographics are 23% Black and 69% White. Status is Likely Democrat.

6th District Bob Goodlatte (R) Teal

This district stays mostly the same in area. Goodlatte keeps the Shenandoah Valley and loses Democratic areas in it such as Harrisonburg and part of Roanoke. Just to shake him up, I took his home out but since this district contains most of his old territory, he would probably pick it. I gave him some Republican counties in the current 9th district. The biggest change I made was moving this district closer to D.C. I gave him most of Fauquier County which used to be in the 1st district. I even gave him a slice of Prince William County. D.C politicians might complain but Goodlatte will not. The area I gave him is pretty Republican. The only problem I see for him is that Deeds might take a run at this district if he loses the gubernatorial election. The 6th district contains most of his old State Senate district. He could run it close but would probably lose by about ten points because I do not see Republicans in the northern part of the district backing Deeds. I will give Deeds a better chance if he performs extremely well in rural areas during the gubernatorial election. In other cases, Goodlatte should be safe. McCain probably won 62% of the vote here. Demographics are 5% Black and 89% White, the whitest district in Virginia. Status is Likely Republican if Deeds runs, Safe Republican if Deeds does not.

7th district Eric Cantor (R) Gray

Unlike Goodlatte, Cantor keeps his home in his district but the rest of his territory is switched. I split his old territory with the 1st and 5th districts. Most of his new territory was Republican parts of the 4th and the 5th. The reason I took Republican areas away from the 4th was for population purposes. I know this is gerrymandered but as long as he has a safe district, Republicans and Cantor should not complain. McCain probably won 55% of the vote here. Demographics are 17% Black and 74% White. Status is Safe Republican.

8th District Jim Moran (D) Purple (in the north)

I kept most of Arlington and all of Alexandria in the district. The main changes I made were taking out the thin corridor that heads to Reston in northwestern Fairfax County. I sent Moran’s district to western Fairfax County to take in some territory that is mixed. Obama probably pulled even in the western part but Arlington and Alexandria should save Moran from any trouble. The close in suburbs should help make this district heavily Democratic. Obama probably won 65% of the vote here. Demographics are 10% Black, 16% Hispanic, 14% Asian and 55% White. Status is Safe Democrat.

9th District Rick Boucher (D) Light Blue

This district mostly remained unchanged after most redistricting. I decided to change that. I put some heavily Republican counties into the 6th district. The only spot of worry is that I slipped in Roanoke which votes Democratic but Goodlatte lives there. Again, I am assuming Goodlatte would not want to risk a run against Boucher when Goodlatte could easily win the 6th. The Republicans may field someone else but that candidate would have a poor chance of beating Boucher. McCain probably won 56% of the vote here, down from 59% in the old district. Demographics are 8% Black and 86% White. Status is Safe/Likely Democrat.

10th District Frank Wolf (R) Pink

His district is 69% White so it appears unchanged at a first glance from its current form. Wolf’s problem is that many of those white voters are Liberals. His old district contained many white voters from the Conservative Shenandoah Valley. I will admit I did not give him much new territory. I did, however take out all of the Shenandoah Valley. The only Conservative areas are Clarke County and part of Fauquier County. I kept most of his old territory in the district with all of Loudon County and northern Fairfax County. He is probably entrenched there. Still, he should lose because I added Vienna, Reston, Falls Church and about half of Arlington. Those areas combined probably gave Obama a combined 40,000 vote margin. Also knowing that Wolf’s old territory he keeps voted for Obama, Wolf is in trouble. Brian Moran, Jim Moran’s brother might run here as a comeback after his failed Gubernatorial primary run earlier this year. With his brother’s support, Brian Moran would crush Wolf in Fairfax County and that should offset anything from Loudon County. Obama probably won 58% of the vote here. Demographics are 6% Black, 10% Hispanic, 12% Asian and 69% White. Status is Likely/Lean Democrat, depending on the challengers.

11th District Gerry Connelly (D) Light Green

This district shrank in size like the 10th due to large population gains. I sent this district to the Alexandria border and kept it out of the Republican western Prince William County. I also added Manassas and the surrounding area which Obama won. I cut out central Fairfax County due to population constraints. Another change was adding Democratic parts of Stafford County which Obama may turn blue in 2012. Overall, this district now easily protects Connelly. Obama probably won 60% of the vote here. Demographics are 17% Black, 17% Hispanic, 9% Asian and 52% White. Status is Safe Democrat.  

By what margin will Bob Shamansky win?

View Results

Loading ... Loading ...

Redistricting Virginia (7-4 Republican Gerrymander)

Hey everyone, there haven’t been as many redistricting diaries lately, so I thought I’d make one for Virginia, since it’s a state that’s very close to home for me and has seen some big changes recently.

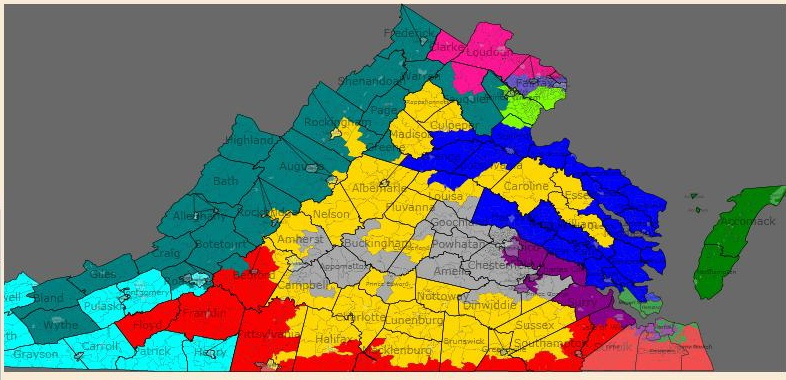
The first thing I did was I assigned all of the precincts in the state 4 colors (Blue for Obama over 56%, Green for Obama under 36%, Purple for McCain under 56%, and Red for McCain over 56%. I figure this would give a good visual representation of VA’s electorate and make things easier for me or anyone else.

This allowed me to do some stats on the entirety of all strong-Obama, weak-Obama, Strong McCain, and weak-McCain precincts in the entire state. Here’s what I came up with:

39.95% of all Virginians (or 3,104,205 people) live in precincts that went strongly for Obama.

13.73% of all Virginians (or 1,066,544 people) live in precincts that went weakly for Obama.

12.26% of all Virginians (or 952,461 people) live in precincts that went weakly for McCain.

34.06% of all Virginians (or 2,645,879 people) live in precincts that went strongly for McCain.

Aggregating votes using winner-take-all precincts gives Obama a win of 53.68%.

For strong Obama precincts, the racial stats were: 48% white, 31% black, 7% Asian, and 10% hispanic.

For weak Obama precincts, the racial stats were: 68% white, 15% black, 7% Asian, and 7% hispanic.

For weak McCain precincts, the racial stats were: 75% white, 14% black, 3% Asian, 4% hispanic.

For strong McCain precincts, the racial stats were: 85% white, 8% black, 1% Asian, 2% hispanic.

Now, since congressional districts are assigned based on precincts, I decided that the strong precincts represent the base number that a party should have. Thus, the Democrats should have 39% of the Congressional seats, and the Republicans 34%. The weak precincts in between represent the areas where manipulation through gerrymandering are most effective. Thus, if the Democrats controlled redistricting, a “safe” map for them to draw would consist of 7 Democratic seats and 4 Republican seats ((1-.3406)(11 districts))=7.25. The same goes for the Republicans, who are more likely to control redistricting ((1-.3995)(11 districts))=6.60. One could gerrymander beyond this, but not without introducing some serious partisan territory into their districts that could make them vulnerable down the road (as what happened to Republicans when they tried to pack all the Dems into 2 districts).

Therefore, I decided to draw a “safe” map that the Republicans would be smart to draw if safety is their greatest concern. I chose the Republicans because I’m not sure if the Dems will have a hand in this in VA come 2012. The outcome gives Republicans an additional 2 seats and would ensure that NO seats would change hands after the 2012 elections.

Here’s what I got:

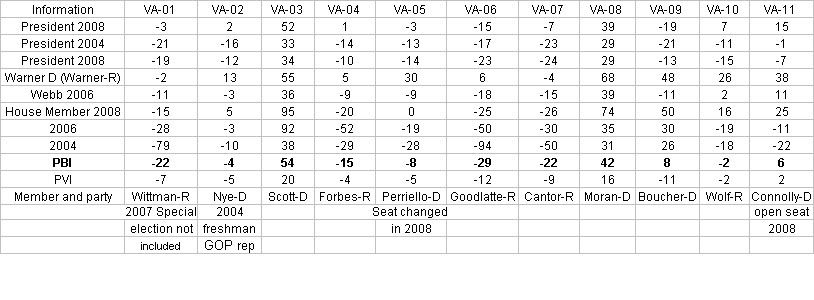
District 1 – Blue – Rob Wittman (R)

Changes very little. Needs to expand more into NoVA due to population growth, but less than 10% of the district lives there. The NOVA part voted for Obama, but the rest of the district is fairly conservative. In fact, just to make sure, I traded some majority-black precincts and counties out for some of ultra-conservative Hanover County and other deep-red areas around Richmond. McCain probably got about 55% here. (71% white, 17% black, 2% asian, 6% hispanic)

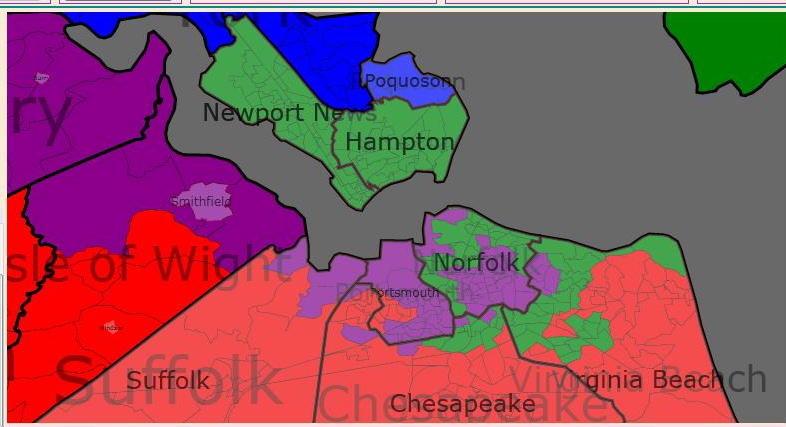
District 2 – Green – Glenn Nye (D)

Changes greatly. Goes from being Virginia Beach and Eastern Shore based to being a liberal Hampton Roads district. I know some of you think that this district is unnecessary, but without it the Republicans would need to do some serious cracking, because there are still many majority-black precincts left over after packing VA-03 so much that it becomes 64% black (this is why Obama won Forbes’ district and almost won Nye’s). Obama probably got 65-75% here, as the district ONLY consists of strong Obama precincts. Nye would probably be challenged from the left by a black democrat in this district (39% white, 49% black, 3% Asian, 4% hispanic)

District 3 – Purple – Robert Scott (D)

Expands out into the countryside, into areas that helped Obama win Forbes’ district. I could’ve made it more black, but I wanted to keep the lines clean so that the courts couldn’t say anything. Still crosses the river, but not as obnoxiously as before. Obama probably got 65-75% here. (41% white, 50% black, 1% Asian, 5% hispanic)

District 4 – Red – Randy Forbes (R)

District becomes completely bleached and safe for anyone who succeeds Forbes in any political environment. Added the lean-Dem Eastern shore in so that the district isn’t too packed. McCain probably got 60% here. (72% white, 17% black, 3% Asian, 4% hispanic)

District 5 – yellow – No incumbent

Getting rid of Periello’s district was easy. I decided to break open Goodlatte’s and Boucher’s districts because they are overpacked with Republicans. This district takes in liberal areas in Roanoke, VA Tech, and Harrisonburg just to make VA-06 more conservative, but the district is still safe for any Republican who runs. McCain probably got 60% here. (82% white, 11% black, 1% Asian, 2% hispanic)

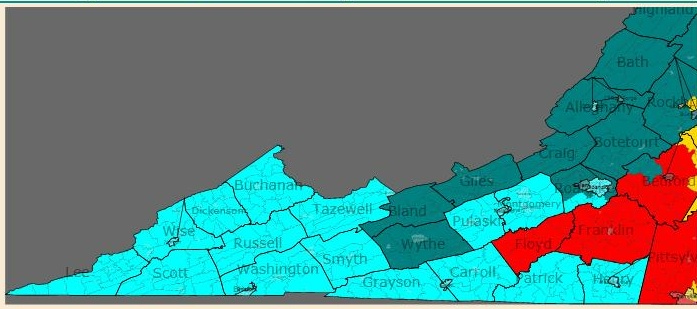
District 6 – teal – Bob Goodlatte (R) vs. Rick Boucher (D)

I know they worked out some kind of deal back in 2002, but if Republicans really want this seat, they really have no reason to care what Goodlatte thinks. This is mostly Goodlatte’s territory, but it takes in Boucher’s home. Goodlatte should win easily since nearly every precinct is strong-McCain. McCain probably got above 65% here. Republicans can unpack this after 2022 if they want. (91% white, 4% black, 1% hispanic)

District 7 – gray – Eric Cantor (R) vs. Tom Periello (D)

This district is anchored by the strongly-Republican Richmond suburbs. I took out some majority-black areas in Richmond, but I added some liberal areas in Charlottesville and majority-black areas from VA-01 to compensate. McCain’s performance is probably unchanged at 53%, but Cantor should be fine. I did not want to expand this district into NoVA, but I had to since I wanted to keep Wolf’s district partially in the Shenandoah Valley. Part of it was already in the DC media markey anyway. (77% white, 12% black, 4% Asian, 4% hispanic).

District 8 – purplish blue – Jim Moran (D)

Unpacked some to expand into heavily Obama areas in NoVa. Almost every precinct in this district was strong-Obama (he probably got 65% here). (59% white, 7% black, 14% Asian, 16% hispanic.

District 9 – light blue – No incumbent

Made this district too conservative for Boucher to win if he moved into it (he’d have to air ads in the Richmond suburbs where fire-breathing Republicans would hate him anyway). Really doesn’t include any liberal areas except maybe Danville. McCain probably got 60% here. (75% white, 19% black, 1% Asian, 3% hispanic)

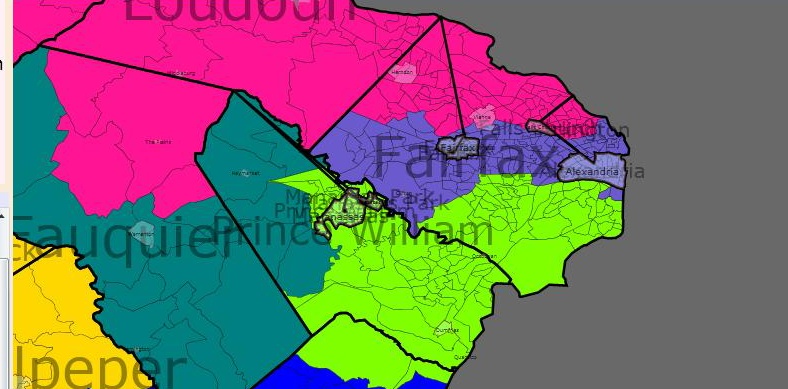
District 10 – pink – Frank Wolf (R)

Wanted to keep one Republican district in NoVa. Basically trades Dem areas for Rep areas, while trying not to take in any strong-Obama precincts. Obama got 55% in Wolf’s current district, but I’d wager that drawn this way, the district would’ve went for McCain by about 52-53%. This is the only district that might change hands if the Dems haven’t peaked in NoVA, but given some recent elections there, I think they have. (76% white,

76% white, 6% black, 8% Asian, 7% hispanic).

District 11 – light green – Gerry Connolly (D)

Loses Republican areas, gains Democratic areas. It was hard for me to believe, but some of the Prince William County precincts went over 75% for Obama, and this was a district that was drawn for a Republican; well, there’s no way this one is going back to them anytime soon; thus, this is their second concession. (49% white, 17% black, 12% Asian, 18% hispanic), and yes, Virginia gets 3 minority-majority districts under this plan.

Whew, well, let me know what you all think of all this.

Redistricting Virginia (A comprehensive look with three scenarios)

Virginia offers one of the most intriguing opportunities for redistricting after the 2010 census. The current map is based off of a Republican gerrymander, initiated after Republicans took firm control of both the House or Delegates and State Senate ahead of the 2001 redistricting. Thus Democrats stand to gain even under a bi-partisan or non-partisan scheme. Currently a numberof schemes are possible depending on the outcome of the 2009 state elections. Below I outline the likelihood of each scenario and an example of a redistricting scheme that could result from such a scenario.

NOTE: Current map can be accessed here: http://www.iqrealestate.com/Co…

Scenario 1. Bi-partisan or non-partisan redistricting

This is far and away the most likely outcome. Currently Democrats control the State Senate by a slim 21-19 margin. This control will prevent Republicans from enacting a gerrymandered scheme as long as Democrats do no suffer any mid-term retirements (an unlikely though not impossible sceneario as will be discussed in scenario 3). In addition, the political winds seem to be blowing against the Democrats in Virginia this year, so it seems almost equally unlikely that Democrats will gain control of both the governership and House of Delegates in 2009 and be able to enact a Democratic gerrymander. Therefore, the most likely outcome is that redistricting will occur either through a bi-partisan negotiating process, or a non-partisan panel (both have been discussed). Although there would be minor differences between the two outcomes, the sample map below is a good example of what either might look like since it both protects endangered incumbents and keeps similar “communities of interest” together. This sample map would likely maintain the current 6-5 Dem majority but could easliy support anything from a 7-4 Dem Majority to a 7-4 Rep majority in the long run

Bipartisan - state

CD #1 (Dark blue) – This largely resembles the current incarnation of the district. It should be marginally more Republican as it’s lost majority-minority areas in Prince William County and Hampton Roads in exchange for more conservative areas of Fauquier County, Prince William, and the Northern Neck.

Photobucket

CD #2 (Green) – The GOP was too clever by half in it’s 2001 redistricting scheme. Because of demographic and political changes both district 2 and district 4 became politically competitve and were won by Obama in the 2008 election. The 2nd seeks a compromise by making the 2nd more dem friendly for Glenn Nye in exchange for making the 4th a strong Republican district to protect Randy Forbes. Under this map, majority African American areas of Chesapeake previous in the 4th have been given to the 2nd in exchange for extremely conservative areas of coastal Virginia Beach. (Also note that Rep-leaning areas of Hampton have been ceeded to the 1st).

CD #3 (Purple)- Bobby Scott’s district needed to expand as it primarily consists of urban African-American sections of Richmond and Hampton Roads that have not kept pace with the state’s population growth over the last 10 years. As part of the compromise to strenghten the 2nd while weakening the 4th, the 3rd takes overwhelming African-American Petersburg from Forbes’s district while leaving Nye with many majority African-American areas in Hampton Roads.

CD #4 (red)- See above for most changes. In addittion, Forbes’s district gaines almost all of heavily Republican Chesterfield county.

CD #5 (yellow)- Tom Periello’s district is currently quite precarious and will probably stay that way under any bi-partisan compromise. Unfortunately there’s no way to make the district radically stronger without serious gerrymandering (which will not be possible under a bi-partisan compromise) due to the lack of other strong Democratic areas in the vicinity of Charlottesville. However, the district should become marginally more friendly as it has not kept up with the states population growth over the past 10 years and therefore gains the swingy locality of Lynchburg.

CD #6 (teal)- Becomes even more strongly Rep-leaning as Republicans compromise by giving the Dem-leaning city of Roanoke to the slow growing 9th in exchange for heavily Rep areas of the Shenandoah valley that have to be shed from the fast growing 10th.

CD #7 (gray)- No significant changes, the 7th remains a staunchly conservative district that provides a comfortable home to Eric Cantor.

CD #8 (light purple)- District has to expand as inner-Nova’s growth has not been as dramatic as PW or Loudon counties. Takes in heavily dem areas of Fairfax county and remains the heavily Democratic home of Jim Moran.

CD #9 (light blue)- The most rural, and slow growing district of the state must expand and does so by taking in Dem leaning Roanoke in exchange for less populous areas around Covington and Martinsville. This district is marginally more Democratic and should continue to easily re-elect Rick Boucher. However, it will still be very difficult to fill the seat with a Democratic replacement upon his retirement

Photobucket

CD #10 (pink)- Outer Norther Virginia has both grown by leaps and bounds and become more Dem-friendly over the past few years. This bi-partisan compromise gives Wolf the most Rep-friendly district possible without sever gerrymandering (in exchange for Republican concessions on the 5th and the 9th). However, this new district will still be significantly more Dem-friendly than its current incarnation. While Wolf might continue to squeak by, the district will likely flip Democratic upon his retirement.

CD #11 (lime green)- Part of the compromise to protect Wolf is necessarrily to make the 11th even more strongly Dem leaning than it is currently. By picking up marority-minority areas of Eastern Prince William and losing Strong-Rep areas of Western Prince William the district move from having a strong Democratic lean to a heavily Democratic district that could not elect a Republican even under the most ideal circumstances.

The other two scenarios (a Republican or Democatic controlled gerrymander) are much less likely and as such will be discussed in less detail below.

Scenario 2 – A Democratic gerrymander

Given the high hill the Democrats would have to climb to reach a majority in the House of Delegates and the unfriendly political winds blowing against the Democrats this scenario is possibly the least likely of the three.  However, politics is, as always, unpredictable, and if the Democrats do recover steam in time for the 2009 elections they may be able to enact a gerrymander similar to the one envisioned below. This example map would likely create a 7-4 Dem Majority.

Photobucket

Notable differences from the bi-partisan scheme

1. In Northern Virginia:

   Frank Wolf’s 10th takes heavily Democratic Arlington and Falls Church making his reelection next to impossible. Although the 11th is less Dem friendly it is still majority-minority. All three NOVA districts are strongly Democratic and should return Dem reps for the next 10 years

2. In Hampton Roads and Richmond:

   Glenn Nye’s 2nd district takes on all the majority African-American areas of South Hampton Roads and becomes a majority minority district with whites and blacks exist in almost equal proportions. Not suprisingly it is very strong Dem district (Obama prob won by at least 20 points). Suprisingly Bobby Scott’s district can maintain it’s majority minority status (and keep Scott’s base in Newport News) by taking Petersburg and African-American heavy areas of Henrico and Chesterfield counties. Randy Forbes 4th becomes a staunchly Republican as it’s majority African American areas are raided to strengthen the 2nd.

3. In the Southside/SW Virginia

  Periello’s 5th is strengthened (but not radically changed) by the inclusion of heavily African-American areas of Lynchburg, and Southeast Virginia, in addition to the swingly college towns of Harrisonburg and Staunton, in exchange for the overwhelmingly Republican areas of Appomattox, Franklin and Pittsylvania Counties. The 9th becomes more dem friendly, losing heavliy Republican rural SW VA counties in exchange for Dem-friendly Roanoke and swingy counties along the WV border.

Scenario #3 – Republican gerrymander

 Although Republicans seem somewhat likely to take the Governorship and extremely likely to retain control of the House of Delegates, there will not be an election in the Dem controlled state Senate before the next redistricting scheme is encacted. However the current Democratic majority is potentially precarious as it could be disrupted by the retirement of 82 year-old Chuck Colgan who represents a marginal seat in Northern Virginia that could flip Republican in a special election. In addition one member of the Democratic caucus (Ralph Northam of Norfolk) nearly left to join the Republicans earlier in the year. If a 20-20 tie occurs it will be broken by the Lietenant Governor who, given the current political enviornment, could very well be Republican candidate Bill Bolling. Although these are not good signs, Democrats can take solace in that a victory by Republican candidate Ken Cucinelli in the Auttourney General’s race would trigger a special election to fill his Senate seat — a seat won by Obama by a 12 point margin in 2008 that could very well flip Dem in the election and restore Democratic contol over the chamber. Nonetheless, if the worst does happen the Republicans would likely draft a map that looks something like this. This example map would likely create a 7-4 Republican Majority.

Photobucket

Notable differences with the Bi-partisan plan

1. In NOVA

  Democratic Strength in the region is concentrated in the 8th and 11th, and consigned the the heavily Republican 1st. The 10th is left with all the Republican areas and a larger share of the Shenadoah valley, making it a more hospitable district for Wolf and future Republican successors

2. In Richmond/Hampton Roads

 By Bobby Scott’s taking over heavely African-American Petersburg, the 4th and afford to take strong AA areas from the 2nd in exchange for strongly Republican areas of Chesapeake and Suffolk. In addition the 1st cedes Poquoson (which McCain carried by 50 points in 2008) and similarly rock-ribbed Republican areas of York County to the 2nd. The new 2nd is not completely unwinnable for Nye, but will probably flip Republican as long as they can find a somewhat credible challenger.

3. In SW Virginia/Southside

  Periello’s 5th is eviscerated as his base in Charlottesville is added to the rock ribbed Republican 6th. Without heavily Dem Charlottesville/Albemarle the 5th becomes a very difficult climb for any Democrat and unwinnable for a relatively liberal Democrat like Periello. Although the 6th gains this Dem bastion it too is unwinnable for any Dem candidate, with the loss of Democratic Roanoke, and the addition of heavily Republican areas of the Shenandoah Valley and Northern Virginia. Republicans make minimal changes to the 9th and remain confident that the district will flip back to them upon Boucher’s retirement.

Suffice to say, a lot hangs on the results of the state elections in Virginia this Novemeber. Please let me know if you have any suggestions or observations.

Another poll showing Deeds far behind

Another poll on the race for Virginia Governor shows Republican Bob McDonnell keeping his wide lead over Deeds, defeating him 54%-39% with likely voters, and 47%-40% with registered voters overall. The poll’s MOE is 3%. McDonnell’s wide lead is thanks in large part to independents and moderates.

The only real branch of hope that Deeds can grab onto in this poll is that only 48% of voters polled are certain to vote for either McDonnell or Deeds.

http://www.washingtonpost.com/…

By what margin will Bob Shamansky win?

View Results

Loading ... Loading ...

PBI (Party Brand Index) Part 2: Colorado & Virginia (updated)

I have been working on (with some much appreciated help from pl515) a concept I’m calling PBI or Party Brand Index, as a replacement for PVI.  PVI (Partisan Voting Index), which is measured by averaging voting percentage from the last two presidential elections in each house district, and comparing it to how the nation as a whole voted, is a useful shorthand for understanding the liberal v. conservative dynamics of a district. But in my opinion it falls short in a number of areas. First it doesn’t explain states like Arkansas or West Virginia. These states have districts who’s PVI indicates a Democrat shouldn’t win, yet Democrats (outside of the presidency) win quite handily. Secondly why is this the case in Arkansas but not Oklahoma with similar PVI rated districts?

Secondly PVI can miss trends as it takes 4 years to readjust. The main purpose of Party Brand Index is to give a better idea of how a candidate does not relative to how the presidential candidate did, but compared to how their generic PARTY would be expected to perform. Last week I calculated PBI for Indiana, this week I tackled Colorado and Virginia.

My best case for arguing against PVI is Indiana.  Bush won Indiana quite easily in 2000 and 2004. The PVI of a number of it’s districts showed them to be quite Red. Yet in 2006 democrats won several districts despite their PVI’s. Also Obama won Indiana in 2008 a state, which based on the make up of the districts PVIs, made little sense. I therefore chose Indiana as my first test case for PBI:

Donnelly in the Indiana 2nd is a perfect example of my issues with PVI. Under PVI Donnelly is in a Republican district with a PVI of -2. But look at how Democrats have recently performed in this district. In 2008 Donnelly won reelection by 37%! Obama won this district by 9 points, and Bayh won it by 22%! Does this sound like a lean GOP district? Under PVI it is, under PBI it’s not it’s a +11 democratic district.

This week I tackled Colorado and Virginia. My general strategy is to work my way “out” from swing states. Both these states have undergone noticable ideological shift. Yet the PVI of their districts haven’t moved as much. This made them ideal candidates.

COLORADO

The big difference in Colorado is that Salazar’s district goes from being a lean Republican one under PVI (-5 Republican), to a lean Democratic one (+4 Democrat), considering that a Salazar has held this same seat for some time this makes more sense. Remember I measuring total party preference not just the presidential preference of a district like PVI measures.

VIRGINIA

Virginia was the first time I had doubts on my ability to compute rough Senate numbers for House districts based on county totals. My estimates from Mark Warner Senate run yielded results of 3540% in Tom Perriello’s (VA-5th) district. This seemed way to high, even though now Senator Warner won the state with 65% of the vote.  At the time Virgil Goode was the representative from the VA-5th, and he lost by only a few hundred votes.- This lead me to do some additional research to try and discover if these numbers were published anywhere. Boy was I wrong Warner actually won the VA-5th by 65%!. Also several of the large victory margins were the results of representatives who ran unopposed. Fixed Party ID, and election results

________________________________________________________________________________

As a reminder I will review how I calculate Party Brand Index.

To compute PBI I basically did the following. I weighed the last 3 presidential elections by a factor of 0.45. Presidential preference is the most indicative vote since it’s the one politician people follow the most. The POTUS is the elected official people identify with or despise the most, thus illuminating their own ideological identification. I then weighed each house seat by 0.35. House seats are gerrymandered and the local leader can most closely match their districts make up in a way the POTUS can’t. So even though they have a lower profile I still gave them a heavy weight. Lastly I gave the last two Senate elections a weight of 0.2. Senatorial preference can make a difference, although I think it’s less than that of the President or the House members. Also (more practically) because I have to back calculate (estimate) Senate result totals from county results, a smaller number helps lessen the “noise” caused by any errors I may make. Under my system Democratic leaning have a positive number, the GOP has a negative number.

I then developed a way to weight for incumbents.  The reelection numbers for incumbents is so high it would be a mistake to weight a district solely on the fact that an incumbent continues to get elected. There is a long list of districts that have PVI that deviate from their incumbent members, whom none the less keep getting elected. These districts then change parties as soon as the incumbent member retires. This is evidence that incumbency can disguise the ideology of voters in a district.

Next I added a weighting of about 7% for House members. I remember reading that incumbency is worth about 5-10%. Nate wrote in a 538.com article that a VP pick from a small state was worth about a 7% swing, a house seat could in fact be thought of as a small state, that seems as good a number as any to start from. Conversely I will deduct 7% from an incumbents win. I think this will score them closer to the natural weight of a district. By the way I’m weighting the win 7% less, not actually subtracting 7% from the number.  Open seat races will be considered “pure” events and will remain neutral as far as weighting goes.  A seat switching parties will also be considered a neutral event. The 1st defense of a seat by a freshman house member will be given a weighting of 2%. The toughest race for any incumbent is their 1st defense. I decided to adjust for this fact. Note: Indiana’s bloddy 9th was a tough call a case could be made that when a seat keeps flipping, and the same two guys run 4 straight times in a row each election should be a neutral event.

Senate weighting is as follows. In state with a single House seat the Senate seat will be weighted the same as a house. In states with multiple seats, the Senate will get a weighting of 2%. Nate Silva stated that a VP pick in a large state is worth this amount. An argument could be made for a sliding scale of Senate weighting from 2-7%, this added complexity may be added at a later date. I will give incumbent presidents a 2% weighting, until I get better data on how powerful a “pull” being the sitting POTUS is, I will give them the same weighting as a senator.

______________________________________

Still to come:

The last major issue is how to deal with the “wingnut” factor. Sometimes a politician like Bill Sali (R-Idaho) or Marylin Musgrove (R-CO)lose because their voting record is outside of the mainstream of their district. I decided to try and factor this in.  

First I had to take a brief refresher on statistics. I developed a formula based on standard deviations. Basically I can figure out how much the average rep deviates from their district.  If I then compare where a reps voting pattern falls (in what percentile) and compare it to their district’s PVI, I can develop a “standard deviation factor”. Inside the standard deviation will get a bonus, outside a negative.

For example, if Rep X is the 42 most conservative rep, that would place her in the 90th percentile. But if her district’s PVI was “only” the in the 60th, their is a good chance her margins would be effected. Using a few random samples I found most reps lie within 12% of their district’s PVI.

Using these dummy numbers I then came up with this.  


   SQRT[(30-12)^2 /2] = about 13%

    Her factor would then be 100 – 13 = 0.87.

So her victory margin would be weighted by 0.87 because she is more than 12% beyond her acceptable percentile range it making the victories in her district approximate 13% less “representative”.

    My theory yields the following formula:

        If rep’s voting record is > PVI then

            100 – SQRT[({Record percentile – PVI} – Standard PVI Sigma)^2 /2] = factor

        else if rep’s voting record < PVI

             100 + SQRT[({Record percentile – PVI} – Standard PVI Sigma)^2 /2] = factor

To really do this I need to compute the standard deviation for all 435 reps, which is a pretty large undertaking. Instead  I will do a google search  to see if anyone has already done this. If not well it will take some time. But this would deal with the wingnut factor. Since politician tend to vote relatively close to their districts interest (even changing voting patterns over time) this may not be a major issue. But developing this factor may eventually allow the creation of a “reelection predictor”, so I am still going to work on it.

One last note, the corruption factor (for example Rep. Cao (R-LA) beating former Rep. Jefferson) is outside of any formula I can think of. The only saving grace here is that because my formula uses several elections, the “noise” from a single event will eventually be reduced.

NEXT UP: NC and MO