Just Whistling Dixie: Unlikely Pro-Democratic Maps for Four Southern States (AL, KY, LA, VA)

After the jump, I present a survey of maps that are demographically possible if political improbable. They are presented mostly for holiday slow-time discussion fodder. The states covered are Alabama, Kentucky, Louisiana, and Virginia. Republicans will control the process in Alabama; the Democrats control a single house of the legislature in the other three states. So the Democrats are unlikely to get maps as good as these. My redistricting instincts tend towards “good government” aesthetics, so these maps are about what’s possible with relatively compact districts.

Alabama

Top-line results: 5 R – 2 D. (Neutral year, open seat, quality candidates, my impression)

This map creates two majority-black districts in Alabama, while pushing the Huntsville-based 5th in slightly more Democratic direction.

The estimates in Dave’s App put Alabama at 4.66M people. The actual Census figure is 4.78M.

The 1st and 2nd engage in extensive territory swapping with the 2nd. The 1st gains gains the southeastern corner of the state; the 2nd gains much of Mobile proper. This roughly doubles the black percentage of the 2nd, taking it to 53% black, 43% white. Martha Roby should be in trouble. The 7th is very slightly diluted, dropping from 61% to 59% black. Making the 2nd majority black also let me shore up Mike Roger’s 3rd, which lost about 8 points off its black percentage.

In the north, the 5th needed to shrink. Glancing over the last decades worth of county-level results, the eastern side of the district seemed slightly more Democratic than the western side, so I lopped off Jackson County. Mo Brooks would probably still be fine here, but I’d rate this as the district most likely to flip to the Democrats outside of the majority-black ones.

I’m not entirely sure what the Republican will do with their control. The current 4th and 6th are R+26 and R+29 respectively, so a well-executed unpacking of those districts should end shoring up the other four GOP-held districts.

Kentucky

Top-line results: 3 R – 2 D – 1 S (Neutral year, open seat, quality candidates, my impression)

This map shores up Ben Chandler’s 6th district, while pushing the Paducah-based 1st into a potentially swingy seat. (I might be over-estimating Democratic chances there.)
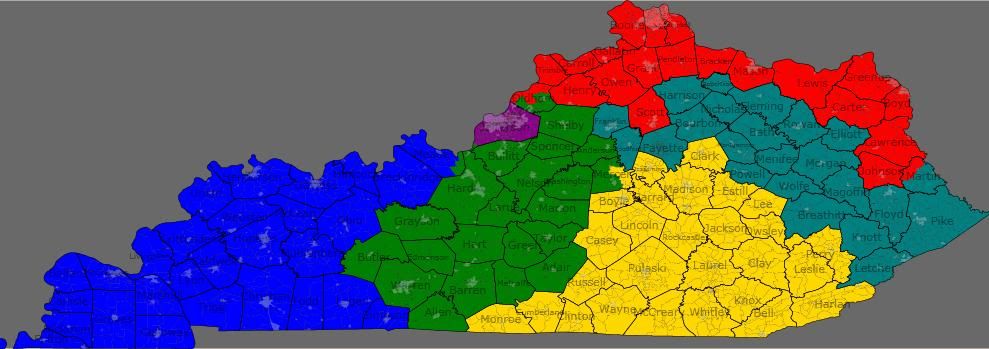
The estimates in Dave’s App put Kentucky at 4.04M people. The actual Census figure is 4.34M.

Looking at recent governor and US senator races, I noticed that the geographically largest areas of Democratic support in Kentucky is in the central portion of western eastern half of the state. That support is currently cracked into parts of three districts. I consolidated that support into Chandler’s 6th (teal), which should go from swingy to solidly Democratic.

In doing so, I forced the 5th (yellow) to the west, eating up areas that are contributing to Republican margins in the 1st (blue). (The new 5th is very Republican — it’s the only district without a single county that went Democratic in either of the last two US Senate races.) This new 1st should be winnable for a Democrat under the right circumstances — for example, by eyeballing it, I estimate that Mongiardo probably won in the 2004 Senate race.

I actually think that my 6th might have a decent shot of being created if the state House Democrats can force incumbent-protection. It’s just that the first will need to be solidified for the Republicans by some territory swaps with the 2nd and 5th.

Louisiana

Top-line results: 3 R – 2 D – 1 S. (Neutral year, open seat, quality candidates, my impression)

This map creates two majority-black districts in Louisiana, while trying to make the Shreveport-based 4th as Democratic as possible.

The estimates in Dave’s App put Louisiana at 4.41M people. The actual Census figure is 4.53M.

The 2nd (green) and 6th (teal) are the intended majority black districts. The actual figures are more like 49.6% in each. The 4th (red) is 54% white, 41% black. I hope that’s enough to make the 4th competitive for the Democrats.

Most speculation I’ve seen indicated the Republicans will be trying to make a single Baton Rouge-to-New Orleans majority-black district. Given the recent rate of party switching in the Louisiana state legislature, I imagine they’ll probably succeed.

Virginia

Top-line results: 5 D – 4 R – 2 S (Neutral year, open seat, quality candidates, my impression)

I originally presented this map in a comment in diary by drobertson. It fits the theme though, so I’m reposting it for consideration. This map is probably the most “good government” of these maps – each district basically corresponds to an existing political/cultural region of Virginia.

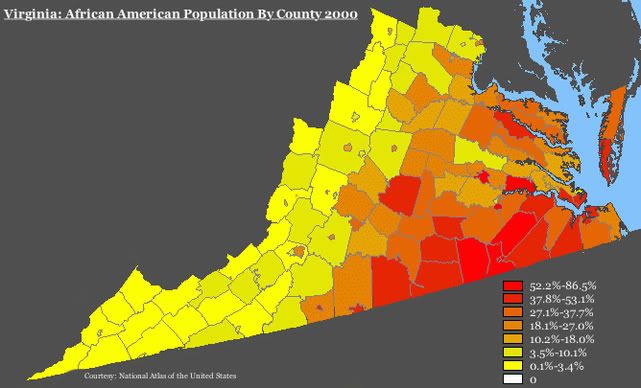
Its most notable feature is that presents two plurality black districts in the southeastern part of the state.

The estimates in Dave’s App put Virginia at 7.77M people. The actual Census figure is 8.00M.

1st (blue) – Peninsulas – Obama 46, McCain 54

2nd (green) – Suburban Hampton Roads – Obama 49, McCain 51

3rd (purple) – Urban Hampton Roads – Obama 69, McCain 31 — VRA: 49% black, 42% white

4th (red) – Richmond, Petersburg, and South Virginia – Obama 61, McCain 39 — VRA: 50% black, 44% white

5th (yellow) – Piedmont – Obama 47, McCain 53

6th (teal) – Shenandoah – Obama 43, McCain 57

7th (grey) – Richmond suburbs – Obama 42, McCain 58

8th (slate blue) – Arlington, Alexandria, north Fairfax- safe D

9th (cyan) – southwest Virginia – Obama 40, McCain 60

10th (magenta) – Prince William and Loudoun – Obama 56, McCain 44

11th (lime) — south Fairfax and Manassas – ???

The presidential percentages are back-of-the-envelope style. I used the 2008 figures to the nearest hundred and counted split cities/counties as if they were wholly within the district they were most in. I didn’t feel like delving into Fairfax precincts for the 8th/11th. The 8th should be just as safe as it is now, and I think, though I’m not 100% certain, that this version of the 11th is more Democratic than the current one. (Drobertson questioned this assertion at the time I made it, but agreed that this new district ought to be better for Gerry Connolly if not Generic D.)

The 2nd is more Republican than listed, but I don’t know how much more. I counted Isle of Wight and Suffolk as if they are wholly in it, but they are both donating their most heavily black precincts to the neighboring 4th and 3rd, respectively.

There’s a similar dynamic for the 4th and 7th, which are probably even more firmly in their respective parties’ control than it appears. I counted all of Richmond and Henrico in the 4th, but the majority white parts of each are actually in the 7th.

Notes on incumbents: Wittman, Scott, Cantor, Goodlatte, Moran, and Connolley are all fine. Rigell and Forbes would share the 2nd. Hurt lives in the new 4th. Griffith lives in the new 6th. Wolf lives in the new 8th. I assume all three of them would continue to run in the same districts anyway — all of them are in counties adjacent to their districts.

In the real world, the Virginia state senate Democrats should be able to force incumbent-protection, but seperating Richmond from Hampton Roads for two black opportunity districts won’t be happening.

VA Redistricting

Many other people have posted their virginia maps, so here is mine. With split control of the state legislature, this is an incumbent protection map that locks in the 8R-3D split in the state delegation.

Northern Virginia


VA-08 (Purple)

This remains the most Democratic district in NoVA, and a safe district for Moran. It loses the areas south of Alexandria to the 11th, but picks up McLean, Herndon, and Sterling from the 10th. These areas were the most democratic parts of the 10th, so doing this shores up that district for the Republicans.

VA-11 (Bright Green)

(*full disclosure: I worked as a paid canvasser for the Connolly campaign in 2010, but that hasn’t biased the way I’ve drawn this map. Really. I no longer have any ties to Gerry Connolly or his campaign*)

This once-swing district has now become solidly Democratic, almost as much as the 8th to the north. Gerry Connolly is now safe, one of the few improvements for democrats under this map. It picks up the areas south of Alexandria from the 8th, loses western Prince William (the most Republican part of the district) to the 1st, and loses the most Republican parts of Fairfax County in Oakton, Burke, and West Springfield to the 10th. It now stands as an amalgamation of heavily Democratic Dale City, Woodbridge, and Occoquan in Prince William with the most democratic areas of Fairfax county south of Route 7 (roughly). Also interesting is that Keith Fimian’s home in Oakton is now in VA-10, so if he wants to run for congress again maybe he can try to teabag Frank Wolf.

VA-10 (Magenta)


This was the fastest growing district in Virginia by far, needing to shrink by about 110,000 people in it’s previous incarnation. Previously a slightly GOP-leaning swing district that voted for Obama in 08. Republican Frank Wolf has the district completely locked down due in large part to his ability to secure federal earmarks for projects like the Silver Line DC Metro extension in this area. But after Wolf retires, this district would have been extremely competitive and a fiscally moderate, socially liberal dem might even have been slightly favored here. This redistricting aims to prevent that. The district cedes areas like McLean and Herndon in Fairfax Co that leaned to the Dems to the 8th. It now only has tentacles that reach into Fairfax and eat up basically all the Republican precincts there in areas like Great Falls, Burke, and Oakton. It also gives up the slightly D-leaning swing region of Manassas to the 1st district, and picks up some Appalachian counties from the 6th. I  still haven’t made this district totally republican, as that is almost impossible. It is competitive in the case of a Wolf retirement, but definitely less than before and the Republican running to succeed wolf would have an advantage. And in 6 or 8 years it’s easy to see this district returning to swing status, as the population growth in Loudon County is making it more and more democratic.

Eastern/Central VA


VA-01 (Blue)

This district was Republican leaning in its previous incarnation, however the fact that it is growing more democratic as the population shifts from the shrinking southern areas around Hampton Roads and Williamsburg to the DC exurbs makes it possible that when Wittman retires the old incarnation of this district could go dem. The new incarnation is not that much more Republican, if at all, owing to the need to shore up the 2nd and the 10th. It loses Fredricksburg, previously one of the most democratic parts of the district, to Eric Cantor’s 7th district. It gains the Manassas area from the 10th, and some of western Prince William from the 11th. The 2nd took up some extremely red areas in the Poqouson and York County areas. Overall the shift is maybe a point or two in the GOP’s favor.

VA-02 (Dark Green)


This district was about two points more Democratic than the 1st to the north, allowing Glenn Nye to win in 08. Republicans will want to prevent that from ever happening again, and this map accomplishes that. This district has taken on the City of Poqouson and much of York County, which it needed due to population loss in the Hampton Roads area. These new areas voted 75% for McCain and 80% (!!) for McDonnell. So this definitely means Scott Rigell has a safe seat barring some kind of total implosion.

VA-03 (Dark Purple)

Very little change here. Still safe blue. Due to population loss had to take on the heavily democratic area of Mechanicsville outside of Richmond.

VA-04 (Red)


Very little change here, too. Had to shrink a tiny bit due to population growth, so I gave the town of Emporia to the 5th which needed more population due to the total facelift I gave it plus the fact that the entire SW area of virginia had been losing population. Still a solid red district.

VA-07 (Grey)


This district has gotten a lot more compact now, but it has stayed solidly republican. The area that previously stretched north into the rural areas has been taken out and given to the 5th district. In exchange, the district has gained Fredricksburg from the 1st. And, as previously mentioned, the heavily blue area of Mechanicsville has been given to the 3rd. Overall, the district hasn’t really changed much in terms of partisanship, but it looks much better, IMO.

Western Virginia

VA-06 (Teal)


This solidly republican district has shed a bit of it’s redness in the interest of helping shore up Hurt in VA-05. It has taken on the liberal Charlottesville area and ceded the Lynchburg area. This district has probably become significantly more democratic, although it is still very republican. Goodlatte won by 62% in 2008 and had no major-party opponent in 2010, so he should be safe, but a blue dog might be able to win this seat under open-seat conditions in a good year for dems. Tom Perriello would have a good chance at this seat if it were open, although I personally hope he is senator/governor by then.

VA-05 (Yellow)


This is probably the most changed district in this map. It has lost Charlottesville, previously the most liberal area of the district and home of its soon-to-be-former congressman Tom Perriello. In exchange, it has gained the northernmost part of the 7th, the tiny town of emporia from the 4th, and the city of lynchburg from the 6th. This gave it a little too much population, so I gave some of the westernmost part of the district to VA-09 to compensate for the 9th’s population loss. I may have gone overkill on this district. It was previously a republican leaning district, now it is an extremely safe district that even a blue dog in an open seat in a democratic wave year would have a lot of trouble winning.

VA-09 (Cyan)


Not much has changed here. This was a safe republican district before, and Rick Boucher held out largely due to his personal popularity, so Morgan Griffith doesn’t need much shoring up. The district has been losing population faster than any other district in VA, so it had to take on some areas from the 5th, but these don’t change the basic shape or the partisanship of the district at all.

This map should hold it’s 8-3 partisan composition for the forseeable future. The only thing that could change that is a Frank Wolf retirement, but the 10th is designed pretty much as best as possible to hold in that case. With Loudon county trending Democratic, though, this district should be a top democratic target in 6-8 years. This map has delayed the 10th’s transition to a Democratic target by a few years at least, though.

Some people (including myself) have raised the possibility that Republicans could simply do a mid-decade redistricting once they pick up the state senate in next year’s elections (which I and many other people on here believe is more than likely than not). However, what doing this map has taught me is that it is pretty close to impossible for Republicans to get a better than 8-3 split in congress. The only way for them to do better is to weaken the 10th significantly (and make the 11th more Republican leaning). Wolf could probably hold on in this kind of scenario, but in my view that would make it far too easy for the Democrats to pick up this area once Wolf retires (he is 71 so that may not be long). If they weaken the 10th too much, the Dems could even maybe knock off Wolf in a few years. So there’s not much potential benefit to the Republicans in a mid decade redistricting. An 8-3 split (that could become 7-4 at worst) is pretty damn good for them in a very purple state like VA.


By what margin will Bob Shamansky win?

View Results

Loading ... Loading ...

Bipartisan Redistricting in Virginia

With the election over, I thought I’d take a stab at what a bipartisan incumbent protection map might look like in Virginia. The plan is to protect all 11 incumbents; the only district that would likely be competitive in an open seat situation under this map is VA-10.

Click for huge.

VA-01 (Rob Wittman – R) – Hasn’t changed a whole lot; takes in some more of Prince William, loses part of Stafford/Spotsylvania, and adds the two Eastern Shore counties (they were in VA-01 prior to the 2000 map).

VA-02 (Scott Rigell – R) – Snakes up the shore to take in some Republican territory (Poquoson, parts of York and Gloucester), picks up the VA-01 bit of Hampton, and loses the Eastern Shore. Should move the needle to the Republicans by a couple points.

VA-03 (Bobby Scott – D) – Takes Petersburg out of VA-04, mostly unchanged. 62% black.

VA-04 (Randy Forbes – R) – Also not changed a whole lot, aside from losing Petersburg, which should flip the district to McCain.

VA-05 (Robert Hurt – R) – Removes Charlottesville and most of Albemarle, adds the rest of Bedford, Lynchburg, and Amherst. Should be no trouble at all for the Republicans to hold now.

VA-06 (Bob Goodlatte – R) – Snakes up from Roanoke, where Goodlatte lives, through the Shenandoah Valley, and pulls in Charlottesville and Albemarle and some outer NoVa counties. Shouldn’t endanger Goodlatte.

VA-07 (Eric Cantor – R) – Actually a little less ridiculous now, it’s a solidly-Republican suburban Richmond/Fredericksburg area district. Still should be solidly Republican.

VA-08 (Jim Moran – D) – Remains solidly Dem; continues to hold the trifecta of Alexandria, Arlington, and Falls Church, but goes west instead of south. Maybe a couple points less Democratic, but still a safe D district.

VA-09 (Morgan Griffith – R) – Not much changed here; added Salem, Martinsville, and some more of Roanoke County. Safe R.

VA-10 (Frank Wolf – R) – Added almost all of Shenandoah County, and removes some parts of Fairfax. Retains the most Republican parts of Fairfax. Safe for Wolf, should lean Republican in an open seat, unless it’s a particularly good Dem year.

VA-11 (Gerry Connolly – D) – Replaces the Republican PW County parts with the solidly-Dem SE PW County. Should be a pretty safe Dem seat.

Analyzing Swing States: Virginia, Conclusions

This is the last part of a series of posts analyzing the swing state Virginia, which aims to offer some concluding thoughts. The previous parts can be found starting here.

Conclusions

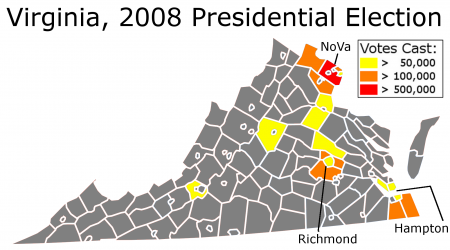
As a state, Virginia’s population has always been located in three metropolitan areas: the Northern Virginia suburbs south of Washington D.C., Richmond and its suburbs, and the communities surrounding Hampton Roads. Together these three places compose more than half of Virginia’s electorate:

Analyzing Swing States: Virginia,Conclusions

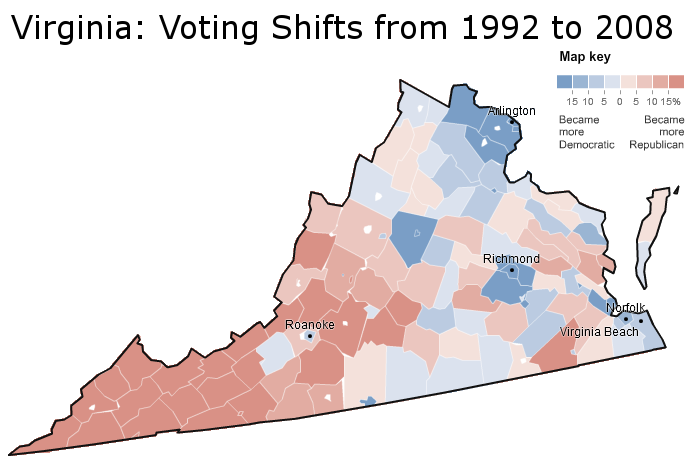
In all three metropolitan areas, Democrats have been improving their margins.

More below.

Virginia’s suburbs, expansive and traditionally Republican, have shifted leftwards with startling quickness. This movement has been most apparent in the largest of its suburbs, rich and diverse Northern Virginia. The addition of NoVa to Virginia’s heavily Democratic, heavily black cities has given the Democratic Party a coalition that has won a number of recent elections.

Not everything has gone badly for the Republican Party. They have captured a formerly loyal Democratic constituency – the Appalachian west, which voted Democratic based on economic appeals. Moreover, they still dominate the rural whites who in bygone days voted Democratic:

Analyzing Swing States: Virginia,Conclusions

Thus, Virginia today is a state in change, like most states. Parts of it are shifting left and parts of it are shifting right; in aggregate, the effect has been to change it from a solidly Republican to swing state. Undoubtedly, other states will and are moving in the opposite direction.

Colorado, the next state in this series, is probably not one of those Republican-shifting states.

–Inoljt, http://mypolitikal.com/

SC, VA & GA-09 Results Thread

8:34pm: This thread is getting a bit portly, so time to head on over to our new party scene.

8:27pm: For a while there, it was looking like Bob Inglis might lose outright tonight, with Trey Gowdy over the 50% mark. Now we’re looking like a runoff, with Gowdy at 34 and Inglis at 31 with 20% reporting. That’s not good news for Inglis either, as Gowdy’s likely to consolidate the anti-sanity vote.

8:25pm: Huh, I’d totally forgotten that John Adler (the Dem in NJ-03) was getting a challenge from the left over his HCR vote. He’s at 75%, against Bob Bendar.

8:24pm: We’re starting to see some New Jersey numbers trickling in. Most notably, in NJ-03, establishment meathead Jon Runyan is leading teabagger Justin Murphy 64-36, with 2%.

8:22pm: OK, go ahead and put that check mark next to Graves after all. The AP just called GA-09 in his favor.

8:17pm: Don’t quite put that check mark next to Tom Graves’ name in the GA-09 special just yet. He’s losing some ground, now leading Lee Hankins 59-41 with about half in. He’s crushing in every county except Hall (presumably Hankins’ home), which is keeping Hankins in the game.

8:13pm: In the GOP primary in the 3rd, all I can tell you is that we’re going to a runoff and CfG fave Jeff Duncan will be one of them. Three other guys are bunched around 15-19%, and right now the previously unheralded “R. Cash” is on track to make the runoff at 19%. (10% reporting.)

8:11pm: The AP has called it for Keith Fimian in VA-11, so we’re pretty much done in Virginia. That’s probably good news for Gerry Connolly; the more moderate Herrity would seem to match up better.

8:10pm: Looks like some asses finally got in gear in SC, as they’re suddenly up to 8% reporting. For the Rs, it’s still a Haley (40)/Barrett (28) runoff. McMaster’s at 17, Bauer’s at 14. Looks like the last-minute polygraph thing didn’t pan out. For the Ds, Sheheen is at 54, with Rex a surprisingly weak 26 and Robert Ford a surprisingly strong 20.

8:08pm: As far as actual numbers, in the 2nd, it’s Rigell 41, Loyola 24, Mizusawa 20, with 48% in. Not a dominant performance, but a win’s a win, and no runoffs in VA. In the 11th, it’s Fimian 61, Herrity 39, with 58% in.

8:06pm: AP has called it for Scott Rigell in VA-02.

8:05pm: Polls have closed in Maine and New Jersey, so we’re adding links for those below. Let’s see if anyone showed up in Maine.

8:00pm: Ticker tape is spewing out from the SSP Lab mainframes, and we’re feeling like we’re at a place where we can call both VA-02 for Scott Rigell and VA-11 for Keith Fimian. It would require massive turnarounds to go a different way at this point.

7:54pm: Still less than 1% in in SC-04, but Trey Gowdy is whomping Bob Inglis, and everybody else; he has 66 to Inglis’s 17. Of course, these are coming from Spartanburg, which is Gowdy’s home county, so expect that to tighten.

7:49pm: Things also seem to be going according to plan for the NRCC in the 2nd, where establishment pick Scott Rigell has 41%, ahead of Ben Loyola at 23, who just pulled ahead of Bert Mizusawa, at 21. We’re at 37% reporting.

7:46pm: Hmm, the twittersphere is saying that Rob Hurt has been declared the winner in VA-05. He’s up to 46% of the vote, with 65% reporting. McKelvey’s still in 2nd at 26%. If McKelvey follows through with threats to support the 3rd-party teabagger indie in November, he could probably move a bunch of votes with him.

7:44pm: We can probably expect a call soon in the GA-09 special. With about 23% reporting, CfG fave Tom Graves still leads Lee Hawkins 65-35.

7:42pm: In SC-Gov (R), it’s looking like a two-person race to make the runoff, between Haley (37) and Barrett (32). Still less than 1% reporting, though. (Also good for a laff: Trey Gowdy is winning 100% of the vote in SC-04. Out of a total of 2 votes, all from the 1 precinct out of 265 that’s reported.)

7:37pm: Things not looking so hot for Pat Herrity, the more establishment choice in VA-11. With 15% in, he’s still trailing Keith Fimian 61-39. Also worth noting he’s ahead only 50.1-49.9 in his home county of Fairfax, where he’s a county supervisor (granted, Fairfax Co. takes up about 2/3ds of the district, so maybe the Herrity areas haven’t reported yet).

7:34pm: Dang, more seesawing in VA-02. Rigell’s back in front at 40, with Mizusawa at 29. We’re at 26% reporting.

7:31pm: The AP is finally dribbling out some SC details. With a whopping 3 precincts out of 2,109, Nikki Haley’s just above the runoff-avoidance mark at 51%. Gresham Barrett’s in 2nd at 30. On the Dem side, Vince Sheheen is at 52 with Jim Rex at 41.

7:28pm: I might have been hasty about VA-02; check it out. Bert Mizusawa has actually pulled ahead of Scott Rigell, with 17% reporting. Bert’s up 37-33, with Ben Loyola at 18. Maybe Rigell’s insufficient purity caught up with him after all.

7:27pm: In VA-05, we’re up to 33% in. Hurt’s just moving sideways, still at 40%, but McKelvey is losing ground as other teabaggers’ local strongholds seem to be trickling in. McK is at 31, with McPadden up to 11.

7:26pm: Things are closing a lot in VA-11; maybe they started with Keith Fimian’s precinct. Fimian still has a big lead over Herrity, though: 63-37, with 6% in.

7:24pm: The AP has already called the GOP primary in VA-01 for incumbent Rep. Rob Wittman. Not that he was expected to lose to Cathy “Bullet Box” Crabill, but it wasn’t close.

7:21pm: Early outlook in GA-09, with 1% reporting, is a big lead for Tom Graves. He’s leading Lee Hawkins 65-35. Looks like that whole construction lien story didn’t damage him much.

7:19pm: Things are actually moving fast in VA-05. We’re up to 20% reporting. And things are tightening up between Hurt and McKelvey. It’s now Hurt 40, McKelvey 36. Remember, though, that VA doesn’t have runoffs.

7:17pm: Hmmm, I wonder if this a geographical blip or a sign of things to come? In VA-11’s GOP primary, 2008 nominee Keith Fimian is pounding Pat Herrity, by a surprising 80-20 margin. 1% is in.

7:15pm: There’s 1% in in the 2nd, and as expected, Scott Rigell, the wealthy guy/establishment choice, has a large lead. He’s at 57%, with Bert Mizusawa at 18%.

7:12pm: No preliminary ganja break in Virginia; they’re hitting the ground running. (These results are only at the BOE, not at the AP yet.) Maybe most significantly, with 4% reporting in the GOP primary in VA-05, Robert Hurt is in first place at 47%. Jim McKelvey seems to have consolidated much of the teabagger vote; he’s not too far back at 37%, with everyone else in single digits.


Polls are set to close in half an hour in South Carolina, Virginia and Georgia, and we’ll be using this thread to follow the returns. We’ll put up new threads throughout the night as polls close in other states. Grab your Pop Secret and let’s go!

RESULTS:

Maps of Virginia Elections

By: Inoljt, http://mypolitikal.com/

To follow up the series on Virginia, I’ve posted a few recent presidential elections in the state (courtesy of the New York Times). Each map comes with some brief analysis.

Maps of Virginia Elections

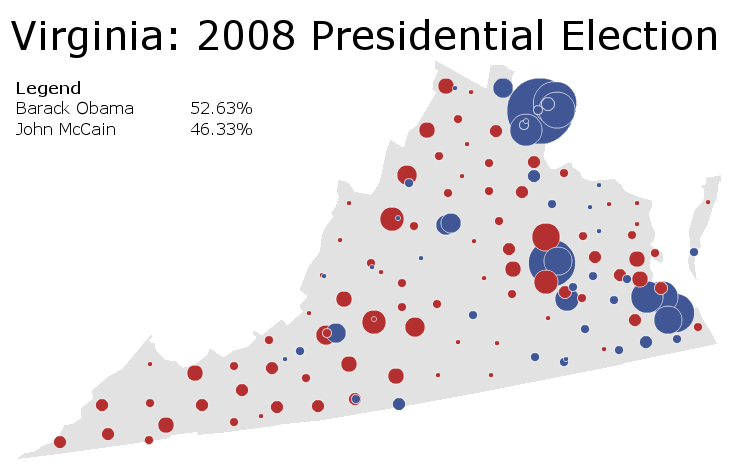
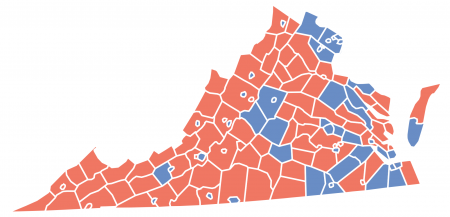
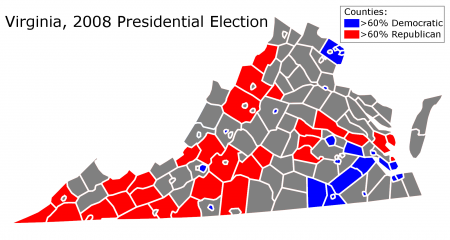
Capitalizing on a decade of Democratic movement, Senator Barack Obama becomes the first Democratic presidential candidate to win Virginia since 1964. The Senator performs best in eastern Virginia, especially the fast-growing northern Virginia metropolis. Western Virginia is not as enamored; parts of it even vote more Republican.

More below.

______________________________________________________

Maps of Virginia Elections

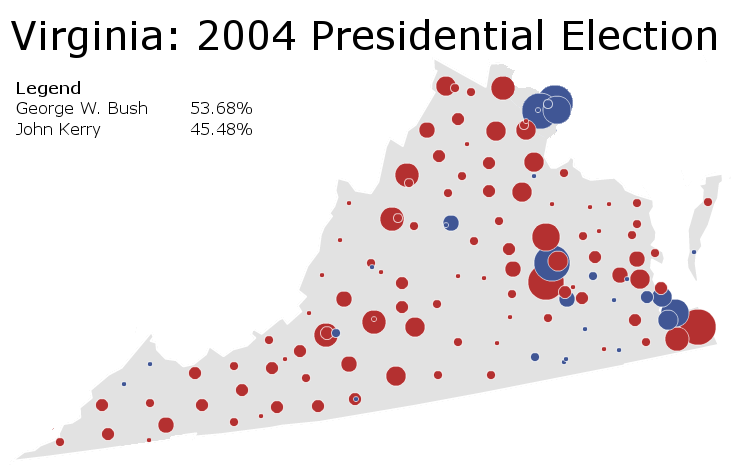
Nobody pays attention to Virginia in 2004, and for good reason: incumbent George W. Bush cruises along to a comfortable victory. Amid all the hoopla in Ohio, Republicans fail to notice a disquieting trend. Fairfax County, the populous heart of Northern Virginia, goes blue in the first time for decades.

______________________________________________________

Maps of Virginia Elections

Governor George W. Bush sails to an 8% victory. He artfully weaves together a classic Republican coalition: wealthy suburbs combined with Republican-trending rural Virginia.

______________________________________________________

Maps of Virginia Elections

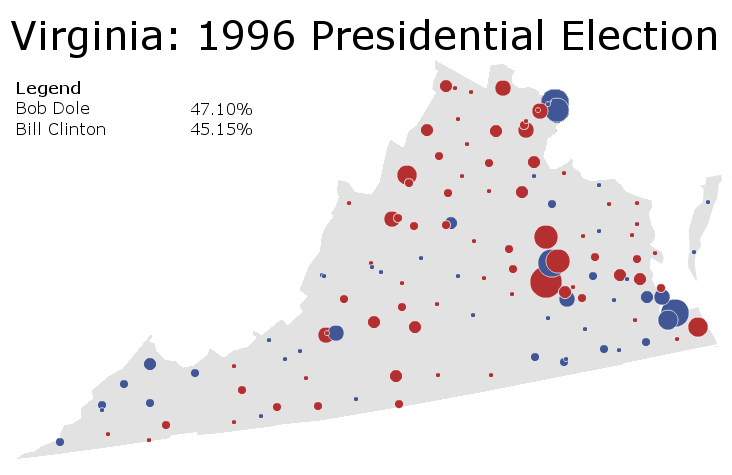
Expecting to win the state, incumbent Bill Clinton is surprised to see Virginia slip from his grasp. He does better than in 1992 – performing well amongst Democratic constituencies in the Appalachian west, the black southeast, and the rich inner-core suburbs of Northern Virginia. But it’s not enough: a strong Republican vote in Richmond’s suburbs denies Mr. Clinton his victory.

______________________________________________________

Maps of Virginia Elections

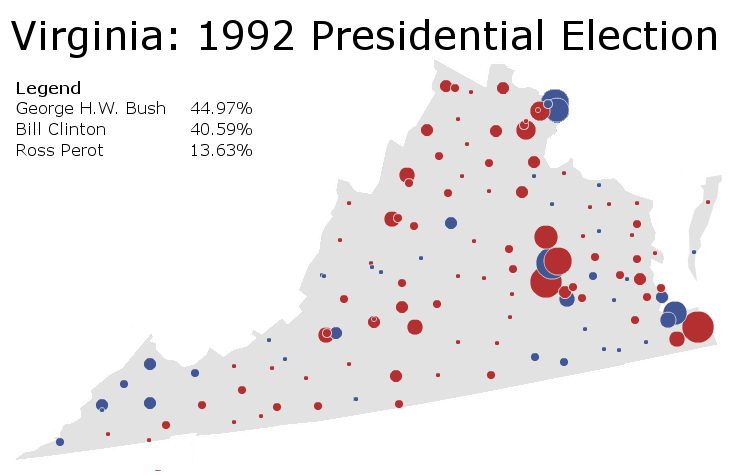
Another presidential election, another Republican victory in Virginia powered by suburbs and small towns. Yet Governor Bill Clinton does relatively well. Compared to the 20.5% beating George H.W. Bush gave to Democratic nominee Mike Dukakis in 1988, a 4.4% loss ain’t nothing.

Analyzing Swing States: Virginia, Part 5

This is the fifth part of a series of posts analyzing the swing state Virginia. It focuses on the traditional Democratic base and its decline. The last part can be found here.

In the days of the Solid South, Democrats worried more about primary elections than Republican challengers. The party, under the sway of the Byrd machine, dominated almost every part of the state – as it did throughout the South.

Civil rights and suburban growth broke the back of this coalition. In 1952 Virginia voted for Republican candidate Dwight Eisenhower. By the 1970s Virginia had elected its first Republican governor, senator, and attorney general in nearly a century.

Democrats were left with strength in two reliable regions – the southeast and the western panhandle. These places constituted the traditional Democratic base, which Democrats relied on for a number of decades.

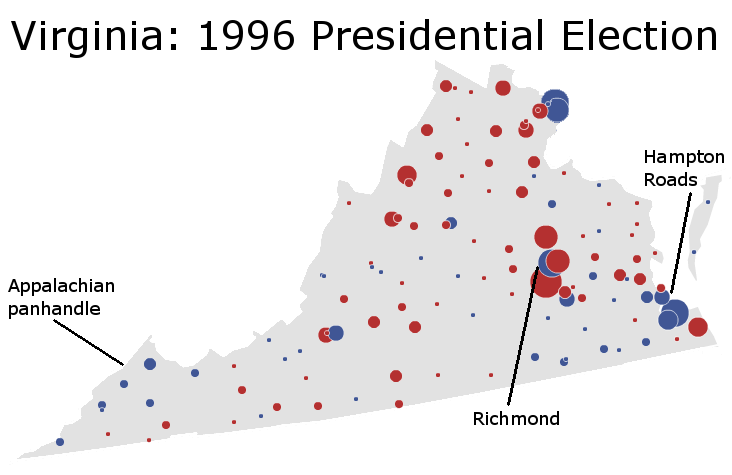
The 1996 presidential election provides an excellent illustration of this base:

Analyzing Swing States: Virginia,Part 5

More below.

With his rare ability to command support among both poor Appalachian whites and poor Southern blacks, Mr. Clinton performed powerfully with the traditional Democratic coalition. As the map indicates, the incumbent president dominated the southeast, while winning a number of counties in the panhandle. It is an illustration of the traditional base at a strong point.

Clinton also lost Virginia by two percentage points. This indicates something else: it is actually very difficult to win the state with the traditional Democratic base. There are just not enough Appalachian whites and blacks (20% of the population) in Virginia. Take mostly black, heavily Democratic  Richmond. In 2008 a little more than 90,000 votes were cast in the city. A respectable number – but barely more than half the 162,088 votes cast in  neighboring, suburban Chesterfield County.

Richmond also constitutes an important part of the Virginia’s Democratic-voting southeast – the first prong of the classical Democratic coalition. Democratic strength in this region can be explained through demographics; the region is home to much of the state’s black population:

Analyzing Swing States: Virginia,Part 5

Black voters, grateful for its passage of Civil Rights, remain a vital constituency of the Democratic coalition. They constitute a  stable block of voters  for a Democratic candidate to build upon.

Geographically, Democrats usually win a few rural, majority-black counties in the southeast. In addition, black votes give Democrats sizable margins coming out of Richmond and four Hampton Roads cities – Norfolk (the largest), Portsmouth, Hampton, and Newport News. In 2008 Senator Barack Obama’s vote ranged from 64% (Newport News) to 79% (Richmond) in each of these cities.

Unfortunately for Democrats, the second prong of their traditional base – the Appalachian panhandle – is quickly moving away from them. This area is fairly rural and somewhat poor; as the map above indicates, its population is fairly homogeneously white. Until recently, Democrats could rely on panhandle votes even in the event of a double-digit loss. Its residents voted Democratic based off a combination of economic interests and tradition.

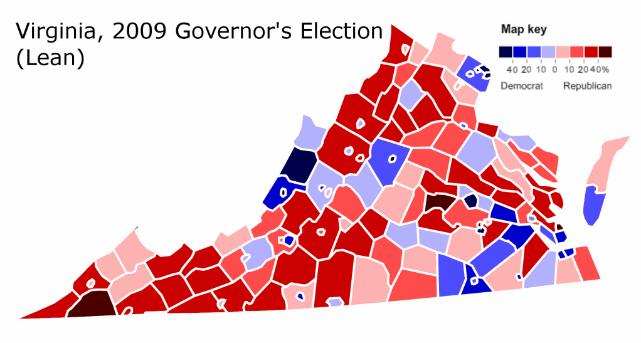
As the party becomes more metropolitan-based and liberal, however, the panhandle has been drifting away. The election of President Barack Obama, an ill-fit with Appalachian America, has accelerated the rightward movement. In 2009, Democratic candidate Creigh Deeds lost the panhandle by a landslide.

Analyzing Swing States: Virginia,Part 5

Even in the days in which the panhandle voted loyally Democratic, the base – as has been noted before – was insufficient for statewide victory. Democrats needed to add another prong to their coalition. Mr. Clinton attempted to do so by reviving support amongst the rural whites who’d long ago abandoned the Democratic Party; he mostly failed in his endeavor. In 1976, President Jimmy Carter did much better with rural whites but much worse with their suburban counterparts; Mr. Carter also barely lost Virginia.

Statewide Democratic candidates, on the other hand, have been able to win the state through a combination of the traditional base and a respectable suburban showing. Indeed, no Democratic presidential, senatorial, or gubernatorial candidate has won Virginia, for at least two decades, while losing suburban Fairfax County.

In recent years Democrats have traded the Appalachian panhandle for these NoVa suburbs. This switch has, in the aggregate, been to their benefit. The old Democratic base was rarely enough to win Virginia. With the addition of NoVa, Democrats have won three out of four past statewide elections. Virginia has moved from a red state to a purple one.

–Inoljt, http://mypolitikal.com/

Analyzing Swing States: Virginia, Part 4

This is the fourth part of a series of posts analyzing the swing state Virginia. It is the second section of two focusing on Northern Virginia, and focuses on analyzing the structural foundation behind NoVa’s Democratic shift. The fifth part can be found here.

Analyzing Swing States: Virginia,Part 4

Demographics

In many ways, Northern Virginia represents the best America has to offer. As wealthy, diverse, and rapidly growing suburb, it offers the very essence of the American Dream.

More below.

Demographically, Northern Virginia is one of those rare places whose racial composition is representative of America as a whole. In Fairfax County today blacks constitute 9.4% of the population, Hispanics 13.5% (nationally the numbers are 12.3% and 15.1%, respectively). Asians come in at 15.8%, a higher number than the national average.

As has been much noted, Northern Virginia is getting more diverse. In Fairfax County, for instance, the numbers of blacks, Hispanics, and Asians have all increased since the 2000 census – which counted blacks as 8.6%, Hispanics as 11.0%, and Asians as 13.0% of the population.

These changes are especially striking in exurban NoVa. Loudoun County, 2000 was 5.9% Asian and 5.3% Hispanic. Since then those numbers have more than doubled; from 2006-2008, the census estimated Loudoun as 12.3% Asian and 10.1% Hispanic (blacks constituted 7.8% of the county’s population).

Finally, Northern Virginia is very, very, very rich. The median household income in both Fairfax and Loudoun exceeds $100,000; a 2008 census study estimated them as the two wealthiest counties in America (see page 13). More than one-third of individuals over 25 in Arlington County hold graduate degrees, compared with less than 10% of Americans at large. Life expectancy is the highest in the nation.

The Future

Although Northern Virginia continues become more diverse, it is unclear how much more Democratic it can get. Suburbs rarely give a party more than 60% of the vote, and 65% seems to be the upper limit for Democrats. Given that President Barack Obama won 60.12% in Fairfax County, Democrats appear to be near this line.

Analyzing Swing States: Virginia,Part 4

On the other hand, the suburban metropolis that does break this rule (the Bay Area) has a lot in common with Northern Virginia. Like NoVa, the Bay Area is rich, diverse, and growing. But the Bay is also composed of a majority of minorities; this will not happen anytime soon in Northern Virginia.

Moreover, Virginia is missing the one piece that would truly make it a Democratic stronghold. Democratic suburbs like NoVa often surround poor, astonishingly Democratic cities. The good news is that NoVa does surround such a city – and that city gave Democrats 92.46% of its vote in 2008. The bad news is that the city’s name is Washington D.C.

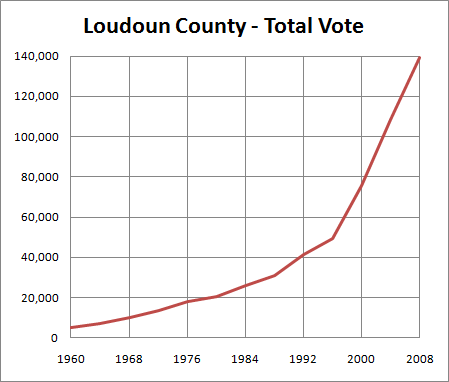
All this may not matter, however, if Northern Virginia continues its rapid growth. Today the exurbs in Loudoun and Prince Williams are the main sites of development, while Fairfax County’s growth appears to have slowed down. This translates into many more voters:

Analyzing Swing States: Virginia,Part 4

As Loudoun and Prince Williams become more diverse, moreover, they are been voting ever more Democratic. In 2000 Loudoun voted Republican by a 8.25% margin; in 2008 it voted Democratic by a 15.22% margin.

If Northern Virginia continues growing at this rate – and voting Democratic by a 3-2 margin – Virginia may eventually change into a Democratic-leaning state. This will probably be balanced out as other Democratic states naturally turn Republican-leaning. Nevertheless, adding NoVa to the old Democratic base leaves the Democratic Party in strong shape. That traditional base will be the subject of the next post.

Analyzing Swing States: Virginia, Part 3

This is the third part of a series of posts analyzing the swing state Virginia. It is the first section of two focusing on Northern Virginia. The fourth part can be found here.


NoVa

A vast and growing suburban metropolis, Northern Virginia has become increasingly important in Virginia politics. There, demographic changes have imperiled Republican dominance of Virginia.

To illustrate the exceptional nature of this movement, compare the two elections below. Here is 2000:

Photobucket

Eight years later, Northern Virginia has transformed:

Photobucket

More below.

In 2000, Governor George W. Bush had won Virginia by a comfortable 8.1% margin, carving out the traditional Republican coalition of rural and suburban Virginia. As this picture indicates, Virginia Democrats in 2000 really don’t have a base of support, except perhaps the heavily black southeast parts of the state. By 2008 Senator Barack Obama won the state by an equally comfortable 6.30% – a 14.3% shift in support.

Before digging into the dynamics of modern NoVa, it is worth exploring its past behavior to gain a sense of context.

A History

Northern Virginia was not always as populous as it is today; well into the twentieth century, it remained a rural (and heavily Democratic) backwater. In the 1940 presidential election, for instance, less than 10,000 people voted in Arlington County.

Growth began in the 1940s, however, driven by an ever-expanding federal government. The inner-ring suburbs in Arlington started expanding first, followed by Fairfax County in the 1950s. Like many other white and wealthy suburbs, Northern Virginia leaned Republican during this era.

Photobucket

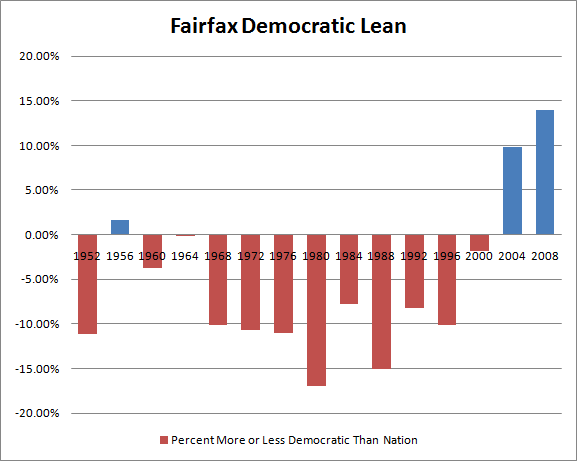
Unlike some suburbs, however, Northern Virginia never fell in love with Republicanism. In Fairfax County, Republican presidential candidates only once took more than 65% of the vote (in 1972) – something which would regularly happen in a place like Chesterfield County, a suburb of Richmond.

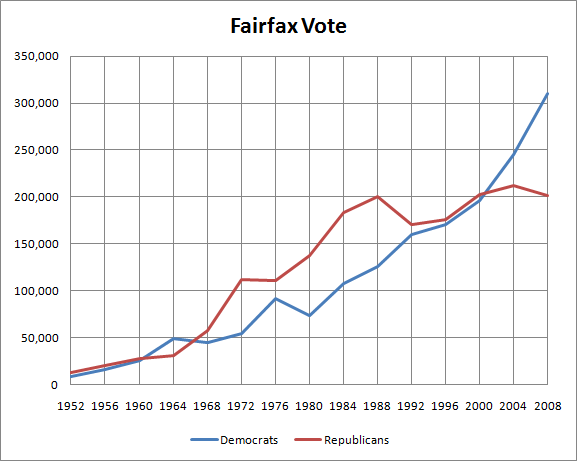
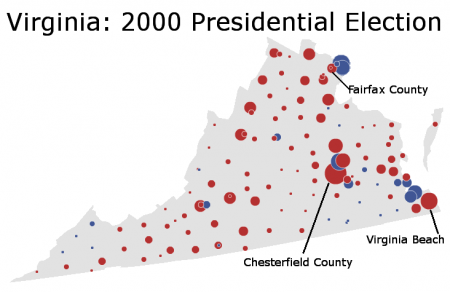
Change first began in the 1980s, when inner-ring suburbs such as Arlington started voting Democratic. In the 2000 map, one sees Arlington County as the lonely blue bubble to the right of Fairfax County.

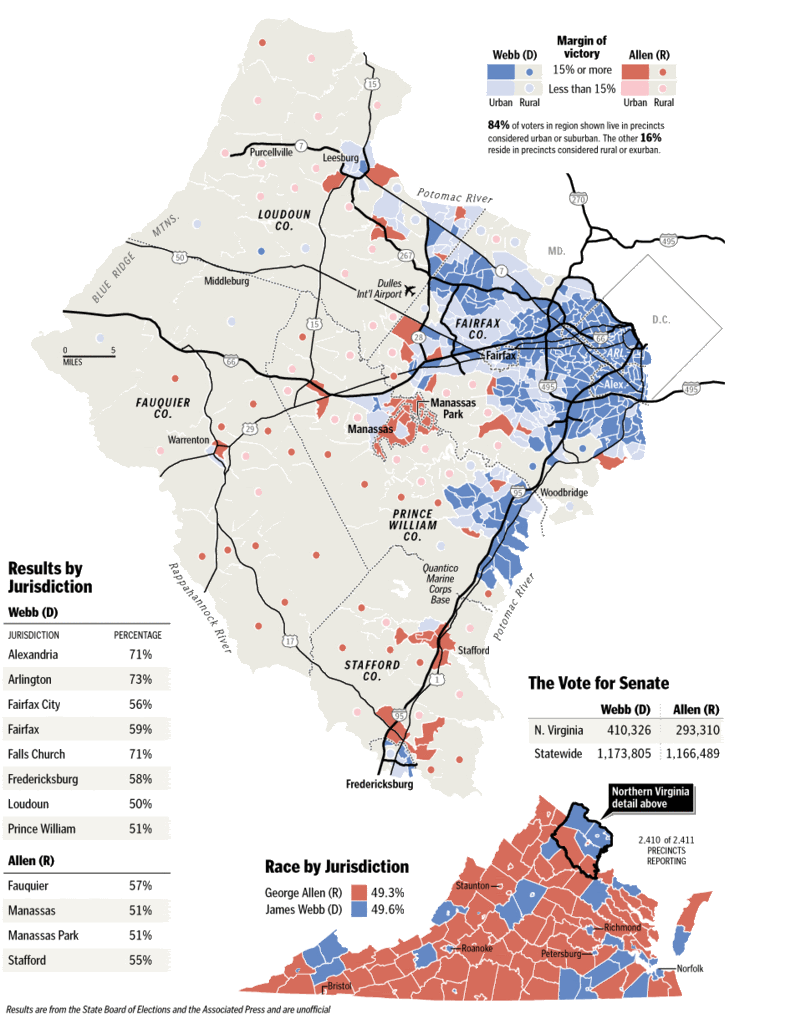
By 2000, as the graph above indicates, change was coming to the suburban communities in Fairfax. In 2004 the county voted Democratic by a 7.30% margin, which should have been a warning sign to Republicans. A mere two years later, it powered Democratic candidate Jim Webb to a narrow victory over incumbent Senator George Allen (he won the county by 18.9%). In 2008 Fairfax – well, just look at the map to see what happened in 2008.

In just eight short years, Northern Virginia has turned from a Republican-leaning suburb into a fundamental part of the Democratic base. Virginia has changed from a red state into a purple one, due mainly (but not entirely) to Northern Virginia.

The next post will explore Northern Virginia today – in order to get a sense of how this has happened.

–Inoljt, http://mypolitikal.com/

Analyzing Swing States: Virginia, Part 2

This is the second part of a series of posts analyzing the swing state Virginia. It will focus on Republican Virginia. The third part can be found here.

Analyzing Swing States: Virginia,Part 2

History

After the Civil War, Virginia constituted a reliable Democratic stronghold. Conservative Democrats such as Harry F. Byrd, who controlled the state’s politics for decades, typified the state’s politicians.

Like many southern states, Virginia enacted a strict set of voting restrictions which successfully disenfranchised blacks. However, it never voted as overwhelmingly Democratic as the Deep South; only one Democrat (FDR) ever won more than 70% of the vote.

Earlier than most Southern states, Virginia began moving Republican, beginning in 1952 (when it cast the ballot for General Dwight Eisenhower). Republican strength rested upon the mountainous west (Republican even in the days of the Solid South) and the fast-growing, Republican-leaning suburbs. The west still votes Republican, but the suburbs are changing fast.

More below.

Republican Virginia

Analyzing Swing States: Virginia,Part 2

Like many states in the South – and, in fact, like America itself – the “normal” voter usually leans Republican. When one imagines a Virginian (perhaps a hard-scrabble Appalachian type or a white suburban businessman), one is usually looking at a conservative. It is the growing numbers of “other” voters in the state that are making it competitive today.

These Republicans have several factors in common. Exit polls of the 2008 presidential election provide an interesting but incomplete picture of who they are. As is true of the United States in general, Virginia Republicans are predominately white (60% voted for Senator John McCain, versus 55% nationwide). White college graduates are substantially more Democratic than white non-graduates, but polling did not reveal an income gap. Evangelism Evangelicalism constituted a major factor: white evangelicals voted for McCain by a 4-1 margin. Interestingly, white women did not vote much more Democratic than white men; Virginia’s gender gap was quite narrow relative to the nation at large.

As the map above indicates, the Republicans do best in the western reaches of Virginia. Partly this is because Democratic-voting minorities – mostly blacks – generally live in the east. The quick rightward drift of Appalachian America also accounts for Republican strength, which is growing in the region.

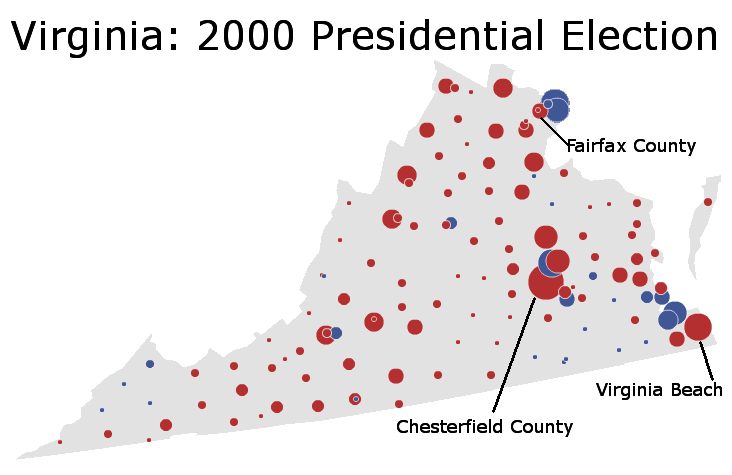
Republicans also retain strength in Virginia’s suburbs and exurbs. Specifically, suburban Richmond and Hampton Roads used to vote Republican quite strongly, ensuring Republican victories even when Democrats undercut their margins in rural Virginia. President Bill Clinton, for instance, did quite well in rural Virginia; it was his losses in these places (Chesterfield and Virginia Beach counties) that kept the state red.

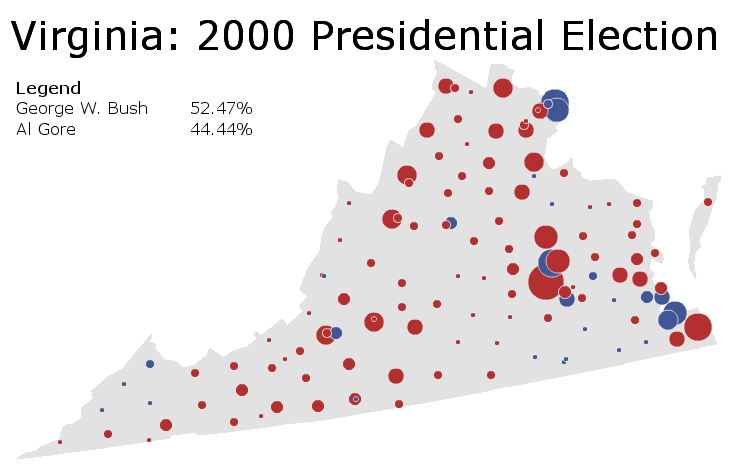
The 2000 presidential election provides an illuminating illustration of Republican Virginia at a strong point:

Analyzing Swing States: Virginia,Part 2

In that election, Vice President Al Gore lost the state by 8.04% while barely winning the nationwide popular vote. Unlike Mr. Clinton, he was crushed in both rural and suburban Virginia. The former was quickly drifting right, while the suburb’s movement left had yet to materialize.

Since that time, of course, things have changed. While Democratic candidates previously – and mostly unsuccessfully – attacked the rural component of Republican Virginia, they have since switched their focus to populous, wealthy, and diverse suburban Virginia. In particular, Democrats have been appealing quite effectively to the suburban NoVa metropolis, which never really fell in love with Republicanism.

–Inoljt, http://mypolitikal.com/