dgm’s Preliminary Senate Predictions (Five Months Out Edition :P)

Cross-posted at Politics and Other Random Topics

(Notes: My senate rankings can be found here and I recently updated my own rankings for the Senate on my website, so that's what I'm talking about with the changes to the senate rankings)

It's funny, in some ways this has been a bad few weeks for Democrats politically (Dino Rossi's entrance in Washington State against Patty Murray and the thing with Blumenthal in Connecticut) but at the same time, the Senate picture actually looks better for the Democrats.

My most recent changes are to move Connecticut back to Likely Democratic from Leans Democratic and to move Nevada from Leans Republican to Toss-up.

The Connecticut thing should be pretty obvious, the New York Times screwed up pretty bad on their several stories regarding Blumenthal (plus Linda McMahon's idiotic bragging about giving the Times the story basically killed any chance of it seriously damaging Blumenthal).

Nevada's an interesting one, because Harry Reid hasn't magically become more popular than he was, but his polling against all three challengers has definitely improved. While I had been classifying the race as Leans Republican for my purposes, I'd always believed that Harry Reid was the incumbent who was most likely to come back from the grave and win simply because his opposition is so weak and his war-chest is really nothing to sneeze at ($9 million Cash on Hand, compared to his opposition who have a combined Cash on Hand amount of about $400,000, with that coming largely from Lowden with $200,000).

Now then, with the official caveat that the election is still several months away and there are any number of things that could happen in the meantime, let me give you my first preliminary prediction for the Senate races:

Democrats take the following seats from the Republicans: Ohio, Missouri, and Florida (I think Charlie Crist wins and that he caucuses with the Democrats, thus I consider it a Democratic gain).

Republicans take the following seats from the Democrats: North Dakota, Delaware, and Arkansas.

Honestly, I think for all the hoopla about Democrats getting routed in the fall, there's a very good chance that the Democrats break even for Senate races (to get this out of the way, I believe that Democrats will hold Indiana, Colorado, and Illinois despite polling to the contrary).

The best-case scenario for the Democrats right now is probably keeping their seat losses limited to North Dakota and Delaware (some Democrats are holding out hope that New Castle County Executive Chris Coons can pull off an upset, but I doubt it) and somehow hold Arkansas (frankly, Arkansas is bordering on being a lost cause as well), and then taking Ohio, Missouri, New Hampshire, Kentucky, North Carolina (this one's definitely a sleeper for the Democrats), and maybe catch Chuck Grassley off-guard in Iowa (to be fair, this is a bit of a stretch, as Grassley, despite showing some slight weakness, is still a pretty damn popular incumbent who isn't likely to lose). This scenario gives Democrats somewhere between 61 and 63 seats with the Republicans at between 39 and 37 seats.

Conversely, the best-case scenario for the Republicans is to hold onto to their competitive open seats (Ohio, New Hampshire, Kentucky, and Missouri), protect North Carolina (which is probably going to be pretty easy if the Republicans hold all of their open seats), take all of the Democratic open seats (save for Connecticut), knock off Reid, Lincoln (or the open seat, depending on what happens in the run-off), and Bennet, and then beat Barbara Boxer in California (frankly, despite their candidate recruitment coup, I don't think the Republicans really have a prayer of defeating Patty Murray). This scenario gives the Republicans 50 seats (which basically means that Democrats will maintain control of the Senate unless Lieberman decides to screw the Democrats and switch, which I wouldn't put past him).

My current prediction might seem a bit optimistic for some, but it's still worth mentioning that even now, it's still reasonably possible that the Democrats can break even or even gain a seat or two in these senate elections.

(To reiterate, this is a preliminary prediction of the status of a series of elections that won't take place for another five months, so these predictions are very much subject to change).

By what margin will Bob Shamansky win?

View Results

Loading ... Loading ...

What if the 2003 Texas redistricting had never happened?

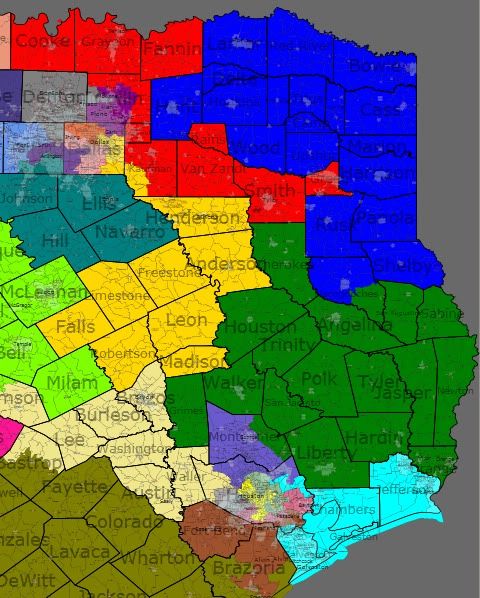
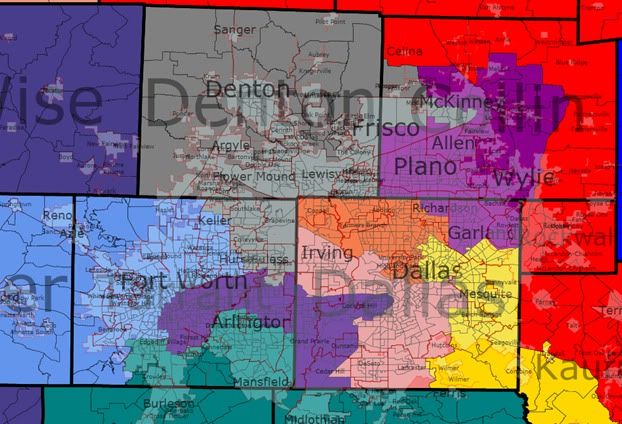
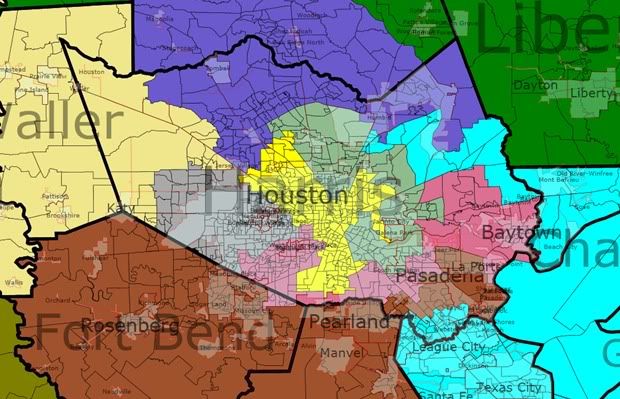
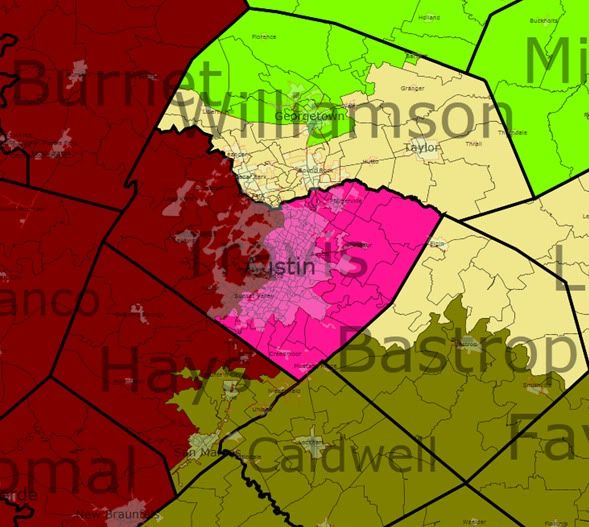
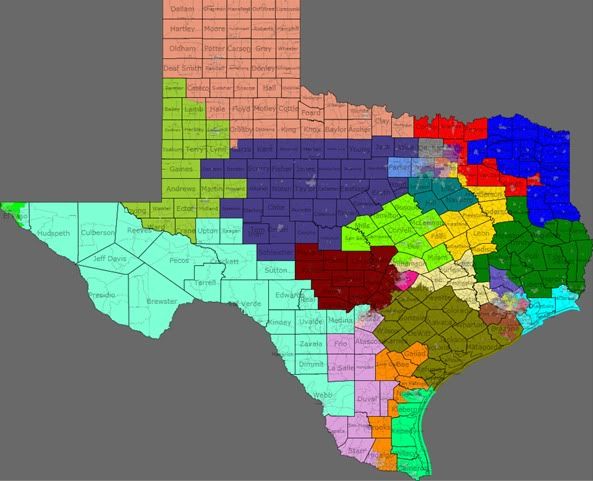
This diary takes a look at what might have happened if the 2003 Texas redistricting had never occurred. I compared the 2000 demographics and presidential results for the map used in the 2002 elections with the 2008 demographics and presidential results under the same lines. I used Dave’s App to do this, with the Test Data setting to get the political data, but the regular voting district map (without the Test Data setting) to get the correct demographic estimates. I also looked at the shifts for the districts during this time period and elaborated a bit on what might have occurred had this map remained in place for the rest of the decade. Please vote in the survey at the end as well. Thanks and enjoy!

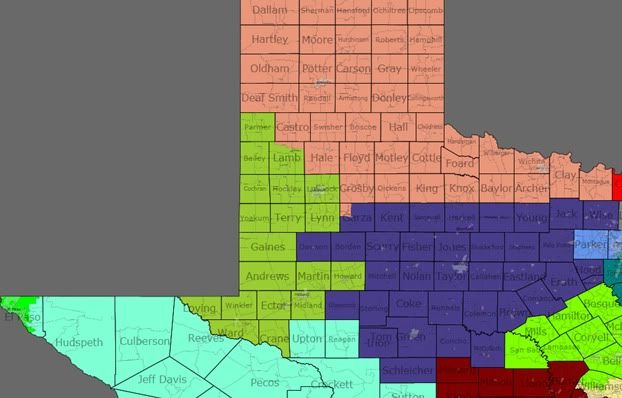
Statewide Map
Photobucket

East Texas

Photobucket

District 1 (Blue); Northeast Texas-Texarkana, Paris, Greenville, Nacogdoches, Marshall

2002 winner and winning percentage: Max Sandlin (D), 56%

% white % black % Hispanic % Asian Total district population
2000 population 75 16 7 0 651,619
2008 population (est.) 72 15 11 1 683,417
Change from 2000 to 2008 -3 -1 +4 +1 +31,798
2000 presidential results 2008 presidential results Partisan swing from 2000 to 2008
64% Bush-36% Gore 69% McCain-30% Obama +5% Republican, -6% Democratic

District 2 (Green): East Texas-Lufkin, Orange, Huntsville, Liberty

2002 winner and winning percentage: Jim Turner (D), 61%

% white % black % Hispanic % Asian Total district population
2000 population 76 14 9 0 651,619
2008 population (est.) 73 13 12 1 683,417
Change from 2000 to 2008 -3 -1 +3 +1 +37,712
2000 presidential results 2008 presidential results Partisan swing from 2000 to 2008
63% Bush-37% Gore 70% McCain-29% Obama +7% Republican, -8% Democratic

District 4 (Red): North and East Texas-Longview, Tyler, Sherman

2002 winner and winning percentage: Ralph Hall (D), 58%

% white % black % Hispanic % Asian Total district population
2000 population 77 12 9 1 651,620
2008 population (est.) 72 11 14 1 773,426
Change from 2000 to 2008 -5 -1 +5 0 +121,806
2000 presidential results 2008 presidential results Partisan swing from 2000 to 2008
70% Bush-30% Gore 70% McCain-29% Obama 0% Republican, -1% Democratic

District 9 (Light Blue): East Texas and Harris County-Beaumont, Port Arthur, Galveston, Texas City

2002 winner and winning percentage: Nick Lampson (D), 59%

% white % black % Hispanic % Asian Total district population
2000 population 60 21 14 3 651,619
2008 population (est.) 56 21 19 3 675,944
Change from 2000 to 2008 -4 0 +5 0 +24,325
2000 presidential results 2008 presidential results Partisan swing from 2000 to 2008
55% Bush-45% Gore 56% McCain-43% Obama +1% Republican, -2% Democratic

Dallas/Fort Worth Area

Photobucket

District 3 (Purple):Collin County and northern Dallas County-Richardson, Garland, Plano, McKinney

2002 winner and winning percentage: Sam Johnson (R), 74%

% white % black % Hispanic % Asian Total district population
2000 population 70 7 14 7 651,620
2008 population (est.) 61 9 18 10 898,778
Change from 2000 to 2008 -9 +2 +4 +3 +247,158
2000 presidential results 2008 presidential results Partisan swing from 2000 to 2008
72% Bush-28% Gore 60% McCain-39% Obama -12% Republican, +11% Democratic

District 5 (Yellow): Dallas County and Central/East Texas-Dallas, Mesquite, Palestine, Athens

2002 winner and winning percentage: Jeb Hensarling (R), 58%

% white % black % Hispanic % Asian Total district population
2000 population 63 16 18 2 651,620
2008 population (est.) 56 17 23 2 677,043
Change from 2000 to 2008 -7 +1 +5 0 +25,423
2000 presidential results 2008 presidential results Partisan swing from 2000 to 2008
62% Bush-38% Gore 57% McCain-42% Obama -5% Republican, +4% Democratic

District 6 (Dark Teal): Tarrant County and Dallas/Fort Worth suburbs and exurbs: Arlington, Ennis, Cleburne, Corsicana

2002 winner and winning percentage: Joe Barton (R), 70%

% white % black % Hispanic % Asian Total district population
2000 population 72 10 14 3 651,620
2008 population (est.) 67 11 18 3 748,734
Change from 2000 to 2008 -5 +1 +4 0 +97,114
2000 presidential results 2008 presidential results Partisan swing from 2000 to 2008
67% Bush-33% Gore 61% McCain-38% Obama -6% Republican, +5% Democratic

District 12 (Periwinkle): Tarrant and Parker Counties-Weatherford, Fort Worth, Keller

2002 winner and winning percentage: Kay Granger (R), 92%

% white % black % Hispanic % Asian Total district population
2000 population 71 5 20 2 651,619
2008 population (est.) 64 5 26 3 788,643
Change from 2000 to 2008 -7 0 +6 +1 +137,024
2000 presidential results 2008 presidential results Partisan swing from 2000 to 2008
67% Bush-33% Gore 65% McCain-34% Obama -2% Republican, +1% Democratic

District 24 (Dark Purple): Dallas and Tarrant Counties-Fort Worth, Arlington, Dallas, Duncanville

2002 winner and winning percentage: Martin Frost (D), 65%

% white % black % Hispanic % Asian Total district population
2000 population 35 22 38 3 651,619
2008 population (est.) 28 22 45 4 836,571
Change from 2000 to 2008 -7 0 +7 +1 +184,952
2000 presidential results 2008 presidential results Partisan swing from 2000 to 2008
46% Bush-54% Gore 36% McCain-63% Obama -10% Republican, +9% Democratic

District 26 (Dark Gray): Denton, Tarrant, and Collin Counties-Denton, Lewisville, Flower Mound, McKinney

2002 winner and winning percentage: Michael Burgess (R), 75%

% white % black % Hispanic % Asian Total district population
2000 population 78 5 11 4 651,619
2008 population (est.) 70 7 16 6 897,454
Change from 2000 to 2008 -8 +2 +5 +2 +245,835
2000 presidential results 2008 presidential results Partisan swing from 2000 to 2008
73% Bush-27% Gore 63% McCain-36% Obama -10% Republican, +9% Democratic

District 30 (Salmon): Dallas County: Dallas, Irving

2002 winner and winning percentage: Eddie Bernice Johnson (D), 74%

% white % black % Hispanic % Asian Total district population
2000 population 25 41 31 2 651,620
2008 population (est.) 19 39 39 2 726,340
Change from 2000 to 2008 -6 -2 +8 0 +74,720
2000 presidential results 2008 presidential results Partisan swing from 2000 to 2008
31% Bush-69% Gore 21% McCain-78% Obama -10% Republican, +9% Democratic

District 32 (Burnt Orange): Dallas County-Dallas, Farmer’s Branch, University/Highland Park, Irving

2002 winner and winning percentage: Pete Sessions (R), 68%

% white % black % Hispanic % Asian Total district population
2000 population 55 9 27 6 651,619
2008 population (est.) 44 9 38 7 703,588
Change from 2000 to 2008 -11 0 +11 +1 +51,969
2000 presidential results 2008 presidential results Partisan swing from 2000 to 2008
65% Bush-35% Gore 53% McCain-46% Obama -12% Republican, +13% Democratic

Houston Area

Photobucket

District 7 (Gray): Harris County-western Houston, the Villages

2002 winner and winning percentage: John Culberson (R), 89%

% white % black % Hispanic % Asian Total district population
2000 population 50 11 26 11 651,620
2008 population (est.) 43 11 32 12 746,517
Change from 2000 to 2008 -7 0 +6 +1 +94,897
2000 presidential results 2008 presidential results Partisan swing from 2000 to 2008
68% Bush-32% Gore 55% McCain-44% Obama -13% Republican, +12% Democratic

District 8 (Dark Lavender): Harris and Montgomery Counties-Jersey Village, Humble, Conroe

2002 winner and winning percentage: Kevin Brady (R), 93%

% white % black % Hispanic % Asian Total district population
2000 population 77 5 13 3 651,619
2008 population (est.) 71 6 18 4 846,293
Change from 2000 to 2008 -6 +1 +5 +1 +194,674
2000 presidential results 2008 presidential results Partisan swing from 2000 to 2008
78% Bush-22% Gore 71% McCain-28% Obama -7% Republican, +6% Democratic

District 18 (Banana Yellow): Harris County-Houston

2002 winner and winning percentage: Sheila Jackson-Lee (D), 77%

% white % black % Hispanic % Asian Total district population
2000 population 21 42 33 3 651,620
2008 population (est.) 18 41 38 3 779,948
Change from 2000 to 2008 -3 -1 +5 0 +128,328
2000 presidential results 2008 presidential results Partisan swing from 2000 to 2008
26% Bush-74% Gore 22% McCain-77% Obama -4% Republican, +3% Democratic

District 22 (Brown): Fort Bend, Brazoria, and Harris Counties-Rosenberg, Sugarland, Pearland, Pasadena

2002 winner and winning percentage: Tom DeLay (R), 63%

% white % black % Hispanic % Asian Total district population
2000 population 60 10 20 8 651,619
2008 population (est.) 52 12 23 12 866,297
Change from 2000 to 2008 -8 +2 +3 +4 +214,678
2000 presidential results 2008 presidential results Partisan swing from 2000 to 2008
68% Bush-32% Gore 59% McCain-40% Obama -9% Republican, +8% Democratic

District 25 (Dark Pink): Fort Bend and Harris Counties-Houston, Belaire, University Place, South Houston, Baytown

2002 winner and winning percentage: Chris Bell (D), 55%

% white % black % Hispanic % Asian Total district population
2000 population 37 23 34 5 651,619
2008 population (est.) 32 22 40 5 683,417
Change from 2000 to 2008 -5 -1 +6 0 +156,401
2000 presidential results 2008 presidential results Partisan swing from 2000 to 2008
48% Bush-52% Gore 41% McCain-59% Obama -7% Republican, +7% Democratic

District 29 (Grayish Green): Harris County-Houston, Jacinto City, Galena Park, South Houston

2002 winner and winning percentage: Gene Green (D), 95%

% white % black % Hispanic % Asian Total district population
2000 population 20 15 62 2 651,620
2008 population (est.) 16 13 68 2 825,305
Change from 2000 to 2008 -4 -2 +6 0 +173,685
2000 presidential results 2008 presidential results Partisan swing from 2000 to 2008
39% Bush-61% Gore 31% McCain-69% Obama -8% Republican, +8% Democratic

Central Texas

Photobucket

District 10 (Magenta): Travis County-Austin

2002 winner and winning percentage: Lloyd Doggett (D), 84%

% white % black % Hispanic % Asian Total district population
2000 population 50 11 33 4 651,619
2008 population (est.) 45 10 38 5 809,987
Change from 2000 to 2008 -5 -1 +5 +1 +158,368
2000 presidential results 2008 presidential results Partisan swing from 2000 to 2008
47% Bush-53% Gore 28% McCain-70% Obama -19% Republican, +17% Democratic

District 11 (Lime Green): Central Texas-Waco, Georgetown, Temple, Killeen

2002 winner and winning percentage: Chet Edwards (D), 52%

% white % black % Hispanic % Asian Total district population
2000 population 64 15 16 2 651,620
2008 population (est.) 61 15 20 2 742,620
Change from 2000 to 2008 -3 0 +4 0 +91,000
2000 presidential results 2008 presidential results Partisan swing from 2000 to 2008
67% Bush-33% Gore 61% McCain-38% Obama -6% Republican, +5% Democratic

District 14 (Bronze): Texas Hill Country and Texas Coastline-Victoria, San Marcos, Calhoun, Seguin

2002 winner and winning percentage: Ron Paul (R), 68%

% white % black % Hispanic % Asian Total district population
2000 population 58 8 32 1 651,620
2008 population (est.) 54 8 35 1 751,893
Change from 2000 to 2008 -4 0 +3 0 +100,273
2000 presidential results 2008 presidential results Partisan swing from 2000 to 2008
66% Bush-34% Gore 62% McCain-37% Obama -4% Republican, +3% Democratic

District 21 (Maroon): Central/West Texas-San Antonio, Austin, New Braunfels

2002 winner and winning percentage: Lamar Smith (R), 73%

% white % black % Hispanic % Asian Total district population
2000 population 77 2 17 2 651,619
2008 population (est.) 74 2 20 3 779,551
Change from 2000 to 2008 -3 0 +3 +1 +127,932
2000 presidential results 2008 presidential results Partisan swing from 2000 to 2008
73% Bush-27% Gore 62% McCain-37% Obama -11% Republican, +10% Democratic

District 31 (Beige): Central Texas and Houston suburbs/exurbs: Round Rock, Bryan, Sealy, Katy

2002 winner and winning percentage: John Carter (R), 69%

% white % black % Hispanic % Asian Total district population
2000 population 69 9 17 3 651,620
2008 population (est.) 64 9 21 4 780,639
Change from 2000 to 2008 -5 0 +4 +1 +129,019
2000 presidential results 2008 presidential results Partisan swing from 2000 to 2008
72% Bush-28% Gore 60% McCain-38% Obama -12% Republican, +10% Democratic

West Texas

Photobucket

District 13 (Tan): West Texas-Wichita Falls, Amarillo

2002 winner and winning percentage: Mac Thornberry (R), 79%

% white % black % Hispanic % Asian Total district population
2000 population 70 6 22 1 651,619
2008 population (est.) 65 6 26 1 654,677
Change from 2000 to 2008 -5 0 +4 0 +3,058
2000 presidential results 2008 presidential results Partisan swing from 2000 to 2008
75% Bush-25% Gore 76% McCain-23% Obama +1% Republican, -2% Democratic

District 16 (Bright Green): El Paso County: El Paso

2002 winner and winning percentage: Silvestre Reyes (D), unopposed

% white % black % Hispanic % Asian Total district population
2000 population 17 3 78 1 651,619
2008 population (est.) 14 3 81 1 683,417
Change from 2000 to 2008 -3 0 +3 0 +59,428
2000 presidential results 2008 presidential results Partisan swing from 2000 to 2008
41% Bush-59% Gore 33% McCain-66% Obama -8% Republican, +7% Democratic

District 17 (Iris): West Texas: Abilene, San Angelo

2002 winner and winning percentage: Charlie Stenholm (D), 51%

% white % black % Hispanic % Asian Total district population
2000 population 75 4 20 1 651,619
2008 population (est.) 71 4 23 1 683,417
Change from 2000 to 2008 -4 0 +3 0 +16,986
2000 presidential results 2008 presidential results Partisan swing from 2000 to 2008
72% Bush-28% Gore 75% McCain-24% Obama +3% Republican, -4% Democratic

District 19 (Pea Green): West Texas-Lubbock, Big Spring, Midland, Odessa

2002 winner and winning percentage: Larry Combest (R), 92%

2003 special election winner and winning percentage: Randy Neugebauer (R), 51%

% white % black % Hispanic % Asian Total district population
2000 population 58 6 34 1 651,619
2008 population (est.) 53 6 39 1 689,654
Change from 2000 to 2008 -5 0 +5 0 +38,035
2000 presidential results 2008 presidential results Partisan swing from 2000 to 2008
76% Bush-24% Gore 73% McCain-27% Obama -3% Republican, +3% Democratic

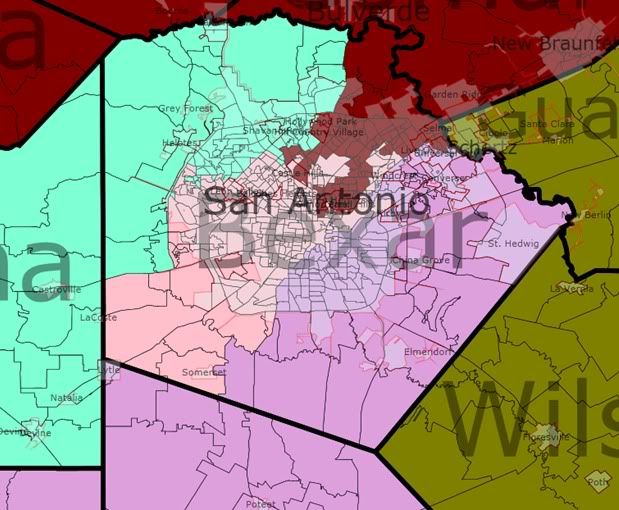
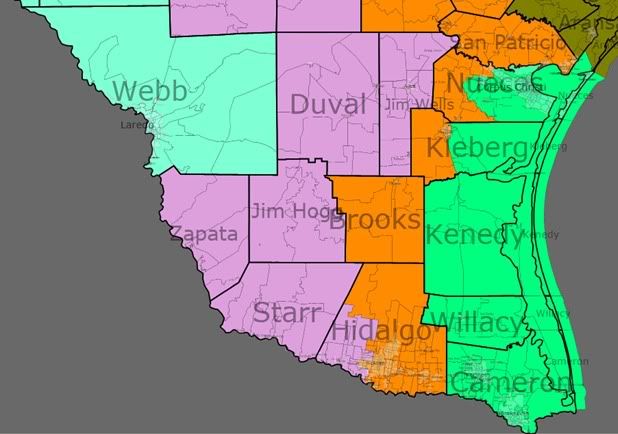
San Antonio and South Texas

Photobucket

Photobucket

District 15 (Tangerine): South Texas- McAllen, Kingsville

2002 winner and winning percentage: Ruben Hinojosa (D), unopposed

% white % black % Hispanic % Asian Total district population
2000 population 17 3 78 1 651,619
2008 population (est.) 14 3 81 1 711,047
Change from 2000 to 2008 -3 0 +3 0 +59,428
2000 presidential results 2008 presidential results Partisan swing from 2000 to 2008
41% Bush-59% Gore 33% McCain-66% Obama -8% Republican, +7% Democratic

District 20 (Light Pink): Bexar County-San Antonio

2002 winner and winning percentage: Charlie Gonzalez, unopposed

% white % black % Hispanic % Asian Total district population
2000 population 24 5 68 1 651,619
2008 population (est.) 21 5 71 2 776,861
Change from 2000 to 2008 -3 0 +3 +1 +125,242
2000 presidential results 2008 presidential results Partisan swing from 2000 to 2008
43% Bush-57% Gore 36% McCain-63% Obama -7% Republican, +6% Democratic

District 23 (Light Blue): West and South Texas: El Paso, Eagle Pass, Laredo, San Antonio

2002 winner and winning percentage: Henry Bonilla (R), 52%

% white % black % Hispanic % Asian Total district population
2000 population 30 1 67 1 651,619
2008 population (est.) 27 1 69 1 728,212
Change from 2000 to 2008 -3 0 +2 0 +76,593
2000 presidential results 2008 presidential results Partisan swing from 2000 to 2008
59% Bush-41% Gore 50% McCain-49% Obama -9% Republican, +8% Democratic

District 27 (Spring Green): South Texas-Corpus Christi, Harlingen, Brownsville

2002 winner and winning percentage: Solomon Ortiz, 61%

% white % black % Hispanic % Asian Total district population
2000 population 25 2 72 1 651,619
2008 population (est.) 21 2 75 1 717,846
Change from 2000 to 2008 -4 0 +3 0 +66,227
2000 presidential results 2008 presidential results Partisan swing from 2000 to 2008
49% Bush-51% Gore 43% McCain-56% Obama -6% Republican, +5% Democratic

District 28 (Rose): South Texas and Bexar County: San Antonio, McAllen

2002 winner and winning percentage: Ciro Rodriguez (D), 71%

% white % black % Hispanic % Asian Total district population
2000 population 21 8 70 1 651,620
2008 population (est.) 19 7 72 1 761,316
Change from 2000 to 2008 -2 -1 +2 0 +109,696
2000 presidential results 2008 presidential results Partisan swing from 2000 to 2008
41% Bush-59% Gore 36% McCain-63% Obama -5% Republican, +4% Democratic

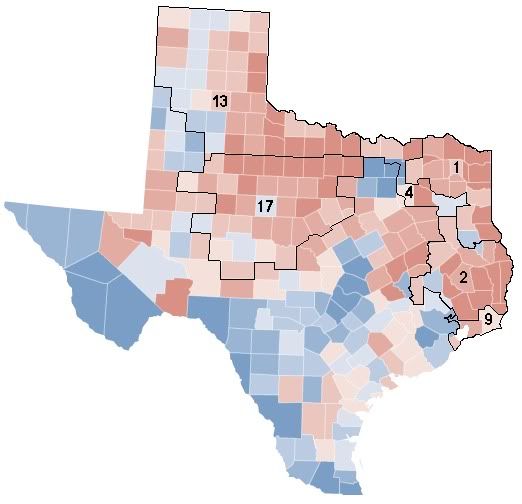
So what would have happened in the past three elections had this map stayed in place for the rest of the decade? Often people assume that the Anglo Democratic incumbents who were targeted would have been reelected had the redistricting not occurred. This is definitely true in the case of Martin Frost, Lloyd Doggett, and Chris Bell, whose already Democratic and urban districts have shifted even more to the left since 2000. But the other Anglo Democrats largely came from more rural, Republican-leaning areas, and their districts all went for Bush in 2000. This list includes Max Sandlin, Jim Turner, Ralph Hall, Nick Lampson, Chet Edwards, and Charles Stenholm. Now let’s look at a county map of Texas showing the change between 2000 and 2008, with the congressional districts where Gore outperformed Obama superimposed over the map.
Photobucket

Despite a roughly 4% move towards the Democrats statewide between 2000 and 2008, there were 6 congressional districts where Obama  actually did worse than Gore: TX-01 (Max Sandlin (D)), TX-02 (Jim Turner (D)), TX-04 (Ralph Hall (D)), TX-09 (Nick Lampson (D)), TX-13 (Mac Thornberry (R)), and TX-17 (Charlie Stenholm (D)). Besides TX-13, all of these districts elected Democrats in 2002. In addition, all of the Anglo Democrats elected in districts that Bush won in 2000 saw their districts become more Republican over time, with one exception. TX-11 in Central Texas would have become notably more Democratic during this time period, and  its representative, Chet Edwards, is the only one of these men still in office as a Democrat.

However, I am not convinced that the marked rightward shift would have occurred inevitably had the boundaries not changed in the 2003 redistricting. Many residents in these districts were trending Republican at the presidential level, but felt comfortable continuing to vote for Democrats at the congressional level. But in 2004, the redrawn districts included areas that had previously been represented by Republicans or by other targeted Democratic members, meaning the advantage of incumbency was greatly diminished. This led to the defeat, party switching, or retirement of all the legislators listed above, but I believe, also contributed to these areas becoming more Republican at the presidential level in 2004 and 2008. Without the option to vote for a familiar incumbent Democrat for Congress further down the ballot, voters felt less inclined to vote for a Democrat at any level, including President. Had the 2003 redistricting not occurred, I believe not only that several of these lawmakers might still be in office, but Obama may have even performed better in these districts in 2008.

Other than the representatives just discussed, I believe that all of the other Democratic and Republican incumbents would still be in office right now, with the possible exceptions of John Culberson (R, 7th) and Henry Bonilla (R, 23rd), whose districts would have become much more competitive by the end of the decade. But I think this analysis shows that in the long-term, Texas is turning blue, and it is only a matter of time before the shifts to the Democrats in the Houston area, the Dallas/Forth Worth Area, and Central Texas finally push Texas into the Democratic column.

By what margin will Bob Shamansky win?

View Results

Loading ... Loading ...

IA-Sen: Grassley goes up on tv

Senator Chuck Grassley’s re-election campaign unveiled its first television commercial of the year yesterday:

Rough transcript by me:

Unidentified woman: “Tightwad.”

Unidentified woman: “Penny-pincher.”

Unidentified man: “He’s frugal.”

Unidentified man: “Blunt.”

Unidentified man: “Straight-talking.”

Unidentified woman: “One of us.”

Female voice-over: Chuck Grassley visits every county every year to stay in touch. He’s a farmer and a senator. He’ll do what needs to be done. He’s just like Iowa. Chuck Grassley works … and he never forgets he works for us.

Grassley: I’m Chuck Grassley for Iowa, and I approved this message.

Once Roxanne Conlin went up on television, I figured it wouldn’t be long before Grassley’s campaign responded. He has more than $5 million in the bank and can probably afford to run television commercials from now until November.

Although this commercial doesn’t mention Grassley’s likely Democratic opponent in the general election, I infer from the language in this ad that he’ll run against Conlin as a rich, free-spending lawyer who’s not “one of us.”

This doesn’t seem like a strong commercial to me, but it shows Grassley recognizes he can’t afford to be seen as the candidate representing special interests. The female voice-over suggests to me that Grassley knows he needs to shore up support among women. The most recent Rasmussen poll showed Conlin trailing narrowly among women, and the most recent Research 2000 poll for KCCI showed Conlin slightly ahead of Grassley among women.

Grassley will be hard-pressed to defend his “penny-pincher” reputation when he has voted for every blank check for war and the Wall Street bailout. He also voted for every Bush tax cut for the wealthy, which massively increased our national debt and budget deficits. In the current fiscal year, “a staggering 52.5 percent of the benefits [from the Bush tax cuts] will go to the richest 5 percent of taxpayers. Meanwhile, Grassley voted against many policies that benefit hard-working Iowans, like the Lilly Ledbetter Fair Pay Act.

Swing State Project readers, please share your thoughts on this commercial and the campaign.

IA-Sen: Conlin (D) launches first tv ad

Roxanne Conlin, Democratic candidate for U.S. Senate, begins television advertising across Iowa this week. I’m not able to embed the commercial, but click here to watch. The Conlin campaign released this transcript:

“I’m Roxanne Conlin. Taking on the special interests has been the cause of my life. Like taking on the big banks to help family farms at risk of foreclosure. I took on corrupt politicians and corporations who violated the public trust. I’m running for U.S. Senate to take this fight to Washington. Fight for relief on Main Street, not more bailouts for Wall Street. Because the special interests have had their turn. Now, it’s our turn. I’m Roxanne Conlin and I approved this message.”

I noticed a small omission from that transcript: in the commercial, Conlin says, “As a prosecutor I took on corrupt politicians…” That’s important, because many Iowans may not remember that she served as U.S. attorney for Iowa’s southern district from 1977 to 1981.

This ad is a shorter version of the introductory video Conlin’s campaign released last fall, which I discussed here. It’s a fairly basic message for Iowans who haven’t heard of Conlin, and it makes sense for her to raise her profile just before the June 8 primary. Though this ad doesn’t mention five-term Republican incumbent Chuck Grassley, it starts building the case Conlin will make later in the campaign: Grassley has stood up for special interests throughout his career. I believe Grassley voted for the financial reform bill last week in order to undercut the narrative Conlin will build against him. You don’t normally see Grassley voting with most Democrats and a handful of New England Republicans.

Iowa’s primary election takes place on June 8. Two other Democrats are challenging Grassley: Bob Krause and Tom Fiegen. Most people expect Conlin to win the primary easily. She began the race with more name recognition and has campaigned in all 99 counties since the start of the year. Conlin has already raised more money than all of Grassley’s previous challengers combined. She out-raised Grassley in the first quarter and had about $1 million cash on hand as of March 31, while the Krause and Fiegen campaigns had less than $1,000 on hand between them.

Late last week Conlin called on Grassley to denounce Kentucky Republican Rand Paul’s comments about civil rights. Paul suggested that private businesses should be allowed to discriminate. Without mentioning Paul’s name, Grassley’s spokesperson told Iowa Independent,

Sen. Grassley’s position is that if a place is open for business it should be open for everyone.  You may know that Grassley was a co-sponsor of the 1982 and 2006 reauthorizations of the Voting Rights Act, the 1965 companion to the Civil Rights Act of 1964.  He was in the middle of the agreement reached on the 1982 legislation. Grassley also supported the 1991 extension of the Civil Rights Act.  That was the last major amendment to the Civil Rights Act.  It was broadened in 1972, after its passage in 1964.

Grassley is wise to put some distance between himself and Paul’s views. As Assistant Iowa Attorney General in the 1970s, Conlin prosecuted the first cases under our state’s civil rights law.

The Myth of Anti-Incumbent Elections Part I: 2006 elections

Cross-posted at Politics and Other Random Topics

A little while back, ThinkProgress’s Matt Yglesias made a very good point about how it’s kinda weird that the media and many others are arguing that there is some sort of broad “anti-incumbency” mood going on in the country.

Yglesias writes:


There’s something inherently odd about the concept of an anti-incumbent wave in a country wherein the overwhelming majority of incumbents are invariably elected. In the 2008, for example, 23 House incumbents were defeated in an unusually eventful election. A year in which “only” 75 percent of incumbents running for re-election were successful result in a shockingly large amount of change in the House. Indeed, I think everyone regards such a scenario as wildly unrealistic. And yet it would be hard to describe a universe in which 75 percent of incumbents are re-elected as all that gripped by anti-incumbent sentiment.

The interesting thing is that both 2006 and 2008 are largely seen as being both anti-Republican and anti-Incumbent (2008 moreso than 2006), but by absolute numbers, the number of incumbents who lost and the number of seats where the incumbent party switched are actually pretty low. A lot of people might be asking the obvious question; how can you say that 2006 and 2008 weren’t extremely anti-incumbent? After all, those two years saw the House, the Senate, and the Presidency switch from the Democrats to the Republicans. Before delving further, I’m not saying that the most recent elections weren’t extremely significant and that there wasn’t a massive change in control of government, but I am saying that this did not happen because incumbents had been thrown out left and right (especially in the House of Representatives). I’m going to work on a series which involves looking at the last two elections (both of which were Democratic wave elections) to try and give some perspective to the “anti-incumbent” myth which pervades the House of Representatives.

(I’m going to insert the charts a bit later in this post, for now, just follow the cross-posted link, that will give you the pictures)

So, how well did incumbents (and incumbent parties) fare in 2006? According to the electoral compilation site The Green Papers, in the 2006 House elections, there were 390 incumbents running in the general election. Of those 390 incumbents, 22 lost their bid for re-election, of 435 seats, 31 seats were not held by the incumbent party (1 belonging to now-Senator Bernie Sanders (I-VT)).  Roughly 94% of incumbents who were renominated by their parties ultimately went on to win the election. When including all seats, 368 incumbents won re-election to the House of Representatives out of 435, which means that the 110th congress started out being made up of 85% of members who had served in the previous congress. Looking at the seats in which the incumbent party retained control of the seat they had before the election, that number is 404 out of 435 seats, or roughly 93% of all seats (meaning only 7% of seats switched control in 2006).

If we look at it from the perspective of the two parties, there were 202 Democratic incumbents, 232 Republican incumbents, and 1 independent incumbent. Of the 202 Democratic incumbents, 186 got their party’s nomination, and all of them won re-election (or 100% of all Democratic incumbents who were re-nominated won re-election). Of the 233 seats the Democratic party won after the elections, roughly 80% of those would be held by an incumbent member. Looking at the Republicans, out of 232 incumbents, 204 of them were successfully re-nominated and of those who were re-nominated, 182 won won re-election (or roughly 89% of those running for re-election). Of the 202 seats the Republican party won after the elections, roughly 90% of them were held by were held by incumbents.

Some of you might be asking why I’m not talking about incumbents who lost their primaries? After all that might skew these numbers. The reason is pretty simple, only 2 incumbents who sought re-nomination lost their bids (Republican Joe Schwarz (MI-07) and Democrat Cynthia McKinney (GA-04). That means that over 99% of incumbents who sought re-nomination by their party were successful (all the primaries haven’t ended yet yet, but 2010 appears to be heading in that direction again).

One might argue that 2006 wasn’t really an “anti-incumbent” year so much as it was an “anti-Republican” year (not even necessarily an anti-Republican incumbent year) but even granting that, it’s still pretty telling that what many considered to be a giant wave election, when only 7% of all seats (13% of all Republican seats) changed party hands. This should give a little more insight into American elections.

Next time: the 2008 House races.

IA-03: NRCC favorite Gibbons up on tv

Jim Gibbons, a former NCAA champion wrestler and coach, included a heavy dose of wrestling imagery in his first television ad, which goes up in central Iowa today:

Here’s my rough transcript:

(visual of two young wrestlers shaking hands and practicing) Gibbons voice-over: I learned a lot on a mat like this as a wrestler and a coach. Set goals. Make a plan. Be dedicated. Work hard. Lead your team by listening.

(Gibbons steps into frame in front of wrestling mat, speaks to camera) I’m Jim Gibbons, and I used these lessons as I became a financial adviser. (shots of Gibbons advising clients) Help families save for the future, control spending and balance budgets. (Gibbons speaks to camera again) I’m running for Congress to stop wasteful spending, lower taxes and grow Iowa jobs. I’m Jim Gibbons, and I approved this message not because I can still do that (gestures toward wrestling mat), but because I’ll always fight for you.

This commercial strikes me as a lot better than Gibbons’ first web video, which gave the viewer no sense of what the candidate stands for. The production values are also better. I don’t think many financial advisers are helping their clients control spending or balance the family budget, but I get the connection he’s trying to make.

Over at The Iowa Republican, Craig Robinson (a big promoter of Gibbons’ candidacy from the beginning) sees a lot of upside for Gibbons:

Having outraised his primary opponents by a large margin over the last five months, his advantage in the race will now be more apparent to voters. The ad will also allow him to build his name ID across the district, while also defining the issues that his campaign will focus on. It is likely that Gibbons will be on TV from now through the June 8th primary.

Gibbons chief opponent, State Senator Brad Zaun, was the first candidate in the race to run a TV ad. Zaun ran a TV ad back in January, but his buy only totaled about $2,800. TheIowaRepublican.com was told that the Gibbons TV buy is more in line with what the Democratic Congressional Campaign Committee spent on ads thanking Congressman Boswell for this vote for President Obama’s healthcare plan.

Being the first candidate in the race to begin a TV campaign has a lot of advantages. Right now, the only political candidate that Gibbons is sharing the TV with is Terry Branstad. As the primary day approaches, more and more candidates will be running TV ads, which means that it will be more difficult to communicate a message due to all of the political clutter. For the 2nd and 3rd congressional candidates, it could get especially cluttered since both districts share some of the Cedar Rapids media market.

The other advantage to running ads now is a significant one. People are already casting their votes for the June 8th primary via absentee ballots and satellite voting locations. Having a positive ad up and running during this period of time may help Gibbons pick up some early votes.

From where I’m sitting, Gibbons needed to get his name out there. I’ve seen approximately 20 yard signs for Zaun for every one for Gibbons. Then again, I live not far from Zaun’s stronghold (Urbandale, a large suburb of Des Moines).

State Senator Zaun and Dave Funk (the tea party favorite) will not be able to afford nearly as much paid advertising as Gibbons. Moderate Republican Mark Rees may be up on the air soon if he hasn’t changed his plan to commit $200,000 of his own money to his campaign.

What does the SSP community think of this commercial and/or the Republican primary in Iowa’s third district (D+1)?

IA-02, IA-03: NRCC votes for Gettemy and Gibbons

The National Republican Campaign Committee announced more moves in its “Young Guns” program today. Two of the districts affected are in Iowa.

The NRCC added Rob Gettemy to its list of “on the radar” candidates. Gettemy is one of four Republicans running against Dave Loebsack in Iowa’s second Congressional district.

“The NRCC is committed to working with Rob Gettemy as he continues to meet the rigorous goals of the Young Guns program,” said NRCC Chairman Pete Sessions. “Rob is an accomplished, independent leader who will fight to create jobs and rein in government spending. I am confident that Republicans will wage a strong fight against Dave Loebsack, a loyal Democrat who has repeatedly put his partisan agenda before a healthy economy.”

They’ll have to do more than that to convince me that this D+7 district will be competitive in the fall. The real reason for putting Gettemy “on the radar” is to signal to Republican donors that he’s the guy to support in this race. It’s a slap in the face to 2008 nominee Mariannette Miller-Meeks, not to mention the other two Republicans running in IA-02 (Steve Rathje and Chris Reed). Gettemy joined the race last but has the most cash on hand thanks to a $100,000 loan he made to his own campaign.

If no candidate wins 35 percent in the June 8 primary, NRCC support could help Gettemy at the district convention that would decide the Republican nominee. Gettemy already has backing from many prominent Republicans in Linn County (Cedar Rapids and its suburbs).

In the NRCC’s three-tiered system for candidates in supposedly competitive races, the next step up from “on the radar” is “contender.” Jim Gibbons’ campaign announced today that the NRCC has elevated him to that level. Gibbons became an “on the radar” candidate in February. If Gibbons can meet certain benchmarks, the NRCC may later elevate him to the top “Young Gun” level, for candidates deemed to have the best chances of winning Democratic-held House seats.

Getting a pat on the back from the NRCC will help Gibbons raise money, particularly from out-of-district donors who don’t know the political terrain in Iowa’s third district (D+1). Gibbons outraised the other Republican candidates in IA-03 by a substantial margin in the first quarter, and being a “contender” will probably help him extend that financial advantage in the second quarter. The Gibbons campaign press release is not subtle:

By achieving ‘Contender’ status, Gibbons has already proven his ability to build a successful campaign structure and achieve vital fundraising goals.

Gibbons added, “This recognition shows that our campaign is ready to take down Leonard Boswell in the fall.  I am the only candidate in this race that has shown the financial heft and organization structure to compete and win in November.  I am running for Congress to bring Iowa values back to Congress,” said Jim Gibbons.

I have to laugh to see Gibbons bragging about support from Washington party leaders a week after he tried to attack incumbent Leonard Boswell for getting help from the head of the DCCC. From where I’m sitting, Gibbons does not look ready for prime time.

Many people on the ground in IA-03 expect State Senator Brad Zaun to win the Republican nomination. Zaun appears to have an early advantage in name recognition as well as a base in vote-rich Urbandale (a Des Moines suburb). On the other hand, Zaun has raised only a little more than $80,000 for his Congressional campaign, about $50,000 of that in the first quarter. It may not be enough for strong district-wide advertising and direct mail before the June 8 primary. A majority of Republican voters haven’t yet decided on a candidate, according to a recent poll commissioned by Zaun’s campaign.

If no candidate wins 35 percent in the primary, Zaun could be well-positioned to win the nomination at a district convention, having much more background in Republican politics. But Gibbons could point to the NRCC’s backing as an argument in his favor. Party leaders in Washington are less likely to commit resources to this district if Zaun is the candidate.

A final word on Zaun’s meager fundraising. His defenders claim that his fundraising has lagged because he was tied up in the state legislature from January through March. I’m not buying it. Zaun announced his candidacy against Boswell in early December, more than a month before the 2010 legislative session began. If Rod Roberts could raise more than $50,000 in the kickoff event for his gubernatorial campaign, Zaun should have been able to raise much more at his kickoff event in late December (before the legislative session began). Zaun is a former mayor of Urbandale, a community with much more wealth and more Republicans than the Carroll area Roberts has represented in the Iowa House. Zaun should have a large pool of major donors to tap.

Share any thoughts about Congressional races in Iowa in this thread.

IA-03, IA-02: GOP nominees could be decided at convention

Candidates for federal office may file nominating papers in Iowa from March 1 to March 19. As many as seven Republican candidates may be competing for the chance to face seven-term Representative Leonard Boswell in Iowa’s third district this year. John Deeth noticed yesterday that Scott Batcher was the first to file for the Republican nomination in IA-03. Batcher’s campaign website highlights extensive experience in business, including 15 years as a healthcare consultant. He’s been running a low-profile campaign, but collected enough signatures “at high school basketball games and coffee shops” to attempt to qualify for the ballot.

Five declared Republican candidates have filed Federal Election Commission reports on fundraising for the IA-03 race, so I assume they will follow through and qualify for the ballot: Jim Gibbons, Brad Zaun, Dave Funk, Mark Rees and Pat Bertroche. A seventh Republican, Jason Welch, was rumored to be getting into this race too, but what turns up on Google searches as Welch’s official website hasn’t been working when I’ve clicked on it.

The second Congressional district Republican primary will be nearly as crowded, with four declared candidates likely to qualify for the ballot: Rob Gettemy, Mariannette Miller-Meeks, Chris Reed and Steve Rathje. (So far only Rathje has filed nominating papers.) Gettemy just announced his candidacy this week and has ties to some heavy Republican hitters in the Cedar Rapids area.

If no candidate wins at least 35 percent of the vote in the June 8 primary, district conventions would select the Republican nominee in IA-02 and/or IA-03. In 2002, a fifth district convention selected Steve King as the Republican nominee for Congress after no one in the four-way primary cleared the 35 percent threshold.

Republican county conventions scheduled for this weekend will select delegates for the district conventions, which will be held later this spring. If no winner emerges from the June primary, the second or third district conventions would have to reconvene to select a Congressional nominee. That could happen during the state convention, to be held on June 26 in a location not yet determined. The convention usually takes place in Des Moines but has occasionally been held in Cedar Rapids. This year, Sioux City is also in the running as a venue. That would be a three to four hour drive from the counties in IA-03 and a four to seven hour drive from the counties in IA-02.

Western Iowa is the most Republican area of the state, but the bulk of the Iowa population still lives in the eastern counties. Former GOP State Central Committee member David Chung, who lives in Cedar Rapids, sounded the alarm on his Hawkeye GOP blog:

Even if hotels are short in Des Moines, holding the convention in Sioux CIty almost guarantees that a large number of delegates will need hotel rooms. I do not know whether there will be a major pre-convention event but if there is, it will be impossible for 1st and 2nd Republicans to attend without taking a whole day off from work.

Even worse, given the number of candidates for the 2nd and 3rd district congressional races there is the real possibility that the nominee will be chosen at a district convention. The state convention has been scheduled long enough after the primary to make resolving nominations at the convention possible. I cannot stress how bad a decision it would be to decide the 2nd CD race in Sioux City! The turnout from our district will be greatly suppressed if Siouxland is the choice.

Krusty Konservative also warned yesterday that many Republican delegates will not bother to attend a state convention in Sioux City.

Mariannette Miller-Meeks had a hard time uniting second district Republicans even after winning the 2008 primary. Be prepared for lasting hard feelings if a small group of party activists ends up choosing the GOP nominee in IA-02 or IA-03 this year. King wasn’t hurt by his path to the nomination in 2002, but he was fortunate to be running in heavily Republican IA-05. In contrast, Boswell’s district leans slightly Democratic (D+1) and Dave Loebsack’s district leans strongly Democratic (D+7).

P.S.- I took my kids to see a game at the Iowa girls’ state basketball tournament on Wednesday. A bunch of teams in the Des Moines metro area made the 4A quarterfinals. I noticed that NRCC “on the radar” candidate Jim Gibbons had an ad scrolling occasionally (nothing special, just “Jim Gibbons for Congress, www.gibbonsforcongress.com”). Unfortunately for him, the teams from Republican-leaning Ankeny and Johnston were eliminated in the quarter-finals, so their fans who live in IA-03 won’t be back to see more of the Gibbons ads later this week. Des Moines East advanced to the semis, but I don’t think many GOP primary voters live on the east side of Des Moines. The other teams in the semis are Linn-Mar and Cedar Rapids Kennedy (IA-02) and Waukee (IA-04). Gibbons raised more money in 2009 than the other IA-03 Republican candidates combined.

2010 House elections

After look to very much races, I will try to explain my point about 2010 elections at House level in this diary.

In few words I think they are not data what make me think democrats would lose more than 15 house seats.

Looking to the political level of incumbents and challengers, the rating of the districts, and the fundraising numbers of candidates I will make a rank of house seats, giving too the numbers of the last poll for the race if they are. This is not a rank of vulnerability, this is a rank by political level difference between the current candidates for every district looking to the political level of candidates and looking to the district too.

The rank is based in a little system of score what I create for try see better the difficult races for booth parties. Two examples of the score:

DE-AL currently a republican seat has 4.5 points of difference for the challenger party (Democratic Party). They are 3.0 points for dems by difference between political level of the candidates of booth partys, 0.5 points for dems by lead fundraising and 1.0 points for dems by the district democratic leaning.

TX-17 currently a democratic seat has 0.5 points of difference for the challenger party (Republican Party). They are 1.0 point for dems by difference between political level of the candidates of booth partys, 0.5 points for dems by lead fundraising and 2.0 points for republicans by the district republican leaning.

RANK BY POLITICAL LEVEL OF CANDIDATES FOR EVERY DISTRICT

Sure the system of score can improve still but I think give us a rank so logical.

Possitive difference for the challenger party (high weakness of the incumbent party)

4.5 points DE-AL D+07 Rep seat Last poll -10% R Research 2000 (D)

4.0 points TN-06 R+13 Dem seat

3.0 points KS-03 R+03 Dem seat

2.5 points IL-10 D+06 Rep seat

1.5 points IN-08 R+08 Dem seat

1.5 points ID-01 R+18 Dem seat

1.0 point  LA-03 R+12 Dem seat

1.0 point  NY-29 R+05 Dem seat

1.0 point  LA-02 D+25 Rep seat

0.5 points NM-02 R+06 Dem seat Last poll -02% D PPP

0.5 points IN-09 R+06 Dem seat Last poll -08% D Survey USA (R)

0.5 points ND-AL R+10 Dem seat Last poll -06% D Rasmussen Reports (R)

0.5 points SD-AL R+09 Dem seat Last poll +07% D Rasmussen Reports (R)

0.5 points TX-17 R+20 Dem seat

Tied

0.0 points AR-02 R+05 Dem seat

0.0 points NH-02 D+03 Dem seat Last poll -07% D University of NH

0.0 points PA-07 D+03 Dem seat

0.0 points MI-07 R+02 Dem seat Last poll -10% D National Research (R)

0.0 points NY-23 R+01 Dem seat Last poll +02% D 2009 special election results

0.0 points MS-01 R+14 Dem seat

0.0 points MO-04 R+14 Dem seat

0.0 points MD-01 R+13 Dem seat Last poll -13% D Tarrance Group (R)

Possitive difference for the incumbent party

0.5 points AR-01 R+08 Dem seat

0.5 points TN-08 R+06 Dem seat

0.5 points FL-25 R+05 Rep seat

0.5 points OH-18 R+07 Dem seat

0.5 points SC-05 R+07 Dem seat Last poll +07% D PPP

1.0 point  PA-11 D+04 Dem seat

1.0 point  OH-01 D+01 Dem seat Last poll -17% D SurveyUSA (R)

1.0 point  PA-08 D+02 Dem seat

1.0 point  MA-10 D+05 Dem seat Last poll -03% D McLaughlin & Associates (R)

1.0 point  VA-05 R+05 Dem seat Last poll =00% D PPP

1.0 point  AZ-05 R+05 Dem seat Last poll =00% D American Viewpoint (R)

1.0 point  AZ-08 R+04 Dem seat

1.0 point  IL-14 R+01 Dem seat

1.0 point  NY-24 R+02 Dem seat

1.0 point  PA-06 D+04 Rep seat

1.0 point  WA-08 D+03 Rep seat

1.0 point  NC-08 R+02 Dem seat Last poll +14% D PPP

1.0 point  CA-11 R+01 Dem seat

1.5 points NE-02 R+06 Rep seat

1.5 points MN-06 R+07 Rep seat Last poll +16% R PPP

1.5 points SC-02 R+09 Rep seat Last poll -01% R PPP

1.5 points AL-03 R+09 Rep seat

1.5 points CA-44 R+06 Rep seat Last poll +14% R Tulchin Research (D)

1.5 points NH-01 EVEN Dem seat Last poll -10% D University of NH

1.5 points NY-01 EVEN Dem seat Last poll +02% D Survey USA (R)

1.5 points CA-03 R+06 Rep seat

1.5 points KY-06 R+09 Dem seat

1.5 points CO-04 R+06 Dem seat

1.5 points AL-02 R+16 Dem seat Last poll +24% D Anzalone-Liszt Research (D)

1.5 points MS-04 R+20 Dem seat


2.5 points FL-12 R+06 Rep seat Last poll -04% R Greenberg Quinlan Rosner Research (D)

In the first two groups I bold emphasize the results of polls what favore incumbent party. In the third group I bold emphasize the results of polls what favore challenger party.

These groups of house races include all negative polls for incumbent party.

The first and second groups include difficult races for the incumbent party, with majoritary bad polls for the incumbent party, but not all. Between the first places, they are three republican seats where democrats are favored this year.

The number of seats in this two groups give a difference of +15 seats for republicans. But not all polls are negative for the incumbents in these groups, and not all the seats in these groups will change of party in 2010 elections.

The third group lean clearly toward the incumbent parties and is a group much more balanced with seats of booth parties. They are some unfavorable polls for booth parties, 3 for democrats and 2 for republicans. I think this group of races will give to republicans low number of net gains if the numbers change not to worse.

The polls will be surely the best information for every district, but this rank show us a so low number of districts without poll in the risk zone. This is important now for try stablish limits to loses and for see where is needed more work.

For all that, and looking specially to the polls, I think we have not evidence still of democrats will lose more than 15 seats.

About the seats where GOP is the incumbent party, like I tell before, they are three seats where democrats are favored (all in the first group of races), and they are some others what democrats can make vulnerable. Some days before, in my comments, I give a list of seven seats, but today will be six because I think the chance of win AZ-03 low without P Gordon. This is the list:

1.0 FL-25 (with J Garcia in)

1.0 PA-06

1.0 WA-08

1.5 SC-02

2.0 PA-15 (if J Callahan improves fundraising)

2.5 FL-12 (if L Edwards improves fundraising)

I think FL-25 (the effect of J Garcia running is not included in the rank still) and FL-12 are seats what give so good chance for fight strong. With the lead in  fundraise for democratic side, FL-12 district would low until 0.5 points for the incumbent party (republican party). In very few districts democrats can improve more with lower effort. For PA-15 I think J Callaham needs too take the lead fundraising, and with that, PA-15 race would be in the same level than PA-06 or WA-08 (1.0 points for the incumbent party).

They are more districts in lower level of risk for republicans. I would not forget this district and the other districts with 1.5 points where so unpopular republicans can fail.

PD: Just today one good level republican announce a bid for MI-03 and that makes I update my comments about this race. With higher level republicans, lower chance for democrats in republican open seats.

By what margin will Bob Shamansky win?

View Results

Loading ... Loading ...

IA-Gov, IA-Sen: New Research 2000 Iowa poll

Research 2000 conducted an Iowa poll of 600 “likely voters who vote regularly in state elections” for KCCI-TV, the CBS affiliate in Des Moines. The poll was in the field from February 15 to 17, and KCCI published the results on its website yesterday.

It’s not a good poll for Governor Chet Culver, but it’s less bad than the Des Moines Register’s latest Iowa poll. Chuck Grassley has a comfortable lead in the Senate race, but not the kind of margin he has enjoyed against previous Democratic opponents.  

First, a few words about the sample for the Research 2000 poll, which contained 33 percent Democrats, 29 percent Republicans, and 38 percent independents. That seems like a reasonable reflection of the current Iowa universe of registered voters.

However, the actual Iowa electorate for the 2006 general election (pdf file available here) contained about 37 percent Democrats, 37 percent Republicans, and 26 percent independents. Of course there’s no guarantee that the 2010 electorate will look the same as the 2006 electorate, but I doubt no-party voters will outnumber partisans in an off-year election. The poll could be off by more than the 4 percent margin of error if the sample is skewed.

Research 2000 found just 42 percent of respondents approved of Chet Culver’s performance as governor, while 51 percent disapproved. It’s never good to be “upside down” on job approval. Culver’s favorability numbers were a little better: 44 percent favorable, 43 percent unfavorable.

Terry Branstad led Culver 54 percent to 38 percent, with only 8 percent of respondents undecided. That’s not good, but it’s not as bad as the 20-point lead Branstad had in the Des Moines Register poll. Branstad led Culver 89 percent to 5 percent among Republicans and 60 percent to 32 percent among independents. Culver led 74 percent to 17 percent among Democrats.

If this poll assumed too high a proportion of independents in the general electorate, then Branstad’s lead over Culver may be smaller than this poll would indicate. But Culver needs to bring up his numbers and bring down Branstad’s favorability. Research 2000 found that 61 percent of respondents had a favorable impression of Branstad and just 24 percent unfavorable. The Republican primary campaign may bring Branstad down to earth a little, but Iowa Democrats have their work cut out for them. Branstad even led Culver among women in this survey.

Culver led all other Republicans in the Research 2000 poll but didn’t break 50 percent against any of them. He led Bob Vander Plaats by 41 to 38. In that matchup, independents were evenly divided, but I think Culver would end up doing better among independents if Vander Plaats pulled off an upset in the primary. Culver led State Representative Rod Roberts by 48 percent to 26 percent, and State Representative Chris Rants (who quit the race yesterday) by 44 percent to 33 percent.

Unfortunately, this poll didn’t test the Republican primary. What’s it gonna take to get us a public poll on Branstad against Vander Plaats? Maybe the Des Moines Register will publish numbers on that this weekend.

Now on to the U.S. Senate race. The Research 2000 poll for KCCI only tested Roxanne Conlin against five-term incumbent Grassley. (I think they should have run the numbers for all the Democratic candidates, especially since they polled Rants and Roberts in the governor’s race.)

Grassley’s favorable/unfavorable numbers were 59/35, and Conlin’s were 41/36, with 23 percent having no opinion of her. Unfortunately, they didn’t ask about Grassley’s job approval numbers. For Culver and President Barack Obama, favorability numbers were better than job approval. (Obama was at 52 favorable/41 unfavorable in this poll, but his job approval/disapproval numbers were 49/46.) For many years Grassley had approval ratings in the high 60s and low 70s, but if his favorability is only 59 percent now, his approval is probably a bit lower than that.

Research 2000 found Grassley leading Conlin by 56 to 35 percent. He had a much larger lead among men (62-30) than among women (50-40). Right now Grassley appears to be outside the danger zone, but I doubt he will be re-elected with anything like the 66 percent to 70 percent numbers he’s had in the past. If the Democratic nominee can hold him below 60 percent, or better yet below 55 percent, that would help our down-ticket Democratic candidates.

Share any thoughts about the Iowa gubernatorial or Senate races in this thread.