AR-01: Meet David Cook

For the longest time, I thought I wasn’t going to have anyone in the Dem primary for my district that I could vote for without holding my nose.  Almost all (and yes, this post is about the one exception) of the Democratic candidates, without failing, have come out against health care reform, EFCA, so on and so forth.  The presumed front runner is the worse, going above on beyond even being a conservative Democrat, sitting on the board of a hate group and introducing a bill to bring back public hangings in the legislature:

http://www.dailykos.com/story/…

Now this is a district where a bit of conservatism (social conservatism-it has a New Deal style populism) is necessary.  For example, no candidate is going to get anywhere saying anything bad about guns.  But these goons are going overboard, big time.

But there’s one candidate in the race that’s talking like a Democrat, acting like a Democrat, and is not ashamed to say that he is, in fact, a Democrat.  And if the only poll is to be believed, it’s helping him pick up substantial support.

Meet state representative David Cook.

I interviewed Representative Cook for Blue Arkansas, and walked away impressed.  He’s not the most polished or charismatic candidate, and he’s not what a lot of you guys would consider liberal.  But by Arkansas standards, he’s really good.  Go ahead, watch for yourself:

http://bluearkansasblog.com/?p…

David Cook is the only candidate in this race who said he would have voted for health care reform.  He stood up for EFCA at the second debate, the only candidate to say he’d support it, and people sat up and took notice when he started talking (surprisingly poetically) about all the things that unions and working people have done for this country.   You could tell by the reactions, the way he did it A) resonated with the audience, and B) set him apart from the other candidates who are all trying to mimic each other.  What’s more, he’s leading on the issue of taxing excessive bonuses of the bailout firms, and while he is socially conservative enough not to drive away voters in this district (he’s very pro-gun, which is a must here, and his abortion record is largely conservative as well) he did answer my questions on ENDA and DADT in ways that satisfied this gay man.  In other words, he’s conservative enough to be a good fit for this district, but he has a populist streak that makes him a very appealing option.

What’s more, Cook is running a great grassroots campaign, and I really am impressed by how much harder he’s working than everyone in the district.  I’ve had a chance to take a good look at everyone’s operation here, and his is better even than the candidates that have bigger wallets.  Arkansas, especially this part of Arkansas, is one of those increasingly rare anachronisms in this country where retail politics matters more that big advertising campaigns, and if the only poll taken so far is any indication, Cook’s approach has landed him in second place (with lots of undecideds to reach):

http://bluearkansasblog.com/?p…

I could go on and on about Representative Cook, but I’ll let him speak for himself.  This is the message he relayed to Blue Arkansas after we endorsed him:

http://bluearkansasblog.com/?p…

Read for yourself, and tell me this guy doesn’t have a great story to tell the voters of the 1st district.


   From the Office of David Cook for Congress

   I would like to take this opportunity to thank Blue Arkansas for their hard work and their dedication to Democrats everywhere. While we won’t see eye to eye on every issue, I have found that the staff here are fair and more than willing to give credit where credit is due, even if they don’t completely agree with the person. For these reasons, and many others, I am proud to have the official endorsement of Blue Arkansas.

   I want to specifically address something Blue Arkansas mentioned in their endorsement. They said it was my substance that made me different. I want to let you, the readers, know exactly what they meant by that. It isn’t my 5 years in the Navy. It isn’t my 6 years in the Legislature. It isn’t even my 32 years in education or my 3 college degrees. I am proud of all these things, but they aren’t what separate me from the other candidates. You know how, as parents, you read to your children? As a child, I read to my parents. I was born on the banks of the St. Francis River by midwife. Both of my parents were illiterate as neither had attended a day of school in their lives. My mother believed in America, she believed in Arkansas, and she believed that with a good education, a little luck, a little help and a whole lot of hard work that her children could have a better life than her. She made sure that her children went to school… but that wasn’t enough. We were dirt poor. From before I can remember, I went to school then came home and picked or chopped cotton till after dark. When I was 12 I got promoted to plowing behind a mule which was great because it meant I got a nickel raise. I worked hard to help support my family. I’ve put in spill-ways on rice levies with a shovel and a role of tar paper on my back. I’ve had to count the strips of bacon on my plate to make sure there was going to be enough food for the whole family to eat for the rest of the month.

   I know what it’s like to be hungry. I know what it’s like to be poor. I know what it’s like to be sick and have no money for health care or medicine. And I understand that there are a lot of hard-working, good Arkansans that aren’t looking for a hand-out… No, they just need a hand-up so they can work their way to a better life for themselves and their children. I know that without the hand-ups I received in my life, I might still be making my bed on that old river bottom today. For me a hand-up was my high school coach helping me out with food money or clothes and letting me work it off on his farm, or my high school sweetheart’s family finding the money to buy me another pair of shoes when my only pair was stolen out of a gym locker at college.

   These are more than just stories of my life. They have defined my life. These are WHY I spent 32 years as an educator. It’s WHY I went on to work as a Legislator. It’s WHY I voted to increase minimum wage, to reduce the grocery tax twice and to reduce health care cost for seniors. It’s WHY I worked so very hard to improve the educational environment for students and staff. And it’s WHY, when you send me to Congress, you can rest easy knowing that a man is there who gets it. You’ll know a real Arkansan with real Arkansas values is fighting like a scrappy dog to do everything he can to give you the hand-up you need for a better life.

This is a guy who could be a good Democrat in Congress.  This is a guy who can win in this district.  And unless you want to be complaining about a “Democrat” in Congress who sits on the board of a hate group, supported both Bush and Huckabee, and is still trying to explain why he wanted to bring back public hangings, you have every reason to throw ten or twenty dollars his way on ActBlue: http://www.actblue.com/entity/…

(Full disclosure: I don’t work for the Cook campaign and neither does anyone that works with me at Blue Arkansas.  We are activists and supporters, and except for volunteering our time we don’t have any role in the campaign whatsoever.)

Assessing the National Mood: A Special Election in Florida and its Implications

By: Inoljt, http://mypolitikal.com/

Believe it or not, Tuesday was election night. Several million Americans voted (or more accurately, did not vote) in mostly local races.

These results provide a helpful snapshot of the national mood. Polls may be inaccurate, or – more commonly – different pollsters may have different pictures of the public mood. Unlike polls, elections have that useful tendency of never being wrong.

Special elections for congressional districts are especially convenient, because there is already a wealth of accumulated data about them. Moreover, because name recognition of both candidates is generally very low, they come as close as one can get to “generic Democrat versus generic Republican.”

Quite happily, a special election occurred on Tuesday in one such congressional district. Specifically, voters in Florida’s 19th congressional district went about replacing retired House Representative Robert Wexler. Here are the results:

Photobucket

More below.

Of course Democrats do not and have – almost – never have enjoyed a majority anything close to that pictured here. These results must be placed in the context of the congressional district’s political lean. If, for instance, FL-19 constituted a Democratic stronghold, this result would be fairly unremarkable. It might even be quite worrisome for Democrats, depending on the district’s Democratic lean (there are some very, very, very Democratic congressional districts out there). On the other hand, if FL-19 usually voted Republican, Democrats would have some reason to celebrate a victory of this magnitude.

As it turns out, FL-19 constitutes a reliable Democratic stronghold. Located in the Miami metropolis, elderly and Jewish voters compose much of the district’s population. The latter accounts for Democratic strength, making Florida’s 19th 15% more Democratic than the nation as a whole.

With this in mind, last night’s election results do not look so impressive for Democrats. In fact, it appears that the party underperformed relative to the district’s lean.

But this is not news at all – in recent months the public mood has shifted quite strongly against the Democratic Party. Almost the entire Beltway agrees that Democrats will lose seats in November’s midterm elections; the only question is the degree of their loss. Republicans are hoping for a repeat 1994-type landslide; Democrats would be happy to retain control of the House.

Due to the unfavorable public mood, Democrats have had a terrible batting average in the most recent special elections; they most famously lost the state of Massachusetts to an unknown Republican State Senator:

Photobucket

In this context, Florida’s result looks positively respectable. The Democratic Party can take heart in the relatively small drop-off since 2008 – especially compared to their previous performances. Given that President Barack Obama won the election by more than 4.65%, it even suggests that Democrats hold a slight lead on the national level.

Indeed, in recent weeks Democratic fortunes have been on the rise. The passage of health care, alongside a slowly but surely improving economy, has led to an ever-so-slight uptick in their polling. Florida’s result substantiates these polls.

Finally, the very nature of FL-19 can lead Democrats to be optimistic. Mr. Obama’s strongest supporters, young and minority voters, are not present in large numbers in FL-19. Instead, this district – whiter and much more elderly than the nation at large – is composed of the very groups which have been moving away from the Democratic Party. Although it still votes strongly Democratic, Fl-19 is not as blue as it once was:

Photobucket

That Democrats performed as well as they did in a district such as this provides further reason for Democratic optimism. Elderly and white voters have not all abandoned the party; it still can do well with constituencies outside the Obama coalition.

The national mood is still fairly unfavorable towards the Democratic Party; certainly the public is more antagonistic than it was when electing Mr. Obama. If an election were held today, there is a good chance Republicans would end up controlling at least one chamber of Congress. But perhaps, if these results are to be believed, the Democrats are climbing out of the hole the recession has dug for them.

Analyzing Swing States: Virginia, Part 5

This is the fifth part of a series of posts analyzing the swing state Virginia. It focuses on the traditional Democratic base and its decline. The last part can be found here.

In the days of the Solid South, Democrats worried more about primary elections than Republican challengers. The party, under the sway of the Byrd machine, dominated almost every part of the state – as it did throughout the South.

Civil rights and suburban growth broke the back of this coalition. In 1952 Virginia voted for Republican candidate Dwight Eisenhower. By the 1970s Virginia had elected its first Republican governor, senator, and attorney general in nearly a century.

Democrats were left with strength in two reliable regions – the southeast and the western panhandle. These places constituted the traditional Democratic base, which Democrats relied on for a number of decades.

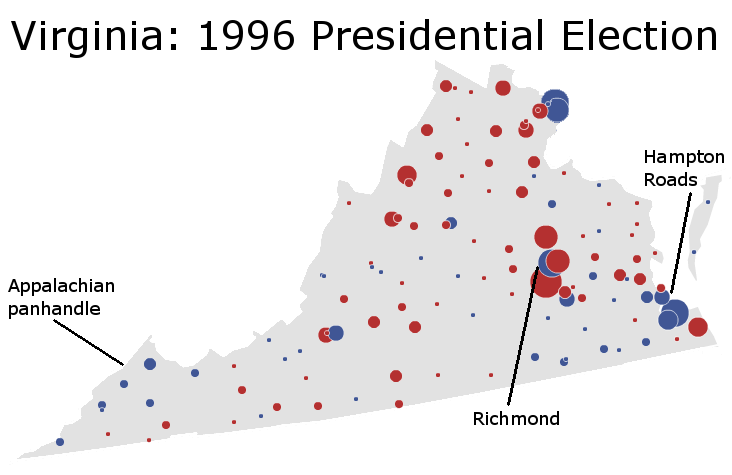
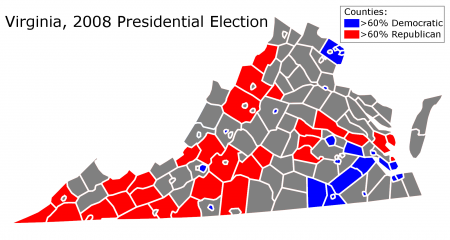
The 1996 presidential election provides an excellent illustration of this base:

Analyzing Swing States: Virginia,Part 5

More below.

With his rare ability to command support among both poor Appalachian whites and poor Southern blacks, Mr. Clinton performed powerfully with the traditional Democratic coalition. As the map indicates, the incumbent president dominated the southeast, while winning a number of counties in the panhandle. It is an illustration of the traditional base at a strong point.

Clinton also lost Virginia by two percentage points. This indicates something else: it is actually very difficult to win the state with the traditional Democratic base. There are just not enough Appalachian whites and blacks (20% of the population) in Virginia. Take mostly black, heavily Democratic  Richmond. In 2008 a little more than 90,000 votes were cast in the city. A respectable number – but barely more than half the 162,088 votes cast in  neighboring, suburban Chesterfield County.

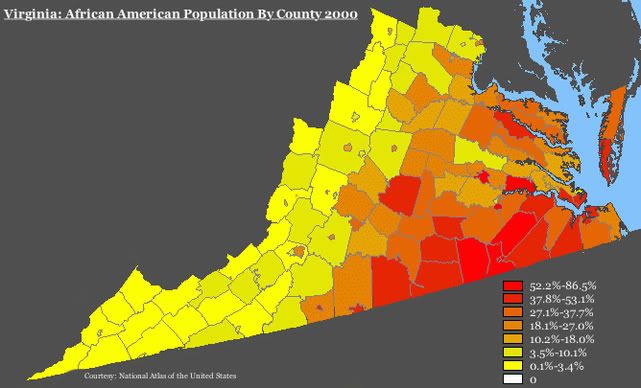
Richmond also constitutes an important part of the Virginia’s Democratic-voting southeast – the first prong of the classical Democratic coalition. Democratic strength in this region can be explained through demographics; the region is home to much of the state’s black population:

Analyzing Swing States: Virginia,Part 5

Black voters, grateful for its passage of Civil Rights, remain a vital constituency of the Democratic coalition. They constitute a  stable block of voters  for a Democratic candidate to build upon.

Geographically, Democrats usually win a few rural, majority-black counties in the southeast. In addition, black votes give Democrats sizable margins coming out of Richmond and four Hampton Roads cities – Norfolk (the largest), Portsmouth, Hampton, and Newport News. In 2008 Senator Barack Obama’s vote ranged from 64% (Newport News) to 79% (Richmond) in each of these cities.

Unfortunately for Democrats, the second prong of their traditional base – the Appalachian panhandle – is quickly moving away from them. This area is fairly rural and somewhat poor; as the map above indicates, its population is fairly homogeneously white. Until recently, Democrats could rely on panhandle votes even in the event of a double-digit loss. Its residents voted Democratic based off a combination of economic interests and tradition.

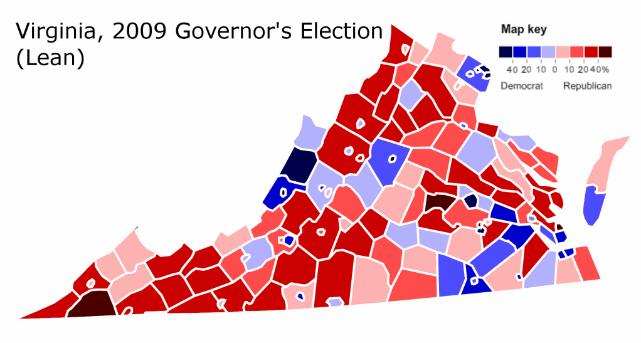
As the party becomes more metropolitan-based and liberal, however, the panhandle has been drifting away. The election of President Barack Obama, an ill-fit with Appalachian America, has accelerated the rightward movement. In 2009, Democratic candidate Creigh Deeds lost the panhandle by a landslide.

Analyzing Swing States: Virginia,Part 5

Even in the days in which the panhandle voted loyally Democratic, the base – as has been noted before – was insufficient for statewide victory. Democrats needed to add another prong to their coalition. Mr. Clinton attempted to do so by reviving support amongst the rural whites who’d long ago abandoned the Democratic Party; he mostly failed in his endeavor. In 1976, President Jimmy Carter did much better with rural whites but much worse with their suburban counterparts; Mr. Carter also barely lost Virginia.

Statewide Democratic candidates, on the other hand, have been able to win the state through a combination of the traditional base and a respectable suburban showing. Indeed, no Democratic presidential, senatorial, or gubernatorial candidate has won Virginia, for at least two decades, while losing suburban Fairfax County.

In recent years Democrats have traded the Appalachian panhandle for these NoVa suburbs. This switch has, in the aggregate, been to their benefit. The old Democratic base was rarely enough to win Virginia. With the addition of NoVa, Democrats have won three out of four past statewide elections. Virginia has moved from a red state to a purple one.

–Inoljt, http://mypolitikal.com/

Maps of Pennsylvania Elections

By: Inoljt, http://mypolitikal.com/

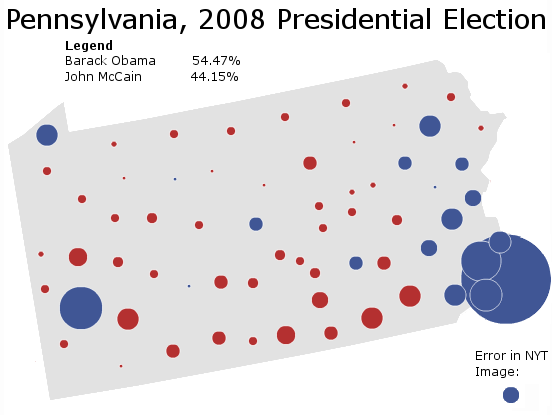
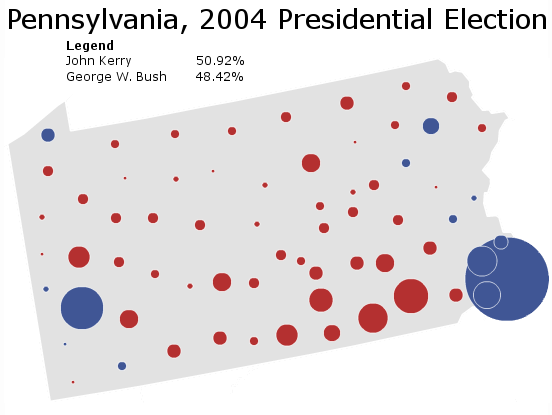
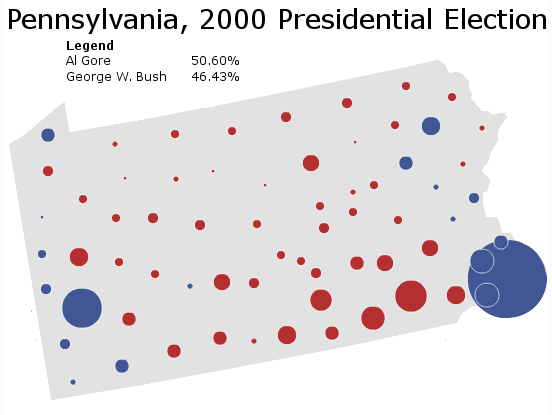
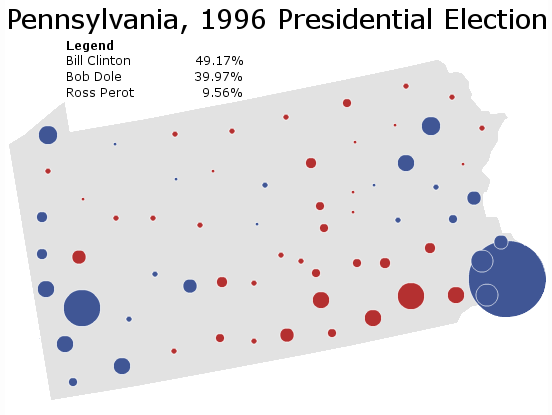
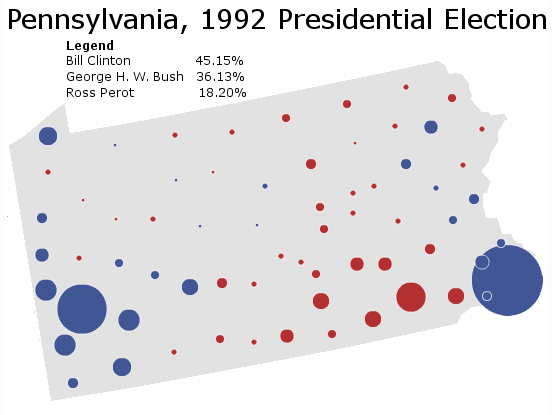
A few maps of Pennsylvania’s presidential elections are posted below, for your enjoyment. Each map comes with some brief analysis. Note how in each succeeding election, Democratic margins in the Philadelphia metropolis increase, while their margins in the Pittsburgh corridor decrease.

(Note: Because the Times stopped updating before all absentee/provisional ballots were counted, this map does not fully reflect the actual results. I have corrected the discrepancy.)

Maps of Pennsylvania Elections

As the national tide increasingly turns in Senator Barack Obama’s favor, Senator John McCain mounts a quixotic attempt to win Pennsylvania. While Mr. McCain improves in the southeastern rustbelt, Democratic dominance in eastern Pennsylvania ensures a double-digit blue margin.

More below.

Maps of Pennsylvania Elections

President George W. Bush mounts a determined attack on Pennsylvania, coming within 2.5% of Senator John Kerry. Mr. Bush does quite well in the traditionally Democratic Pittsburgh corridor and Republican strongholds throughout the “T.” But double-digit losses in Philadelphia’s suburbs (and a 400,000 vote deficit coming out of the city itself) prevent Mr. Bush from victory.

______________________________________________________

Maps of Pennsylvania Elections

Without President Bubba holding the line, Republican margins in Pennsyltucky are much higher. Nevertheless, Al Gore closely carries Pennsylvania based on Democratic strongholds in the Philadelphia and Pittsburgh metropolises.

_____________________________________________________

Maps of Pennsylvania Elections

With incumbent Bill Clinton poised to win comfortably weeks before election day, Senator Bob Dole does not seriously contest Pennsylvania. Democrats improve in the east and weaken in the west, while Mr. Clinton sails to a comfortable victory.

______________________________________________________

Maps of Pennsylvania Elections

Governor Bill Clinton romps to a nine-point margin, following three straight Republican victories in the state. Mr. Clinton milks Democratic strength in the industrial southwest for everything it’s worth, winning 2-1 margins in a number of counties. More ominously for Republicans, President George H. W. Bush barely loses the Philadelphia suburbs – the first Republican to do so since Senator Barry Goldwater (and before him President William Taft, in 1912).

(Note: Credit goes to the NYT for these amazing images.)

Analyzing Swing States: Virginia, Part 4

This is the fourth part of a series of posts analyzing the swing state Virginia. It is the second section of two focusing on Northern Virginia, and focuses on analyzing the structural foundation behind NoVa’s Democratic shift. The fifth part can be found here.

Analyzing Swing States: Virginia,Part 4

Demographics

In many ways, Northern Virginia represents the best America has to offer. As wealthy, diverse, and rapidly growing suburb, it offers the very essence of the American Dream.

More below.

Demographically, Northern Virginia is one of those rare places whose racial composition is representative of America as a whole. In Fairfax County today blacks constitute 9.4% of the population, Hispanics 13.5% (nationally the numbers are 12.3% and 15.1%, respectively). Asians come in at 15.8%, a higher number than the national average.

As has been much noted, Northern Virginia is getting more diverse. In Fairfax County, for instance, the numbers of blacks, Hispanics, and Asians have all increased since the 2000 census – which counted blacks as 8.6%, Hispanics as 11.0%, and Asians as 13.0% of the population.

These changes are especially striking in exurban NoVa. Loudoun County, 2000 was 5.9% Asian and 5.3% Hispanic. Since then those numbers have more than doubled; from 2006-2008, the census estimated Loudoun as 12.3% Asian and 10.1% Hispanic (blacks constituted 7.8% of the county’s population).

Finally, Northern Virginia is very, very, very rich. The median household income in both Fairfax and Loudoun exceeds $100,000; a 2008 census study estimated them as the two wealthiest counties in America (see page 13). More than one-third of individuals over 25 in Arlington County hold graduate degrees, compared with less than 10% of Americans at large. Life expectancy is the highest in the nation.

The Future

Although Northern Virginia continues become more diverse, it is unclear how much more Democratic it can get. Suburbs rarely give a party more than 60% of the vote, and 65% seems to be the upper limit for Democrats. Given that President Barack Obama won 60.12% in Fairfax County, Democrats appear to be near this line.

Analyzing Swing States: Virginia,Part 4

On the other hand, the suburban metropolis that does break this rule (the Bay Area) has a lot in common with Northern Virginia. Like NoVa, the Bay Area is rich, diverse, and growing. But the Bay is also composed of a majority of minorities; this will not happen anytime soon in Northern Virginia.

Moreover, Virginia is missing the one piece that would truly make it a Democratic stronghold. Democratic suburbs like NoVa often surround poor, astonishingly Democratic cities. The good news is that NoVa does surround such a city – and that city gave Democrats 92.46% of its vote in 2008. The bad news is that the city’s name is Washington D.C.

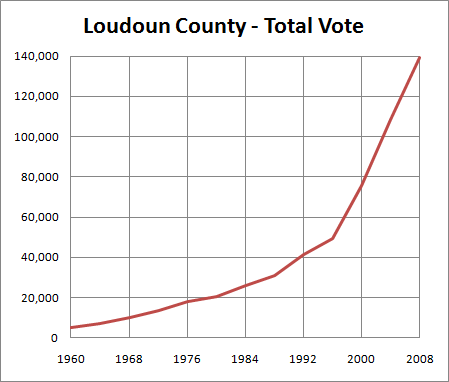
All this may not matter, however, if Northern Virginia continues its rapid growth. Today the exurbs in Loudoun and Prince Williams are the main sites of development, while Fairfax County’s growth appears to have slowed down. This translates into many more voters:

Analyzing Swing States: Virginia,Part 4

As Loudoun and Prince Williams become more diverse, moreover, they are been voting ever more Democratic. In 2000 Loudoun voted Republican by a 8.25% margin; in 2008 it voted Democratic by a 15.22% margin.

If Northern Virginia continues growing at this rate – and voting Democratic by a 3-2 margin – Virginia may eventually change into a Democratic-leaning state. This will probably be balanced out as other Democratic states naturally turn Republican-leaning. Nevertheless, adding NoVa to the old Democratic base leaves the Democratic Party in strong shape. That traditional base will be the subject of the next post.

Analyzing Swing States: Virginia, Part 3

This is the third part of a series of posts analyzing the swing state Virginia. It is the first section of two focusing on Northern Virginia. The fourth part can be found here.


NoVa

A vast and growing suburban metropolis, Northern Virginia has become increasingly important in Virginia politics. There, demographic changes have imperiled Republican dominance of Virginia.

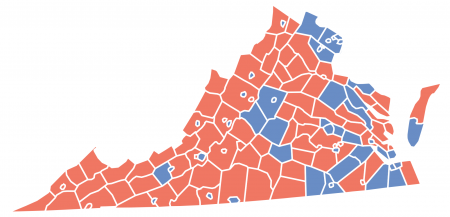
To illustrate the exceptional nature of this movement, compare the two elections below. Here is 2000:

Photobucket

Eight years later, Northern Virginia has transformed:

Photobucket

More below.

In 2000, Governor George W. Bush had won Virginia by a comfortable 8.1% margin, carving out the traditional Republican coalition of rural and suburban Virginia. As this picture indicates, Virginia Democrats in 2000 really don’t have a base of support, except perhaps the heavily black southeast parts of the state. By 2008 Senator Barack Obama won the state by an equally comfortable 6.30% – a 14.3% shift in support.

Before digging into the dynamics of modern NoVa, it is worth exploring its past behavior to gain a sense of context.

A History

Northern Virginia was not always as populous as it is today; well into the twentieth century, it remained a rural (and heavily Democratic) backwater. In the 1940 presidential election, for instance, less than 10,000 people voted in Arlington County.

Growth began in the 1940s, however, driven by an ever-expanding federal government. The inner-ring suburbs in Arlington started expanding first, followed by Fairfax County in the 1950s. Like many other white and wealthy suburbs, Northern Virginia leaned Republican during this era.

Photobucket

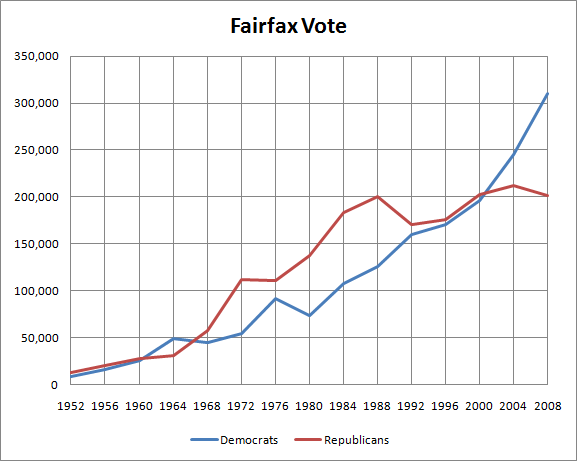
Unlike some suburbs, however, Northern Virginia never fell in love with Republicanism. In Fairfax County, Republican presidential candidates only once took more than 65% of the vote (in 1972) – something which would regularly happen in a place like Chesterfield County, a suburb of Richmond.

Change first began in the 1980s, when inner-ring suburbs such as Arlington started voting Democratic. In the 2000 map, one sees Arlington County as the lonely blue bubble to the right of Fairfax County.

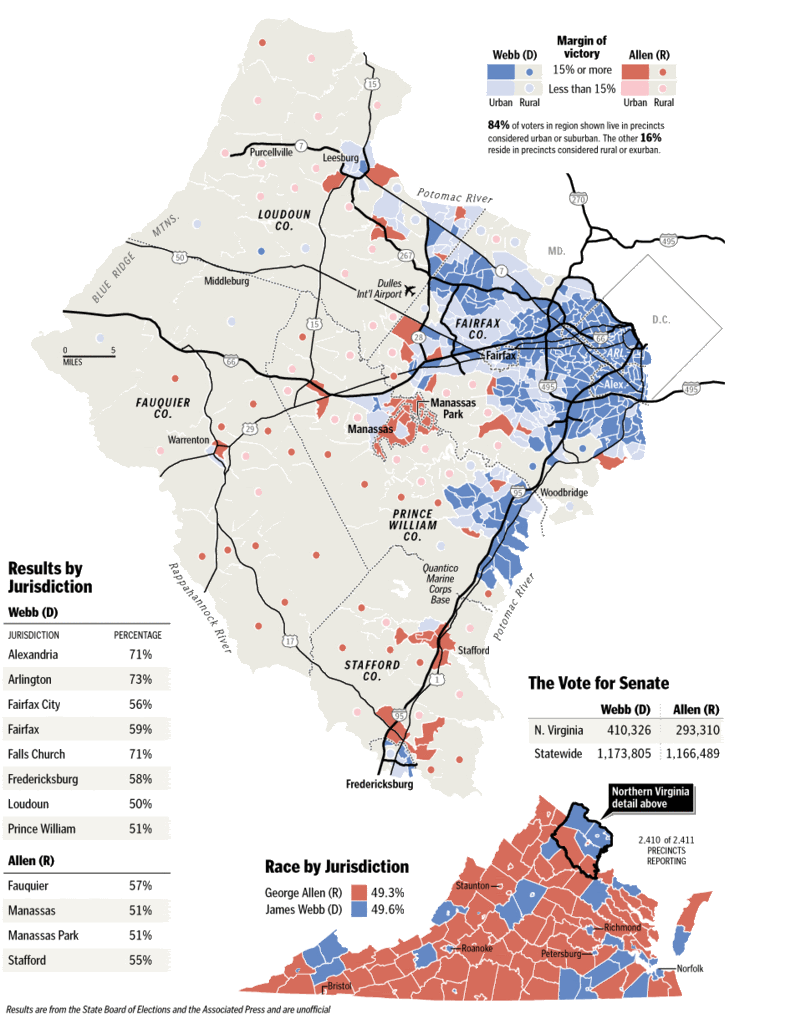
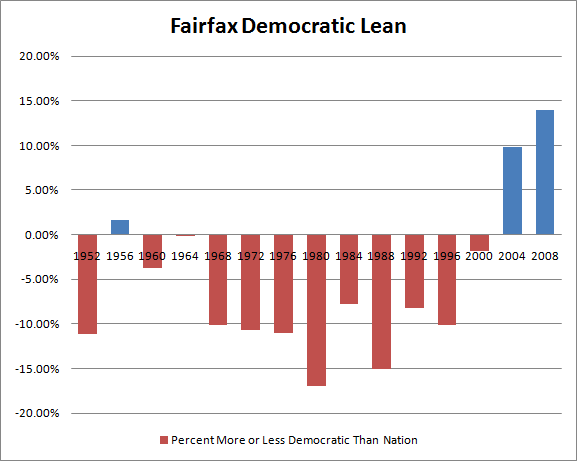
By 2000, as the graph above indicates, change was coming to the suburban communities in Fairfax. In 2004 the county voted Democratic by a 7.30% margin, which should have been a warning sign to Republicans. A mere two years later, it powered Democratic candidate Jim Webb to a narrow victory over incumbent Senator George Allen (he won the county by 18.9%). In 2008 Fairfax – well, just look at the map to see what happened in 2008.

In just eight short years, Northern Virginia has turned from a Republican-leaning suburb into a fundamental part of the Democratic base. Virginia has changed from a red state into a purple one, due mainly (but not entirely) to Northern Virginia.

The next post will explore Northern Virginia today – in order to get a sense of how this has happened.

–Inoljt, http://mypolitikal.com/

Polarization: Past and Present

A number of commentators have lamented increasing polarization in Washington. Conventional wisdom has it that America is as divided and partisan as it ever has been. Sectional divisions are tearing this country apart and preventing problems such as the deficit from being addressed; the differences between blue America and red America, in this view, are rapidly approaching crisis point.

There is some justice to this view. Polarization has probably increased, by a number of metrics, over the past few elections. Indeed, I previously noted something to this exact effect.

Let’s take another look, however, at the hypothesis, using a different type of measurement. Do blue states elect Republican representatives, and vice versa? In a polarized nation, this would probably not be the case.

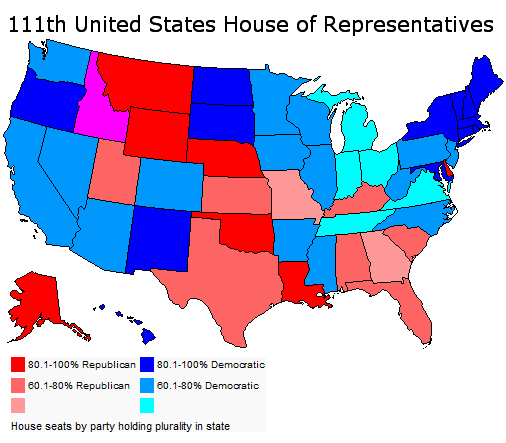
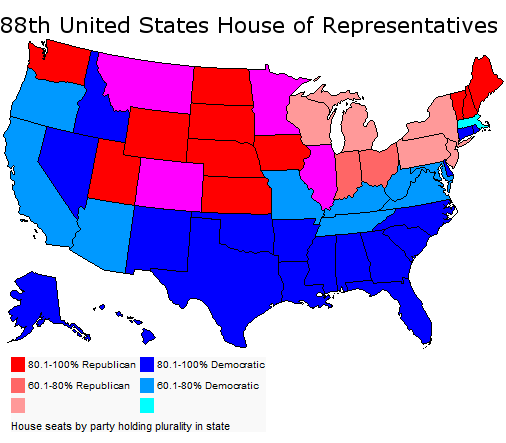
Here is the House today:

Polarization: Past and Present

Here is 1894:

Polarization: Past and Present

As this stark contrast illustrates, perhaps polarization ain’t so bad as it used to be.

More below.

The 2008 image is a fascinating map in that it almost perfectly matches the 2008 electoral college. One sees the Republican corridor of strength in the South and Mountain West. Most of the map is blue since Democrats have a 255-178 majority, the result of two previous Democratic landslides.

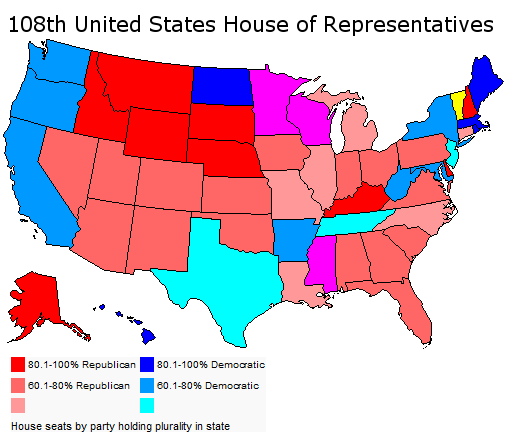
Here is a map of a House with a Republican majority:

Polarization: Past and Present

This House was the result of 2002 congressional elections. Republicans had done well in the wake of 9/11, and they had a 232-201 majority.

In the map there are relatively few states with 80-100% of representatives from one party. Blue states elect Republicans; red states elect Democrats. Moreover; for some states (e.g. Delaware, the Dakotas) it is mathematically impossible to be less than 100% Democratic or Republican.

Let’s move back several decades:

Polarization: Past and Present

The date is 1960; President John Kennedy has just been elected. Democrats hold a 258-177 majority, almost identical to that today.

There are a lot more “one-party states” compared to the current map. Sectional division is far more pronounced; there is a line between North and South that simply does not exist in today’s House. In 1960 – especially in the still-standing Solid South – blue states generally did not elect Republicans, and vice versa.

Polarization grows even worse if one goes back further. Here is 2002, once again:

Polarization: Past and Present

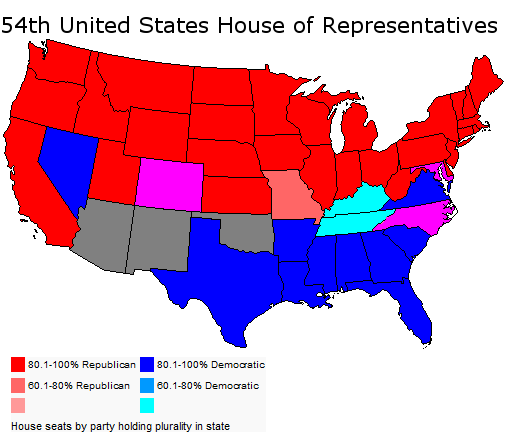
Here is 1894:

Polarization: Past and Present

Republicans have just won 130(!) seats. They hold a 254 to 93 majority.

In this incredible map, there are only six states with congressional delegations less than 80-100% from one party. In it one can literally trace the battlefields of the Civil War.

This is real polarization, the results of a nation so divided it had literally torn itself in two. This is the type of polarization that results from scars so deep that they took more than a century to heal.

Perhaps today America is indeed growing more polarized, more divided into red states and blue states. But when one compares the present situation to past ones, there is literally no comparison. The United States has a long way to go before it gets as polarized as it did during the latter half of the 19th century.

–Inoljt, http://mypolitikal.com/

Theoretical, improbable majority-minority districts

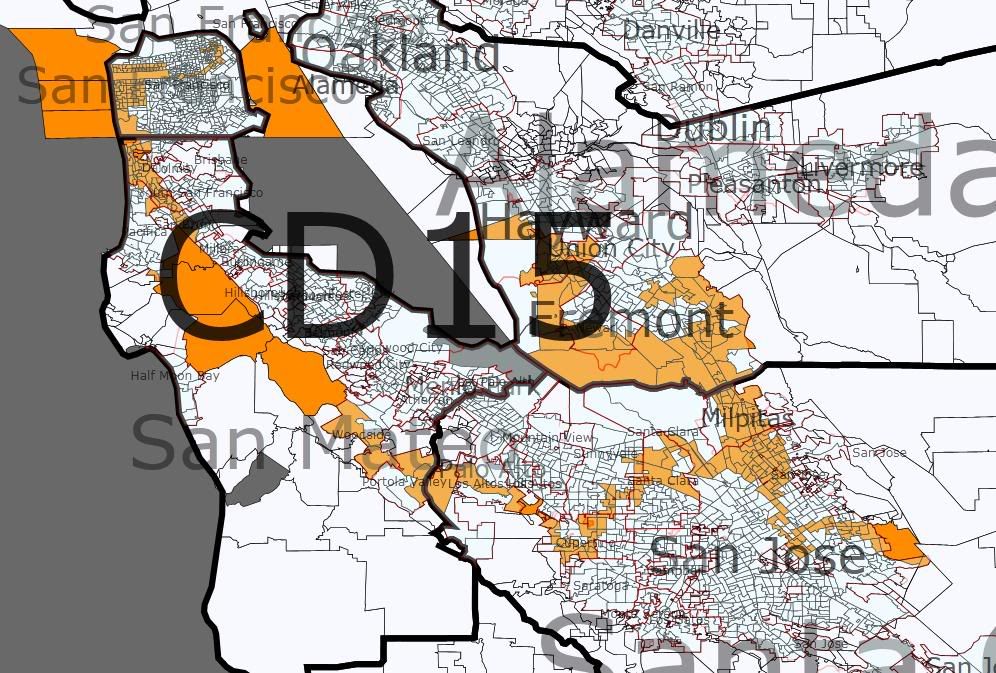
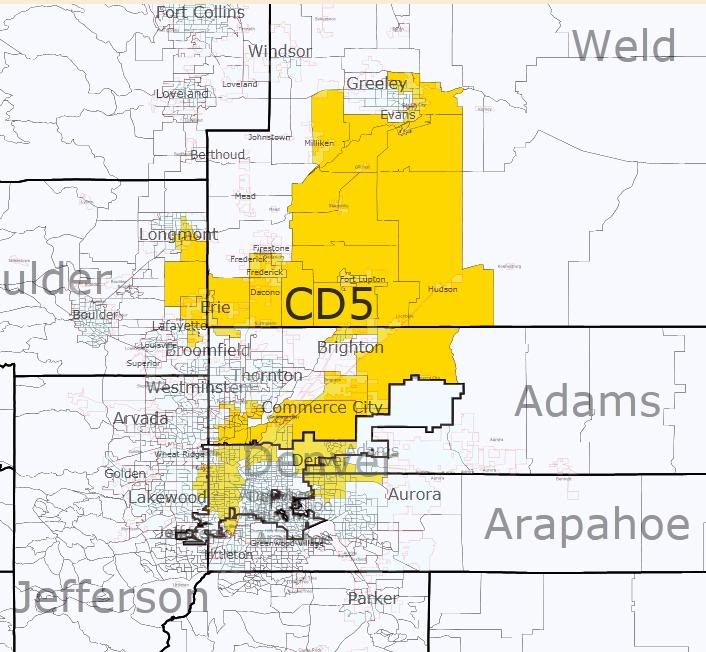
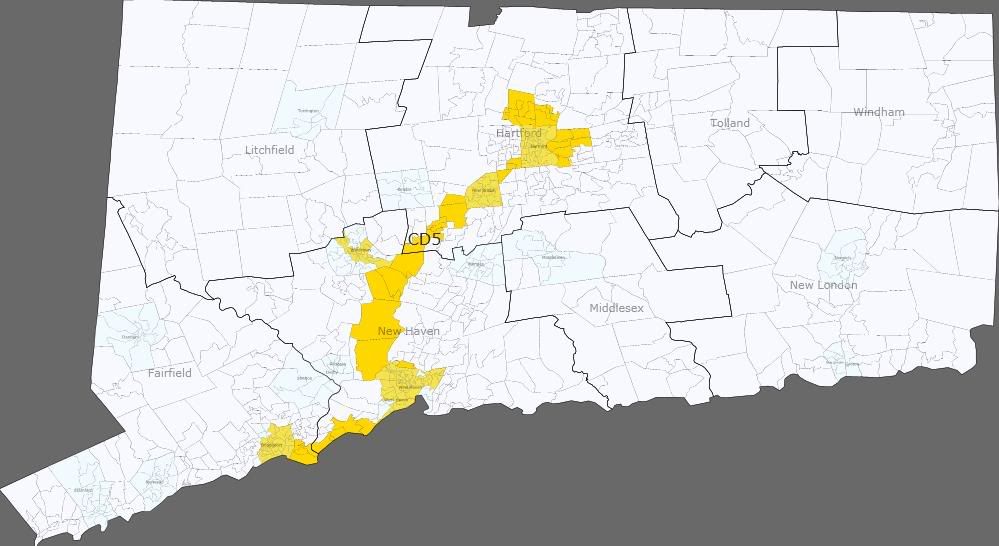
I thought it would be interesting to use Dave’s Redistricting App to show that it was possible to create minority-majority districts in places that people might not necessarily expect, yet are indeed possible. I know that most of these districts will probably never be created, but it was an interesting chance to see what districts could be created. Technically, the definition of a majority-minority district according to the Supreme Court is any district that is less than 50% white (a coalition district), not necessarily a majority for one specific group. So some of these districts are +50% for one group, such as black or Hispanic, others have a plurality for another group, while others are just less than 50% white. So here are some of the districts I looked at:

California

Photobucket

Racial stats: 51% Asian, 29% white, 12% Hispanic, 4% other, 3% black

This is an Asian majority district in the Bay Area. While several current districts have an Asian plurality with current Census data, none of them have an Asian majority. This district would probably elect an Asian representative, most likely Rep. Mike Honda, who already represents many Asian areas in San Jose. I think this might be the first Asian majority district to ever exist outside of Hawaii.

Colorado

Photobucket

Racial stats: 51% Hispanic, 37% white, 7% black, 3% Asian, 1% Native American, 1% other

It was actually possible to create a district in the Denver area that is majority-Hispanic. I linked Hispanic areas in the cities of Lakewood, Denver, Commerce City, Longmont, Brighton, and Greeley. Most of the voters come from Diana DeGette’s 1st district and Ed Perlmutter’s 7th district, although Jared Polis’s 2nd district and Betty Markey’s 4th district also lose some voters. I assume this district would elect a Democrat, possibly Diana DeGette, or possibly someone else.

Connecticut

Photobucket

Racial stats: 43% white, 27% black, 24% Hispanic, 3% Asian, 3% other

By linking minority areas in the cities of Bridgeport, New Haven, Waterbury, New Britain, and Hartford, it was possible to create a district that is majority-minority in Connecticut. The district has the homes of John Larson and Rosa DeLauro, and takes in all of the major urban centers in the four eastern and central districts, so it would probably help Republicans in some of the other districts. While the district is less than 50% white, it is almost evenly split between the district’s Hispanic and black populations, so it would be interesting to see what would happen in an election here.

Indiana

Photobucket

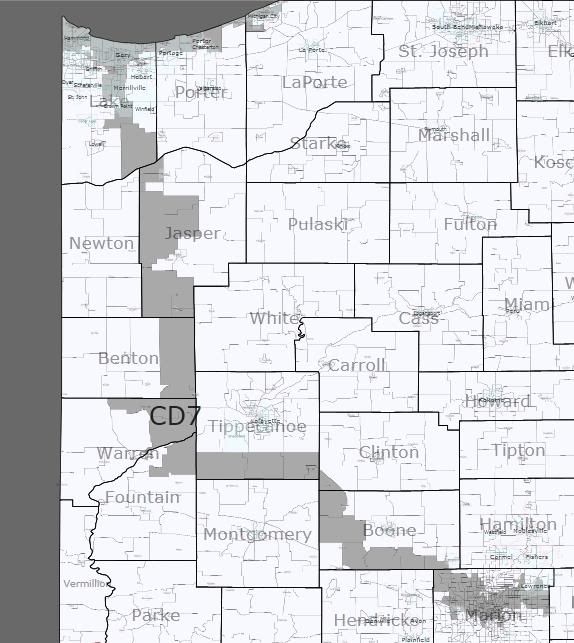
Racial stats: 45% black, 43% white, 9% Hispanic, 2% other, 1% Asian

By connecting heavily black areas in Indianapolis and Gary, it is possible to create a district that is plurality (yet not majority) black. I assume that Andre Carson would run here and win, although he would probably be challenged in the primary by Pete Visclosky. However, this district is more Indianapolis, so I think Carson would defeat Visclosky. This district would be incredibly Democratic either way, I’m sure Obama broke 75% here, maybe even 80%.

New Jersey

Photobucket

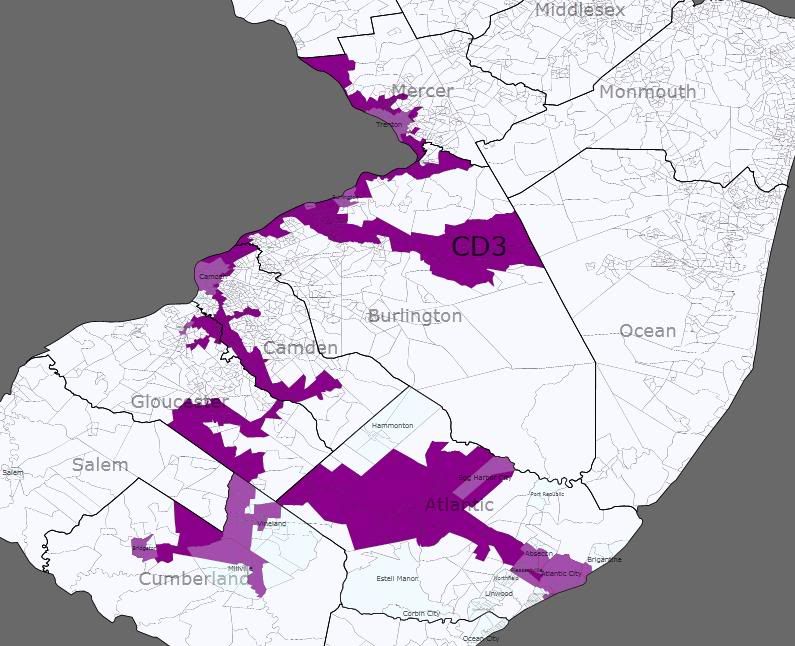
Racial stats: 39% white, 34% black, 21% Hispanic, 4% Asian, 2% other

This district connects minority areas in Atlantic City, Camden, and Trenton, and could probably be made even less white than this version is. Battle Royale between John Adler and Robert Andrews that would allow a minority candidate to slip through the primary? Thanks to andgarden for this idea.

New Mexico

Photobucket

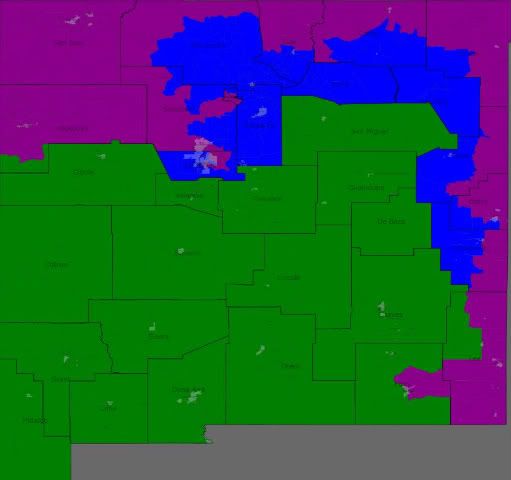
1st district (blue): 53% Hispanic, 37% white, 5% Native American, 2% other, 2% black, 1% Asian

2nd district (green): 51% Hispanic, 42% white, 4% Native American, 1% black, 1% other, 1% Asian

3rd district (purple): 55% white, 22% Hispanic, 17% Native American, 2% other, 2% black, 1% Asian

As it stands now, all three New Mexico districts are majority-minority, although Dave’s Redistricting App shows a Hispanic majority in only one district, the current NM-02, with updated 2008 numbers. So I wanted to see if it was possible to create not just one, but two Hispanic majority districts. I accomplished this task without too much difficulty, although I admit that it looks a bit strange. The 2nd district remains almost unchanged, although it picks up Torrance County and Hispanic-majority San Miguel County and loses the cities of Carlsbad and Hobbs. Meanwhile, the city of Albuquerque is split in half, along with the northern and eastern edges of the state. The Hispanic western half of Albuquerque as well as other Hispanic areas to the north and east of the 2nd district, as well as Santa Fe go into the 1st district. Meanwhile, the mostly white eastern half of Albuquerque is put into the sprawling 3rd district, which goes from Gallup and Farmington in the northwest all the way down to Hobbs in the southeast.

This would set up an interesting chain of events assuming the three Democratic congressmen currently in office (Heinrich, Teague, and Lujan) were still in office. No one would probably want to run in the new 3rd district, which is the white-majority district and the most Republican of the three. Teague would most likely run in the 2nd district, which is similar to his current district, although he would have to move as his home in Hobbs is now in the 3rd district. Meanwhile, Lujan and Heinrich would probably face off in the 3rd district, although I imagine Lujan would be the favorite since he represents much of this district already and there is now a Hispanic majority in the district. Meanwhile, a Republican would likely win the 3rd district seat, although perhaps I am wrong since New Mexico is a pretty Democratic state on the whole and this district still has significant Hispanic (22%) and Native American (17%) populations. This map would never occur with a Democratic legislature/governor, although perhaps the Republicans would attempt this if they controlled the state government, which is highly unlikely for now.

Ohio

Photobucket

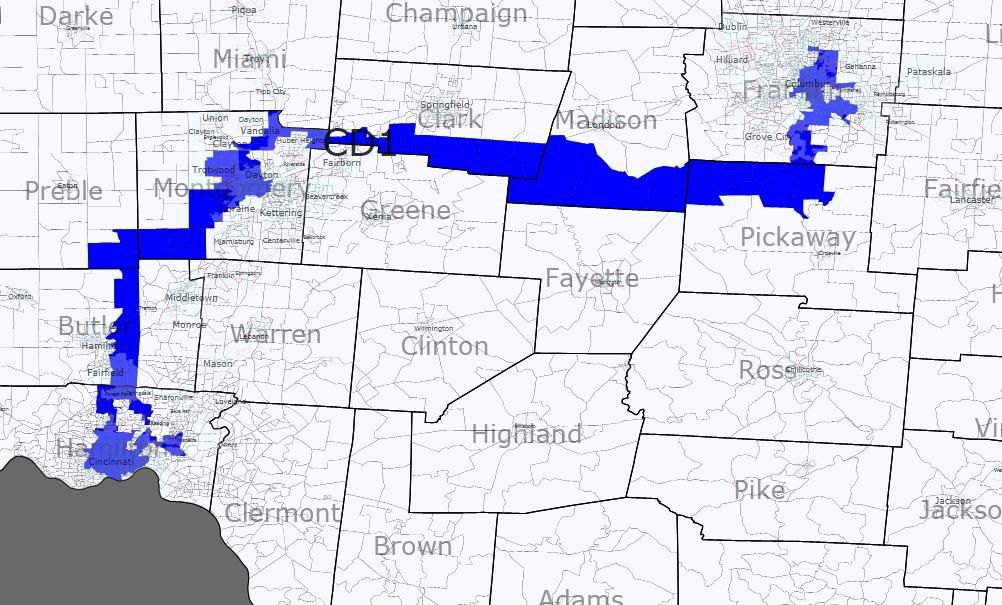
Racial stats: 53% black, 42% white, 2% other, 1% Asian, 1% Hispanic

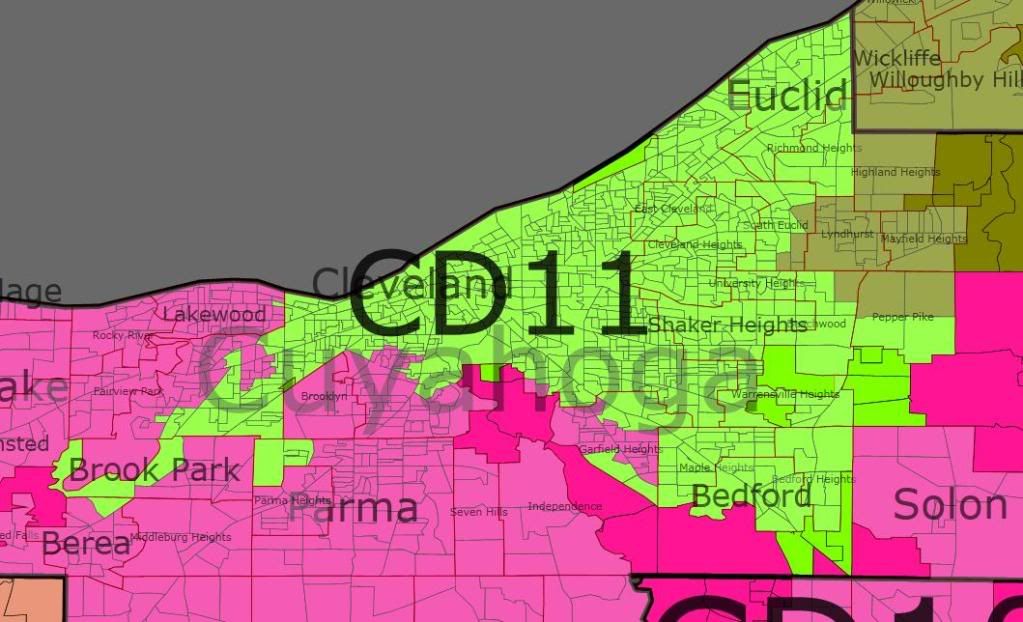
This district actually inspired the rest of the diary after I thought of it over the summer. This new majority-black district links African-American areas in the cities of Cincinnati, Dayton, and Columbus, and manages to look cleaner than even the current NC-12 (Mel Watt’s district). It would almost certainly elect a black Democrat, and at the same time would take pressure off of other Republicans such as Pat Tiberi and Mike Turner. If Steve Chabot was elected in 2010, he would probably have to run against Boehner or Schmidt in the primary as this district would take up much of the current OH-01’s turf in Cincinnati. If Steve Driehaus hung on in 2010, I think he would probably lose the primary to an African-American, although who knows what would happen.

Also, several people have said that they have been unable to keep OH-10 as a majority-black district in Cleveland without going into Akron.

It is indeed possible, here is a map:

Photobucket

Racial stats: 50% black, 41% white, 5% Hispanic, 2% Asian, 1% other

The main way I did this was by taking a lot of the population from Dennis Kucinich’s district, which puts his district 270,000 people in the red, which makes it almost a given his district will be combined with Sutton’s district in my opinion.

Texas

Photobucket

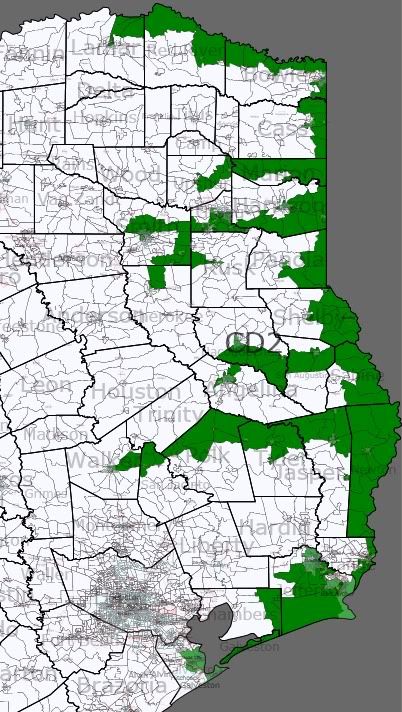
Racial stats: 44% white, 33% black, 19% Hispanic, 1% Asian, 1% other

I know that there are a lot of pockets of black and Hispanic voters in East Texas, so I wanted to see if it would be possible to make a minority-majority district in East Texas without going into Houston or Dallas at all. So I was able to make a meandering district that picks up minority voters in Galveston, Beaumont, Port Arthur, Orange, Huntsville, Lufkin, Longview, Tyler, Texarkana, and Paris. It looks a bit like Cleo Fields’ old district in neighboring Louisiana, although this district emerges at just 33% black. Still, that might be enough to put a black Democrat through the primary and into office, as the entire district is just 44% white overall and many of those white voters are Republicans and wouldn’t vote in the Democratic primary anyway. I made this district before Dave put in the partisan data, so I haven’t calculated the presidential numbers yet, although I imagine that it was probably in the low 50s for McCain, nowhere near as Republican as the current East Texas districts.

So I know that many of these districts are highly theoretical, but I still thought it was an interesting exercise in seeing what is possible and what may even be required by law someday as voting rights law evolves. Let me know what you think of these districts and this subject!

By what margin will Bob Shamansky win?

View Results

Loading ... Loading ...

Analyzing Swing States: Virginia, Part 2

This is the second part of a series of posts analyzing the swing state Virginia. It will focus on Republican Virginia. The third part can be found here.

Analyzing Swing States: Virginia,Part 2

History

After the Civil War, Virginia constituted a reliable Democratic stronghold. Conservative Democrats such as Harry F. Byrd, who controlled the state’s politics for decades, typified the state’s politicians.

Like many southern states, Virginia enacted a strict set of voting restrictions which successfully disenfranchised blacks. However, it never voted as overwhelmingly Democratic as the Deep South; only one Democrat (FDR) ever won more than 70% of the vote.

Earlier than most Southern states, Virginia began moving Republican, beginning in 1952 (when it cast the ballot for General Dwight Eisenhower). Republican strength rested upon the mountainous west (Republican even in the days of the Solid South) and the fast-growing, Republican-leaning suburbs. The west still votes Republican, but the suburbs are changing fast.

More below.

Republican Virginia

Analyzing Swing States: Virginia,Part 2

Like many states in the South – and, in fact, like America itself – the “normal” voter usually leans Republican. When one imagines a Virginian (perhaps a hard-scrabble Appalachian type or a white suburban businessman), one is usually looking at a conservative. It is the growing numbers of “other” voters in the state that are making it competitive today.

These Republicans have several factors in common. Exit polls of the 2008 presidential election provide an interesting but incomplete picture of who they are. As is true of the United States in general, Virginia Republicans are predominately white (60% voted for Senator John McCain, versus 55% nationwide). White college graduates are substantially more Democratic than white non-graduates, but polling did not reveal an income gap. Evangelism Evangelicalism constituted a major factor: white evangelicals voted for McCain by a 4-1 margin. Interestingly, white women did not vote much more Democratic than white men; Virginia’s gender gap was quite narrow relative to the nation at large.

As the map above indicates, the Republicans do best in the western reaches of Virginia. Partly this is because Democratic-voting minorities – mostly blacks – generally live in the east. The quick rightward drift of Appalachian America also accounts for Republican strength, which is growing in the region.

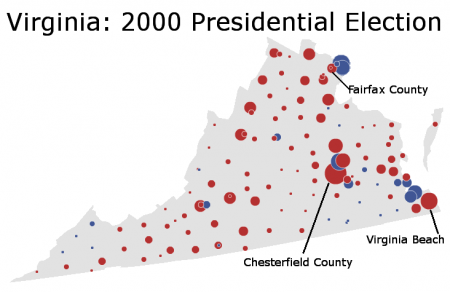
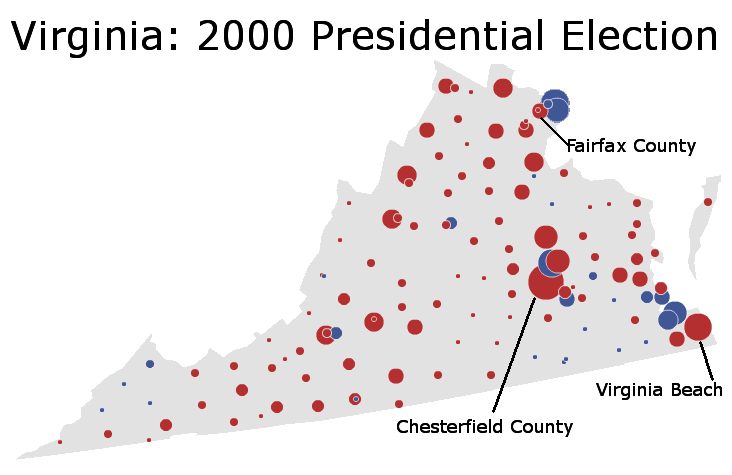
Republicans also retain strength in Virginia’s suburbs and exurbs. Specifically, suburban Richmond and Hampton Roads used to vote Republican quite strongly, ensuring Republican victories even when Democrats undercut their margins in rural Virginia. President Bill Clinton, for instance, did quite well in rural Virginia; it was his losses in these places (Chesterfield and Virginia Beach counties) that kept the state red.

The 2000 presidential election provides an illuminating illustration of Republican Virginia at a strong point:

Analyzing Swing States: Virginia,Part 2

In that election, Vice President Al Gore lost the state by 8.04% while barely winning the nationwide popular vote. Unlike Mr. Clinton, he was crushed in both rural and suburban Virginia. The former was quickly drifting right, while the suburb’s movement left had yet to materialize.

Since that time, of course, things have changed. While Democratic candidates previously – and mostly unsuccessfully – attacked the rural component of Republican Virginia, they have since switched their focus to populous, wealthy, and diverse suburban Virginia. In particular, Democrats have been appealing quite effectively to the suburban NoVa metropolis, which never really fell in love with Republicanism.

–Inoljt, http://mypolitikal.com/

Previewing Senate Elections: Illinois

This is the first part of a series of posts analyzing competitive Senate elections in blue states. The second part, which analyzes New York, can be found here.

Illinois

In November 2010, Democratic State Treasurer Alexi Giannoulias will face off against Republican Congressman Mark Kirk, in what looks to be a competitive Senate race. A heavily blue state, Democrats have been hurt by a bad national environment coupled with continuing fall-out from the Rod Blagojevich scandals.

Out of the three states being analyzed (the other two being California and New York), Illinois is the state in which Republicans are strongest. Out of the three, it is also the state with the most competitive forthcoming election. This post will analyze the political contours of the state, and the long and difficult path Mr. Kirk must tread for victory.

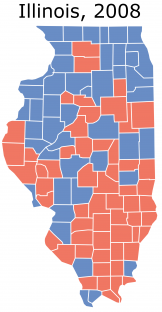
Previewing Senate Elections: Illinois

With respect to demographics, Illinois is structured very simply. It has three parts: Chicago, its suburban metropolis, and the mostly rural downstate.

To win, Congressman Mark Kirk will need to run a gauntlet of challenges in each of section of the state. He must capitalize on Republican strength downstate, revive it in the suburbs, and hope that Chicago turn-out is depressed. If done properly, this will result in a close-run, Scott-Brown type victory.

More below.


Downstate Illinois

Mr. Kirk’s easiest task should be here.  Much of downstate Illinois has more in common with Kentucky and Missouri than far-north Chicago. Like these two states, the region has been trending Republican: Bill Clinton did far better than Barack Obama here.

There are several complicating factors. Downstate Illinois has several population centers – but these cities tend to vote less Republican (they all voted for Obama, for instance). Moreover, Mr. Kirk hails from the Chicago metropolis and has a reputation as a moderate congressman; he may not play too well with rural conservatives.

Nevertheless, the region constitutes the Republican base, and Mr. Kirk will need every vote he can get. He should be able to win downstate Illinois quite comfortably. He will have to. After all, President George W. Bush won practically every single county here – and he lost Illinois by double-digits.

Chicago’s Suburbs

The true test of Mark Kirk’s candidacy will come in the Chicago suburbs. His task is doable, but not exactly easy.

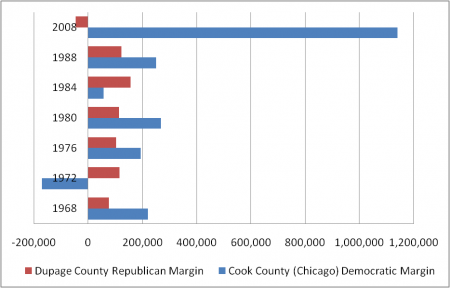
There is good news and bad news for Republicans. First the good news: unlike other solidly blue states, the Chicago suburbs still vote Republican. Like Orange County, for years their strength kept Republicans competitive in Illinois. Take a look at suburban DuPage County:

Previewing Senate Elections: Illinois

(Note: A negative margin indicates that Democrats lost Cook County, or that Republicans lost DuPage County.)

Even after Democrats started winning suburbs, during President Bill Clinton’s time, Chicago’s suburbs continued voting Republican. In 2004, for instance, George Bush won DuPage county by a little less than 10%.

The bad news for Republicans is that each election, they win the suburbs by a little less. In 2008 President Barack Obama swept DuPage County and the rest of Chicago’s suburbs by double-digits. This victory constituted the culmulation of decades of leftward movement.

The test for Mr. Kirk is the extent to which he can reverse this trend. He will not just have to win the suburbs, but turn the clock back two decades – back to the glory years in which Republicans won around 70% of the vote in DuPage County. (Mr. Kirk will probably not have to do that well, given rising Republican strength downstate.)

Is this doable? Given that Republicans seem to be winning suburbs everywhere this year, it is certainly possible. Mr. Kirk, moreover, has spent a decade representing a Chicago suburb congressional district; this is why Republicans have nominated him.

Chicago

43.3% of Illinois residents live in Cook County, home to America’s third-largest city. Of these, half call Chicago home; the other half live in an inner ring of suburbs.

If God decided to create the ideal Democratic stronghold, he would get something like Chicago. The city is heavily populated by black and Latino minorities, mixed together with a dollop of white liberals. As a cherry on top, it is also home to President Barack Obama – and Chicagoans are highly aware of this fact.

Whether he loses or wins by a landslide, Mark Kirk will not win Cook County. He will just have to take the blow, cross his fingers, and pray that minority turn-out is low (as it has been, this year). That is not a good strategy, but it is the best Republicans can do when 89% of them are white, and they are competing in a minority-majority city.

Conclusions

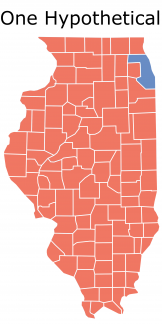
So what does Mr. Kirk have to do? Say that he gets 35% of the vote in Cook County – propelled by inner-ring suburban strength and minority apathy – and wins a landslide everywhere else in the state (for instance, a 3:2 margin). This gives him 50.3% of the vote in the 2008 Illinois electorate. If white Republicans downstate turn out, and minorities in Chicago do not, Mr. Kirk may get bumped up to a 2-3% victory.

Previewing Senate Elections: Illinois

As we will see, this task is easier compared to the challenges Republicans face in California and New York. In Illinois they can (barely) get away with a white-only coalition. In California Republicans absolutely must win minorities – a novel challenge. As for New York – it is similar to Illinois, except that New York City is double the size of Chicago. And upstate New York is trending Democratic.

–Inoljt, http://mypolitikal.com/