Rasmussen is dominating the narratives through his frenetic polling.

So I’ve gotten the feeling that our prospects in the Senate have been sinking recently, even more so than during the last quarter of 2009.  So I asked myself, “Why do I have that feeling?”  And then I went back and looked.  The answer in more cases than not is Scott Rasmussen.

I’m not saying Rasmussen is a bad pollster.  In fact, he may just be ahead of the curve in terms of predicting what may be a dismal Democratic turnout in 2010.  But he is an incredibly frequent pollster, and his polls have dominated the narratives in many of these races as a result of their sheer frequency.  

Here are the races rated by Cook as Lean Retention or better for the challenger:

(1) ND-OPEN – Hoeven’s dominance here has been tracked by several pollsters.  Not a case in point.

(2) DE-OPEN – The proposition that Castle v. Coons is a washout is based on a single Rasmussen poll taken January 25 showing a 56-27 Castle lead.  There is no other recent polling.

(3) AR-Lincoln – Ras is at least corroborated by PPP in showing Lincoln’s sorry ass getting blown out.

(4) NV-Reid – Much like Arkansas, PPP corroborates Rasmussen’s solid R leads.

(5) CO-Bennet – All of the gloom and doom in this race comes from two recent Rasmussen polls showing double-digit leads for Norton over Bennet.  Research 2000 actually showed a small lead for Bennet only a month ago.  

(6) PA-Specter – Again, the gloom and doom here comes from two recent Rasmussen polls showing 9-point leads for Toomey over Specter.  Quinnipiac showed an even race on December 8.

(7) IL-OPEN – Once again, the gloom and doom here comes from a single Rasmussen poll showing Kirk up 6, which was directly contradicted by a PPP poll just a week prior showing Giannoulias up 8.

(8) MO-OPEN – Yet again, more gloom and doom exclusively from Rasmussen, showing Blunt up 7 and 6.  Every non-Rasmussen poll has Carnahan ahead.

(9) OH-OPEN – Again, the narrative that Portman is winning comes from Rasmussen, although Quinnipiac had a 3-point Portman lead back in November.  

(10) NH-OPEN – Several polls have corroborated Rasmussen’s high single digit lead for Ayotte over Hodes, so this is not a case in point.

(11) KY-OPEN – Like New Hampshire, Rasmussen’s polling showing high single single digit leads for Republicans is corroborated by other pollsters here.

(12) IN-Bayh – The only reason that this race is viewed as competitive as far as I can see is a Rasmussen poll that showed Mike Pence up on Bayh and John Hostettler within 3.  Today, Research 2000 showed Bayh up 16 on Hostettler and 20 on Indiana-hating Dan Coats.  Cook has now moved this from Safe D to Lean D, presumably based largely on Rasmussen.

(13) CA-Boxer – Kind of like Indiana.  The main reason this race is viewed as competitive is Rasmussen’s polling, starting in July when Ras showed a 4-point race with Fiorina while others showed 15 to 20 point leads.  In fairness to Ras, a recent PPIC poll showed Tom Campbell within 4, giving some corroboration for Ras’s take.  But nobody else has had Fiorina closer than 8.  Cook has had this at Lean D for some time, and I suspect that was partly based on the July Rasmussen poll.

(14) CT-OPEN – Ras shows a pretty solid Blumenthal blowout, although less so than other pollsters.  Not a case in point.

I am using Wikipedia to track polling, and may be missing some polls.  Please correct me if I am mischaracterizing anything.

Of these 14 races, I would say that Rasmussen has had a stranglehold on the recent gloom and doom narratives in 7: DE, CO, PA, IL, MO, OH, and IN.  Put another way, I have been led to the subconscious belief that we are going to lose the first 6, and be in for a dogfight in IN, strictly based on Rasmussen polling.  I would also put CA in pretty close to the same category as IN, although PPIC did recently confirm a close race with Campbell at least.

I do not think this is an accident.  I do not remember this kind of frenetic pace from Rasmussen before Obama took office.  SSP recently suggested Rasmussen has gotten so prolific that he could be called “spammy.”  My gut tells me Ras is getting as many polls out there as he can precisely so that he can dominate the narratives with his polls and their aggressive turnout model.  Combine this with his right wing framing on issue polling, his inexplicable use of an aggressive likely voter screen for presidential approval three years before the election, his haste to poll Republican “dream” candidates, and his frequent yucking it up with conservative talking heads, and you’ve got yourself a Republican cheerleader trying to influence elections rather than study them.  Again, his polls may be right.  But his transparent efforts to drive the narrative seem very partisan to me.

TX-Gov: Perry in Runoff Territory, White Strong in New Polls

Take these polls with a grain of salt, considering that they were taken before Debra Medina was nailed for expressing 9/11 truther-esque sentiments in an interview with Glenn Beck. If Perry can scoop up enough votes from her hide, he could avoid a runoff, but that’s a big if.

Here’s the Texas-sized round-up:

Research 2000 for Daily Kos (2/8-10, likely voters):

Rick Perry (R-inc): 42

Kay Bailey Hutchison (R): 30

Debra Medina (R): 17

Undecided: 11

Rick Perry (R-inc): 43

Kay Bailey Hutchison (R): 33

Undecided: 24

Rick Perry (R-inc): 44

Debra Medina (R): 23

Undecided: 33

Kay Bailey Hutchison (R): 38

Debra Medina (R): 30

Undecided: 32

(MoE: ±4.9%)

General election match-ups:

Bill White (D): 42

Rick Perry (R-inc): 46

Undecided: 12

Bill White (D): 41

Kay Bailey Hutchison (R): 47

Undecided: 12

Bill White (D): 43

Debra Medina (R): 44

Undecided: 13

(MoE: ±4%)

Hamilton Campaigns (D) and Public Opinion Strategies (R) for the Texas Credit Union League (1/3-4 & 6, likely voters):

Bill White (D): 51

Farouk Shami (D): 19

Felix Alvarado (D): 7

Undecided: 16

Rick Perry (R-inc): 49

Kay Bailey Hutchison (R): 27

Debra Medina (R): 19

Undecided: 5

(MoE: ±4.9%)

University of Texas/Texas Tribune (2/1-7, likely voters):

Bill White (D): 50

Farouk Shami (D): 11

Someone Else: 9

Undecided: 30

(MoE: ±6%)

Rick Perry (R-inc): 45

Kay Bailey Hutchison (R): 21

Debra Medina (R): 19

Undecided: 16

(MoE: ±5.1%)

General election match-ups:

Bill White (D): 35

Rick Perry (R-inc): 44

Someone Else: 8

Undecided: 12

Bill White (D): 34

Kay Bailey Hutchison (R): 43

Someone Else: 9

Undecided: 14

Bill White (D): 36

Debra Medina (R): 36

Someone Else: 8

Undecided: 21

Farouk Shami (D): 25

Rick Perry (R-inc): 49

Someone Else: 15

Undecided: 14

Farouk Shami (D): 23

Kay Bailey Hutchison (R): 49

Someone Else: 15

Undecided: 14

Farouk Shami (D): 24

Debra Medina (R): 40

Someone Else: 14

Undecided: 22

(MoE: ±3.5%)

And, in the (increasingly unlikely) event of a special Senate election, U-T took a crack at that one, too:

John Sharp (D): 29

David Dewhurst (R): 15

Michael Williams (R): 3

Florence Shapiro (R): 2

Elizabeth Ames Jones (R):  2

Roger Williams (R): 1

Craig James (R): 1

Undecided: 47

(MoE: ±3.5%)

IL-Gov: Quinn Leads Brady and Dillard in First Post-Primary Poll

Victory Research (2/4-7, likely voters)

Pat Quinn (D-inc): 42

Bill Brady (R): 31

Rich Whitney (G): 4

Undecided: 23

Pat Quinn (D-inc): 41

Kirk Dillard (R): 35

Rich Whitney (G): 3

Undecided: 21

(MoE: ±2.8%)

Here’s the first post-primary poll of the Illinois governor’s race, and it shows Democratic incumbent Pat Quinn in OK shape for re-election, suggesting that he may not have taken on quite as much water during the heated Democratic primary as might be feared. The poll is from Victory Research, a firm I’ve never heard of before; they claim this is an “independent” poll, although, interestingly, they’ve done work for both Quinn and Republican state Sen. Kirk Dillard in the past.

As you probably know, the GOP primary has yet to be decided, and probably won’t be for several months, which is why they poll two GOPers despite the primary being two weeks old. State Sen. Bill Brady has a 406-vote edge for now, and Quinn should root for Brady to prevail, based on the disparity between Brady and Dillard’s performances. The difference between Dillard and Brady, if you delve into the crosstabs, is entirely explicable by how the more moderate Dillard performs in the Chicago suburbs (where he’s from, as opposed to the socially conservative, Downstate Brady). Dillard wins with over 50% in the collar counties, while Quinn and Brady are in a dead heat in the collar counties (while, of course, Quinn cleans up in vote-heavy Cook County).

RaceTracker Wiki: IL-Gov

SSP Daily Digest: 2/12

AZ-Sen: The establishment is moving in to shore up John McCain’s re-election bid, as the rest of Arizona’s GOP congressional delegation endorsed yesterday (over their former colleague J.D. Hayworth): Jon Kyl, plus Reps. Trent Franks, John Shadegg, and Jeff Flake. Yesterday McCain also got a perhaps more surprising endorsement yesterday, from Grover Norquist, who’s been supportive of a lot of insurgent bids this year… but Norquist is more interested in purely economic issues and may not have much common cause with the more resentment-based social conservative politics of Hayworth.

CO-Sen: Here’s a sign of life for the strangely low-profile Andrew Romanoff primary campaign: he just got the endorsements of two of the state’s major unions, the Teamsters and the UFCW. Michael Bennet did just vote to confirm Craig Becker to the NLRB, but the unions take issue with his lack of support for the card-check provision of EFCA. Meanwhile, Tom Wiens is offering one of the strangest excuses I’ve ever heard for his failure to get much traction in the GOP primary: there are a whole lot of Nortons in Colorado, and people reflexively will vote for any of them.

IN-Sen: Another day, another damning revelation about Dan Coats’ lobbying past. Today, it turns out that his lobbying firm, King & Spalding, was lobbying on behalf of Bank of America at a time it was seeking patent approval for a formula that would help companies evaluate whether and how to outsource their operations to lower-overhead countries.

NC-Sen: Richard Burr has drawn a primary challenger as he seeks his first re-election the Senate. Asheboro city councilor Eddie Burks, however, doesn’t have the kind of high-profile position that’s likely to make much of an impact. But even weirder is the nature of the challenge. You’d think he might get some traction if he reached out to the teabaggers and accused Burr of being insufficiently bloodthirsty, but instead it’s a surprisingly level-headed critique of Burr’s inaccessibility and general anonymity.

NY-Sen: Speaking of random primary challenges, now Chuck Schumer is facing one too, from Phil Krone, an Illinois and/or Florida political consultant who was just involved in Dan Hynes’ unsuccessful campaign. Krone says he’ll dive in only if he can raise $10K in contributions before April 1; given the strangeness of his bid, even that seems kind of a high bar to reach.

NY-Sen-B: Finally, there’s one other carpetbagging primary challenge that’s only slightly less random: that of Harold Ford Jr. against Kirsten Gillibrand. This latest discovery isn’t likely to help Ford’s case much: Ford claims that paying New York taxes has helped make him a New Yorker… except he hasn’t paid any New York income taxes. Ford has continued to maintain Tennessee residency, which is convenient, seeing as how Tennessee doesn’t have an income tax on wages. I guess what he meant is that he pays sales tax on all his New York pedicures.

WI-Sen: Ex-Gov. Tommy Thompson sure likes keeping his name in the news. Despite his recently signing on to work for a hedge fund on agribusiness matters (and his various other private sector projects, including being a partner at DC biglaw firm Akin Gump, he’s still refusing to rule out a Senate bid. “I’m going through a process,” he says cryptically.

NY-Gov: Looks like we will have David Paterson to kick around for at least a few months more. Despite the mounting tsunami of crap threatening to engulf him, and facing very likely annihilation by Andrew Cuomo in the Democratic primary, Paterson has been e-mailing supporters to tell them that on Feb. 20 or 21 he’ll officially launch his bid to stay Governor. He is adopting the “outsider” mantle for his run, since, of course, nothing says “outsider” more than being the sitting Governor of New York.

MI-03: CQ compiles a list of a truckload of different Republicans who might seek the seat opened up this week by retiring Rep. Vern Ehlers in the Grand Rapids-based 3rd. Prime contenders include state Sens. Bill Hardiman and Mark Jansen, former state Rep. Jerry Kooiman, and former state Sen. Majority leader Ken Sikkema, all of whom say they’ll decide soon. Former Lt. Gov., and gubernatorial candidate, Dick Posthumus, has ruled out a bid, and it seems unlikely that SoS Terri Lynn Land (who’d been associated with the seat when Ehlers retirement rumors popped up early last year) will run, as she might have her sights on the LG slot. While the GOP has the stronger bench here, Dems who might run include former state Reps. Michael Sak and Steve Pestka, and state Rep. Robert Dean.

NY-20: One seat that should be attractive to Republicans, given the narrowness of Rep. Scott Murphy’s special election victory, is the 20th, but it’s proven be one of their biggest recruiting headaches. Assemblyman Marc Molinaro is the latest GOPer to decline. Jim Tedisco, who lost to Murphy in the special, shut down his account from that election but hasn’t fully ruled out another run. Murphy is already sitting on $1.4 million, which certainly acts as a deterrent.

OH-06: The rural, Appalachian-flavored 6th (at R+2, and a negative trend from Kerry to Obama) is another district that should be a Republican target, but where Rep. Charlie Wilson hasn’t drawn a serious opponent yet. Some Dude, however, has stepped up, in the form of businessman Bill Johnson. Johnson had been considering a run next door in the 17th (where he lives) against Rep. Tim Ryan, but recently seemed to realize the 6th would be easier sledding.

CA-LG: The confirmation of Abel Maldonado as California’s new Lt. Governor has become a bizarre clusterf@ck. First off, there’s the question of why legislative Democrats would want to keep Maldonado in his Dem-leaning, pick-up-able Senate seat instead of promoting him to the entirely harmless LG slot. Clearly the Senate Dems like the idea of getting to the magic 2/3s mark, as Maldonado’s appointment cleared the Senate easily, but then enough Dems in the Assembly voted against it that his appointment failed, with 37 voting yes and 35 voting no. Confused? Well, some would say that he needed 41 votes (a majority of the 80-seat chamber) in order to be confirmed. Arnold Schwarzenegger is claiming victory, though, and planning to swear in Maldonado anyway, claiming that there would need to be 41 votes against Maldonado for the confirmation to fail. Several election law experts say Ahnold has a good point with that, although there’s guidance from a 1988 state treasurer appointment that says otherwise. Looks like this is headed to the courts.

Teabaggers: Ed Kilgore picks apart the recent CBS poll regarding the tea party movement, and comes to the same conclusions that I’ve been teasing out… that there’s really nothing new in the movement, and that it’s just the most conservative elements of the Republican coalition in just a particularly revved-up, radicalized mood, and with a handy new name to distinguish themselves. This is particularly seen that 62% of them have a favorable view of the Republican party, despite their vague claims to be a movement separate from the parties.

New Jersey Redistricting with Christie in Office

The census should show that New Jersey will lose one congressional district. Currently, New Jersey has 8 Democrats and 5 Republicans representing it in the House of Representatives. The independent comission should aim for a bipartisan plan. I combined the districts of Rush Holt (D) and Leonard Lance (R) in a district that leans Democratic but Lance can win in it since it contains most of his current district. I strengthened all the other incumbents and kept the 10th and 12th district African American and Hispanic majority respectively. For this map, I tried to not make it too convoluted because realistically, I do not see that happening. Also, I calculated the partisan data for these districts by town and I tried not to split the towns. I had to in a few cases but the partisan data should be accurate most of the time. Also, I calculated it for the top two candidates only. Here are some helpful links

For election results by county: http://www.uselectionatlas.org…

For results by town: http://njelections.org/2008_ge…

For map of current congressional districts: http://www.govtrack.us/congres…

For map of the state: maps.google.com

Southern New Jersey

Southern New Jersey

Camden Area

Camden Area

District 1 Rob Andrews (D) Haddon Heights

Demographics: 17% African American, 10% Hispanic and 68% White

Partisan data: Obama McCain Percentages

   Camden 132785 57336 70%-30%

  Gloucester 73201 56669 56%-44%

  Salem 3927 2309 63%-37%

  Total   209913 116314 64%-36%

Communities of interest: Camden, Pennesauken

The district grows a bit more Republican. I removed the Democratic neighborhoods in Burlington County to help strengthen the 3rd district. I also added more of Gloucester County and the areas I added are marginal. I also added a heavily Democratic slice of Salem County. Overall, I made mostly minor changes so Rob Andrews should have no trouble with reelection. Status is Safe Democrat

District 2 Frank LoBiondo (R) Ventor

Demographics: 9% African American, 11% Hispanic and 76% White

Partisan data:  Obama   McCain

Cumberland 21720 14211 60%-40%

Cape May 22893 27288 46%-54%

Atlantic 58904 41306 59%-41%

Burlington 13718 16638 45%-55%

Ocean        60834 85988 41%-59%

Salem        1882 2733 41%-59%

Total   179951 188164 49%-51%

Communities of interest: Vineland, Atlantic City, Berkeley

LoBiondo looks safe in his current district but since Obama won his current district 54%-45%, a bipartisan plan would strengthen him. To strengthen LoBiondo, I mostly removed Democratic areas. I removed Democratic parts of Salem County and some Democratic areas in Cumberland County.  I also removed small parts of Atlantic County but Obama barely won them. The main additions in Burlington County are Medford and Southampton which lean Republican. To completely shore up LoBiondo, I added about half of Ocean County and McCain won a 25,000 vote margin in the portion I added. These changes help boost McCain’s performance from 45% to 51%, ensuring LoBiondo safety and his successor’s safety too. Status is Safe Republican.

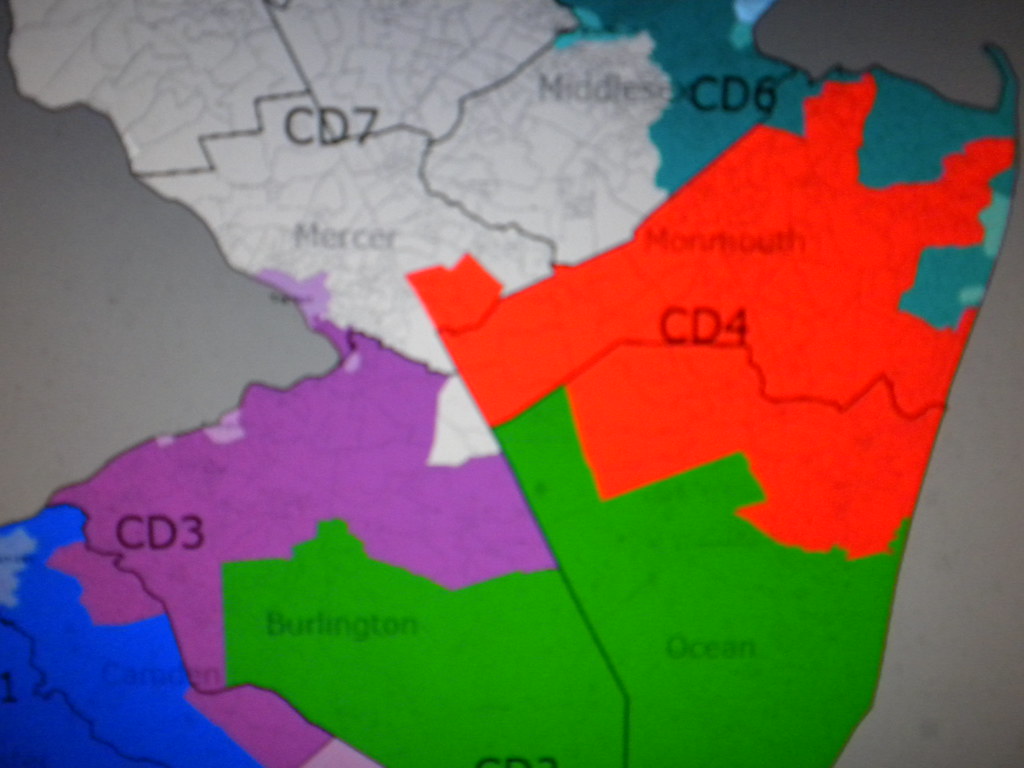
District 3 John Adler (D) Cherry Hill

Demographics: 20% African American, 10% Hispanic and 64% White

Partisan data: Obama  McCain              

Salem        10235 9774 51%-49%

Atlantic 8926 8596 51%-49%

Gloucester 4065 3646 53%-47%

Cumberland 13199 8149 62%-38%

Camden        26474 16483 62%-38%

Burlington 116496 71652 62%-38%

Mercer        23577 2157 92%-8%

Total        202972 120457 63%-37%

Communities of interest: Cherry Hill, Burlington, Trenton

I definitely strengthened Adler so he will have no problems with reelection. I strengthened him a bit too much though. I removed all of heavily Republican Ocean County while adding territory in South Jersey that leans Democratic as well as more Democratic territory in Burlington County. I also added Trenton which voted 92% for Obama so that brings up the Democratic total. I had to give Adler Trenton because I do not see Christie signing a bill with Trenton in the 7th district. Overall, Adler should have no problem in this district. Corzine won it in his unsuccessful Gubernatorial run in 2009. Status is Safe Democratic.

Central New Jersey

Central New Jersey

District 4 Chris Smith (R) Hamilton

Demographics 8% Hispanic, 83% White

Partisan Data: Obama  McCain

Ocean      49355 74689 40%-60%

Monmouth      85774 106223 45%-55%

Mercer      3406 3099 52%-48%

Total      138535 184011 43%-57%

Communities of interest: Toms River, Lakewood, Freehold

Chris Smith seemed safe already, even with Democratic parts of Mercer and Burlington Counties inside his district. He lives in the Democratic parts of the old district. I removed his home from the district and placed it in the 7th. He would probably not mind moving though as long as his district is safer. I increased McCain’s percentage from 52% to 57% by removing most of the Democratic areas along the Delaware River and adding more Republican areas in Monmouth County. Smith should have absolutely no problem here. Status is Safe Republican.

Northern New Jersey

Northern New Jersey

Northwest New Jersey

Northwest New Jersey

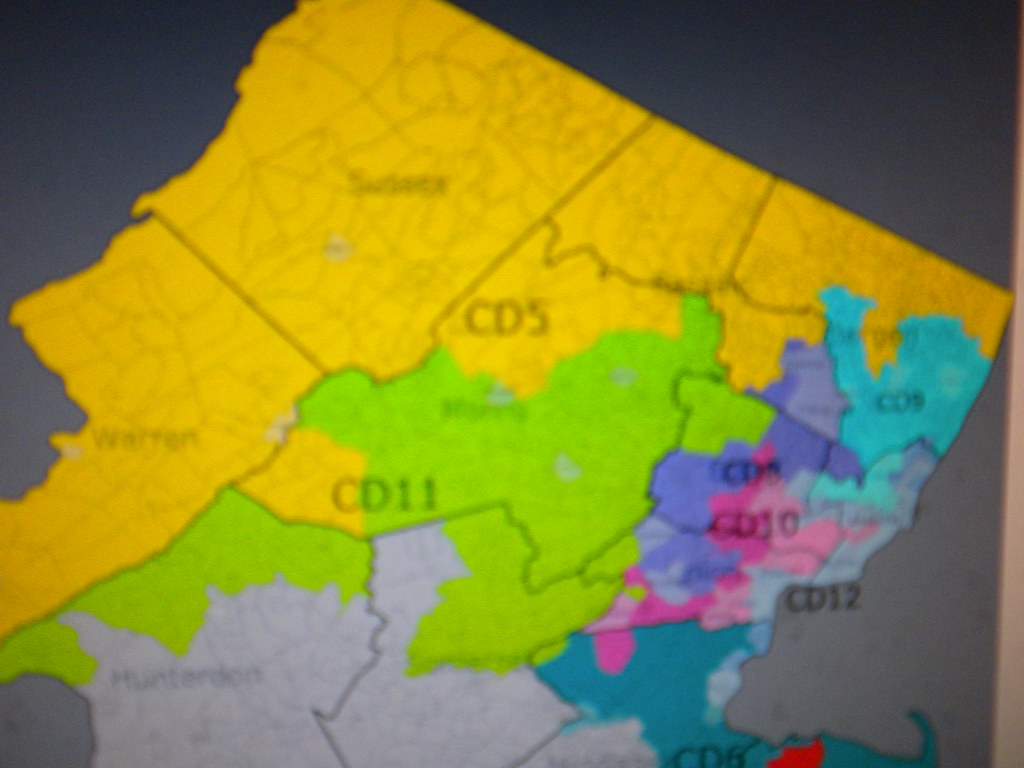
District 5 Scott Garrett (R) Wantage

Demographics: Hispanic 6%, Asian 6%, 85% White

Partisan Data: Obama  McCain

Sussex       28840 44184 40%-60%

Warren       20628 27500 43%-57%

Morris       19274 26364 42%-58%

Passaic       35201 44572 44%-56%

Bergen       60808 76821 44%-56%

Total       164751 219441 43%-57%

Communities of Interest: Newton, Rockaway and Montvale

This district does not go through large changes but the few I made strengthen Garrett. I removed marginal towns in Bergen County such as Bergenfield and Ridgewood. I mostly did this because the 9th district needed room to expand. I added in some Republican townships in Morris County. I also kept Garrett’s home, Wantage in the district. Increasing the McCain percentage here should keep Garrett safe for until he retires. Status is Safe Republican.

District 6 Frank Pallone (D) Long Branch

Demographics: 11% African American, 13% Hispanic, 16% Asian and 58% White

Partisan Data:  Obama   McCain

Monmouth 62963 54210 54%-46%

Middlesex 102139 63016 62%-38%

Total        165102 117226 58%-42%

Communities of Interest: Edison, Asbury Park, New Brunswick

Pallone’s district gets a bit weaker. I removed Plainfield to give more African Americans to the 10th and since I tried to keep town boundries intact, I removed the small Democratic slice of Somerset County. I replaced it with Woodbridge and Edison which lean Democratic even though Christie barely won them. Still, Pallone is entrenched here and since the minority population is growing quickly here (the white population was 65% in 2000,) this district should grow more Democratic. Pallone should not have trouble. Status is Safe Democrat.

District 7 Rush Holt (D) Hopewell vs. Leonard Lance (R) Clinton

Demographics: 9% African American, 8% Hispanic, 13% Asian and 69% White

Partisan Data:  Obama   McCain

Mercer        80943 44967 64%-36%

Middlesex 66727 47797 58%-42%

Hunterdon 22211 28800 44%-56%

Somerset 44197 31149 59%-41%

Burlington 1005 1336 43%-57%

Total       215083 154049 58%-42%

Communities of Interest: Ewing, North Brunswick

This district may at first look like a sure win for Holt because he has represented his district since the 90’s and this district contains most of his old territory. Lance is a freshman but he is a moderate. He also ran a great campaign in 2008, winning against Linda Stender (D) by nine points in a district Obama barely carried. Stender was a good candidate and she almost beat Mike Ferguson (R) who formerly represented the 7th district in 2006. Also, the territory here is less Democratic than it looks with high income independents who swung heavily toward Christie in the Gubernatorial race last year. About the areas in the district, I had to remove Trenton because I think Christie would never sign a plan putting Lance in the same district as Trenton. Still, the district is Democratic with other parts of Mercer County as well as Democratic areas in Middlesex County. Overall, this should be a tough battle but Holt should win. Status is Lean Democratic.

Urban New Jersey

Urban New Jersey

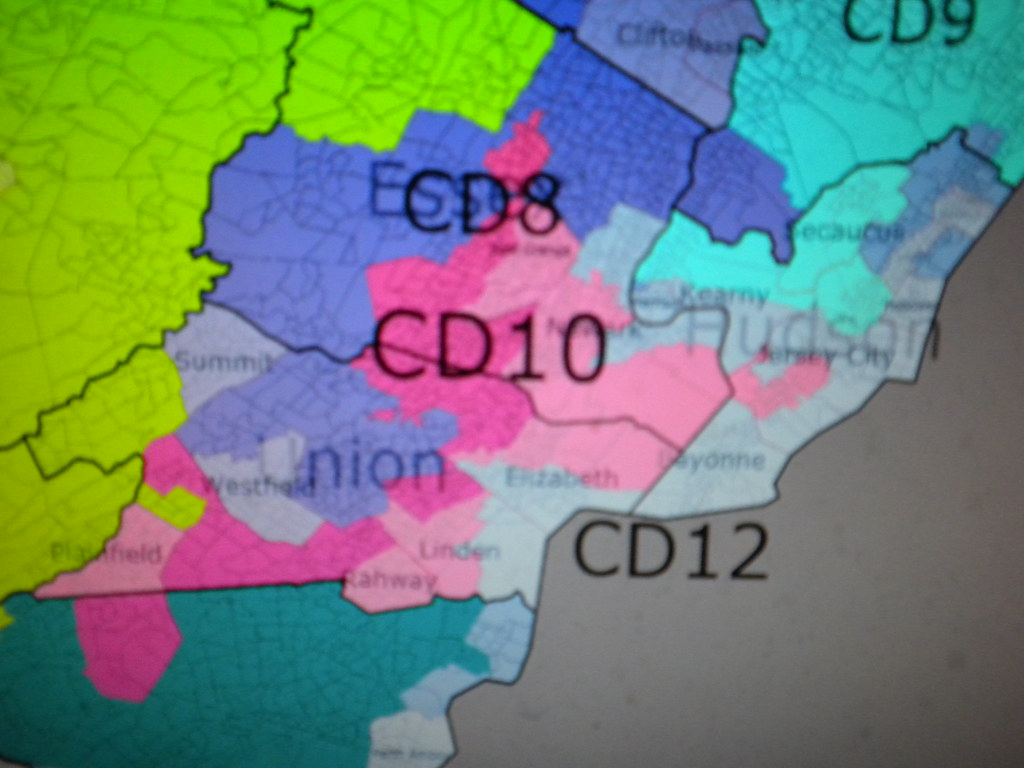
8th District Bill Pascrell (D) Paterson

Demographics: 11% African American, 29% Hispanic, 7% Asian and 53% White

Partisan Data: Obama      McCain

Passaic       78056   27980 74%-26%

Essex 70,000 (+- 1,000)42,000 (+-1,000)62%-38%

Union 37,000 (+-1,000) 35,000 (+-1,000)51%-49%

Bergen       7888  8031         50%-50%

Total 193,000 (+-2,000) 113,000(+-2,000)63%-37%

Communities of Interest: Westfield, West Orange, Paterson, Clifton

I had to split some towns in this district so the vote totals are not exact. Overall, his district gets more Democratic by a few points. I removed all the Republican parts of Passaic County, leaving only Paterson, Clifton, Passaic and a few small Democratic suburbs. Obama won 74% of the vote in the 8th district’s part of Passaic. I added most of western Union County which Obama and McCain split but most of the time, Republicans should win that area. I also added a slice of Bergen County which is also split between Obama and McCain. These changes should not affect Pascrell much because Paterson and neighborhoods in Essex County keep this district strongly Democratic. Status is Safe Democratic.

9th District Steven Rothman (D) Fair Lawn

Demographics: 7% African American, 20% Hispanic, 16% Asian and 56% White

Partisan Data: Obama      McCain

Bergen       154063  100073 61%-39%

Hudson   26,000 (+-1,000)13,000(+-1,000)67%-33%

Total 180,000 (+-1,000)113,000 (+-1,000)62%-38%

Communities of Interest: Jersey City, Englewood, Hackensack, Garfield

Rothman’s district gets a touch more Republican but does not make many changes. I gave the district some northern Bergen County suburbs such as Bergenfield and Tenafly which lean Democratic. The only areas I removed were Fairview and North Bergen which are heavily Democratic. These changes should not affect the composition of the district strongly. Status is Safe Democratic.

10th District Donald Payne (D) Newark

Demographics: 55% African American, 17% Hispanic and 23% White

Partisan Data: 82% Obama, 18% McCain

Communities of Interest: Plainfield, Rahway, Linden, Elizabeth, East Orange, Newark

Since I split most of the towns in the district, I decided to just estimate the partisan data. Also, Payne’s district changes a bit. I did not remove many areas from it but I added Plainfield and the marginal Union County suburbs for a few reasons: Plainfield has an African American majority and since the 10th is New Jersey’s African American majority district, I decided it should be included. Also, the 10th helps shore up the 8th by taking in some marginal suburbs. I am not sure if the New Jersey legislature would go for this but since it would help keep the 10th African American majority, they would go for it. The district still remains heavily Democratic. Status is Safe Democratic.

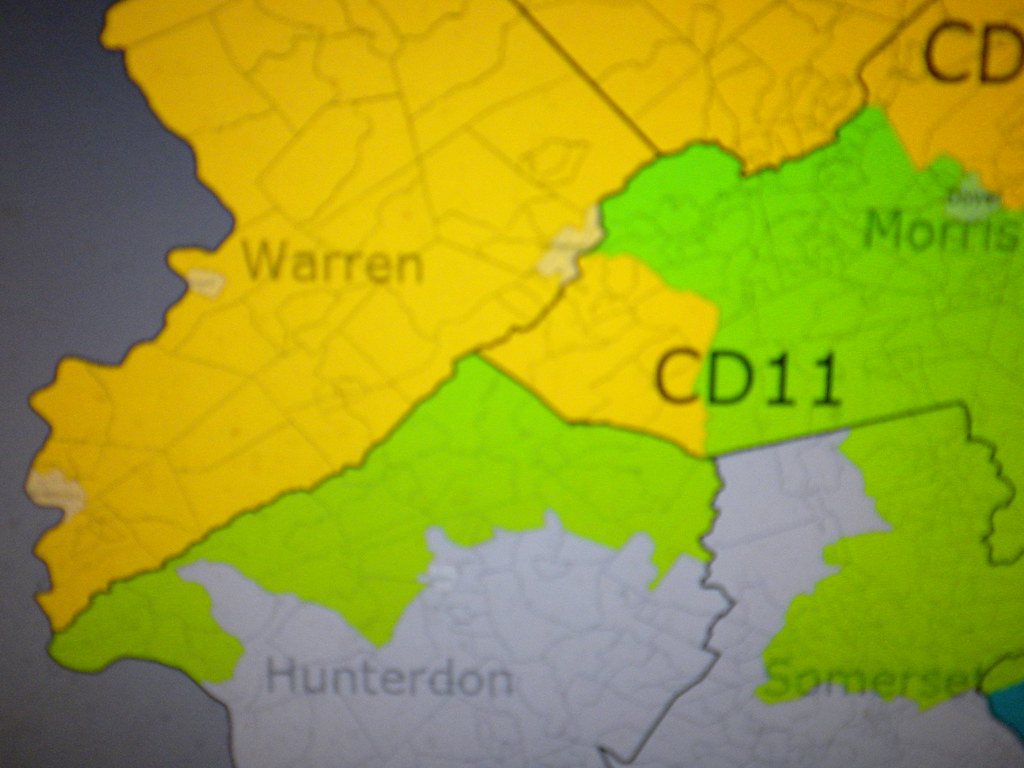
11th District Rodney Frelinghuysen (R) Harding

Demographics: 11% Hispanic, 9% Asian, 75% White

Partisan Data:  Obama   McCain

Morris        93001 105967 47%-53%

Somerset 35121 38936 47%-53%

Hunterdon 7565 10292 42%-58%

Middlesex 2837 3185 47%-53%

Union        8295 9195 47%-53%

Essex        15347 17252 47%-53%

Total       162166 184827 47%-53%

Communities of Interest: Dover, Morristown

I weakened Frelinghuysen a bit by removing all of Republican Sussex and Warren Counties. I also removed parts of Morris County too. The new areas I put in the district are mostly in Somerset, Union and Essex Counties. The new areas are marginal but Obama overperformed in most of the district so Frelinghuysen should still be very safe. Status is Safe Republican.

12th District Albio Sires (D) West New York

Demographics: 10% African American, 53% Hispanic, 7% Asian, 30% White

Partisan Data: Obama 76% McCain 23%

Communities of Interest: Linden, Elizabeth, Jersey City, Hoboken, Newark

Since I split too many towns in this district, I had to estimate the partisan data. Overall, the district experiences few changes. I added all of North Bergen as well as Fairview in Bergen County. I also added a few neighborhoods in Elizabeth but besides this, I made few changes. Sires’s district gets more Hispanic and he remains safe. Status is Safe Democratic.

The 2010 Mid-Term elections, part 5: Vulnerable GOP Seats

On my diary titled “The 2010 Mid-Term Elections, part 4:  the House of Reps”, I polled SSP nation on how many seats (net) the Democrats would lose in the 2010 mid-term elections.  Currently, the results are as follows:

11-20 seats:  11 votes

21-30 seats:  7 votes

31-40 seats:  4 votes

41-50 seats:  2 votes

I decided to compute the average number of seats in the House that the Democrats will lose (net) based on my poll results.  Since it was more practical to ask SSP readers a range of seats that would be lost as opposed to a specific number, I’m using a median average for each range.  This means that if you voted for 11-20 seats lost, I’m counting your specific number as 15 (and accordingly 21-30 seats will be 25, and so on).

Based on the above results, SSP nation believes that the Democrats will lose (net) 24 seats in the House.  Since this is not entirely accurate, a more reliable range to consider is that we will lose (net) 22-27 seats.  My original model showed that we would lose 30-35 seats, so on average SSP nation is more optimistic than my hypothetical election model.

I would like to determine the number of seats we will lose in 2010, but to get that number I’m interested in how many Republican seats will switch over to us in 2010.  Listed below are 4 seats that I think we can (and probably will) win in November.

(1)  LA-02.  Cao may be a moderate, but this is a strong Democratic district.

(2)  DE-AL.  Carney is a strong candidate and should easily win.

(3)  IL-10.  This is an open seat in a moderate Democratic district.

(4)  PA-06.  Gerlach was to run for Governor, now he’s running for his current seat.  Moderate blue district.  A flip-flop may not go over too well.

There are several other seats that could come into play.  Several of the California districts (CA-03, CA-44, CA-45, CA-50), WA-08, FL-12, MI-11, SC-02, OH-12, and MN-03.  These districts are vulnerable for various reasons, most notably that the district is trending blue or that the Republican Rep is a loose cannon.  Democratic obstacles in these districts include (1) the power of incumbency, (2)quality of our candidates, (3)the national momentum towards the Republicans, and (4) fundraising (Note: this includes the size of any DCCC contributions for a specific district).

Please vote on my poll below.  I’m very appreciative of your comments, so please join in!  

By what margin will Bob Shamansky win?

View Results

Loading ... Loading ...

Exploring the Most Republican Place in America: Part 2

This is the second part of two posts analyzing the Texas panhandle, a rock-hard Republican stronghold. It will focus upon two quite unique counties. The first part can be found here.

Exploring the Most Republican Place in America

Strange Counties

Two counties are labeled in the above map: Cottle County and King County. This is the case because the two are the sites of several unique and quite inexplicable voting patterns. One example: although the counties are located beside each other, their two patterns can be characterized as polar opposites.

More below.

Demographically, however, Cottle and King could not be more similar. Both are extremely thinly populated (King County contains less than 500 hundred residents) and fairly poor. These places literally define the saying “in the middle of nowhere.” In 2008, both Cottle and King were similarly favorable to Republicans: Cottle gave Senator John McCain 72.20% of the vote, while King – well, I’ll get to King in a moment.

Things weren’t always this way, however. For a long, long time Cottle County constituted a bastion of Democratic strength in the middle of nowhere. This was all the more remarkable given its deep-red neighbors compared to the sheer stubborn determination of one Cottle County to vote Democratic. In election after election, as Democrat after Democrat was broken in Texas (and sometimes the nation as well), this little county reliably ended up in the blue county. Most remarkably, the county voted (by a margin numbering less than one percent) for Senator George McGovern, a Democratic candidate so weak that not a single county voted Democratic in 20 states that year. Mr. McGovern was adept at losting Democratic strongholds, many in far more liberal territory than the Texas panhandle – and yet Cottle County still went blue in 1972. In fact, when Cottle County voted for Governor George W. Bush in 2000, this constituted its first time ever voting Republican.

Photobucket

If Cottle County epitomized Democratic strength, King County represents the pillar of modern-day Republicanism. In 2008, it constituted the single most Republican county in the nation; 92.64% cast the ballot for Senator John McCain, 4.91% for President Barack Obama. CNN even ran story about King County’s love affair with Republicans, which mainly seems based upon evangelical faith and traditional small-town conservatism.

In and of itself this is not so strange; the puzzling part comes when one looks to the 2008 Democratic primary. A total of 27 people named one Barack Obama as their choice – yet on November 4th only 8 did so. This means that at least 19 people were motivated enough to endorse Mr. Obama in March and then changed their minds or sat out the election. More cynically, one might read this as a calculated endorsement designed to wreak havoc upon the opposing party – but then why vote for Mr. Obama, when supporting Senator Hillary Clinton would prolong Democratic suffering?

Photobucket


The Panhandle and the Future of Texas Politics

Today, the voters in the Texas panhandle are quite hostile to liberalism in general. They may have supported Democrats in the past, but they will most likely not do so in the forseeable future (and if the Demcoratic Party changes enough to naturally appeal to small-town conservatives in the Texas panhandle, it probably ought to change its name to “Republican.”)

The Texas panhandle may be interesting for analysis, but the future of both parties does not lie there. In total, only two percent of the state’s population resides in the panhandle. Rather, the heart of Texas lies about the great metropolitan areas surrounding its cities – Dallas, Fort Worth, Houston, Austin, and San Antonio. There Democrats are rising, but Republicans still are dominant – the opposite situation from half-a-century ago.

–Inoljt, http://mypolitikal.com/

RI-01: AP Source Says Patrick Kennedy Will Retire

Huh, wow:

A Democratic official says Rep. Patrick Kennedy has decided not to seek re-election for his seat representing Rhode Island in the U.S. Congress.

The official spoke to The Associated Press only on the condition that his name not be used because he was not authorized to speak ahead of the official announcement. …

Patrick Kennedy has been in and out of treatment for substance abuse since crashing his car outside the U.S Capitol in 2006. Still, he has been comfortably re-elected twice since then, after making mental health care his signature issue in Washington.

Kennedy sought treatment as recently as the middle of last year, so his recurring problems may be a reason for his decision to depart. It’s also worth noting that a recent poll pegged his re-elects at a not-so-hot 35-28. Republican state Rep. John Loughlin had already announced a challenge to Kennedy; he has $110K in the bank. Presumably, many names will line up on the Dem side, as this D+13 district gave 65% of its vote to Barack Obama and 62% to John Kerry.

RaceTracker Wiki: RI-01

NV-Sen: Krolicki Won’t Run

Harry Reid can rest a little easier. Republican Lt. Governor Brian Krolicki won’t run in the already-overstuffed Republican primary for the right to challenge him, and will instead go for another term as LG.

Lt. Gov. Brian Krolicki has decided not to run for the U.S. Senate because it would have pitted him against strong Republican primary opponents and hurt the party’s efforts to defeat Sen. Harry Reid, several GOP sources told the Las Vegas Review-Journal today.

Krolicki was making an announcement later today, saying he will run for re-election instead.

Or is Harry Reid breathing any easier? The most recent Rasmussen poll indicated that, at this point, Krolicki actually didn’t match up against Reid quite as well as some of the Republicans (Danny Tarkanian, Sue Lowden) who haven’t been elected (or indicted) before, but who’ve been in the race long enough to build up some name rec. The question remains, though, whether whichever one of these newbies emerges from the primary has the electoral chops to exploit Harry Reid’s weaknesses enough to overcome his mightily-funded, battle-tested machine.

RaceTracker Wiki: NV-Sen