This diary presents a 27-seat map for Florida using the new ACS data and the guidelines of the newly passed Fair Districts amendment. It goes very heavy on respecting local boundaries, sometimes to the detriment of minority districts; a couple of alternate area maps are presented at the end to rectify that. My hope is that this map represents the most extreme fidelity to local boundaries that’s possible, in order to serve as a baseline for other proposed maps. Please let me know if you think there’s someplace that fidelity can be enhanced.
Florida’s gaining two seats. It’s pretty easy to say that one is FL-19, based in Indian River, St. Lucie, and Martin Counties on the south central Atlantic coast. The second one is harder to discern; I think it’s best to say that the old FL-03 is gone and has been replaced by the new districts in Orlando and Jacksonville.
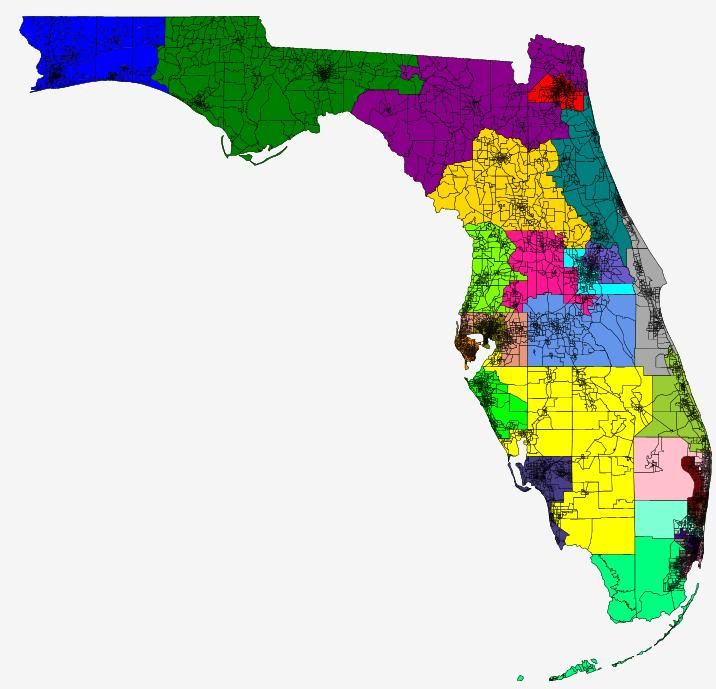
As drawn, the map renumbers all of the districts from northwest to southeast. Here’s an overview map.
Fair Districts
For reference, here’s the ballot summary of the Fair Districts law:
Congressional districts or districting plans may not be drawn to favor or disfavor an incumbent or political party. Districts shall not be drawn to deny racial or language minorities the equal opportunity to participate in the political process and elect representatives of their choice. Districts must be contiguous. Unless otherwise required, districts must be compact, as equal in population as feasible, and where feasible must make use of existing city, county and geographical boundaries.
Not taking political ramifications into account was actually easy. Florida’s a pretty difficult state to get elections information for. So much so that even after drawing the map, I’m having a hard time assessing it. My comments are based on existing PVIs as listed on Wikipedia and the map from Inoljit’s recent diary on the 2010 governor’s race. Feedback from those with knowledge about Florida’s politics is greatly appreciated.
Following existing local boundaries has a pretty dramatic impact on the overall map. Currently, the 10th district in Pinellas County is the only district entirely within one county. Under this new map, there are nine districts that are wholly within a single county: two each in Miami-Dade and Broward and one each in Palm Beach, Pinellas, Hillsborough, Orange, and Duval. Overall, I’m happy with my map’s compactness and respectfulness of local lines, although I’d be happy to see other attempts. Note that the only boundaries I had references for are the county lines and the incorporated cities lines available in the old version of the App. I don’t even know if Florida has something equivalent to midwestern townships, so if it does, I wasn’t able to take them into account.
Protecting the opportunities of racial and language minorities was a more difficult aspect of this map. My lay understanding of the current state of VRA law runs something like this: minorities that can be given compact districts where they’re 50% or more of the population must be given them, but it’s unconstitutional to “gerrymander” together unwieldy districts for them — although considering that NC-01 apparently passes muster, I’m not quite sure how to tell what’s too unwieldy. There’s also, I suppose, the question of to what extent the Fair Districts language goes beyond what the VRA requires.
For my main map, I decided that both Brown’s and Hasting’s districts were too unwieldy to be maintained. Dismantling Hasting’s district is probably the worse call. While ugly, it could be drawn at more than 50% African American while staying entirely within two counties; anything similar to Brown’s current district wouldn’t pass the 50% mark and would require a whole lot of county-splitting. At the same time, however, breaking up Hasting’s district allows for four of the six districts wholly or partially in Broward and Palm Beach to be majority-minority (although three of those are white-plurality.) Constructing something similar to Hasting’s current district causes four of those six districts to become white majority.
The Decision Points
Putting that another way, I really consider myself to have made only three significant decisions on this map – everything else seemed more or less dictated by the geography and demographics. Now, that might not be an accurate self-perception, but that’s how I feel about it.
Two I’ve already covered:
1) Will the plurality African American district in north Florida be maintained?
2) Will the majority African American district in Palm Beach and Broward Counties be maintained?
And then there’s the previously unforeshadowed:
3) Polk and Osceola Counties together are 150k too many people for a district. Which 150k people are they and to which district are they being attached?
For my main map, the answers are “no”, “no”, and “Kissimmee and environs are going north to the western Orlando suburan/exurban district”. I’ll talk more about this third choice in the district-by-district descriptions.
At the end of the diary, I’ve included alternate versions that look at the other answers to those questions. The map that switches the first answer to a yes is based on powera’s diary from a few weeks ago, with a Jacksonville-Tallahassee majority-minority district. The map that switched the second answer to a yes is based on the existing FL-23, altered to better suit the Fair Districts requirements. And then the final map changes the answer to the third question to “Lakeland and environs are going north and west connecting to a district in Pasco County”.
District-by-district description is after the jump.
Monroe & Miami-Dade
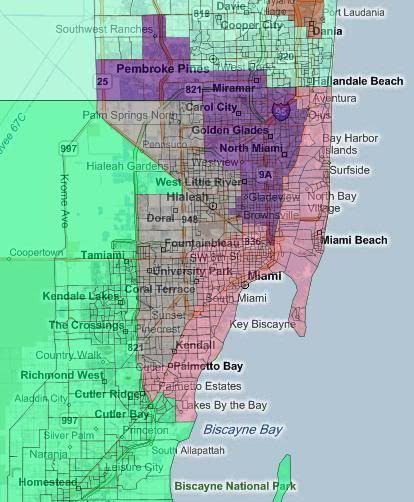
FL-24 – Indigo – North Miami/Miramar (VRA: B 54%, H 30%, W 13%)
FL-25 – PaleVioletRed – Miami/Miami Beach (VRA: H 61%, W 31%)
FL-26 – Gray – Hialeah (VRA: H 83%, W 12%)
FL-27 – SpringGreen – Monroe/Outer Miami-Dade (VRA: H 62%, W 24%, B 11%)
FL-27 takes in all of Monroe County and then enough of Miami-Dade to make up the balance. This roughly corresponds to the area west of the Turnpike and south of SW 216th St. The African-American blocks in northern Miami-Dade form the core of FL-24, spilling over into southern Broward. FL-25 takes in the rest of Miami proper that’s not in FL-24, and then snakes up and down the coast to hit population equality. FL-26 takes up the balance of the county.
Broadly speaking, New-27 is Old-25, New-26 is Old 21, New-25 is Old-18 and New-24 is Old-17.
To the best of my scanty ability to tell, I haven’t significantly changed the partisan of any district. MassGOP had a recent comment about how the area south of Miami is Demoractic-heavy and split up perfectly amongst the existing districts. This map (quite inadvertently) sustains that. I suppose that Ros-Lehtinen might face some trouble, since she’s picking up territory north of Miami Beach that I would assume is in Wasserman Schultz’s district for a reason. Diaz-Balart and Rivera won’t live in their districts, but they don’t now anyway. Wilson has a potential problem in that she would now have Hastings as a constituent (and therefore possible primary rival).
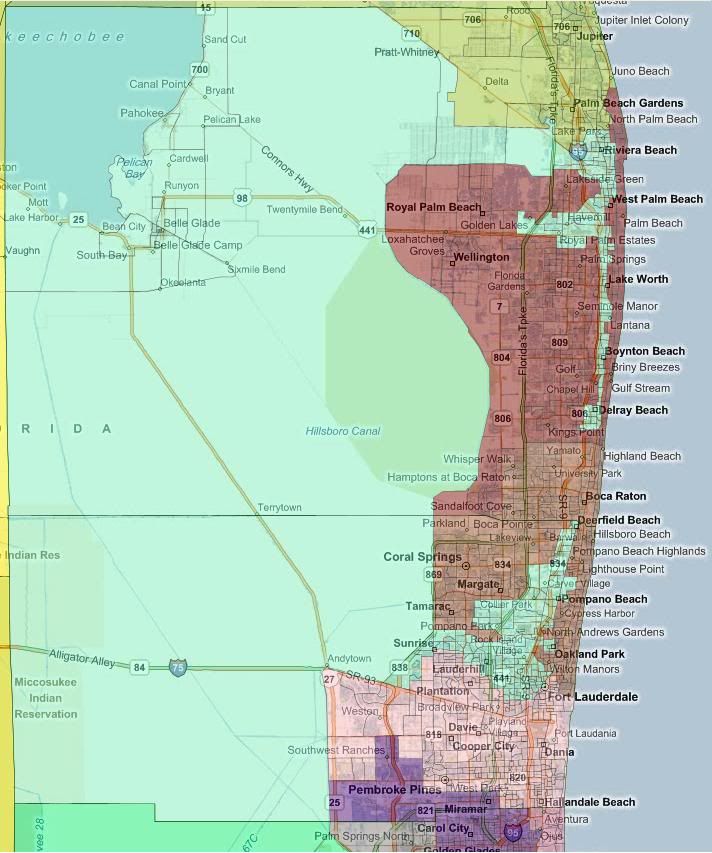
Broward and Palm Beach
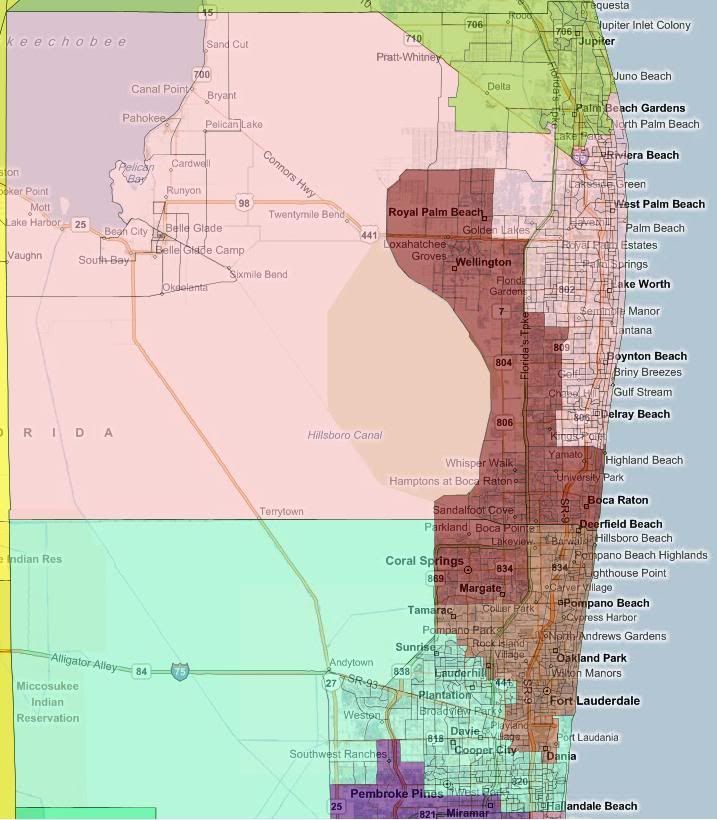
FL-20 – Pink – Delray Beach/Boynton Beach/West Palm Beach/Pahokee (VRA: w 49%, B 25%, H 23%)
FL-21 – Maroon – Coral Springs/Boca Raton/Wellington (VRA: W 73%, H 14%)
FL-22 – Sienna – Ft Lauderdale/Pompano Beach/Deerfield Beach (VRA: W 48%, B 33%, H 16%)
FL-23 – Aquamarine – Plantation/Davie/Hollywood (VRA: W 49%, H 28%, B 17%)
Starting at the extreme south, there’s the rest of FL-24, taking in Miramar and parts of Pembroke Pines. It took experimentation to figure out how to arrange the boundaries of the rest of the incorporated localties to best fit the congressional district size while keeping all three districts minority-majority. Eventually, I hit upon this arrangement of FL-23, which to the extent that the census blocks match municipal boundaries, doesn’t involve any boundary breaking. I couldn’t find a similar arrangement for FL-22, so it ended up picking up a few arbitrary blocks of Margate from FL-21. The arrangement between between FL-20 and FL-21 is to maximize the minority population of FL-20 while respecting local lines. After the creation of these four districts, there’s about 160k leftover population in Palm Beach Gardens/Jupiter that gets sent up to FL-19.
The districts in this area were previously so intertwined that I’d have a hard time mapping them onto the new ones, but if forced, I would say that New-23 is Old-20, New-22 is Old-23, New-21 is Old-19 and New-20 is Old-22.
I believe that all four of these districts would have PVIs of at least D+8, which is sad for West. Hastings has been drawn into FL-24 with Wilson. West has been drawn into FL-23 with Wasserman Schultz. I’m guessing that Hastings would seek to represent FL-22 if he tried to stay in office, but that’s just a guess – I suppose he could take on Wilson. About West, I have no clue. Deutch lives in FL-21. FL-20 is open.
Southwest Florida
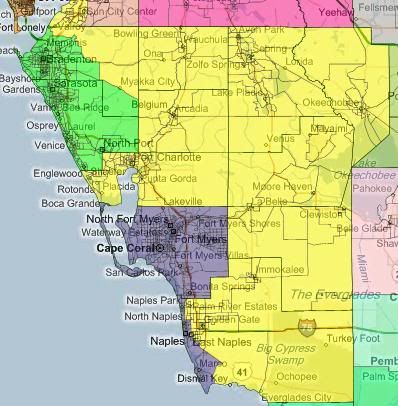
FL-16 – Lime – Manatee County/Sarasota County (VRA: W 81%, H 10%)
FL-17 – DarkSlateBlue – Lee County/Naples (VRA: W 74%, H 16%)
FL-18 – Yellow – the rest of southwest Florida (VRA: 69%, H 22%)
The ten counties that I’m calling Southwest Florida (Charlotte, Collier, DeSoto, Glades, Hardee, Highland, Lee, Manatee, Okeechobee, and Sarasota) have about 50k too few people for three districts. Hillsborough and Pinellas Counties together came up about 55k too many for three districts, so that’s where the disparity gets made up. Sarasota County and Manatee County together are about 4k over a district, so that’s where FL-16 comes from. Lee County, on the hand, is about 100k short of being a district. I couldn’t find a 100k subdivision of Charlotte County that didn’t break municipal lines, so Lee’s FL-17 ran down the coast of Collier County through Naples to Marco Island. FL-18 takes up the rest of Southwest Florida, plus about 50k in and around Sun City Center in Hillsborough County.
Roughly speaking, New-18 is Old-16, New-17 is Old-14, and New-16 is Old-13.
All three of these districts should continue to have Republican PVIs. FL-16 should be somewhat less Republican than it was previously, since it’s losing rural territory and gaining the minority-heavy parts of Brandenton. I’d expect FL-17 to be about the same, which FL-18 is probably more Republican than previously, since it’s no longer involved with St. Lucie County. Buchanan and Mack continue to live in their districts. Rooney lives in what’s essentially a new district in FL-19, so FL-16 is open.
Hillsborough Pinellas
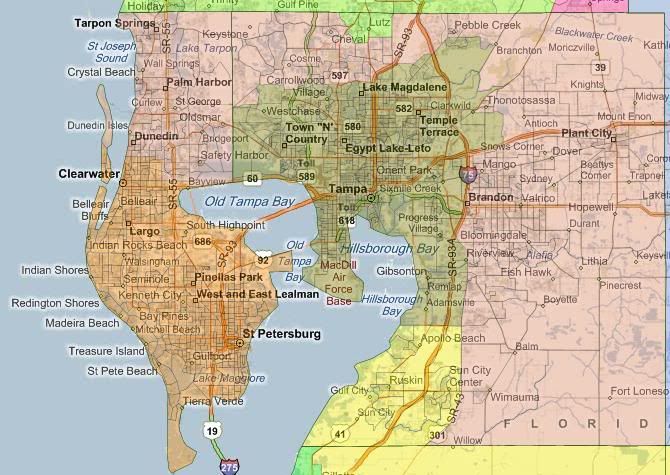
FL-13 – DarkSalmon – Outer Hillsborough/Pinellas (VRA: W 74%, H 14%)
FL-14 – Olive – Tampa/inner suburbs (VRA: W 49%, H 25%, B 21%)
FL-15 – DarkOrange – St. Petersburg/Clearwater (VRA: 76%, B 12%)
FL-13 and FL-14 pretty much drew themselves. FL-13 starts at the southern tip of Pinellas County and works north, taking in most but not all of Clearwater, due to population equality concerns. FL-14 took in all but the very north reaches of Tampa (since those were needed to maintain contiguity for FL-15), and then focused on taking in as many minorities as possible to make FL-14 (just barely) minority-majority. Even after donating 50k people south to FL-18, the combined three districts are about 5k over populated. Those are donated northwards to FL-11. The exact blocks chosen for donation are entirely arbitrary – any group along the border between FL-11 and FL-13 that maintains population equality could be used.
Roughly speaking New-15 is Old-10, New-14 is Old-11, and New-13 is Old-9.
Bilirakis, Young, and Castor are all fine from a residency standpoint. I imagine, although I’m not sure, that all three Representatives have been hurt from PVI standpoint. Castor has lost the minority parts of Brandenton and St. Petersburg; Young has taken on all of St. Petersburg; and Bilirakis has lost all of his territory in Republican Pasco County. Castor and Bilirakis have some room to maneuver; but Young was already in an R+1 district. Another few points to the Democrats could flip the seat, especially if Young retires.
Central Florida

FL-08 – SlateBlue – Seminole County/Northeast Orlando suburbs (VRA: W 64%, H 20%, B 10%)
FL-09 – Cyan – Orlando (VRA W 44%, H 25%, B 25%)
FL-10 – DeepPink – Kissimmee/West Orlando suburbs/Lake County/Sumter County/western Pasco County (VRA: W 67%, H 20%)
FL-11 – Chartreuse – Citrus County/Hernando County/eastern Pasco County (VRA: W 85%)
FL-12 – CornflowerBlue – Polk County/Osceola County minus Kissimmee (VRA: W 66%, H 18%, B 13%)
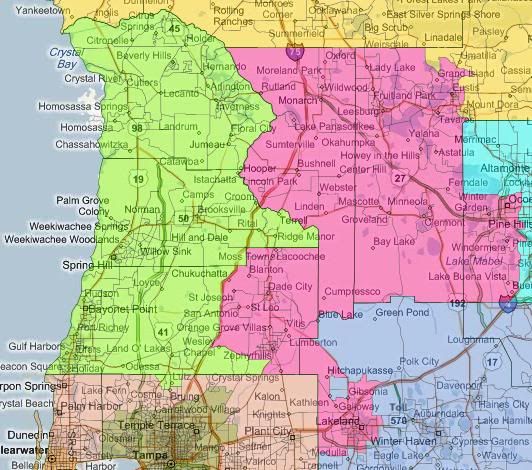
Starting at the southern part of this region, Polk and Osceola together were almost 150k over populated for a single district. I briefly looked at separating them, but that resulted in far more ugliness than keeping them together entails. This resulted in the choice I referred to in my intro. There are two ways that I found to take 150k people out of the district in a way that respects local lines: attach Kissimmee and Celebration to an Orlando-based district or attach Lakeland to a Pasco-based district. I tried both and ultimately choose the first option because it better fit my subjective impression of “compactness”. The number of county splits ended up being the same either way, if I counted correctly. It was just a matter of where the county splits are. The main detriment (if it is one) is that the Disney Empire doesn’t end up in the same district as Orlando-proper.
After that, the rest of Central Florida fell into place. Coastal FL-12 takes up Citrus and Hernando Counties along with western Pasco County (roughly speaking, the area west of I-75). On the opposite side of the region, FL-09 picks up Orlando proper, along with minority-heavy areas to the east, west, and northwest – all within Orange County. Meanwhile FL-08 combines Seminole County with enough of the whiter suburbs to the east of Orlando in Orange County to make a district. It took some playing around to figure out how best to draw those while respecting local lines. In the end, the only infidelity that I know of is a couple of blocks that straddle Ocoee and Apopka. Finally, FL-10 picks up the leftover areas of the region: Kissimmee, Winter Garden-Ocoee, Sumter County, eastern Pasco County, and most of Lake County. (All of Lake County would have been 50k too many. I moved the northeast corner of the county up to FL-05.)
Roughly speaking, New-12 is Old-12, New-11 is Old-05, New-10 is Old-08, New-09 is one of the new districts, and New-08 is Old-24.
Politically, I suspect that all of these districts, except for the new majority-minority FL-09, are likely Republican. Ross and Nugent are okay from a residency standpoint. Mica now lives in the new FL-08. Webster and Adams are both listed as Orlando, so they’re both looking for new districts to run in – possibly the new open FL-10.
Atlantic Coast
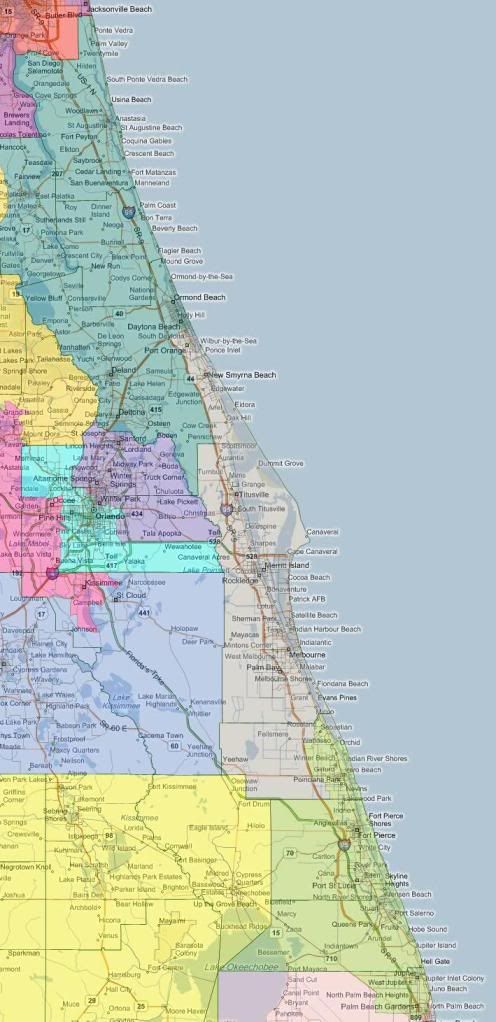
FL-06 – Teal – St. Johns County/Flagler County/eastern Putnam County/most of Volusia County (VRA: W 75%, B 13%)
FL-07 – DarkGray – Space Coast/New Smyrna Beach/Titusville/Melbourne (VRA: W 81%)
FL-19 – YellowGreen – Indian River County/St. Lucie County/Martin County (VRA: W 76%, H 11%, B 10%)
Three districts hug the Atlantic Coast. Starting with the new district on the south central coast: FL-19 takes in the rest of Palm Beach County, along with St. Lucie, Martin, and all but 9k people in Indian River (which are donated north to FL-07.) FL-07 takes in those 9k in Indian River, all of Brevard, and the strip of Volusia east of I-95 and south of Daytona Beach. FL-06 then takes in in the rest of Volusia, along with Flagler and St. Johns. At that point, it’s about 50k short, so it moves inland to take about the eastern half (by area, more like two-thirds by population) of Putnam County,
Roughly speaking, New-19 is a new district, New-07 is Old-15, and New-06 is Old-07.
Politically, I’m pretty sure that these are all safely Republican; I’m least certain of that with regards to FL-19. Rooney (in the new FL-19) and Posey (in the new FL-07) have districts to themselves. The new FL-06 is open.
North Florida
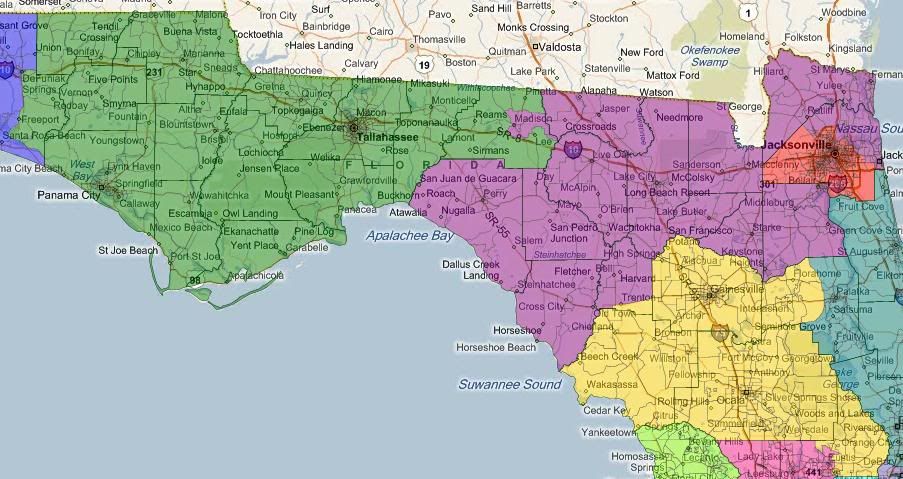
FL-01 – Blue – Western Panhandle/Pensacola (VRA: W 76%, B 14%)
FL-02 – Green – Eastern Pandhandle/Tallahasee/Panama City (VRA: W 68%, B 24%)
FL-03 – DarkMargenta – Suwanee River/Jacksonville suburbs (VRA: W 78%, B 13%)
FL-04 – Red – Jacksonville (VRA: W 55%, B 33%)
FL-05 – Gold -North central Florida/Ocala/Gainsville (VRA: W 75%, B 13%)
This time starting in the west. The Pensacola-based FL-01 shrinks by three counties, taking in only the westernmost three counties and about 42k of Walton’s 50k. FL-02 therefore also shifts west, losing all but 10k of its population east of Jefferson County. Skipping down to the southern part of the region, FL-05 takes in all of Levy, Marion, and Alachua Counties, plus the northeastern portion of Lake County. That leaves it about 3k short – I decided the southern block of Gilchrist makes the “compact” addition. FL-04 stays wholly within Duval County. This is probably the closest thing to a successor to the old FL-03, so in deference to that, I drew it as minority-heavy as possible. It’s still 55% white. The new FL-03 takes up the rest.
These are a bit more straightforward to map back onto the old districts: New-01 is Old-01, New-02 is Old-02, New-03 is Old-04, if New-04 is anything it’s Old-03, and Old-05 is New-06. All incumbents are fine from a residency standpoint. I’m much less sure about electorally. I would suspect that FL-02 has gotten more Democratic, since Leon County is a bigger proportion of its population. FL-03 is, of course, substantially more white that Brown’s current district. Duval as a whole is a Republican-leaning jurisdiction, so far as I can tell, but I’m not sure what it is once you’ve removed its whitest 170k worth of Census blocks.
Alternate Maps
Here are the three alternate scenarios I mentioned in the introduction: a majority-minority north Florida district, detaching Lakeland instead of Kissimmee from FL-12, and a majority-African-American Palm Beach-Broward district.
Minority-Majority North Florida
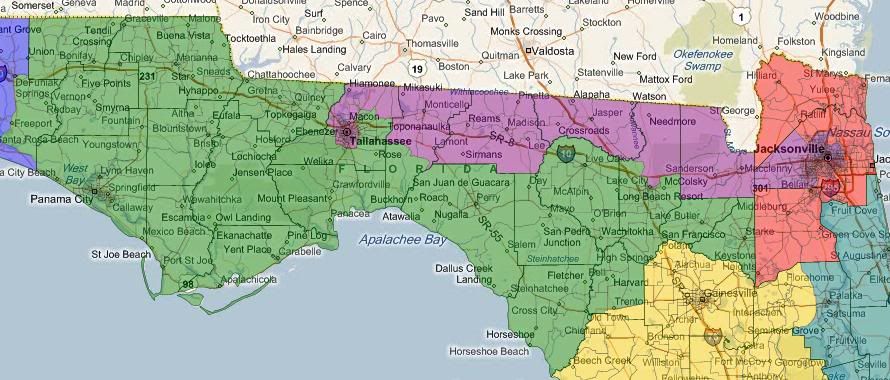
This involves shifting around the main map’s FL-02, FL-03, and FL-04 – everything else is unchanged.
ALT-02 – Green – Eastern Panhandle (VRA: W 74%, B 18%)
ALT-03 – DarkMagenta – Tallahassee to Jacksonville (VRA: W 49%, B 41%)
ALT-04 – Red – Jacksonville suburbs (VRA: W 77%, B 11%)
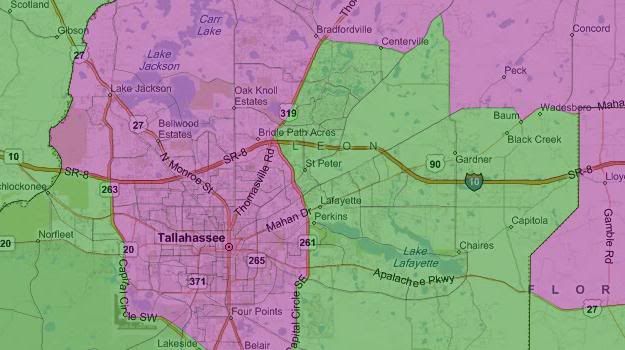
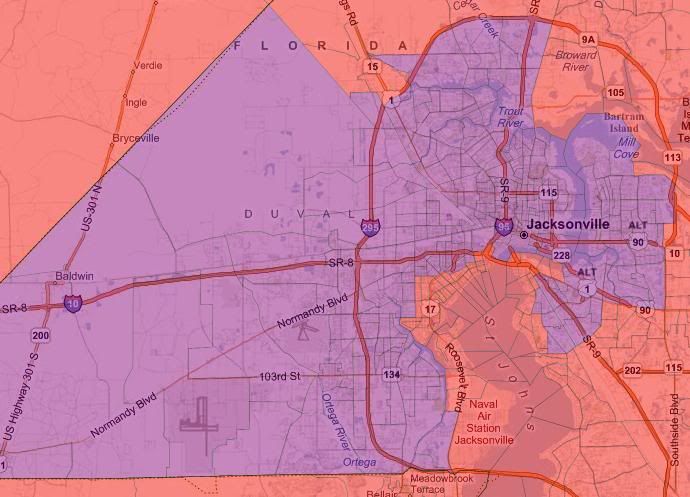
This is a bare-bones version of a north Florida majority-minority district, covering Tallahassee inside the Capital Circle highway, northern Leon County to connect eastward, all but the southernmost block of Jefferson County, all of Madison and Hamilton Counties, only the northernmost block of Columbia County to connect eastward, all of Baker County, and then much of interior Duval County, where I tried to strike a balance between compactness and minority-heaviness. ALT-02 takes in the area from Bradford County west. ALT-04 takes in the remainder.
ALT-03 could be made more minority; I just decided that the price wasn’t worth it. For example, Gadsden County, to the west of Tallahassee, is a 54% African American jurisdiction with a population of about 45k, but adding it would require sacrificing either the relatively clean lines in Leon County or the very clean line between Bradford and Clay Counties.
Here are closeups of Leon and Duval Counties.
Detaching Lakeland Instead of Kissimmee
It’s possible to detach Lakeland from Polk instead of Kissimmee from Osceola to make FL-12 work. This results to two subscenarios. Either way, the new ALT-12 has VRA stats of W 59%, H 25%, B 11%.
The simpler scenario is to just swap Lakeland and Kissimmee between FL-10 and FL-12.
This results in an ALT-08A with VRA stats of W 73%, H 12%, B 11%.
Alternatively, from that point, you could choose other county splits between FL-10 and FL-11. For example, you could consolidate Pasco into one district, picking up Lakeland and that little bit of leftover Hillsborough, leaving you about 65k short of a district. Splitting Hernando now instead of Pasco to get that 65k results in this.
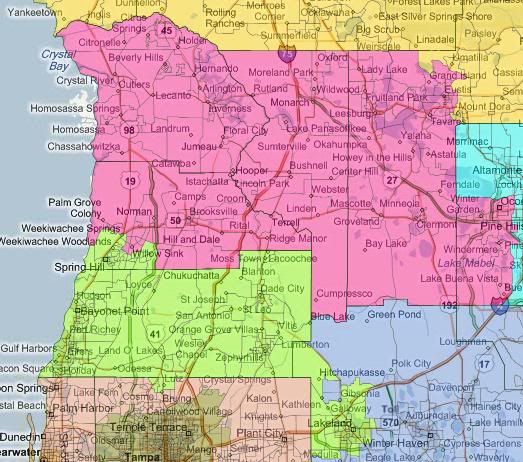
ALT-10B has VRA stats of W 79%, H 10%. ALT-11B has VRA stats of W 80%, H 10%.
Choosing between any of these three scenarios (the main and the two sub scenarios) is essentially arbitrary from a demographic standpoint. Without partisan motivation, explicitly disallowed by the Fair Districts standpoint, I’m not sure why you’d choose one over the others. I also have no idea which one of the three scenarios would be most favorable to Democrats.
Majority African American Palm Beach-Broward
It looks like this:
I swapped colors around for working purposes and forgot to put them back for display purposes, so for this map only ALT-20 is the light blue one and ALT-23 is the pink one. ALT-21 is the redder of the two browns; ALT-22 is the other district.
ALT-20 – VRA: B 51%, W 27%, H 19%
ALT-21 – VRA: W 67%, H 18%, B 11%
ALT-22 – VRA: W 72%, H 16%
ALT-23 – VRA: W 53%, H 28%, B 13%
Politically, I don’t think it matters. It mostly whether this district is legally required.
Summary
Since my grasp of Florida politics is not a firm as I’d like, this is pretty tentative. But the rough upshot is that I think that Fair Districts is worth about three districts to the Democrats: West’s, Young’s, and the new Orlando seat. Which I think is a pretty common view anyway.
The goal of this wasn’t to figure out the politics anyway. It was to try to figure out how few boundaries can be broken. Please let me know if you see anyway to improve the map on that score.


