Communism in Italy

This is the third part of a series on Communism in Western Europe; this section focuses on Italy in particular. The previous parts can be found here.

Photobucket

The Italian Communist Party (PCI) formed in 1921, as a break-away faction of the socialist party. In many respects, its early years were similar to those of the PCF. Like the French Communists, the Italian Communist Party (PCI) fared poorly in national elections, winning less than five percent of the popular vote. Its time to grow, moreover, was cut short by Benito Mussolini’s dictatorship; he outlawed the party in 1926.

In another parallel to their French colleagues, the Italian Communists (PCI) fought fiercely against the Nazis during WWII and won major acclaim for their efforts. After the war, the PCI took part in the new government, playing a major role in writing the new Italian constitution. As in France, however, America’s Marshall Plan curbed their influence; to gain access to U.S. aid, the Italian government kicked out the Communists. They would never again hold power in Italy.

Continued below.

Here the paths of the French and Italian Communists diverge. In France the Communist story is one of steady decline, until the PCF no longer constituted a viable political force. In Italy the story is different.
Photobucket

Before getting into it, however, another tale must be told – that of the 1948 general elections. This contest was the most important election in Italian history, pitting the Italian Communist Party (the PCI, allied with the socialists) against the Christian Democrats (Democrazia Cristiana, DC). It literally determined Italy’s side on the Cold War, whether it would ally with the United States or the Soviet Union. Many feared that if the Communists won, Italy would go red, never to turn back.

The election was fiercely fought; both sides were discretely funded by their respective superpowers. The Catholic Church came out strongly against the Communists (PCI), using slogans such as, “In the secrecy of the polling booth, God sees you – Stalin doesn’t.”

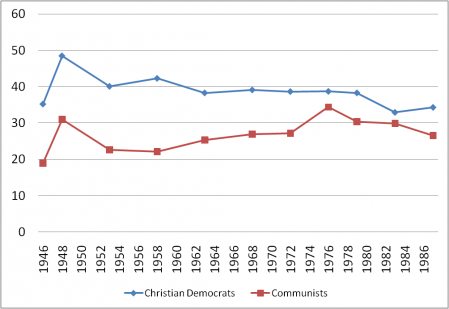
Christian Democracy (DC) blew away the Communists (PCI). While the PCI won a 31.0% vote share, their second-best performance ever, the Christian Democrats took 48.5% of the vote. Italy allied with the United States.

For nearly half a century thereafter, Christian Democracy governed Italy. The PCI never managed to win more votes than the Christian Democrats, although they continued to fare respectably in general elections.
Photobucket

Here a crucial distinction between the French Communists and the Italian Communists occurs: while the PCF gradually declined throughout the 50s to 70s, the PCI actually strengthened itself during this era. Unlike the French Communist Party, the PCI publicly and dramatically distanced itself from the Soviet Union. Instead, the party was the most vocal advocate of eurocommunism, a far different philosophy than that espoused by the Soviet Union.

Thus, the Italian Communist Party was perceived as more acceptable and moderate than other communist parties, and its share of the vote steadily increased. In 1976, they won 34.37% of the vote, their best performance in history and a mere 4.34% behind DC. The PCI achieved this result by doing “all they could to appear as a respectable, rather conservative party committed to sensible change by constitutional means…[and] emphasise how moderate, democratic and uncorrupt they were.”

In the end, however, the PCI was still Communist, irrevocably tied to the fate of the Soviet Union no matter how distant their ties. When the USSR fell, the Italian Communist Party was broken up – though, as in eastern Europe, many parties of Italy’s left have roots from the PCI. Within a few years, DC – its reason for existence now dead – imploded under a shroud of corruption scandals.

That was the end of the old system. Today, for better or for worse, one man – Silvio Berlusconi – dominates the political arena. Yet, even with the PCI long gone, Berlusconi still invokes anti-communism to win votes. The shadow of the PCI is long indeed.

–Inoljt, http://thepolitikalblog.wordpr…

The Strange Case of New Jersey

By: Inoljt, http://thepolitikalblog.wordpr…

The New Jersey governor’s election is less than two weeks away, and it deserves far more attention than I have been giving it. Nevertheless, I will now belatedly share some thoughts that have been stewing in my head.

Here is a snapshot of the race as of 10/25:

Photobucket

There are several unmistakable trends here. The challenger Attorney Chris Christie gains a double-digit lead over the incumbent, for fairly obvious reasons. Then, mysteriously, he proceeds to lose it. Incumbent Governor Jon Corzine’s share of the vote mostly remains flat but – and this is important – trends slightly upward. While the two main candidates blast each other, third-party candidate Chris Daggett draws support at an accelerating rate.

Mr. Corzine’s positive trend should encourage Democrats; it indicates that he is actually building support, not just tearing down Mr. Christie. In addition, expect Mr. Daggett to overperform on election day as he reaches viability. Normally, third-party candidates perform below their polling; this election, however, with both major candidates highly unpopular, constitutes anything but a normal situation.

The strangest and most interesting part of the campaign, however, has been the story of Mr. Christie.

More below.

He challenged an unpopular incumbent, under hugely favorable macropolitical conditions, and by summer had attained a double-digit lead. Then Mr. Christie’s support began sliding, a trend that continues to this day. He went from polling barely below 50% to polling barely below 40%.

I am at a loss to explain why this has happened. The fundamentals behind the race haven’t changed; the economy remains weak and Mr. Corzine much disliked. Scandal has not upended Christie; if anything, it has hurt Corzine more. Obviously the governor has run the better campaign, but campaigns generally do not erase double-digit leads.

Indeed, this race runs counter to a fundamental theme of politics: if a challenger of an unpopular incumbent attains a substantial lead, it is almost always a futile effort eroding the advantage. The unpopular incumbent – whether it be Herbert Hoover, Jimmy Carter, or Rick Santorum – will inevitably lose. In fact, I cannot name a single election in which a candidate with a double-digit edge, facing a disliked incumbent, has lost that edge barring major scandal.

Part of the answer may lay with Chris Christie himself. The man seems, plain and simple, a bad candidate. For some reason or other, the inhabitants of New Jersey just don’t like the guy. It’s the same problem that cursed John Edwards and Mitt Romney during the primaries. No matter how well-run their campaigns, no matter how good their ideas, people just wouldn’t vote for them. Christie perfectly fits this description – an irony, given that Republicans nominated him because he appeared a strong candidate.

The same, of course, could be said for Corzine; both nominees have tremendous weaknesses. That is why this race is so close less than two weeks before election day.

Communism in France

This is the second part of a series on Communism in Western Europe; this section focuses on France in particular. The third part (Italy) can be found here.

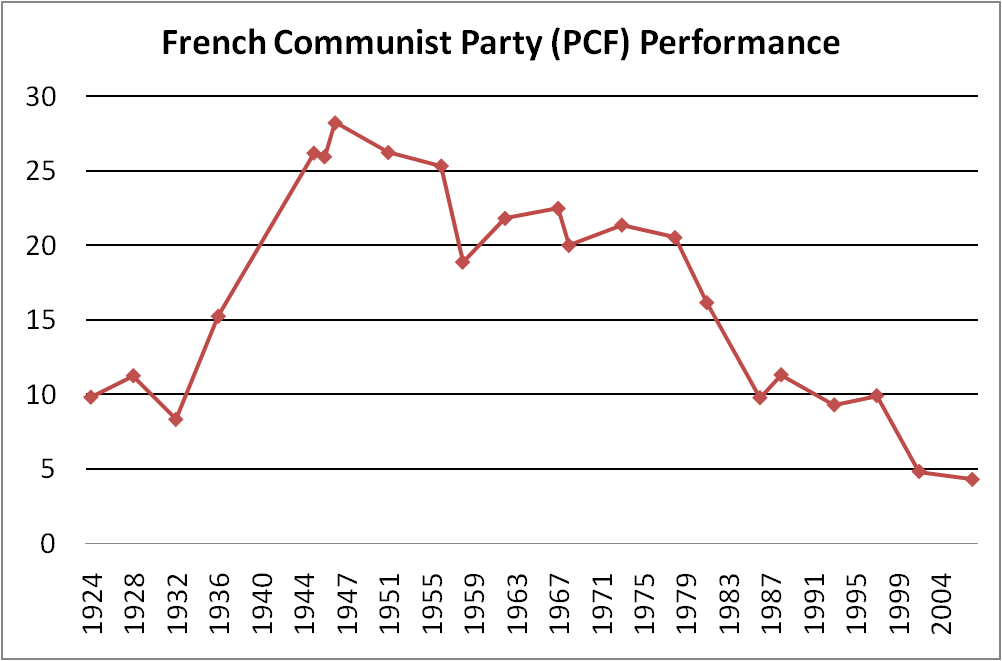
In France, the Communist Party was founded in 1920 by revolting members of its socialist party, then called the French Section of the Workers’ International (Section Française de l’Internationale Ouvrière, SFIO). Their new party initially did fairly poorly, only one of the numerous parties out there. In 1928, for instance, the Communists (PCF) won 11.26% of the vote.

Nevertheless, by 1936 – the depths of the Great Depression – the Communists (PCF) were making gains. Then came WWII – the best thing that ever happened to the PCF. Out of all the parties in occupied France, the Communists fought the Nazis hardest and suffered the most for it. They earned the nickname le parti des 75 000 fusillés – the party of the 75,000 executed people – and immense popularity.

Following the war, the PCF joined the new government led by Charles de Gaulle. Unfortunately for it, however, the U.S. government demanded a Communist-free government as a precondition for accepting the Marshall Plan. The French Communist Party was summarily booted out.

This did not prevent the PCF from channeling its wartime record into electoral success; from November 1946 to 1956, the Communists won a greater share of the popular vote than any other party. Their base lay amongst France’s working class, which remained a loyal and reliable constituency, and they constituted the dominant force on the French left.

Communist Party in France Performance

Continued below the flip.

This state of affairs could not last forever, however. After 1956, the French Communists entered a slow decline. With the slow, gradual destruction of the Soviet Union’s credibility in the West, the PCF – tightly linked to the USSR – reached a ceiling of support. Many French voters simply would never vote communist.

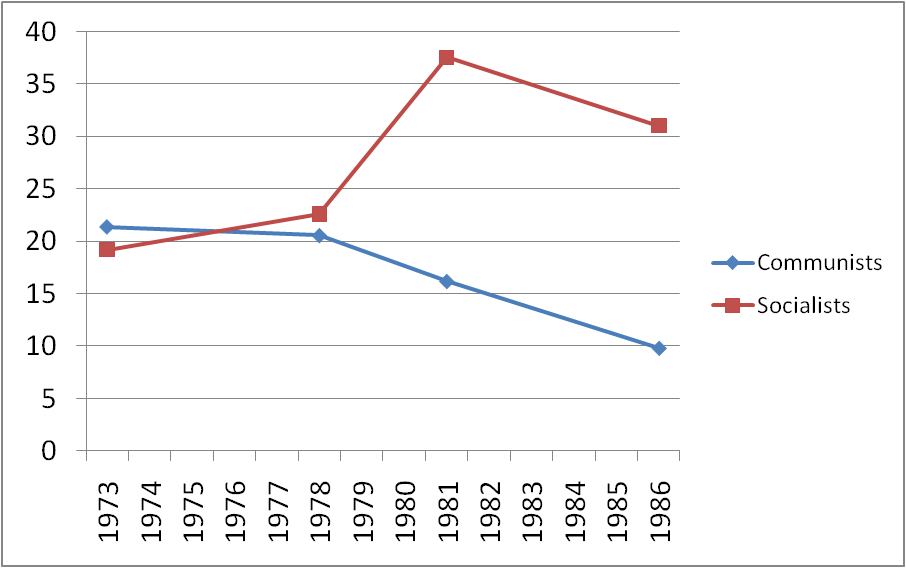
Then, in 1969, the Socialist Party (Parti socialiste, PS) was founded, sounding the death knell of the Communists. Led by François Mitterrand, the socialists quickly took over the mantle as the leader of the left. Communist voters abandoned the PCF in droves, seeking a party that could actually win a majority of the popular vote – which the Communists could not. Thus, by 1988, the PCF won a mere 3.43% of the popular vote in run-off legislative elections.

Communists in France Decline

Interestingly, it was not the fall of the Soviet Union that ended the Communist Party in France, but the emergence of an acceptable alternative to the PCF. That was not the case with Italy.

— Inoljt, http://thepolitikalblog.wordpr…
Communism in Western Europe

By: Inoljt, http://thepolitikalblog.wordpr…
A mentor once told me not to study communism, because it was a dead system, and studying something dead is worthless.

In defiance of this sensible advice, I will be presenting two dead communist movements: the communists in Italy and the communists in France.

Most Americans have never heard about these two parties. For good reason: France and Italy were staunch allies of the United States in the Cold War; it does not seem as if they were remotely communist.

But, for decades, the communists in Italy and France commanded millions of votes and a powerful political machine. Their strength remains a fascinating, little-noticed part of history.

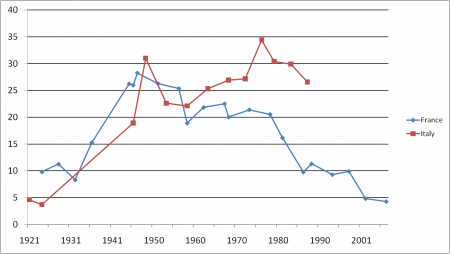
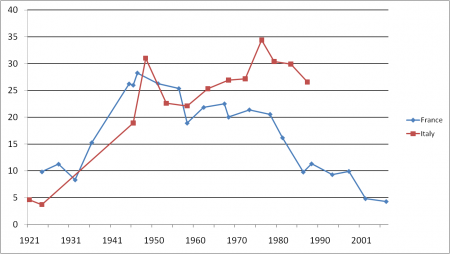
Here are how the French Communist Party (Parti Communiste Français: PCF) and the Italian Communist Party (Partito Comunista Italiano, PCI) performed:

Photobucket

There are several patterns here that apply to both parties, and several patterns unique to each country. (Note: The French line after 1956 indicates Communist performance in the first round of legislative elections, whereas the Italian line indicates Communist performance in elections to the Italian Chamber of Deputies. France has a two-round election system; Italy has two chambers in its Parliament. All statistics cited afterwards relate to these specific criteria.)

I will be exploring French patterns in the next post, which can be found here.

How Obama Can Win Utah (Without a 20% National Victory)

By: Inoljt, http://thepolitikalblog.wordpr…
Photobucket

Democratic candidates in Utah must feel as if they’re facing an impossible task. The state is often considered the most far-right Republican stronghold in the United States. Winning Utah is akin to slaying a mighty dragon with only a bow as one’s chosen weapon.

Like all dragons, however, Utah has a weak spot. The year 2012 may be a ripe time for Obama to shoot an arrow through it.

The majority of Utah’s voters are Mormon; the religion is a heavy influence on daily life in the state. The vast majority of Mormons are also conservative, because Mormonism is an inherently conservative beast. In every presidential election so far, Mormons have proved to be strongly Republican.

Mormons like to think of themselves as average, normal Americans. They’re good people. They help with the community. They love their children and teach them traditional values. Nobody cares if they have a different religion.

Except many people do care very much indeed, especially the type of person who tends to vote Republican. Many would never vote for a Mormon.

Imagine the following scenario, below the flip.

Mitt Romney decides to runs for president in 2012 and starts as the front-runner. The race quickly narrows down to Romney and another Republican – perhaps a Huckabee-type figure. Romney’s Mormonism becomes a strong undercurrent and then explodes into the media spotlight, much like race did in the 2008 Democratic primary. It becomes clear that Romney is losing support because of his religion; eventually he loses the primary and ends up faintheartedly endorsing the Republican nominee. The good folk of Utah, angered by Romney’s treatment, turn out in drastically reduced numbers during the general election. Many vote for Obama – enough that, in an election he’s winning by 10% or so – he barely takes the state.

An unlikely scenario? Not really. First, Romney seems nearly certain to run in 2012; even now he is running a shadow campaign. In 2008, Mormonism was a strong undercurrent; Romney even gave a speech on his religion. There is no reason to think why it wouldn’t be in 2012. I doubt Mitt Romney will win the nomination in a competitive race; apart from his Mormonism, he is a terrible politician who lost all the important states in the 2008 primary (except for Michigan, which he won by promising to bring back jobs that will never come back).

On the other hand, its not certain that the media will pick up on the Mormon issue. And Republicans are strong enough in Utah that they might still win the state, even if all the above did occur.

Then again, Obama won Indiana when everybody said it couldn’t be done. Moreover, in 2008 he made strong gains in Utah, improving by 18% from John Kerry’s performance. Partly, this is probably because Obama is very popular in the West.

And maybe, just maybe, the Mormon factor had something to do with it.

The Modern Electoral Map

By: Inoljt, http://thepolitikalblog.wordpr…
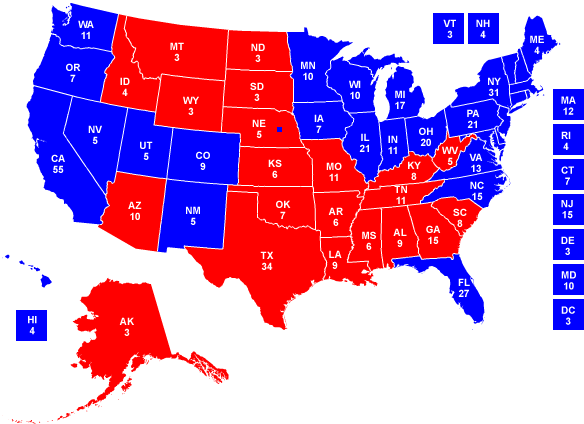


Some of you may recognize this map.

Photobucket

For those who don’t, this is Ronald Reagan’s landslide election over his hapless opponent Walter Mondale.

Unfortunately, for those who look for political trends, this map hides more than it reveals. For example, Reagan wins Massachusetts, but reasonable people would agree that Massachusetts is normally a Democratic state.

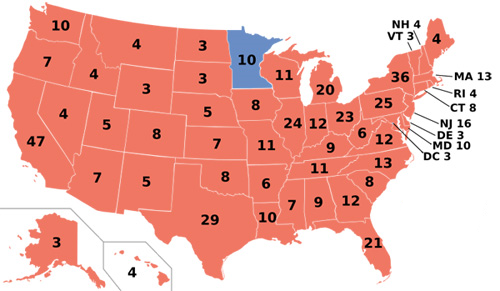
Here is a more revealing map.

Photobucket

You probably don’t recognize this map. There’s a good reason for that – there’s never been a presidential election with the above results.

More below the flip.

In fact, the previous electoral college is what would have happened if Walter Mondale and Ronald Reagan won an equal share of votes. The blue states are those in which Reagan won with less than 18.2%, the exact amount by which he beat Mondale.

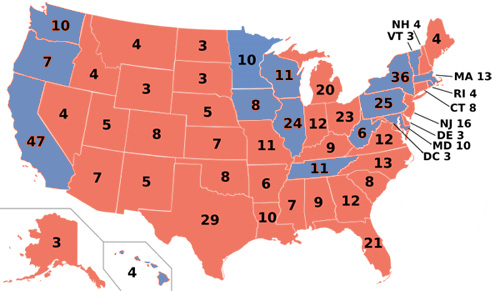
This map bears an eerie resemblance to today’s electoral maps. For example, here is the 2000 presidential election, in which Bush and Gore effectively ran to a dead heat.

Photobucket

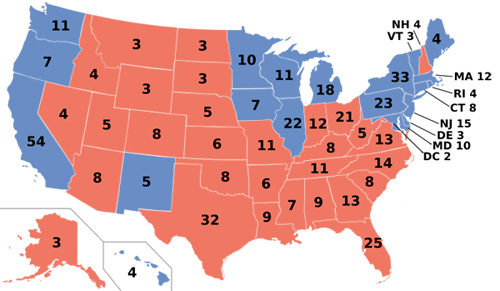
There have been some changes since Reagan’s time. The Northeast has been turning blue; it is much harder today for Republicans to win a state like New Jersey or Maine. California has also been changing; Reagan would have lost it by only 2% in the hypothetical. To compensate, Appalachia has been moving the other direction; Democrats are hard-pressed to turn Tennessee and West Virginia blue nowadays. Places like Missouri and Kentucky were less than 3% redder than the nation in 1984. That was not the case last November.

By and large, however, what is striking is the degree to which the electoral maps look alike. For all the talk  nowadays about blue states turning red and red states turning blue, much more has remained the same than has changed. Democrats do well in the Pacific Coast, the Midwest, and the Northeast; Republicans do well in the Mountain West, the Plains, and the South. The Democratic and Republican coalitions remain much the same as they were two decades ago.

Analyzing Afghanistan’s Election

By: Inoljt, http://thepolitikalblog.wordpress.com/

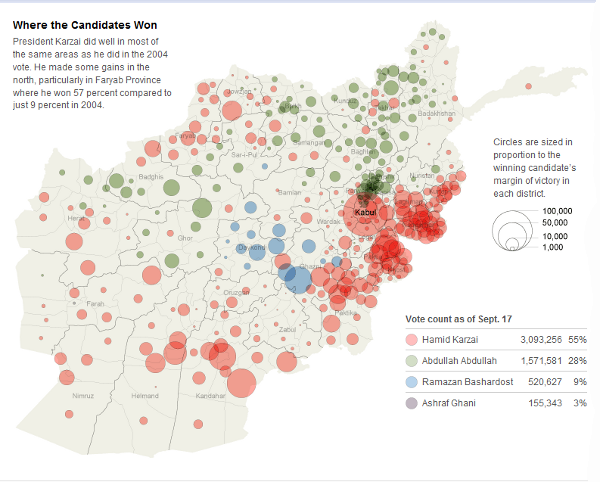
The New York Times posted a very interesting map of Afghanistan’s recent election.

Photobucket

Before continuing, I must note that my purpose is not to question whether irregularities or fraud might have denied Abdullah Abdullah victory; I am simply analyzing the data as it appears.

There’s a lot of data here, and interpreting it is fairly difficult; few people know much about Afghan politics and demographics. This map indicates the margins each candidate won. Kabul is the big red circle. In total, Karzai won 55% of the vote, essentially doubling the vote of the second-closest candidate.

Compared to a similar maps of U.S. elections, several things stand out. The first is the extent to which polarization is apparent. Afghani society is very clan-based, and elections can reveal polarization like nothing else.

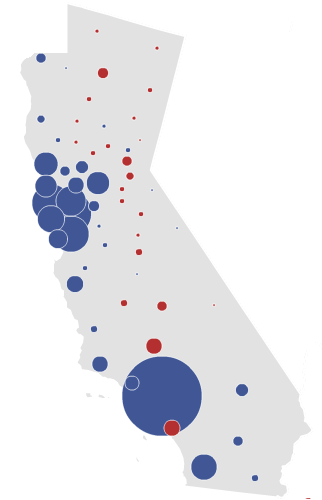
At the point most politicians win an election by more than 20%, maps like the one above tend to consist of something like below:

Photobucket

This is Barack Obama’s 24.03% landslide in California. Compare it to Karzai’s 27% victory: one might be forgiven for concluding that out of the two elections, Karzai did worse.

(Many) more maps below the fold.

Notice too that Ramazan Bashardost, who won only 9% of the vote, shows up as a presence on the map. This indicates a very regional candidacy, like that of William Wallace. Candidates who win 9% of the vote nearly never show up on any type of election map; Ross Perot, for instance, won less than a dozen counties with his 18.9% of the vote.

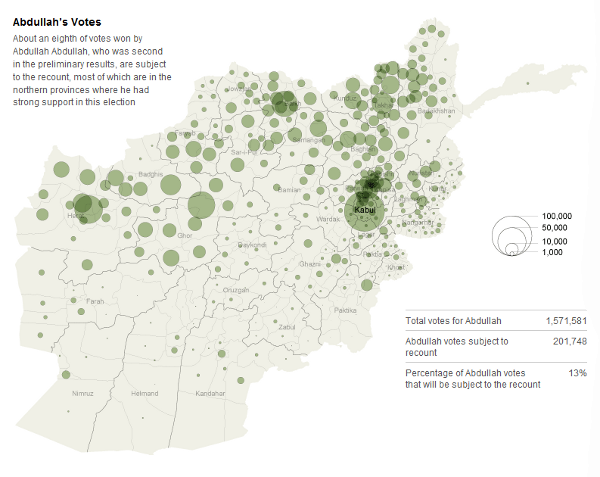
Abdullah Abdullah was also a regional candidate, as the following map reveals:

Photobucket

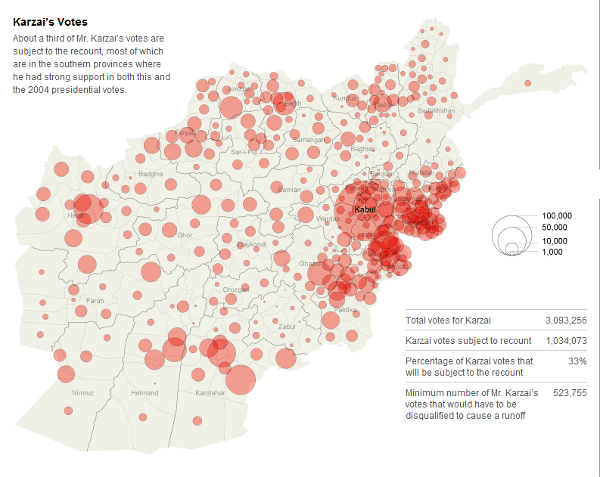
Mr. Abdullah  is almost entirely limited in support to the north; very few Pashtuns in the south seem willing to vote for him. This was not the case with Karzai; his total vote looks far more homogeneous:

Photobucket

There are several American states that the results Afghanistan’s election can be comparable to. The victor wins the one major city along with a number of more rural areas, although the opposing candidate summons strong support in one region. In this respect, Karzai’s victory resembles the coalition Bill Clinton assembled in many Appalachian states, such as Missouri and Tennessee (his loss in Oklahoma also bears similarities to Afghanistan). Recent presidential elections, on the other hand, generally do not follow this pattern; cities and rural areas rarely vote together (and cities never vote Republican). After Bill Clinton, only Obama’s Iowa victory comes to mind as a state with a “Karzai” coalition. Note that in all this states, the winner’s margin was far less than Karzai’s 27%.

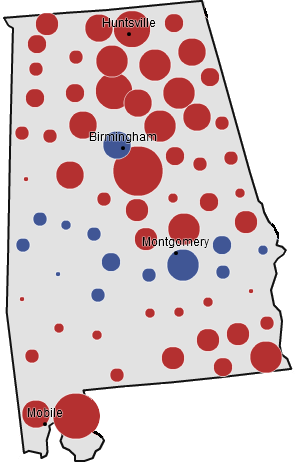
The place that Afghanistan’s election calls most to mind, however, is Alabama. Both are extremely polarized: Afghanistan by tribe, Alabama by race. Republicans regularly win landslides in Alabama, yet always lose a particular region – the Black Belt – just as Karzai lost many Afghan areas despite his strong performance. Accusations of fraud have severely tainted the Karzai “landslide,” just as fraud of a different type was practiced in Alabama for many decades. Finally, both areas are extremely poor and will likely remain so during the forseeable future.

To end this post, here is McCain’s performance in Alabama.

Photobucket

The Solid South

By: Inoljt, http://thepolitikalblog.wordpr…
It is a popular today to say that the South has switched from voting Democratic to Republican. Many people are fond of looking at previous electoral maps. Hey, isn’t that funny – the states have completely switched parties. It’s like the Republicans have recreated the Solid South.

That statement is unequivocally false. Most people have no idea how unbelievably Democratic the Solid South was. For half a century, Democrats in the Deep South did about as well as the Communist Party did in Soviet Union elections.

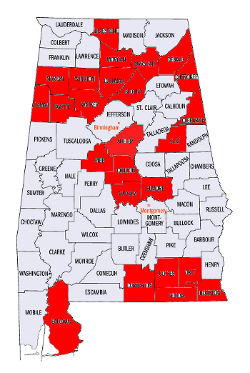
Let’s take a look at a model Republican southern state: Alabama. John McCain won 60.32% of the vote here, his second best showing in the South. Below are the counties in which Mr. McCain won over 70% of the vote (all my statistics below are from http://www.uselectionatlas.org/ – an amazing website).

Photobucket

That’s a lot of counties. The Republicans are doing quite well – about as well as the Democrats used to do in Alabama, many would say.

Here is another map, filled with blue counties.

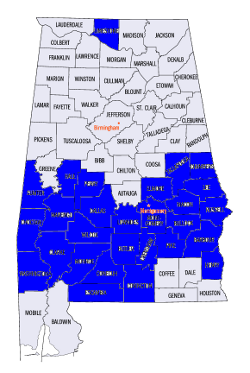
It is the 1940 presidential election. I invite you to guess – what do these blue counties represent? Counties in which Roosevelt won over 70% of the vote? 80%? 90%? Remember, Roosevelt was quite a popular guy. He must have done pretty well in Alabama, part of the Solid South.

Photobucket

Continued below the flip.

In fact, the blue counties are those in which Roosevelt won over 95% of the vote in 1940. In all, he won 85.22% of the good folk of Alabama.

Those are incredible numbers. If today that result occurred, we would all cry fraud.

Of course, fraud – of a sort – was occurring in Alabama at that time. As everybody knows, blacks were not allowed to vote at that time. Notice how all but one of the blue counties surround Alabama’s Black Belt. What is less well known, however, is that many poor whites (more likely to vote Republican) were also unable to vote. The poll tax didn’t hurt just African-Americans, after all.

Different southern states enacted different voting restrictions with an intent to continue Democratic dominance. Some were more strict; some were less so. Republicans in North Carolina, for example, generally held Democrats to below 60% of the vote; they even won the state in 1928. On the other hand, South Carolina probably disenfranchised the most voters.

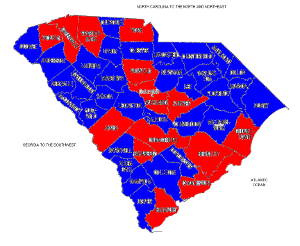
Here is the result:

Photobucket

The blue indicates a county that gave the Republican candidate less than 10% of the vote – for nine straight elections, from 1912 to 1944. From 1900 to 1944, South Carolina’s average vote (per election) went 94.89% Democratic, 3.98% Republican.

How did South Carolina achieve this amazing result?

A revealing clue is provided by looking at the voting count numbers. For example, in the year 1912 a total of 50,405 people voted in South Carolina (48,357 of whom supported the Democrat). At that time the census had just reapportioned electoral votes; South Carolina had a total of nine.

By comparing South Carolina to states with similar populations, one can get an idea of how many potential voters were disenfranchised. Kansas, for example, had ten electoral votes; 365,560 people in the state voted that year. West Virginia had eight electoral votes; 268,828 people voted in that state (remember, this was before women’s suffrage). In South Carolina, therefore, several times more citizens “should” have voted than actually did.

In conclusion, to state that the Solid South always voted Democratic is a misnomer. Even to say that it voted extremely Democratic might still be inaccurate. It would be like saying I’m interested in politics. Technically its true, but the picture the words imply far and away understates the reality.

Ohio, Part 4

By: http://thepolitikalblog.wordpr…
This is the last part of my review of the swing state Ohio.

Republican Ohio

What parts of Ohio vote Republican?

All of it, of course, except for the parts that vote Democratic.

That is a pretty facetious answer to a fairly serious question, but there is something to it. Blue Ohio has a set of defined, separate characteristics. Red Ohio does too, but not to the same degree. It is far easier to describe Democratic Ohio than Republican Ohio.

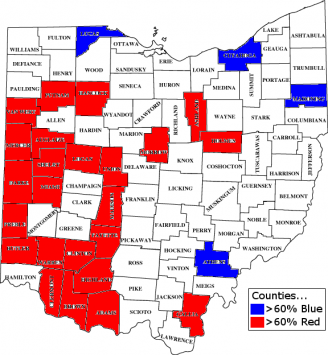
The following map is a good beginning in exploring Republican Ohio.

Photobucket

These are the places which most heavily supported John McCain (for those who are curious, the most Democratic counties were Cleveland, Toledo, Ohio University, and Youngstown). They are located primarily in the southwestern portion of the state, away from the Democratic ‘7’. Interestingly, practically none are part of Appalachia – considered Obama’s weakest region in the country.

Southwest Ohio historically – and to this day remains – the most conservative part of Ohio. Geographically, it is the Republican base; even in Democratic landslides, it often will vote for the red candidate.

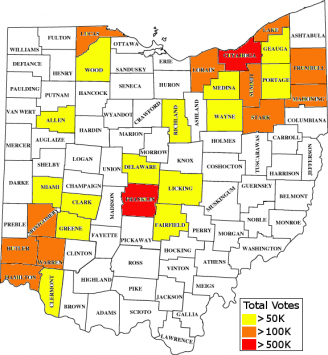
There is another trait the highlighted counties have in common: most are semirural and somewhat less populated. Another map helpfully illustrates this.

Photobucket

Compare the two maps. Very few of the counties in which John McCain took over 60% of the vote were populated enough to appear on the above map. There is very little overlap between the reddest parts of Ohio and the densest parts of Ohio – except, importantly, the suburbs of Cincinnati.

More below the flip.

This does not mean, however, that all counties with over fifty thousand votes went blue. Quite the opposite, in fact: many of the yellow counties voted for McCain. Only counties with over one hundred thousand votes tread Democratic. Take a look:

Photobucket

What does this mean?

The yellow counties are an imperfect representation of what famously cost John Kerry the state: the exurban reaches of Ohio, especially in Columbus and Cincinnati. Most of them are well-off and home to middle-class folk, like exurbs in general. White flight played an important role in their formation (although it was not, as some maintain, the biggest motivator). Both McCain and Bush got their largest margins from these places; they constitute an important – perhaps the most important – block of the GOP coalition today.

This has not always been the case. Before 2000, Hamilton County (Cincinnati) tended to give Republican candidates their biggest margins in the state. Today, it has been replaced by the surrounding counties, rapidly growing exurban communities. Nevertheless, Hamilton County remains a reliable Republican stronghold.

Contrary to popular perception, the city Cincinnati itself is not that conservative (not anymore); its deep red suburbs account for the county’s Republican lean. Cities in general never vote Republican, but in GOP strongholds – like Cincinnati – the overwhelmingly red suburban vote outweighs their Democratic lean.

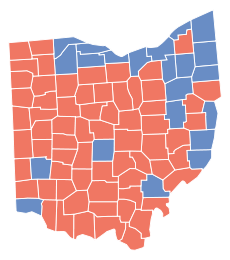
For a visual illustration of Cincinnati’s importance, here is how George Bush did in Ohio:

Photobucket

Cincinnati and its surrounding exurbs provide the largest Republican margins. The exurbs of Columbus are going heavily Republican; so is much of eastern Ohio.

Note, however, that George Bush only won the state by 3.5%. Unfortunately the Times does not have maps of stronger Republican victories (e.g. 1988, 1980).

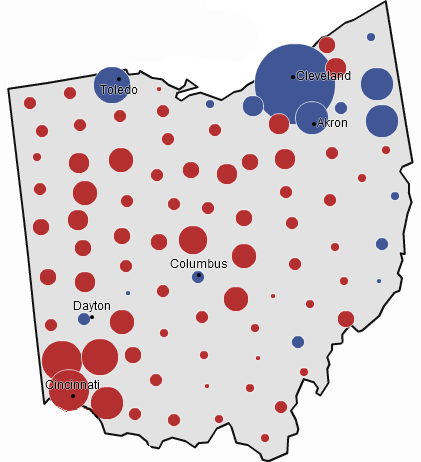
How has the Republican base changed since 2000? The following map provides a sense of how things stand today.

Photobucket

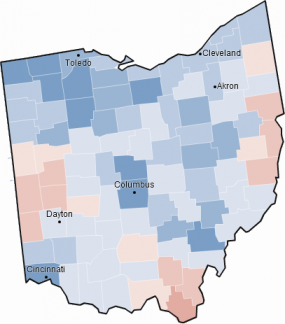
There is not too much to show. One can see a coherent north-south divide; northern Ohio has become more Democratic, southern Ohio less so. Most of the rural southwest is fairly lukewarm to Obama – but so is the blue east. Interestingly, the exurbs seem to have moved Democratic more than their rural brethren. Note that most counties are blue because the country as a whole voted more Democratic in 2008.

It is difficult to tell how much of this is permanent and how much was specific to 2008. Perhaps the exurban counties were only bluer because of the housing crisis. Certainly a place like Cincinnati (with its large black population) voted for Obama as a person, not the Democratic party. Then again, maybe not; the county supported Bush ’04 by only 5%.

But as a whole, red Ohio seems to vote the same way it has for the past few years (or generations). Neither it nor the Ohio Republican Party has changed much in recent years. The same cannot be said for the Democrats.

Ohio, Part 3

By: Inoljt, http://thepolitikalblog.wordpr…
Like most states, Ohio contains several swing areas. Some lean Democratic; others lean Republican. A good politician will usually pick up most of these regions on his or her way to victory.

Swing Ohio

The following map provides a sense of swing Ohio.

Photobucket

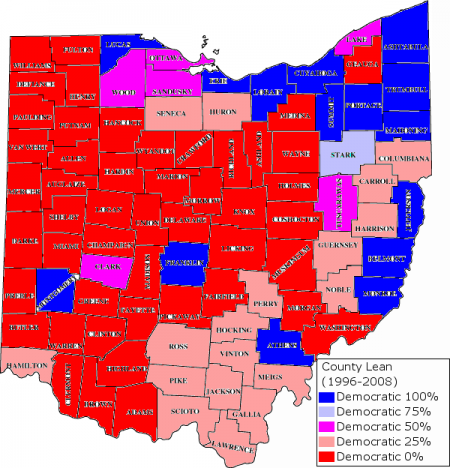
Providing balance, the map encompasses two solid Democratic victories and two solid Republican victories. Bearing this in mind, one can readily make out the structural ‘7’ of Ohio politics. Absent three counties, swing Ohio roughly encompasses the outer edges of Ohio’s northern and eastern borders, creating a shape that resembles the number ‘7.’ Strong Democrats win these swing counties and fatten the ‘7.’ Strong Republicans do the inverse.

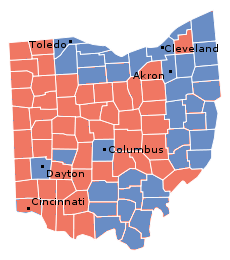
Let’s look again at Bill Clinton’s 1996 victory.

Photobucket

As noted previously, Clinton is creating a fat ‘7’ in his re-election.

There are several other things that should be observed about Clinton’s victory with regard to swing Ohio. At the bottom of the state, Clinton is winning a group of thinly populated, Appalachian counties. One of these counties is Athens County, home to Ohio State University; it is reliably liberal due to the college. The rest lean Republican. A strong traditional Democrat can and often will win southeast Ohio; if this happens, his Republican opponent is probably going down to defeat.

Bill Clinton is also winning three counties surrounded by red. One of these – Dayton – is the Democratic equivalent of southeast Ohio: it leans Democratic but will occasionally turn up on the other side. In that case the Republican will soon be receiving a concession call.

The other two counties are moving in opposite directions. In Clinton’s day, Clark County – Springfield – and Columbus were two cities squarely in Ohio’s swing category. Since then, however, Springfield has been drifting right: Gore won the county, Kerry and Obama lost it. Meanwhile, Columbus has been doing a hard swing left, so that neither it nor Springfield are swing regions anymore.

Finally, one may note that many places I define as “swing” are colored light red, rather than purple in the first map. This was because of Barack Obama’s peculiar performance in Ohio. The president won the state with an unconventional coalition: he lost much of swing Ohio and made up for it by performing extremely well in Columbus, Cincinnati, and northern Ohio. Whether this coalition was unique to 2008 or foreshadows a structural shift in Ohio is unknown. Personally, I prefer the former explanation.