DCCC, NRCC Tip Their Hands

One thing we do a lot of at SSP is speculate, and a favorite topic of speculation is what House districts seem like the most vulnerable ones for each party, and most likely to be pickups. We can go one better than mere speculation, today, though, as the DCCC and NRCC disclosed their own top 2010 targets for a recent piece with National Journal‘s CongressDaily. In each case, they gave a top tier, and then added some other next-best opportunities.

For the Democrats, according to DCCC exec director Jon Vogel:


District Incumbent PVI
DE-AL Castle D+7
FL-10 Young R+1
LA-02 Cao D+25
MI-11 McCotter R+0
PA-06 Gerlach D+4
MN-06 Bachmann R+7
OH-02 Schmidt R+13
TX-10 McCaul R+10

And for the GOP, according to NRCC political director Brian Walsh:


ID-01 Minnick R+18
MD-01 Kratovil R+13
NH-01 Shea-Porter D+0
OH-01 Driehaus D+1
VA-02 Nye R+5
VA-05 Perriello R+5
AL-02 Bright R+16
AL-05 Griffith R+12
CO-04 Markey R+6
FL-08 Grayson R+2
FL-24 Kosmas R+4
MS-01 Childers R+14
OH-15 Kilroy D+1

Interesting choices for the Dems, suggesting that they’re confident about having open seats in DE-AL and PA-06, and maybe even FL-10 (but maybe they aren’t confident about Mark Kirk vacating IL-10?). MI-11 is a solid pick based on last year’s performance (both at the presidential level and by McCotter), but they’ll need to step up their candidate recruitment there. For the GOP, their picks seem about right; the biggest surprise, though, may be that they’re touting challenges to the Virginia freshmen above a challenge to Bobby Bright, who more than anyone else seems to face the problem of a drop in African-American turnout in his district in an off-year election.

SSP Daily Digest: 6/15

PA-Sen: Ex-Rep. Pat Toomey says that he raised $1 million in 60 days toward his Senate run, with more than 11,000 donors. It’s still a drop in the bucket compared with the bankrolls of Arlen Specter and Joe Sestak, but it ought to help dissuade anyone else from jumping into the GOP primary. Another tidbit that ought to discourage any Republican line-crashers: $5,000 of that money came from John Cornyn‘s PAC, suggesting that he’s done looking for another candidate and is bringing establishment power to bear behind Toomey.

FL-Sen: It’s not much of a surprise, considering they’re close neighbors, but Rep. Kendrick Meek nailed down the endorsements of two key members of Florida’s House delegation — Debbie Wasserman Schultz and Ron Klein — which will come in handy if he does wind up facing off against Corrine Brown in the primary.

LA-Sen: Democratic New Orleans city councilor Arnie Fielkow decided, after some speculation, not to wade into the Louisiana Senate race. More plausible would be a challenge to Rep. Anh Cao in LA-02, as Fielkow is well-known in NoLa but has no statewide presence, but Fielkow also declined that, leading to speculation he may be eyeing the next mayor’s race instead.

GA-Gov:  With an eye on Roy Barnes, Ed Kilgore takes aim at the claim that Georgia governors have a long track record of failure when it comes to comebacks. It turns out that past probably isn’t prologue. (D)

TX-Gov: We’re reluctant to ascribe a whole lotta meaning to the phrasing of this particular letter, but Kay Bailey Hutchison seems to be moving pretty explicitly toward making official her run for Governor. Glenn Thrush points to a letter sent to potential donors saying “I am running for Governor.”

AZ-05: Is Congress ready for its first gamer (or at least its first out-of-the-closet gamer)? Jim Ward, the former president of video game maker LucasArts, announced that he’ll be running for the GOP nomination to go up against Rep. Harry Mitchell. Ward brings a lot of wealth to the table, but he’ll have an uphill fight against former Maricopa County Treasurer David Schweikert, who lost the 2008 election to Mitchell by 9 points and is looking for a rematch.

TX-32: Dems have landed a good candidate in TX-32 to go up against Rep. Pete Sessions: Grieg Raggio, an attorney and husband to Judge Lorraine Raggio. The 32nd, in north Dallas, is still a red district but has seen rapidly declining GOP numbers, both for Sessions and at the presidential level, and is down to R+8.

NY-AG: Nassau Co. Exec Tom Suozzi published an editorial in the New York Times where he publicly discusses having changed his mind on the gay marriage issue (he’s now for it). With New York one of the few states where gay marriage has become an issue with majority support, Suozzi looks to be repositioning himself for, well, something (probably, as often rumored, Attorney General, but maybe Governor if Andrew Cuomo continues to dither).

Redistricting: The Hill has an interesting piece about redistricting; while it doesn’t delve into too many specifics, it does shed some light on what districts the GOP is rushing to try to take back before they get strengthened for the Dems (like Bobby Bright’s AL-02), and what districts are unlikely to draw top tier challengers because everyone is willing to sit back and wait for new open districts to pop up in 2012 (like Dina Titus’s NV-03).

Race Tracker: Benawu is already back doing what he does best: chronicling the Dems’ efforts to field candidates in all 435 districts. Right now, we’re still looking in 124 GOP-held districts (although, of course, it’s still early in the cycle). Check out the RaceTracker 2010 wiki for more.

Redistricting Maryland: 8 Democrats (Version 2.0)

(This diary is cross-posted on the Daily Kos)

Two months ago, I posted a diary here, “Redistricting Maryland: 8 Democratic Seats”

http://www.swingstateproject.c…

I have since then worked with the map to design a plan which will make it even more likely that eight Democrats can be elected in 2012.  I must admit that the resulting map is quite gerrymandered (though not more so than the existing Maryland map).  I am opposed to highly gerrymandered redistricting in principle.  Even though the Supreme Court has clearly ruled that political gerrymandering (as opposed to gerrymandering where race is the predominant factor) is permissible, I just think that it ultimately lets some politicians decide who their voters are going to be, instead of the other way around.  However, as long as the Republicans continue to do it, there is no reason why Democrats should disarm unilaterally.  

I tried to make the new map reflective of 2010 population estimates, as different parts of Maryland have experienced varying population growth levels.  For example, the population of Baltimore City is expected to decline slightly between the 2000 and 2010 Censuses, while some outer exurban areas of Baltimore and Washington are expected to show increases of 20% or more.  The new map reflects this reality.  The map keeps intact much of the territory of the current seven Democratic representatives, while still creating an additional eighth Democratic seat.

As in my April post, the map below demonstrates that it is very possible to redistrict Maryland in a manner in which eight Democrats can be elected to Congress from the state.  I have refined the map whereby seven Democratic districts (Districts 2, 3, 4, 5, 6, 7 and 8) voted for Obama by at least a 22.5 point margin.  Districts 4 and 7 remain African-American majority, as is necessary per the VRA.  (Both districts are ensured to elect an African-American Democrat, as 70% or more of the Democratic primary vote in each district is expected to be comprised of African-Americans.)  The proposed District 1 goes from one which McCain won by 18.5 points to one which Obama wins by 6.4 points; if Kratovil makes it through 2010, he will be more than safe in the new MD-1.  The proposed District 6 goes from one which McCain won by 17.5 points to one which Obama wins by 22.6 points.  In the discussion of each district (below the map) I also discuss how these new districts performed in other recent Maryland political races (2004, 2006 and 2008 elections).

Maryland Map:

Photobucket

Central Maryland Map:

Photobucket

Central Maryland Maps with precincts:

Photobucket

Photobucket

Photobucket

Note:  Additional supplemental maps can be found at bottom of diary.

Discussion of Individual Districts:

YELLOW – District 1:  Frank Kratovil (home: Queen Anne’s County)

Current District:  Obama 39.8%; McCain 58.3% (McCain + 18.5)

Proposed District:  Obama 52.3%; McCain 45.9% (Obama + 6.4)

Proposed District:  Kerry 47.9%; Bush 51.1%

Proposed District:  Cardin 45.6%; Steele 52.7%

Proposed District:  O’Malley 44.5%; Ehrlich 54.4%

This district continues to encompass the entire Eastern Shore.  The new district proceeds through parts of northern Harford and Baltimore Counties (although it completely excludes the State Senate District of 2008 GOP Candidate Andy Harris) and into very Democratic territory on the western side of Baltimore County.   The district also includes the Annapolis area in Anne Arundel County.  Interestingly, both the Obama-McCain and Kerry-Bush percentages of the new district correspond very closely to the national average.

Major communities in proposed MD-1 district: all of Eastern Shore; Harford County – Bel Air (part); Baltimore County – Randallstown, Lochearn, Milford Mill, Owings Mills, Reisterstown, Woodlawn (part); Anne Arundel County – Annapolis.

GRAY – District 2:  Dutch Ruppersberger (home: Cockeysville)

Current District:  Obama 59.8%; McCain 38.3% (Obama + 21.5)

Proposed District:  Obama 60.8%; McCain 37.5% (Obama + 23.3)

Proposed District:  Kerry 55.3%; Bush 43.8%

Proposed District:  Cardin 52.3%; Steele 45.9%

Proposed District:  O’Malley 51.0%; Ehrlich 47.8%

The new district continues to include most of the communities currently in MD-2, including parts of Anne Arundel, Harford and Baltimore Counties, as well as Baltimore City (the proposed district includes all areas of Baltimore City currently in MD-2 and also adds the area around Hopkins/Bayview Hospital on the eastern side of the city.)  The new district expands into parts of Prince George’s and Howard Counties.

Major communities in proposed MD-2 district: Baltimore City (part); Anne Arundel County – Brooklyn Park, Glen Burnie (part), Severn, Fort Meade, Odenton, Maryland City; Harford County – Bel Air (part), Fallston, Joppatowne, Edgewood, Aberdeen, Havre de Grace; Baltimore County – Cockeysville, Towson (part), Rosedale, Middle River (part), Essex (part), Dundalk (part); Prince George’s County – Laurel; Howard County – Savage-Guilford.

ORANGE – District 3:  John Sarbanes (home: Towson)

Current District:  Obama 58.8%; McCain 39.2% (Obama + 19.6)

Proposed District:  Obama 60.5%; McCain 38.0% (Obama + 22.5)

Proposed District:  Kerry 55.4%; Bush 43.8%

Proposed District:  Cardin 57.3%; Steele 40.9%

Proposed District:  O’Malley 52.4%; Ehrlich 46.2%

Like MD-2, the new MD-3 remains quite similar to the current district.  Most of the Baltimore City, Baltimore County and Howard County areas remain intact.  Additional territory in Baltimore Co., Howard County and Montgomery County is added.  The Anne Arundel County part of the current district is detached.

Major communities in proposed MD-3 district: Baltimore City (part); Baltimore County Towson (part), ParkvilleCarney, Pikesville, Timonium-Lutherville, Perry Hall, White Marsh, Arbutus, Lansdowne; Howard County – Elkridge, Ellicott City (part), Columbia, North Laurel; Montgomery County – Burtonsville, Colesville, Aspen Hill (part), Olney, Laytonsville.

RED – District 4:  Donna Edwards (home: Fort Washington)

Current District:  Obama 85.1%; McCain 14.2% (Obama + 70.9)

Proposed District:  Obama 70.7%; McCain 28.0% (Obama + 42.7)

Proposed District:  Kerry 64.0%; Bush 34.8%

Proposed District:  Cardin 60.7%; Steele 37.9%

Proposed District:  O’Malley 61.7%; Ehrlich 37.3%

Proposed District African-American: 51%

The new MD-4 continues to encompass much of the same Prince George’s County communities currently in the district.  The Montgomery County part of the current district is detached and is substituted by parts of Anne Arundel and Baltimore Counties; very Republican precincts from both counties are added, and the overall Democratic percentage of the district goes down a lot, but still stays at over 70% Obama (there is completely no need to have a district with an Obama advantage of 85-14 !).

Major communities in proposed MD-4 district: Prince Goerge’s County – Fort Washington (part), Oxon Hill, Temple Hills, Andrews AFB, Forestville, Largo-Kettering, Mitchelville, Glenarden, Bladensburg, Riverdale, Hyattsville (part), College Park (part), Langley Park, Adelphi, Beltsville; Anne Arundel County – Crownsville, Gambrills, Davidsonville (part), Millersville, Severna Park, Pasadena-Lake Shore, Riviera Beach, Glen Burnie (part), Ferndale, Linthicum; Baltimore County – Sparrows Point/Edgemere, Dundalk (part), Essex (part), Middle River (part).

PURPLE – District 5:  Steny Hoyer (home: Mechanicsville)

Current District:  Obama 65.4%; McCain 33.3% (Obama + 32.1)

Proposed District:  Obama 62.7%; McCain 36.0% (Obama + 26.7)

Proposed District:  Kerry 54.7%; Bush 44.5%

Proposed District:  Cardin 53.7%; Steele 45.0%

Proposed District:  O’Malley 54.3%; Ehrlich 44.7%

This district changes relatively very little.  It continues to encompass all of the three Southern Maryland counties, south Anne Arundel Co. and “outer” Prince George’s Co.  Parts of Upper Marlboro as well as Crofton and parts of the Annapolis and Broadneck peninsulas are added, while Laurel and adjoining parts of northern Prince George’s are taken out of the district.  The district becomes slightly less Democratic, but it still has a very healthy 26.7 point Obama advantage over McCain.

Major communities in proposed MD-5 district: All of Southern Maryland – Calvert County, Charles County, St. Mary’s County; Prince Goerge’s County – Fort Washington (part), Clinton, Upper Marlboro, Bowie, Glenn Dale, Greenbelt; Anne Arundel County – Riva, Edgewater, Davidsonville (part), Mayo, Shady Side, Deale, Parole/Annapolis, Arnold, Cape St. Claire, Crofton.

GREEN – District 6:  Roscoe Bartlett (home: Frederick)

Current District:  Obama 40.2%; McCain 57.7% (McCain + 17.5)

Proposed District:  Obama 60.3%; McCain 37.7% (Obama + 22.6)

Proposed District:  Kerry 54.3%; Bush 44.7%

Proposed District:  Cardin 54.5%; Steele 44.1%

Proposed District:  O’Malley 51.6%; Ehrlich 47.3%

The new district includes most of Frederick County, parts of Carroll County, as well as a good chunk of Montgomery County.  The new territory in Montgomery is the factor that dramatically changes the political composition of this district, as some of the most Democratic parts of the county are added to MD-6.

Major communities in proposed MD-6 district:  Frederick County – Frederick, Middletown, Thurmont, Emmitsburg, New Market, Mt. Airy; Carroll County – Taneytown, Manchester; Montgomery County – Damascus, Clarksburg, Germantown, Montgomery Village, Aspen Hill (part), Wheaton-Glenmont, White Oak, Silver Spring (part), Takoma Park (part).

BLUE – District 7:  Elijah Cummings (home: Baltimore City)

Current District:  Obama 78.8%; McCain 19.9% (Obama + 58.9)

Proposed District:  Obama 67.0%; McCain 31.5% (Obama + 35.5)

Proposed District:  Kerry 60.8%; Bush 37.9%

Proposed District:  Cardin 55.2%; Steele 42.8%

Proposed District:  O’Malley 55.2%; Ehrlich 43.1%

Proposed District African-American: 51%

The new MD-7 is not that different from the current district.  The Baltimore City portion of the district remains wholly intact, and, in fact, is expanded to include a few additional African-American majority neighborhoods (including the Pimlico and Coldspring areas in the northwestern part of the city).  The Catonsville and Woodlawn areas in western Baltimore County as well as a good portion of Howard County also remain with MD-7. New, more Republican areas in northern Baltimore County, and parts of Carroll and Harford Counties are added to the district.

Major communities in proposed MD-7 district:  Baltimore City (part); Baltimore County – Catonsville, Woodlawn (part); Harford County – Jarretsville; Carroll County – Westminster, Hampstead, Eldersburg, Sykesville; Howard County – Ellicott City (part).

PINK – District 8:  Chris Van Hollen (home: Kensington)

Current District:  Obama 73.9%; McCain 24.7% (Obama + 49.2)

Proposed District:  Obama 62.0%; McCain 36.2% (Obama + 25.8)

Proposed District:  Kerry 56.9%; Bush 41.6%

Proposed District:  Cardin 58.3%; Steele 40.4%

Proposed District:  O’Malley 55.0%; Ehrlich 44.0%

The new district includes most of Montgomery County, parts of Frederick and Prince George’s Counties, as well as all of the three Western Maryland counties.  The district becomes somewhat less Democratic, but the new MD-8 still has some of the state’s best partisan stats (4th best Obama percentage, after the two African-American majority districts, and just behind MD-5; 3rd best Kerry percentage; 3rd best O’Malley percentage – just slightly behind MD-7; and 2nd best Cardin percentage – behind only MD-4 and ahead of both MD-3, Cardin’s home district, and the new MD-7 !).

Major communities in proposed MD-8 district:  All of Western Maryland (Garrett County, Allegany County, Washington County); Frederick County – Brunswick; Montgomery County – Silver Spring (part), Takoma Park (part), Kensington, Chevy Chase, Bethesda, Potomac, Rockville, Gaithersburg, Poolesville; Prince George’s County – Hyattsville (part), Mt. Rainier, Cheverly, Seat Pleasant, Landover.  

Note:  for the entire plan above, the boundaries of only three precincts had to be changed slightly in order to make the map work: 26-7 and 26-11 in Baltimore City, and 4-11 in Baltimore County.

So that’s my Maryland Redistricting Plan – Version 2.  I welcome comments and discussion (if possible, could someone calculate the “PVI’s” for my “new” districts based on the numbers above; I’m not being lazy, just not exactly sure what the current definition is).

Maps of Presidential Performance 2008:

Photobucket

Photobucket

Baltimore City:

Photobucket

Btw, the Baltimore City precinct from the map above that voted 100% for Obama is 15-12, part of the Walbrook neighborhood !  (close-up map is below).  In addition, 47 other precincts in Baltimore City had Obama percentages of 99.0 to 99.9, while 48 voted for Obama at a 98.0 to 98.9% rate (there were also 32 precincts in Prince George’s County that had Obama percentages of between 98.0 and 98.9, and five that voted 99.0 to 99.9% for Obama).  I grew up in Baltimore and currently reside in Silver Spring, and am very proud to live in the great state of Maryland !

Photobucket

NY-St. Sen: New Deadlock as Monserrate Says He’s “Coming Home”

The story just keeps getting crazier and crazier:

Sen. Hiram Monserrate has switched sides – again.

“I’m coming home,” the Queens Democrat told the Daily News in an exclusive interview on Sunday. …

His decision creates an astonishing 31-31 deadlock in the Senate and further muddles the question of which party controls that body.

“I said I wouldn’t return to the caucus without a leadership change among the Democrats, and that has happened,” Monserrate told The News.

On Friday, Senate Democrats settled on Brooklyn’s John Sampson to replace Malcolm Smith as leader of their conference, but to keep Smith as the majority leader.

It’s very hard to say what might happen next, though Elizabeth Benjamin at the Daily News tries to game things out. Needless to say, if traitor ringleader Pedro Espada doesn’t crack, he will almost assuredly get his ass primaried if there’s any sense left in this universe. Monserrate’s twice-in-a-week side-switching probably isn’t healthful to his future, either. And if this whole coup falls apart, it’ll also be nice to see Tom Golisano get humiliated.

For some related and entertaining history, check out this post at The Thicket which chronicles Willie Brown’s attempts to block the GOP from controlling the California state Assembly in 1995 by seducing a series of dissident Republicans. Two of them were quickly recalled by voters – an option not available to Dems in New York – and the GOP eventually seized power. But a year later, Dems gained an outright majority in the chamber.

Off to the 2010 House Races for Team Blue!

In less than 17 months the midterms will be upon us.

In 2006 we fielded candidates in 425 districts and in 2008 candidates in 421.

How will we go in 2010?

Below the fold for all the details and hey go check out the shiny new 2010 Race Tracker Wiki over at Open Congress for all your House, Senate and Gubernatorial needs.

(Cross posted at Daily Kos, MyDD and Open Left)

Well for starters I think we can safely assume that we will field candidates in all 257 of the Districts that we currently hold (does anyone really think that we won’t win in CA-32 in July?).

So onto the Republican held districts:

40 GOP held Districts have confirmed Democratic Party candidates:

AL-03 (Rogers) – R+9,

AR-03 (Boozman) – R+16,

CA-03 (Lundgren) – R+6,

CA-24 (Gallegly) – R+4,

CA-26 (Dreier) – R+3,

CA-44 (Calvert) – R+6,

CA-45 (Bono Mack) – R+3,

CA-48 (Campbell) – R+6,

CA-50 (Bilbray) – R+3,

C0-06 (Coffman) – R+8,

DE-AL (Castle) – D+7,

FL-05 (Brown-Waite) – R+9,

FL-06 (Stearns) – R+10,

FL-07 (Mica) – R+7,

FL-10 (Young) – R+1,

FL-12 (Putnam OPEN) – R+6,

FL-14 (Mack) – R+11,

IL-10 (Kirk) – D+6,

IL-13 (Biggert) – R+1,

IL-18 (Schock) – R+6,

KS-04 (Tiahrt) – R+14,

KY-04 (Davis) – R+14,

KY-05 (Rogers) – R+15,

MD-06 (Bartlett) – R+13,

MN-06 (Bachmann) – R+7,

MI-11 (McCotter) – R+0,

MT-AL (Rehberg) – R+7,

NE-03 (Smith) – R+24,

NV-02 (Heller) – R+5,

NY-23 (McHugh) – R+1,

OH-02 (Schmidt) – R+13,

PA-06 (Gerlach) – D+4,

PA-16 (Pitts) – R+8,

TN-03 (Wamp OPEN) – R+13,

TN-07 (Blackburn) – R+18,

TX-26 (Burgess) – R+13,

SC-02 (Wilson) – R+9,

VA-07 (Cantor) – R+9,

WA-08 (Reichert) – D+3,

WI-01 (Ryan) – R+2,

10 GOP held Districts have Democratic Party candidates that are considering a run:

AK-AL (Young) – R+13,

CA-04 (McClintock) – R+10,

FL-16 (Rooney) – R+5,

LA-02 (Cao) – D+25,

NY-03 (King) – R+4,

OH-14 (LaTourette) – R+3,

PA-15 (Dent) – D+2,

TX-10 (McCaul) – R+10,

TX-32 (Sessions) – R+8,

WI-06 (Petri) – R+4,

4 GOP held Districts have rumoured Democratic Party candidates:

FL-13 (Buchanan) – R+6,

MN-03 (Paulsen) – R+0,

SC-01 (Brown) – R+10,

SC-03 (Barrett OPEN) – R+17,

124 GOP held Districts don’t have any Democratic Party candidates:

AL-01 (Bonner) – R+14,

AL-04 (Aderholt) – R+26,

AL-06 (Bachus) – R+29,

AZ-02 (Franks) – R+13,

AZ-03 (Shadegg) – R+9,

AZ-06 (Flake) – R+15,

CA-02 (Herger) – R+11,

CA-19 (Radanovich) – R+9,

CA-21 (Nunes) – R+13,

CA-22 (McCarthy) – R+16,

CA-25 (McKeon) – R+6,

CA-40 (Royce) – R+8,

CA-41 (Lewis) – R+10,

CA-42 (Miller) – R+10,

CA-46 (Rohrabacher) – R+6,

CA-49 (Issa) – R+10,

CA-52 (Hunter) – R+9,

C0-05 (Lamborn) – R+14,

FL-01 (Miller) – R+21,

FL-04 (Crenshaw) – R+17,

FL-09 (Bilirakis) – R+6,

FL-15 (Posey) – R+6,

FL-18 (Ros-Lehtinen) – R+3,

FL-21 (Diaz-Balart) – R+5,

FL-25 (Diaz-Balart) – R+5,

GA-01 (Kingston) – R+16,

GA-03 (Westmoreland) – R+19,

GA-06 (Price) – R+19,

GA-07 (Linder) – R+16,

GA-09 (Deal OPEN) – R+28,

GA-10 (Broun) – R+15,

GA-11 (Gingrey) – R+20,

ID-02 (Simpson) – R+17,

IL-06 (Roskam) – R+0,

IL-15 (Johnson) – R+6,

IL-16 (Manzullo) – R+2,

IL-19 (Shimkus) – R+9,

IN-03 (Souder) – R+14,

IN-04 (Buyer) – R+14,

IN-05 (Burton) – R+17,

IN-06 (Pence) – R+10,

IA-04 (Latham) – R+0,

IA-05 (King) – R+9,

KS-01 (Moran OPEN) – R+23,

KS-02 (Jenkins) – R+9,

KY-01 (Whitfield) – R+15,

KY-02 (Guthrie) – R+15,

LA-01 (Scalise) – R+24,

LA-04 (Fleming) – R+11,

LA-05 (Alexander) – R+14,

LA-06 (Cassidy) – R+10,

LA-07 (Boustany) – R+14,

MI-02 (Hoekstra OPEN) – R+7,

MI-03 (Ehlers) – R+6,

MI-04 (Camp) – R+3,

MI-06 (Upton) – R+0,

MI-08 (Rogers) – R+2,

MI-10 (Miller) – R+5,

MN-02 (Kline) – R+4,

MS-03 (Harper) – R+15,

MO-02 (Akin) – R+9,

MO-06 (Graves) – R+7,

MO-07 (Blunt OPEN) – R+15,

MO-08 (Emerson) – R+17,

MO-09 (Luetkemeyer) – R+9,

NE-01 (Fortenberry) – R+11,

NE-02 (Terry) – R+6,

NJ-02 (LoBiondo) – D+1,

NJ-04 (Smith) – R+6,

NJ-05 (Garrett) – R+7,

NJ-07 (Lance) – R+3,

NJ-11 (Frelinghuysen) – R+7,

NY-26 (Lee) – R+6,

NC-03 (Jones) – R+16,

NC-05 (Foxx) – R+15,

NC-06 (Coble) – R+18,

NC-09 (Myrick) – R+11,

NC-10 (McHenry) – R+17,

OH-03 (Turner) – R+5,

OH-04 (Jordan) – R+15,

OH-05 (Latta) – R+9,

OH-07 (Austria) – R+7,

OH-08 (Boehner) – R+11,

OH-12 (Tiberi) – D+1,

OK-01 (Sullivan) – R+16,

OK-03 (Lucas) – R+24,

OK-04 (Cole) – R+18,

OK-05 (Fallin OPEN) – R+13,

OR-02 (Walden) – R+10,

PA-05 (Thompson) – R+9,

PA-09 (Shuster) – R+17,

PA-18 (Murphy) – R+6,

PA-19 (Platts) – R+12,

SC-04 (Inglis) – R+15,

TN-01 (Roe) – R+21,

TN-02 (Duncan) – R+16,

TX-01 (Gohmert) – R+21,

TX-02 (Poe) – R+13,

TX-03 (Johnson) – R+14,

TX-04 (Hall) – R+21,

TX-05 (Hensarling) – R+17,

TX-06 (Barton) – R+15,

TX-07 (Culberson) – R+13,

TX-08 (Brady) – R+25,

TX-11 (Conaway) – R+28,

TX-12 (Granger) – R+16,

TX-13 (Thornberry) – R+29,

TX-14 (Paul) – R+18,

TX-19 (Neugebaeur) – R+26,

TX-21 (Smith) – R+14,

TX-22 (Olsen) – R+13,

TX-24 (Marchant) – R+11,

TX-31 (Carter) – R+14,

UT-01 (Bishop) – R+21,

UT-03 (Chaffetz) – R+26,

VA-01 (Wittman) – R+7,

VA-04 (Forbes) – R+4,

VA-06 (Goodlatte) – R+12,

VA-10 (Wolf) – R+2,

WA-04 (Hastings) – R+13,

WA-05 (McMorris Rodgers) – R+7,

WV-02 (Capito) – R+8,

WI-05 (Sensenbrenner) – R+12,

WY-AL (Lummis) – R+20,

So we now have candidate in 297 House Districts, 10 Districts with candidates considering their options and 4 with rumoured candidates.

Whilst in numerical terms we are about where we were at this stage in 2007 we do now hold 20 more districts but we also control the White House (still love saying that).

So at this stage there is no real cause for concern vis a vis candidate recruitment but so much more remains to be done.

On the upside we already have a full slate in 15 states – Arkansas, Connecticut, Delaware, Hawaii, Maine, Maryland, Massachusetts, Montana, Nevada, New Hampshire, New Mexico :), North Dakota, Rhode Island, South Dakota & Vermont.

We also have only 1 district to fill in 7 states – Alaska, Colorado, Idaho, Mississippi, Oregon, West Virginia and Wyoming.  

On the other hand however Texas is a problem for us as it has been for the last two cycles with 19 Districts still to fill. So too do we have far too many vancancies in California and Florida but at least in these 2 states we do already have candidates in a number of Republican districts.

Expect candidates to bob up with increasing frequency from here on in.

Any news, gossip or thoughts in the comments please.

By what margin will Bob Shamansky win?

View Results

Loading ... Loading ...

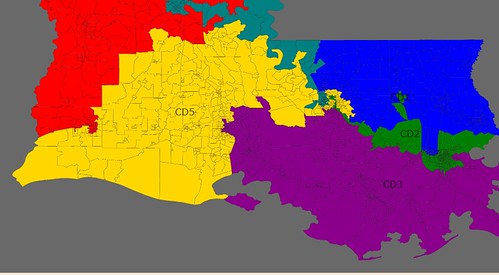
Louisiana Redistricting: Party like it’s 1992!

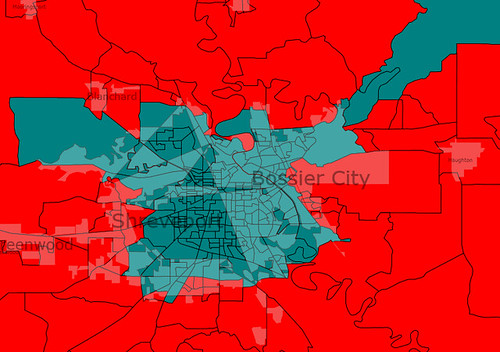
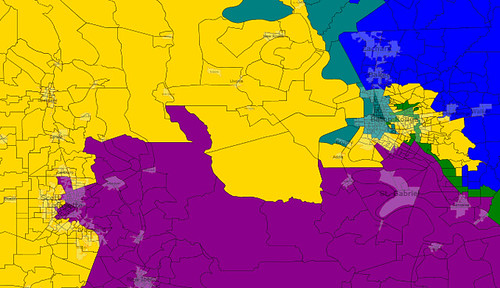
So the images are pretty self-explanatory. I’ve created two minority-majority districts and protected (I think) Charlie Melancon. My working assumption is that we’re at the end of the road for electing white Democrats in the deep south. Of course, the final map will not look like this: I’ve recreated the Cleo Fields’s illegal “Z” district. So what I have in mind is what a Democratic gerrymander might look at. Enjoy….

North Louisiana:

N Louisiana

South Louisiana:

South Louisiana

Shreveport:

Shreveport

Baton Rouge and Lafayette:

Baton Rouge and Lafayette

New Orleans:

NO

MI Prop 2

District 53 Rebekah Warren D 74.25 – 25.75 NO

District 69 Mark Meadows D 62.27 – 37.73 NO

District 27 Ellen Cogen Lipton D 58.82 – 41.18 NO

District 52 Pam Byrnes D 55.64 – 44.36 NO

District 26 Marie Donigan D 54.55 – 45.45 NO

District 67 Joan Bauer D 54.38 – 45.62 NO

District 39 Lisa Brown D 53.41 – 46.59 NO

District 60 Robert Jones D 53.00 – 47.00 NO

District 04 Coleman Young II D 50.94 – 49.06 NO

District 07 Jimmy Womack D 50.16 – 49.84 NO

District 37 Vicki Barnett D 50.03 – 49.97 YES

District 54 Alma W. Smith D 50.27 – 49.72 YES

District 03 Bettie Cook Scott D 50.39 – 49.61 YES

District 06 Fred Durhal, Jr. D 50.88 – 49.22 YES

District 09 Shanelle Jackson D 50.90 – 49.10 YES

District 01 Tim Bledsoe D 51.19 – 48.81 YES

District 11 David Nathan D 52.12 – 47.88 YES

District 12 Rashida Tlaib D 52.87 – 47.13 YES

District 34 Woodrow Stanley D 52.92 – 47.08 YES

District 10 Gabe Leland D 52.95 – 47.05 YES

District 08 Geo. Cushingberry D 53.14 – 46.86 YES

District 05 Bert Johnson D 53.17 – 46.83 YES

District 95 Andy Coulouris D 53.24 – 46.76 YES

District 35 Vincent Gregory D 53.35 – 46.65 YES

District 76 Roy Schmidt D 53.45 – 46.55 YES

District 02 LaMar Lemmons D 54.07 – 45.93 YES

District 29 Tim Melton D 54.43 – 45.57 YES

District 20 Marc Corriveau D 54.57 – 45.53 YES

District 15 Gino Polidori D 55.10 – 44.90 YES

District 67 Barb Byrum 55.86 – 44.14 YES

District 49 Lee Gonzales D 55.99 – 44.01 YES

District 28 Lesia Liss D 56.48 – 43.52 YES

District 14 Ed Clemente D 56.67 – 42.33 YES

District 13 Andrew Kandrevas D 56.71 – 42.29 YES

District 42 Harold Haugh D 56.92 – 43.08 YES

District 75 Robert Dean D 56.92 – 43.08 YES

District 17 Andy Dillon D 57.50 – 42.50 YES

District 18 Richard LeBlanc D 57.71 – 42.29 YES

District 16 Bob Constan D 58.00 – 42.00 YES

District 22 Douglas Geiss D 58.25 – 41.75 YES

District 21 Dian Slavens D 58.26 – 41.74 YES

District 24 Sarah Roberts D 58.42 – 41.58 YeS

District 90 Doug Bennett D 58.58 – 41.42 YES

District 31 Fred Miller D 58.67 – 41.33 YES

District 55 Kathy Angerer D 58.82 – 41.18 YES

District 62 Kate Segal D 58.94 – 41.06 YES

District 101 Dan Scripps D 59.01 – 40.99 YES

District 50 Jim Slezak D 59.49 – 40.51 YES

District 76 Jeff Mayes D 59.96 – 40.04 YES

District 48 Richard Hammel D 60.21 – 39.79 YES

District 109 Steve Lindberg D 60.87 – 39.13 YES

District 23 Deb Kennedy D 60.89 – 39.11 YES

District 25 Jon Switalski D 61.03 – 38.97 YES

District 64 Martin Griffin D 61.81 – 38.19 YES

District 91 Mary Valentine D 61.95 – 38.05 YES

District 32 Jennifer Haase D 62.51 – 37.49 YES

District 65 Mike Simpson D 62.78 – 37.22 YES

District 57 Dudley Spade D 63.14 – 36.86 YES

District 84 Terry Brown D 64.62 – 35.38 YES

District 107 Gary McDowell D 64.65 – 35.35 YES

District 70 Mike Huckleberry D 65.01 – 34.99 YES

District 103 Joel Sheltrown D 65.22 – 34.88 YES

District 56 Kate Ebli D 65.84 – 34.16 YES

District 106 Andy Neumann D 66.89 – 33.11 YES

District 110 Mike Lahti D 68.09 – 31.91 YES

District 108 Judy Nerat D 71.75 – 28.25 YES  

Michigan: A Master Work of Redistricting

Below, in three parts, I am going to display the piece of redistricting that I am most proud of so far, Michigan. I might have settled for less than some people, but I can make a guarantee; I guarantee you that under this map Thadeus McCotter is screwed six ways from Sunday, and that Democrats will have too, reliable, if swingish, western Michigan seats, and that a 10-4 delegation is tough, but fair seeing the direction Michigan has been trending the past two decades.  

To start let me give you a view of northern Michigan, where two districts take up almost 2/3rds of the state’s landmass:

Northern Michigan Congressional Map

(I apologize, on this map version there are no numbers, but in the main view below both are numbered, for references blue is the 1st and green the 2nd, as any familiar with the app will know).

Okay. Northern Michigan was fairly simple, and only small changes. Mainly I cut conservative Antrim County from MI-01 and overall added, to meet population demands, the rest of Bay County, which gives the district a firm Democratic anchor. Now the Up is already a lot more Democratic on a state and local level than a Presidential one so MI-01, though still swingish, is fairly secure for Democrats under this map, not that any Republican could ever beat Bart Stupak. Now I don’t have moral qualms about splitting counties, but it is nice split only one county.

MI-02 is also a nice lesson in compactness and sensibility, as it contains most of rural upstate Michigan and remains fairly conservative, and would be an easy district for Dave Camp to hold, especially with his home county of Midland in it, (I toyed with the idea of making a Midland-Geneese-Saginaw based district). Basically its mostly Republican territory, though not gerrymandered that way. Its very agricultural and rural and would share a common interest in Congress, a well done district in my mind.

Now here is the main part of Michigan:

Main Section of Michigan

My main goal was to give Muskegeon and Grand Rapids a more moderate representative, so combining them together formed a Democratic leaning, but somewhat swingish, (if you don’t use Obama’s stellar Western Michigan numbers), district. Then I merged much of Hoekstra and Upton’s districts and got a new, Ottawa-Allegan-St. Berien based district that is extremely conservative and strongly Republican. Unfortunately its so conservative that the Ottawa County Republican it will elect this year will probably take out the most moderate member of the states Republican delegation, Fred Upton.

My next goal was to make a more reliably Democratic Central Michigan district. We’ve failed time and again to take down Mike Rogers and we already had Schauer. I looked at his district and saw that it contained many rural, solidly conservative areas, plus some conservative, swingish suburban areas and Battle Creek in Calhoun. Battle Creek is only mildly Democratic leaning, even though it is Schauer’s base, and Calhoun is swingish to conservative. So overall it is R+1.5 according to my calcs, and a lot more problematic and tough than it would appear on the surface. So I altered it, somethings just fell into my lap; heavily Democratic Kalamazoo, gerrymandered out of the district in 2002 by the GOP to keep it safe, had to be included because their was no room for it elsewhere. Beyond that it was my decision whether to take in more rural Republican territory, or take in heavily Democratic Lansing. I chose to take in Lansing, along with more conservative and suburban Eaton County in order to make an urban central Michigan district that would be reliably Democratic.

The only nasty district is the new sixth, as you see. Its Mike Rogers new district, and its not very pretty. It takes up most of rural western and central Michigan, plus the city of Jackson and suburban, (and strongly Republican), Livingston county. I went this direction partially because Rogers district was unwinnable with Livingston and its other territory in it, but I didn’t want to cede McCotter and weaken Schauer to take him out so I gave him a conservative Central Michigan seat that will be reliably Republican in the near future.

As you can also see the new 12th was almost completely removed from Wayne county, its now mostly based in Washtenaw, Lenawee and Monroe, but its still very liberal and reliably Democratic, its just not based in the immediate blue collar suburbs of Detroit like it has traditionally been it’s now much larger in area.

As you can see the 7th and the 8th are almost unchanged, a Republican leaning thumb district, and a Flint north-central Michigan district that is very Democratic.

Here’s a close up of Detroit, and keen eyes should see immediately how I screwed McCotter and how desperate I was to make sure he would not get reelected, (assuming he survives this round):

Detroit Close Up

Again, sorry, but this batch was not numbered for some reason, (got erased when I did pasted the picture), but they remain on the main picture if you would like to reference.

Take note of the pink district, that is MI-10, and it is meant for McCotter. I was pretty angry almost with it, lol. I stripped his base Livonia, which despite being fairly Democratic inexplicably votes for him due to his mother’s influence. Then I took out most of the more exurban and conservative Oakland County areas that used to comprise the northern in, and went one step further and took in almost all of Dingell’s current district, putting in totally new and heavily blue collar, strongly Democratic areas like Romulus, Taylor, Dearborn and Westland in a new Wayne county based 10th. Believe me, he’ll be gone in that district, around 65-35 Obama, 70% new, no way to win. And he can’t run with Livonia, that’s in even more Democratic, and majority black, MI-14, the grungy green color.

In fact he might have much more luck running against Gary Peters in MI-09, the bright blue, though it still be very terrible odds, a strong two term incumbent a fairly Democratic leaning and trending Oakland district, and almost completely new to McCotter. So I give him little odds.

My only scruples with the Detroit are are actually MI-09 and MI-11, (bright neon green), Sander Levin and Gary Peters’ districts. MI-11 more so, because the current territory Levin represents is strong Democratic, about 62-38, but eying this new district, (where I tried to make minimal changes), it seems like it couldn’t be too much more than a 56% Obama performance, I dunno, maybe I’m underestimating his performance in southern Macomb as opposed to northern Macomb. And of course politically Peters’ district remains about the same on the spectrum, though with some new territory and a good deal more suburban out Oakland. Republicans still have a very solid roster of candidates and a good deal of local power in Oakland, so I would have liked to give Peters a somewhat more secure district.

The two VRA districts remain so. Both are overwhelmingly Democratic, and I tried to make sure they were both fairly compact, one north Detroit and one south. The north one takes in Livonia out of outer Wayne and part of Oakland in Farmington Hills, but Democratic leaning areas anyway, but much whiter and somewhat more affluent. But the demographics remain: 381,585 black, 280,623 white, 21,205 Asian, and 12,1918 Hispanic. The two aren’t so much north and south as east and west, and the 14th takes in the western side of the city and is slightly less black, but has a much larger Hispanic population; 366,283 black, 258,019 white, 82,863 Hispanic, 15,089 Asian.

So on the whole is a very good map, with mostly compact districts and not to much bad gerrymandering. With drawing this map I’m making two major assumptions, one, that Democrats will take the State Senate, two, that Democrats will hold the governorship. Since both seem slightly more likely than not to me at this early point, (being forced to make a call), I chose to use my Democratic gerrymander and not the much rosier, (for the GOP), compromise map.

I like it. I think its a good map that gives good representation to the various interests in the states delegation and doesn’t split many communities at all. Its 9-5, which I think is imminently fair, since the state is moving towards a more reliably Democratic point. I tend to think, when gerrymandering, in terms of the states overall leanings and whats fair, (the Oregon map was just to see how it would turn out), and not just drawing a bunch of swing districts.

It technically challenges two Republicans, Vernon Ehlers from Grand Rapids, and Thadeus McCotter. It is a possibility that Ehlers could hold his seat if Obama’s performance declines significantly and it turns out the Western Michigan numbers were a one time fluke, but either way it remains swingish, with a definite and reliable Democratic lean in Muskegeon, (don’t know why, it borders Ottawa), and Grand Rapids now a swingish, if not Democratic leaning, City itself. McCotter has no chance of survival unless he is the next Chet Edwards, which I doubt, since he’s really struggled the last two cycles in a much more favorable district and against completely unheralded challengers.

So, lets here, what are your thoughts. Oh, and like I beat on yesterday, (hahaa), PLEASE VOTE IN THE POLL not yelling, just making sure people see it. People finally started yesterday, but I at one point i had like 4 different commenter and not one vote in the poll. Even if you don’t care, please vote. I use it as a sort of counter, a useful tool that I’d like to see on here one day. Its encouraging to feel you have a decent audience and that you’re not talking to 4 or 5 people, which is what it feels like sometimes. So it’d be very greatly appreciated if you’d vote, as a favor to me.

Update: After user comments I made the following adjustments to the Detroit area seats:

detroit map redone

By what margin will Bob Shamansky win?

View Results

Loading ... Loading ...

Redistricting Michigan

This is my attempt at a Michigan Democratic gerrymander. Assuming they can hold the Governors mansion and win back the state senate. I looked up the political data and calculated the results for each district. My map ends up giving Peters and Schauer more Democratic districts. It most likely gets rid of Rogers, Camp, and McCotter and gives the Dems a pickup opportunity in the 2nd in an open seat or against a freshmen Republican that voted 54.6 for Obama.

Image Hosted by ImageShack.us

Image Hosted by ImageShack.us

District 1 – Bart Stupak(D-Menominee)

Stays Pretty much the same picks up Grand Traverse County and loses its area of Bay County

Voted 49.60-48.49 Obama

District 2 – Open/Hoekstra replacement

Loses its Republican areas to the south and picks up Bay County and some of the small counties inbetween

Voted 54.67-43.55 Obama

District 3 – Open/Hoekstra replacement

Loses Grand Rapids and picks up the surronding republican areas

Voted 57.3-40.93 McCain

District 4 – John Dingell(D-Dearborn)

The problem with my map is John Dingell doesnt live in the 4th he lives in the 14th(Conyers). So unless he retires or agrees to move the easiest solution would be to swap areas with the 11th and 14th and have Dingell run against McCotter. With the 11th, 13th, 14th expanding the new 4th takes in little of Wayne County and now takes in Hillsdale County, Lenawee County, more of Wastenaw County and some of Oakland County.

Voted 56.43-41.95 Obama

District 5 – Dale Kildee(D-Flint) vs Mike Rogers(R-Howell)

Loses Saginaw and Bay City to break up the republicans gerrymander and picks up Shiawassee County and Livingston County to balance out heavy democratic Flint

Voted 56.59-41.7 Obama

District 6 – Vern Ehlers(R-Grand Rapids) vs Fred Upton(R-St Joseph)

Switches population centers from Kalamazoo to Grand Rapids to pack republicans into the 3rd. Becomes slighty less Democratic

Voted 52.79-45.58 Obama

District 7 – Mark Schauer(D-Battle Creek)

Loses Hillsdale, Lenawee, and Eaton Counties. Picks up Kalamazoo, Cass, and St Joseph. Becomes slighty more Democratic.

Voted 53.96-44.32 Obama

District 8 – Dave Camp(R-Midland)

Loses Livingston and picks up Eaton and Saginaw to become more Democratic

Voted 58.71-39.71 Obama

District 9 – Gary Peters(D-Bloomfield hills)

Picks up Southfield loses Farmington hills to become more Democratic

Voted 58.38-40.28 Obama

District 10 – Candice Miller(R-Harrison Township)

Miller would no longer live in this district but I assume she wouldnt want to face off against Levin. Becomes slighty more republican.

50.94-47.12 McCain

District 11 – Thaddeus McCotter(R-Livonia)

Picks up Ypsilanti, Romulus, Inkster, and Farmington Hills and loses its republican parts of Oakland County.

Voted 60.44-38.02 Obama

District 12 – Sander Levin(D-Royal Oak)

Loses Southfield and picks up Sterling Heights. Becomes less Democratic

Voted 59.27-38.85 Obama

District 13 – Carolyn Kilpatrick(D-Detroit)

Stays the same but had to expand picks up some areas to the south

51.8% Black

District 14 – John Conyers(D-Detroit)

Picks up the rest of Dearborn and Taylor

52.2% Black

Redistricting Texas, y’all!

Ok, so I decided to take on Texas. My mindset for this map was that Republicans would be controlling it, but they would be exercising rationality, realizing their time of statewide domination may be nearing a close, and that throwing Democrats a few bones now is much better than throwing Democrats the entire map later in the decade. If you don’t think Republicans will wake up and smell the coffee and just gun for a dummymander, get your grain of salt ready now.

Of course, a special thanks goes out to Dave and his amazing Redistricting App for making this all possible.

North Texas:

South Texas:

Zoom-ins

Dallas-Fort Worth:

Houston:

San Antonio/Austin:

Photobucket

In detail:

Texas’s 1st Congressional District (Medium Blue)

-Tyler, Longview, Lufkin

67% White, 17% Black, 14% Hispanic

Texas’s 2nd Congressional District (Dark Green)

-Beaumont, Port Arthur, La Porte

64% White, 17% Black, 16% Hispanic

—Picks up Chambers & east Galveston Counties, along with some of the Whiter parts of the old TX-22’s portion of Harris County, while ceding part of the Spring area to the new TX-34

Texas’s 3rd Congressional District (Purple)

-Most of Plano, McKinney, Allen

65% White, 15% Hispanic, 10% Asian

—This area has grown ridiculously and is rapidly Dem-trending. It does shed some of south Collins County to shore up the TX-32, but staves off the coming demographic disaster by dropping the Garland area as well. To help compensate, it picks up some of exburban Collins County from the TX-4.

Texas’s 4th Congressional District (Red)

-Sherman, Texarkana, Paris

75% White, 11% Hispanic, 11% Black

Texas’s 5th Congressional District (School Bus Yellow)

-West Dallas, most of Mesquite, Most of Garland

57% White, 24% Hispanic, 13% Black

—This picks up most of the Garland area, and while that helps boosts the minority population significantly, it should be more than compensated by the uber-conservative rural population (though it drops some of that as well).

Texas’s 6th Congressional District (Teal)

-College Station, Huntsville, Corsicana

66% White, 18% Hispanic, 14% Black

—I ended up pulling this completely out of Tarrant County, making this an entirely exburban/rural district, which makes it more conservative and helps facilitate the creation of a new conservative-leaning district in south Tarrant County.

Texas’s 7th Congressional District (Light Grey)

-West Houston, Bellaire

58% White, 27% Hispanic

—Picks up some of the Katy area while dropping some Hispanic-majority blocks. The long-term prognosis for keeping this district Republican still isn’t fantastic, but it’s that much better than it was.  

Texas’s 8th Congressional District (Steel Blue)

-The Woodlands, Conroe

75% White, 15% Hispanic

Texas’s 9th Congressional District (Cyan)

-Southwest Houston, part of Missouri City

36% Black, 35% Hispanic, 15% White, 12% Asian

—Keeping this plurality African-American was not fun (though admittedly it would have been easier if I weren’t trying to keep Hispanics out of the TX-7). What are the odds this ratio holds out until 2020? Is there precedent for congressional districts transitioning from one protected group until the other?

Texas’s 10th Congressional District (Rose)

-Part of Austin, Pflugerville, Gonzales

64% White, 23% Hispanic

—Pulling out of Harris County doesn’t really help Michael McCaul, but dropping some heavily-Hispanic parts of Austin and picking up several heavily-Republican rural counties and the more conservative parts of the old TX-21’s section of Travis County, so this should be a net-gain. The time is coming when the premise of having a Republican-leaning district taking in a large portion of Austin is ridiculous, but this is probably the best bet for holding on in the meantime.

Texas’s 11th Congressional District (Chartreuse)

-Midland, Odessa, San Angelo

60% White, 35% Hispanic

—With Charlie Stenholm long gone, I went ahead and smoothed out the west Texas districts because none of them are electing a Republican any time remotely soon.

Texas’s 12th Congressional District (Cornflower Blue)

-West Fort Worth, Haltom City

60% White, 29% Hispanic

—Takes in a little more of inner-city Fort Worth, but Granger is (relatively speaking) fairly moderate so it should be a non-issue.

Texas’s 13th Congressional District (Coral Pink)

-Amarillo, Wichita Falls, Pampa

65% White, 26% Hispanic

Texas’s 14th Congressional District (Olive)

-Victoria, Lake Jackson, Seguin

53% White, 36% Hispanic

—Pulls out of Galveston County and picks up more rural counties in Central Texas that the Rio Grande Valley districts have to drop, which does increase the Hispanic population notably. It doesn’t appear to have a major impact on the Republican performance.

Texas’s 15th Congressional District (Orange)

-McAllen, Harlingen, Edinburg

87% Hispanic, 11% White

—This area has grown a ton, so it officially gets to stop being a strip. Neato.

Texas’s 16th Congressional District (Green)

-El Paso, Socorro

81% Hispanic, 14% White

Texas’s 17th Congressional District (Ultramarine)

-Waco, Kileen, Temple

57% White, 22% Hispanic, 17% Black

—The Democratic performance improves significantly here, as the district picks up part of Williamson County and all of Bell County to take the heat off of John Carter and to provide Joe Barton with an entirely non-Metroplex district. I’d guesstimate that McCain still won this district with about 59%-60%, so it hardly leans Democratic (if anything, Chet Edwards might be in more danger from a Republican who can outperform in Bell and Williamson Counties) but it’s not like the Republicans would be interested in helping Edwards out anyway. Realistic? What are your thoughts?

Texas’s 18th Congressional District (Yellow)

-Central Houston

41% Black, 38% Hispanic, 15% White

—Has to shed several Hispanic areas to the TX-29 District to keep African-Americans in the driver’s seat.

Texas’s 19th Congressional District (June Bud)

-Lubbock, Abilene, Big Spring

62% White, 30% Hispanic

—Again, Charlie Stenholm will be but a memory by 2012, so smoothing out these lines and making this district vaguely more Democratic shouldn’t be an issue.

Texas’s 20th Congressional District (Pink)

-Central San Antonio

72% Hispanic, 20% White

Texas’s 21st Congressional District (Maroon)

-North San Antonio, New Braunfels, Universal City

62% White, 28% Hispanic

—Becomes more San Antonio-based than ever taking in most of Bexar County’s predominately White areas. It drops the Austin area and some of its rural Counties.

Texas’s 22nd Congressional District (Chocolate)

-Sugarland, most of League City, part of Missouri City

56% White, 22% Hispanic, 11% Asian

—This drops its portions of Pasadena, La Porte and most of Pearland while picking up more of Galveston County.  Should be a bit more Republican overall.

Texas’s 23rd Congressional District (Aqua)

-South San Antonio, Del Rio, Pecos

70% Hispanic, 21% White

—The Hispanic population goes up because it now takes in a greater share of South San Antonio along with a few more Hispanic neighborhoods on the east side. Probably still not totally out of reach for Republicans, but it’ll be a little harder than it was. They could make this district more conservative but they’d probably be kinda hesitant given its legal history.

Texas’s 24th Congressional District (Royal Purple)

-Most of Carrollton, Euless, Grapevine,

62% White, 17% Hispanic, 12% Black

—Dropping the Grand Prairie area is a big help to Kenny Marchant, though this district does have to pick up some kinda-competitive areas in north Arlington and central Fort Worth. Still should be conservative enough to hold up through 2020.

Texas’s 25th Congressional District (Salmon Pink)

-Part of Austin, San Marcos

43% White, 42% Hispanic

—Shrinks considerable, mostly to help Michael McCaul. It might actually be plurality Hispanic by 2010, though it would likely still be dominated by liberal Whites, so I don’t know if it would qualify as a protected district.

Texas’s 26th Congressional District (Gray)

-Denton, Frisco, Lewisville

72% White, 16% Hispanic

—Drops central Fort Worth which, along with the new exburban Collins County portion, which makes it much more conservative. Maybe too much so? Should these lines be altered to somehow take the heat off of Pete Sessions? Is that even possible?

Texas’s 27th Congressional District (Spring Green)

-Corpus Christi, Brownsville, Kingsville

71% Hispanic, 25% White

Texas’s 28th Congressional District (Mauve)

-Laredo, Mission, Eagle Pass

91% Hispanic

—Would a 91% Hispanic district even be legal? This really isn’t that gerrymandered; it moves out of its awkward chunk of Bexar County and consolidates the voices in the Central Rio Grande Valley. But still, as one of (the?) least White districts in the nation, would this count as packing even if it makes geographical sense?

Texas’s 29th Congressional District (Tea Green)

-East & North Houston, Galena Park

63% Hispanic, 21% White, 13% Black

—The percentage of the population which is Hispanic actually drops somewhat in part because of the new TX-33 to the immediate South which takes the old TX-29’s portions of north Pasadena and east Houston, but Hispanics are still the decisive majority.

Texas’s 30th Congressional District (Carnation Pink)

-South Dallas, DeSoto

44% Black, 37% Hispanic, 17% White

—This district had actually slipped to plurality Hispanic as of 2007, so give that I was creating a new Hispanic-protected district next door, the goal here was to make this district plurality African-American again.

Texas’s 31st Congressional District (Cream)

-Round Rock, Copperas Cove, Cleburne

72% White, 18% Hispanic

— The Austin suburbs are looking fairly purple, and it looks pretty plausible that Williamson County will follow the tradition of other suburban areas of “creative class” cities like Clackamas and Washington Counties outside Portland and eastern King County outside Seattle and turn a nice shade of blue as the young, well-educated city dwellers begin to “grow up” and move to suburbs, yet still maintain a lot of their liberal values. The current TX-31 is holding up better than some other Texas districts right now, but I think, if left in the same basic iteration, it would probably be the 2nd or 3rd district to slip out of Republican hands in the next decade after the current TX-32 and maybe the current TX-10. So, in short, this picked up several rural counties from the old TX-11 and TX-17.

Texas’s 32nd Congressional District (Tangerine)

-North Dallas, part of Irving, Richardson

53% White, 29% Hispanic

—More than any other district, the TX-32 was looking at imminent catastrophe. Demographically speaking, as of 2007, Whites were only about 1% more of the population than Hispanics, and Obama made an impressive 46% showing here. The creation of the new TX-33 District allowed the TX-32 to cede several Hispanic areas in west Dallas, south Irving and Farmer’s Branch, and instead picks up some conservative areas of south Collins County (it was needed to shrink in population somewhat anyway).  This district will probably still be competitive by the end of the next decade, but that’s better than leaning Democratic, which is would be with the current format.

Whew, anyone still with me? Ok. Let’s look at my ideas for the 4 new districts

Texas’s 33rd Congressional District (Persian Blue)

-Southeast Houston, part of Pasadena, most of Pearland

52% Hispanic, 28% White, 15% Black

—The idea behind this district is take the pressure off of Houston area Republican congressmembers, pretty much all of whom would be in various states of vulnerability in the next several years unless the Hispanic population in their districts stay static or are reduced. It gets kinda meandering at some points, especially as it goes down to take in its Galveston County portion, which actually for the most part is more African-American than Hispanic, but that helps TX-22.

Texas’s 34th Congressional District (Bright Green)

-Katy, Tomball, Brenham

64% White, 22% Hispanic

—Western Harris County is notorious for its sprawl, and this district should lean pretty strongly Republican, especially with its added rural counties. It should be Republican enough that taking in the Hispanic areas that it does from the 9th shouldn’t be a huge deal.

Texas’s 35th Congressional District (Lavender)

-Part of Dallas, part of Grand Prairie, part of Arlington

58% Hispanic, 22% White, 15% Black

—Even if Republicans aren’t as rational as the previous districts would suggest, they’d have to be stunningly foolish and short sided to not put up a Hispanic-majority district in the Dallas area. I’d be surprised if the Justice Department doesn’t order at least one new Hispanic-majority district anyway, and this would be the best place to put it. Anyway, this district vaguely resembles Martin Frost’s old district, taking in part of Arlington and Fort Worth, crossing over into Grand Prairie, west Dallas, south Irving, and then up to Farmer’s Branch and a shameful sliver of north Dallas. Frankly, this district is a little gross, but it takes Pete Sessions, Kenny Marchant, and Eddie Bernice Johnson (or, as far as what Republicans will actually care about, their asses if they don’t protect the African-America community of south and downtown Dallas) out of hot water, so there you go.

Texas’s 36th Congressional District (Gold)

-Part of Fort Worth, part of Arlington, Mansfield

58% White, 23% Hispanic, 13% Black

—Takes in south Fort Worth, south Arlington, a sorta awkward part of southwestern Dallas County, and in to most of rapidly growing Johnson and Ellis Counties. Should lean pretty strongly Republican, though maybe not as strongly as I’d like.

So there you go. Comments? Remember, this map, while certainly favorable to Republicans, assumes some rationality, and that they recognize that throwing us a few bones now will present  a world of hurt later, but do you think they’ll be dumb enough to shoot for a dummymander? Assume that Pete Sessions has his finger on the pulse of the Hispanic voice and that when Democrats in Austin move to the suburbs they’ll instantly become flat-out neo-con Texas-secessionists? And what might a compromise map look like if we do manage to pick up the Texas House or Texas Governor?