Fun with Utah, entertaining map

So Utah gains a seat, having no clue about Utah Politics I decided to make a district as ridiculously large as possible while keeping the deviation of population as low as possible.  I knew that most of the population in Utah was around Salt Lake City and the Provo area, but I had no idea it was that concentrated.

CD-01:  Blue deviates from the average district population with +7

CD-02:  Green deviates the least from the district average with -6 people

CD-03:  Purple deviates the most from the district average which is -26 people

CD-04:  I admit that the Red district is packed with people to make it larger.  +25 people from the district average :p

I think CD-04 may be geographically one of the largest not-at-large districts

MN Redstricting: A hopefully 7-0 map!

MN has a fair shot at either keeping its 8 seats or it may lose a seat, which only means more fun for me as I get to ponder up new maps for any and all combinations.  If you’ve been following this blog religiously so far this year, you’ve seen me post redistrictings here, here, and here.  The first two kind of suck as I did the work for them before Dave’s app and before I really knew how Democratic the suburbs had become, and the third traded in what was actually possible for what was the dream scenario in redistricting and gerrymandering.

This map would hopefully produce a 7-0 map.  Clark is given a much more swing district to run in, Kline is combined with Paulsen, and Bachmann is combined with McCollum.  However, the map could end up resulting in a 4-3 GOP majority if we didnt have the incumbents already set in 5/7 of the districts.  But this isn’t any different than the current map, Gore and Kerry won 3 of my districts and they also only won 3 of the current districts.  But MN has quite an overall Dem lean so even when the margins are against us, we still do much better at the local level do to our history of being progressive and populist.  

On to the map!

Photobucket

map with county line here

MN-1   Rep. Walz

50-47 Obama

The district doesn’t change much at all.  It comes in much closer to the Twin Cities now, and it takes in a bit more Republican areas, makes room for MN-7 to take in some Democratic areas there.  

MN-2   OPEN

50/48 McCain

This is mainly the old MN-6 with a giant chunk of MN-3.  It cuts out everything west of St. Cloud save for St. John’s University.  It nows takes in the northern half of Hennepin county starting at the Minneapolis border.  It now takes all of the blue portions of Anoka county while still taking in some 2-1 McCain exurbs.  Most of these areas have been trending blue as lower income moves from the city in search of better schools, and the suburbs are too expensive while the exurbs provide a cheap housing market.  By 2012 rolled around, I wouldnt be surprised if the district voted for Obama.

What I think makes Clark have a great shot is that I see there being two competitors who would hop into this race against her, two in state house leadership, Kurt Zellers and Tom Emmer.  Emmer is from tea-bagger country, Zellers is from the suburbs, which would set-up a nasty primary.  The tea-bag country would dominate in numbers for the GOP endorsement but in the general, there is enough moderate-Dem territory to knock out a tea-bagger unlike the current MN-6.

MN-3   Rep. Paulsen and Rep. Kline

52/46

This district goes from being a western suburban district to a southern one.  It unfortunately doesn’t get any more Democratic; if it were an 8 seat map I’d be able to work something out quite favorable to us but there is still GOP leaning areas that need to get spread out.

Id hope a primary between Kline and Paulsen would allow a DFL candidate to save up their money and make a go at this seat.  The DFL does have a commanding majority in state legislature seats so we should be able to find a solid candidate

MN-4    Rep. McCollum

60-38 Obama

Has to expand a bit to pick-up population so I threw Bachmann in with McCollum to eliminate that hot mess.  It does expand up into the exurbs a little bit, but the district really doesn’t change much at all.

MN-5   Rep. Ellison

69-29 Obama

This district changes a bit in that the current district is Minneapolis and then just expand outwards in all directions until it has enough population.  To save as many inner suburbs for MN2&3 to boost their Dems, this district heads directly west which makes it both urban, suburban, and also a little bit exurban.  

HI-01: Abercrombie to Resign Early

Add one more special election to the list:

U.S. Rep. Neil Abercrombie announced today that he is resigning from Congress to run for governor full time….

The resignation will trigger a special election to fill the remainder of Abercrombie’s current congressional term which ends January 2011. The seat will also be up for grabs in the general election in November for the next two-year term.

This may not be too much of a surprise (although Abercrombie in April said he wouldn’t resign his seat), as Abercrombie needs to spend a lot of time in Hawaii to win the race, and that’s a rather long commute from Washington DC. This decision doesn’t affect the overall electoral calculus much, as Abercrombie was already in the middle of his last term, as he can’t run for House and Governor at the same time. On the Democratic side, state Senate president Colleen Hanabusa and ex-Rep. Ed Case are already running to succeed Abercrombie; Honolulu city councilor Charles Djou is running for the Republicans. Assumedly, they will all choose to participate in the special election, although they could choose to run only in the regularly scheduled election.

Abercrombie hasn’t set his final day in office, so the date of the special election won’t be known for a while. (I’m wondering if we could have a weird circumstance like Abercrombie’s first election to the House, where on the same day he won the special election to take over the House seat but lost the Democratic primary for the full term.)

UPDATE: If the special election held in 2003 to replace Patsy Mink (which is how Ed Case won) is any indication, it looks like Hawaiian special elections are just one big pool of people from all parties, with the first-past-the-post winning the whole thing (instead of a primary and then a general). If so, that could set up a weird scenario where Djou narrowly wins the special election because Hanabusa and Case split the majority of Democratic votes (say 40% Djou, 35% Hanabusa, 25% Case).

LATER UPDATE (James): In the comments, local SSPer skaje makes the case that the special election will only hurt Djou’s chances by splitting the right-of-center vote with Ed Case. It’s an interesting argument, and I have to admit that this thought crossed my mind. There’s no denying that Case has based a lot of his appeal on his position on the rightward side of Hawaii’s political equilibrium, but whether or not we see Republican-leaning voters splitting may end up hinging upon the type of campaign that Case chooses to run.

LATE LATE SHOW UPDATE (David): When would a special election occur? Essentially, whenever the Chief Election Officer wants to. According to Hawaii statutes, the only requirement is that the “CEO” must conduct a special election within sixty days of making a proclamation that there will be a special election. But the law is silent as to how soon such a proclamation must be issued. Indeed, CEO Kevin Cronin says that his department is strapped and that there may not even be a special election, or may be delayed until the September primary. Another wrinkle is that Cronin recently announced he was stepping down at the end of this month, so the decision may not fall to him.

RaceTracker Wiki: HI-01

SSP Daily Digest: 12/11

AR-Sen: A labor-funded group, the Citizens for Strength and Security, is up with a six-digit ad buy in the Arkansas Senate race, attacking putative GOP frontrunner state Sen. Gilbert Baker for his pork-hungry ways. There’s some speculation, though, that the real target of the ad isn’t Baker but rather Lt. Gov. Bill Halter, who’s publicly mulling a primary challenge to Blanche Lincoln; observers wonder if this is a sign that the SEIU and allies are firing a shot across Halter’s bow, showing that they have Lincoln’s back (at least monetarily) in exchange for a cloture vote on health care reform for her. With the Arkansas Democratic Party also laying out a lot of money on a pro-Lincoln TV ad, there does seem to be something concerted going on.

CT-Sen: Linda McMahon has caught a lot of attention with her splashy spending on the Senate race, blowing through $2 million in three months. Her first campaign finance report, though, is creating a whole lot of question marks. A significant amount of that money isn’t itemized (as campaign finance laws would require), but rather listed as in-kind contributions from McMahon herself; this goes well beyond the usual food and travel stuff that gets listed as in-kind, to include legal fee, survey research, and technology. On the Dem side, poor Chris Dodd won’t be able to attend his own Biden-headlined fundraiser because of the Senate’s working weekend; his wife Jackie will be pinch-hitting for him.

FL-Sen: RNC chair Michael Steele previously warned stimulus-supporting moderates that the GOP would be “coming after them,” but he dialed that back in a recent St. Pete Times interview when the subject came to Charlie Crist, suggesting a more neutral RNC stance on the Senate primary. He sounded sympathetic about Crist’s job, saying being governor is “not as simple as right or left.”

IL-Sen, IL-Gov: Planned Parenthood issued endorsements in the Illinois races, and just went with the establishment choices (Alexi Giannoulias and Pat Quinn), despite Cheryle Jackson making a big issue out of reproductive rights in health care reform in her Senate primary bid. Perhaps to even things out after spurning Jackson, they also endorsed in the Cook County Board president race, giving the nod to Toni Preckwinkle.

NC-Sen: We’re already seeing some ideological differences in the North Carolina Dem primary field, as SoS Elaine Marshall and ex-state Sen. Cal Cunningham seek to differentiate themselves. Marshall says she’d support the public option, while Cunningham says he’d only have voted to start debate on HCR. (Campaign Diaries also has a longer piece on the race today.)

NY-Sen-B: Suffolk County Legislator (i.e. county commissioner in most states) Jon Cooper is the only elected Dem who has been moving full speed ahead on a primary challenge to Kirsten Gillibrand rather than tipping in a toe and then turning tail. (Activist Jonathan Tasini is already committed to a primary run too.) Cooper says he’ll make a public announcement about his intentions next week, and considering that he’s bringing along a few allies (most notably Assemblyman Charles Levine) it may point to a run… not that he’s likely to pose much of a challenge to Gillibrand.

CO-Gov: The Denver Post has an in-depth look at how the state’s teabaggers are in a lather over the party establishment’s efforts to clear the field for ex-Rep. Scott McInnis in the gubernatorial race. With state Sen. Josh Penry and ex-Rep. Tom Tancredo pushed aside, though, they don’t have anyone to hang their tri-cornered hats on, other than random businessman Dan Maes, who doesn’t seem to have the name rec or money to make much of an impact in the primary.

ID-Gov: Democrats finally landed a credible candidate to go up against Butch Otter in the Idaho governor’s race (one of the few anywhere in either column to rate as “Safe”). Keith Allred is a former Harvard professor who’s now a mediator and consultant, who’s attracted a lot of attention via his bipartisan economy-boosting group The Common Interest.

MN-Gov: Here’s another campaign finance screwup, that may hurt gubernatorial candidate Margaret Anderson Kelliher. It turns out that Kelliher maxed-out donors were directed to give to the DFL, which in turn bought an expensive voter database for Kelliher’s campaign’s use. The money has been returned, but this may point to some favoritism on the DFL’s part, because this arrangement wasn’t offered to any of the other candidates.

NV-Gov: This may be an exercise in advanced tea leaf reading, but the fact that Carolyn Goodman, wife of Las Vegas mayor Oscar Goodman, has stepped down from her post on the school board is taken to mean that she may be planning on running for Las Vegas mayor in 2011 — which would in turn suggest that Oscar Goodman will be planning on being Governor at that point.

GA-12: Bedecked in a fuschia hat, former state Sen. Regina Thomas officially kicked off her Dem primary rematch against Rep. John Barrow with an event in Savannah today. She only got 24% against Barrow last year, but may benefit from an earlier start this cycle.

TN-08: The elevation of farmer/gospel singer Stephen Fincher to “Contender” by the NRCC isn’t sitting well with some other Republicans in the district who are sniffing out the now-competitive race in the wake of Rep. John Tanner’s retirement. A few other Republicans, most notably Shelby County Commissioner George Flinn Jr., are interested. (Flinn is from the district’s small slice of Memphis suburbs, which may be a liability though in this mostly-rural district.) Also mentioned as a potential GOP candidate is Jackson-area physician Ron Kirkland.

Cook Co. Board Pres.: There’s already a poll out on the Cook County Board president race (the top slot in the nation’s second-largest county, and the race that Rep. Danny Davis recently dropped out of). Incumbent Todd Stroger is in bad shape, with only 14% of the vote; he trails both Dorothy Brown at 29 and Toni Preckwinkle at 20, leading only Terrence O’Brien at 11.

Mayors: The mayoral runoff in Houston, the nation’s fourth-largest city, is set for tomorrow. City controller Annise Parker (who just got Burnt Orange Report’s endorsement) led in the November election; she faces former city attorney Gene Locke. A Parker victory would make Houston by far the largest city to ever elect an openly LGBT mayor.

Obama wins 28 districts in New York (Redistricting w/partisan data)

After seeing the addition of partisan data for New York, I decided to try my hand at creating a 28-0 map of New York (well at least a map where Obama won 28 districts in 2008).

From the outset, there are a couple of assumptions that went into the design. 

1) Keep intact county lines as much as possible.
2) Make it difficult for Republicans to win the district.
3) Ignore homes of incumbents (both R and D)
4) I also did not match up existing district numbers with the map

The top level description of the map is that I succeeded. In western NY, I grouped counties in an East-West manner, splitting Buffalo and stretching those districts from the Finger Lakes to Lake Erie. In eastern NY, I grouped counties North/South with Scott Murphy's District going from the Canadian border to Dutchess County. On Long Island, I split NY 2 to go East-West across eastern Suffolk and Nassau counties. 

In the end, I created 28 districts Obama won, with only four district where Obama won with 51% of the vote or less.
NY 2009,Redistricting


Long Island

NY 2009,Redistricting

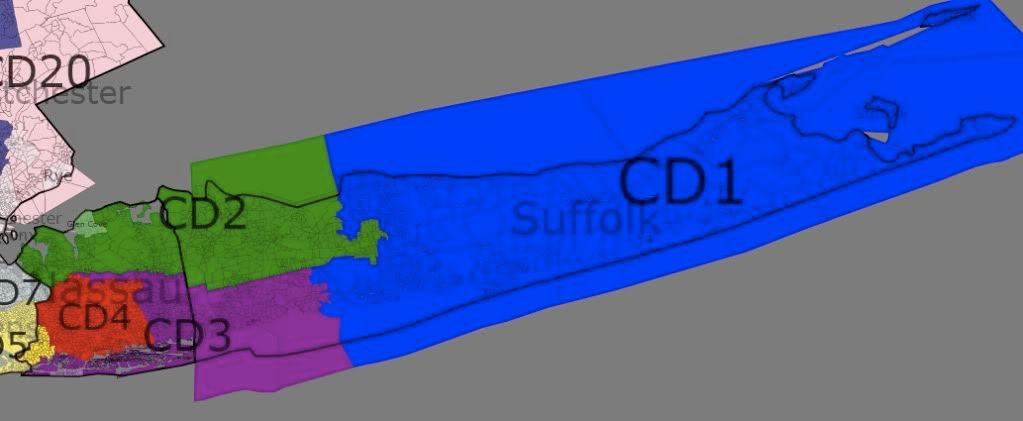
The goal for Long Island was to create three Democratic performing districts in Suffolk and Nassau counties. To that end I was successful,  however, there are two or three Districts that in the wrong year, could flip to the Republicans. However, since Democratic performance has been improving in this area, it is possible that demographic trends will preserve Democrats in this area.

CD 1: (blue) Suffolk – 83% White 8% Hispanic
52-47 Obama

CD 2: (green) Suffolk, Northern Nassau –  81% White 8% Hispanic
52-47 Obama

CD 3: (purple) Suffolk, Southern Nassau – 76% White 11% Hispanic
51-47 Obama

CD 4: (red) South and West Nassau – 65% White 15% Black 12% Hispanic
57-42 Obama
NY 2009,Redistricting

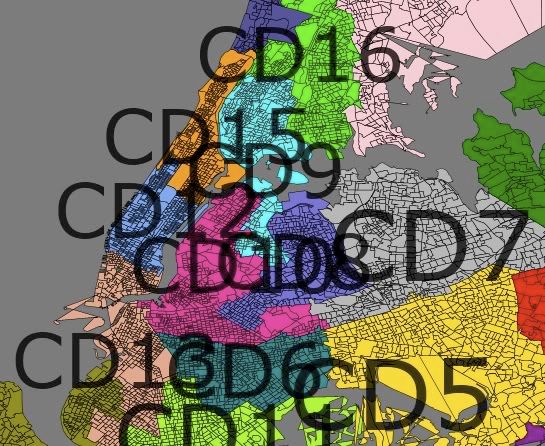
I admit I am not familiar with the actual New York City area to make an informed observation about these districts, but I do preserve a number of minority-majority districts. Only the Staten Island district may flip in a bad year.

CD 5: (yellow) South Queens – 22% White 49% Black 14% Hispanic
81-18 Obama

CD 6: Central Brooklyn – 6% White 73% Black 14% Hispanic
95-4 Obama

CD 7: (grey) Northern Queens –  42% White 27% Asian 18% Hispanic
65-33 Obama

CD 8: Northern Queens, Extends into Kings – 29% White 15% Asian 8% Black 43% Hispanic
74-25 Obama

CD 9: Northern Queens Bronx – 8% White 27% Black 5% Asian 56% Hispanic
90-8 Obama

CD 10: (magenta) Western Queens, Western King – 28% White 29% Black 30% Hispanic
87-11 Obama

CD 11: Southern Brooklyn – 57% White 18% Black 10% Asian 10% Hispanic
58-41 Obama

CD 12: Central/ West Manhattan – 70% White 6% Black 8% Asian 12% Hispanic
82-16 Obama

CD 13: Lower Manhattan/Brooklyn – 53% White 6% Black 17% Asian 18% Hispanic
77-21 Obama

CD 14: Staten Island/Brooklyn – 63% White 6% Black 10% Asian 17% Hispanic 51-47 Obama

CD 15: Harlem/East Side – 21% White 27% Black 45% Hispanic
90-8 Obama

CD 16: (green) Bronx/SE Yonkers – 19% White 30% Black 41% Hispanic
85-14 Obama

Rockland, Westchester area
NY 2009,Redistricting

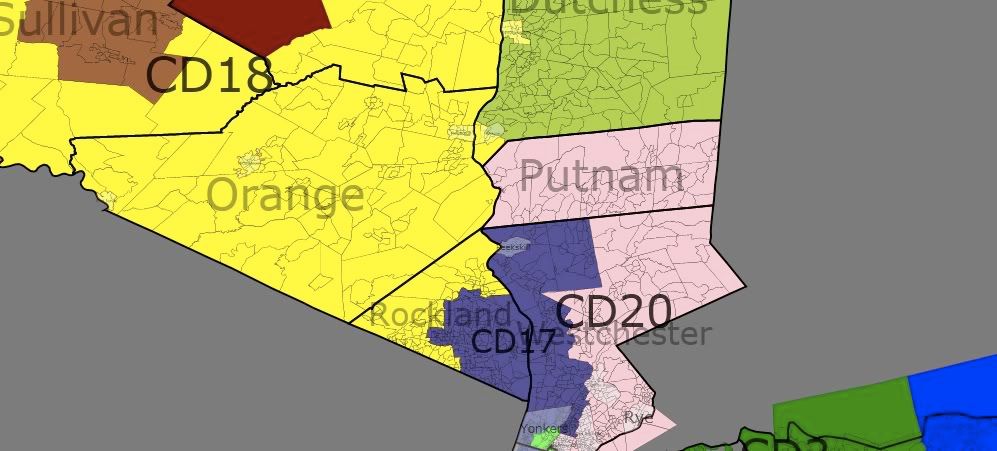
 I have three districts extending out of New York City into Yonkers and Rockland and Westchester counties. This arrangement is similar to, but expands upon the current map of the area. where both NY 17 and NY 18 extend into the City. 

In the existing eastern most district, NY 18, Representative Lowey has consistently won with over 65% of the vote (Bush/Kerry 58%) – this performance may go down with this map's NY 20. However, this is necessary to strengthen (this map's) NY 18 (Hall), where Obama would have a more comfortable victory. 

CD 17: Bronx, W. Westchester, SE Rockland – 64% White 12% Black 15% Hispanic
61-37 Obama

CD 18: (yellow) Orange, S Sullivan, S Ulster, N Rockland, Poughkeepsie –  79% White 7% Black 9% Hispanic
54-44 Obama

CD 20: (pink) Putnam, E Westchester, E Bronx 89% White
53-44 Obama

Upstate NY

NY 2009,Redistricting

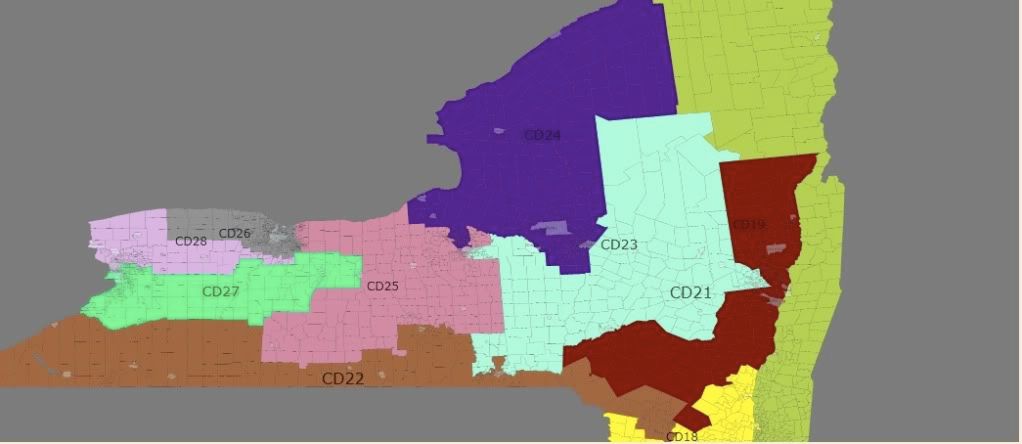
Upstate New York keeps counties intact and create nine districts where Democrats should be expected to win in most elections. However, in the right circumstances several districts could flip. However, I expect that no conservative Republican could win in these areas – especially with the trends in New England in support of Democrats.

Unlike the existing map, I took a more radical approach to dividing the districts, weakening the existing District around Albany (Tonko) and around Binghamton (Hinchey). I support Murphy and Owens, as well as take out Lee. However, this map does not respect the residence of incumbents as Owens and Murphy are placed in the same district as well as Maffei and Arcuri.  

CD 19: (ugly green) Franklin, Clinton, Essex, Washington, Rensselaer (-Rensselaer), Columbia, Dutchess (most) – 89% White
53-44 Obama 

This is Scott Murphy's current district. I help him by extending the district all the way to the Canadian border, and the Democratic leaning counties of Franklin and Clinton counties.

CD 21: (red) Warren, Saratoga, Albany, Greene, Delaware (most), NE. Ulster – 88% White 5% Black
56-42 Obama

I take the Tonko's Albany based district, and go North to Saratoga and then South into Delaware and Ulster counties. The district also includes the City of Rensselaer.
NY 2009,Redistricting

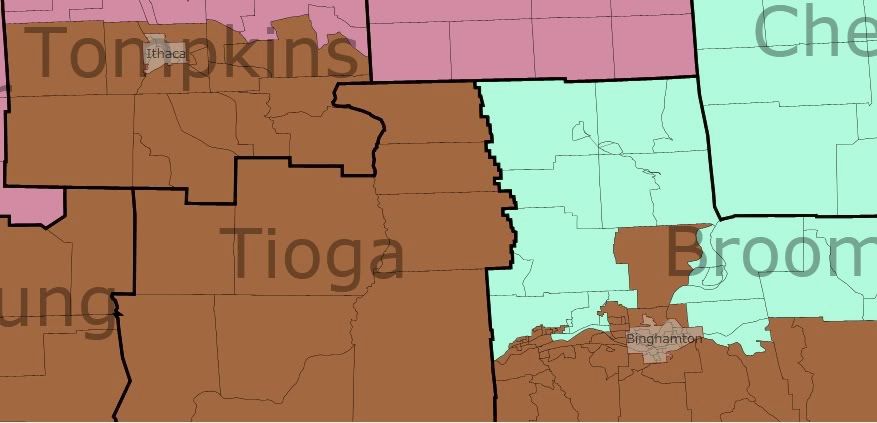
CD 22: (brown) Chautauqua, Cattaragus, Allegany, S. Steuben, Chemung, S. Tompkins, S. Broome, S Delaware, N. Sullivan (includes Binghamton and Ithica) – 89% White
51-46 Obama

Of all the districts that undergo a change, perhaps the most radical change is to Hinchey's district. The district now spans most of New York's southern border, but expands North to take in the city of Ithica. This district is perhaps the toughest to defend in a wave election, but the Democratic strongholds of Ithica and Binghamton should prevent a Republican from staying in office long.

CD 23: (light blue) N. Broome, Chenango, Madison, Ostego, Herkimer, Fulton, Montgonery, Schoharie, Fulton, Hamilton, Onodaga (part) – 90% White
52-46 Obama

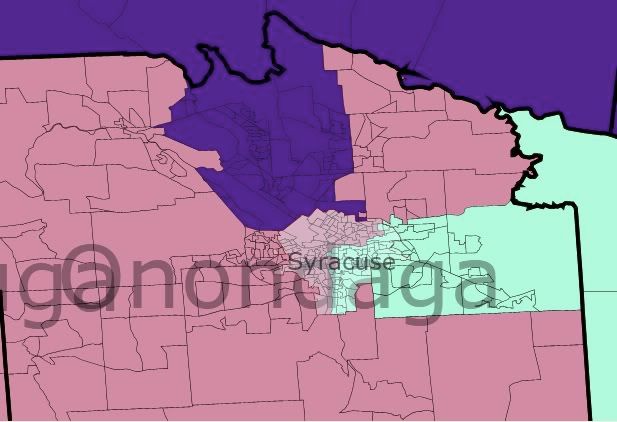
This is the district I had the most fun drawing – as it streches across most of Central New York, connecting Syracuse and Schenectady and into the Binghamton suburbs. This is a Democrat performing district, but would vulnerable in a wave election.

CD 24: (purple) St. Lawrence, Jefferson, Lewis, Oneida, Oswego, Onodaga (part) 91% White
50-48 Obama

Because I was not concerend about where incumbents live, I was able to create a Democratic leaning district in Northern New York. The district extends into the Syracuse suburbs to preserve a Democratic lean. 
NY 2009,Redistricting

CD 25: Onodaga (Syracuse and S), Wayne, Cayuga, Seneca, Yates, N. Steuben, Schulyer, N. Tompkins, Cortland 90% White
52-46 Obama

With the City of Syracuse divided between the 23rd and 25th, this district expands westward. In a wave election, a Republican could take the district, but turnout in Syracuse should prevent that.

CD 26: (dark grey) Monroe (most), Orleans – 76% White 13% Black 5% Hispanic 58-40 Obama

I make the Rocester area whole -but add in the more conservative Orleans county.
NY 2009,Redistricting

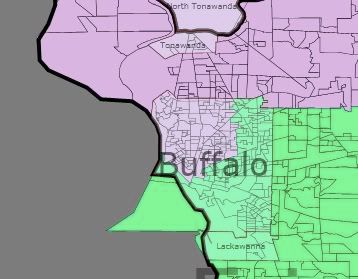
The Buffalo area retains the exsiting split – but both then stretch Eastward to take some of the rural counties in Western NY. Obama still won each of the districts with over 53% of the vote.

CD 27: S and E Erie, Wyoming, Livingston, Ontario – 85% White 10% Black 53-44 Obama

CD 28 – N Erie, Niagara, Genese, S Monroe – 84% White 8% Black 54-43 Obama

In conclusion, a 28-0 vote is possible, but because of the voting patterns in Central and Western NY, a 28-0 map will leave several Democrats vulnerable to a wave election, especially if one goal is compactness and the preservation of county borders. 

By what margin will Bob Shamansky win?

View Results

Loading ... Loading ...

2010 Texas Redistricting, a Democratic redistricting

After seeing all the great maps here I’ve decide to give it a try.  This is my first attempt at redistricting a state and my first diary.  While doing this for the first time I kind of wished I had lived in a smaller state, but Texas is where I grew up and where I live.  Since this is my first attempt at redistricting a state I want constructive criticism, but please be gentle 🙂 especially the long-time observers of Texas Politics because I am sure some of my commentary may be a bit off on some of the areas I am less familiar with.  I used Daves Redistricting App for this.  Please note I am not exactly familiar with the VRA law and how to apply it because I am new at this so if someone would like to critique this map for that it would be appreciated.

With Bill White running for Governor and the Democrats a few seats from the majority in the House, what would a Democratic Redistricting of Texas look like?

My goals for doing a Democratic redistricting of Texas were to

1.  Create at least two new Democratic seats in DFW

2.  Clean up Travis County

3.  Clean up Harris County, add another Dem seat.

4.  Work to weaken several GOP incumbents including Sessions and Culberson.

All districts have a +/- 2.5% population deviation from the average.  I will describe each group of district based on metro area or geographic location.

East Texas

CD-1 Largely consists of the currently existing CD-4.  Like most of rural Texas it is very white, very conservative. 71% White, 15% African American, 10% Hispanic  Safe R

CD-5 now includes Ellis County and the City of Tyler and is out of Dallas County entirely.  This new district has the potential for a very entertaining primary between Joe Barton, Louie Gohmert and Jeb Hensarling.  70% White, 10% African American, 16% Hispanic  Safe R

CD-6 which had a significant chunk of its population in the DFW metro area is now entirely rural.  69% White, 15% African American, 12% Hispanic.  Safe R

CD-17 although this district is in Central Texas it shows up good in the East Texas pic.  I am one of the people who remains amazed at Chet Edwards-D ability to hold on to his heavily GOP district.  Unsure of how to protect him I only have a few choices since his district gained population so Bosque, Somervell, Madison and Grimes Counties have been removed from his district.  Waco and Byran/College Station are still within CD-17  This district is probably still a Toss-up as Edwards will have to work hard to maintain this seat.  67% White, 9% African American, 19% Hispanic

Greater Houston Area (the Rural/Suburban districts)

CD-33 is a rural district which extends from greater Houston to Bastrop Country which is southeast of Austin  which is a solid GOP seat.  61% White, 11% African American, 25% Hispanic.  Safe R

CD-22 is now almost entirely contained within Fort Bent County with small pieces in Waller and West Harris County.  Obama barely lost Fort Bend County, and despite being a minority-majority district I think this seat stays GOP.  44% White, 17% African American, 24% Hispanic, 12% Asian  Likely R

CD-14 Ron Paul isn’t going anywhere.  56% White, 8% African American, 30% Hispanic.  Safe R

CD-08 contains north suburban Houston, the district is largely split between the fast growing Montgomery County and North West Harris County. 71% White, 5% African American, 16% Hispanic, 5% Asian.  Safe R

CD-02 Rural/suburban Houston contains Beaumont and Port Arthur.  62% White,, 18% African American, 15% Hispanic.  Safe R

Greater Houston (the Urban/Suburban districts)

CD-09 Now rests entirely within Harris County, other than a small extension to the west of CD-07 this district remains largely unchanged.  17% White, 32% African American, 36% Hispanic, 11% Asian.  Safe-D

CD-07 is now more Urban, it has essentially been shifted a big to the east which moves it a bit into south Houston.  The conservative west part of his district has been annexed by conservative CD-08.  46% White, 12% African American, 33% Hispanic, 5% Asian.  Leans D

CD-18 and CD-29 were both redrawn to undo the ugliness of the previous districts.  CD-18 15% White, 30% African American, 49% Hispanic.  CD-29 17% White, 14% African American, 65% Hispanic.  Both remain safe D.  

CD-35 Contains a good chunk of the currently existing CD-22 and is on the cusp of being a minority-majority district. 53% White, 10% African American, 29% Hispanic, 4% Asian  Lean R

Travis County (Austin)

CD-10 Contains most of Austin.  54% White, 6% African American, 32% Hispanic, 5% Asian,  Safe D

CD-25 At first I thought I drew a GOP leaning seat here but it may be a Dem leaning seat.  This district contains the remainder of Austin as well as Round Rock, Georgetown and Cedar Park.  If Dems organize well enough this could very well be a Dem held seat.  56% White, 9% African American, 27% Hispanic, 5% Asian.  Toss-up

Bexar County (San Antonio)

CD-21  This district is heavily Hispanic, much of this district is part of the former CD-23 and CD-20.  Ciro Rodriguez may opt to run here instead of CD-23 for reasons which will be clear when CD-23 is described. 29% White, 4% Black, 61% Hispanic  Safe D

CD-20  Central and South San Antonio, like CD-21 this district is heavily Hispanic. 30% White, 6% Black, 60% Hispanic  Safe D

South and Southwest Texas

CD-27 Remains largely unchanged, just tightened up because of the population increase in South Texas. 20% White, 2% African American, 75% Hispanic  Safe D

CD-15 Much of the Rio Grande Valley.  Safe D

CD-28 This guy extends from South San Antonio all the way down to Hidalgo county. 34% White, 6%, African American, 56% Hispanic  Safe D

CD-23 Laredo is back in this heavily Hispanic district.  82% Hispanic and 15% White makes this the most Hispanic district in the state.  

CD-16 In El Paso remains largely unchaged and is a bit more compacted.  Safe D

West and Central Texas

CD-13 A true West Texas district!  Contains the cities of Amarillo and Lubbock.  An interesting note about this district is that it is only 57% White, the remainder is 33% Hispanic and 5% African American.  I don’t know much about West Texas but I was expecting a much higher percentage of white folk.  However given the demise of the rural Democrats in Texas this district remains in the GOP hands.  Safe R

CD-19  Midland-Odessa and Abilene are the cities in this geographically huge district. 58% White, 5% African American, 33% Hispanic.  Safe R

CD-11  This one encompasses a lot of Lamar Smiths former CD-21.  San Angelo and part of New Braunfels make up this heavily GOP district.  Loving County which is also the least populous County in the Country is also here. 68% White, 2 % African American, 26% Hispanic.  Stonewall, the birth place of President Lyndon Johnson is in this district.  Safe R

CD-31  Another rural conservative district located in Central Texas. 64% White, 12% African American, 18% Hispanic.  Safe R

CD-04  Although this district is part of the DFW Metroplex it shows up nice on this image.  This district includes the northern parts of Denton and Collin County which are two of the fastest growing counties in the state.  At 78% White, 4% African American and 12% Hispanic this rural district is a GOP stronghold.  Contains Wichita Falls, Sherman and Denison, the later is the birthplace of President Dwight Eisenhower.  Safe R

DFW Metroplex

CD-36 This district which contains several Far North Dallas suburbs including McKinney, Allen, Frisco, Flower Mound and Denton is solid GOP all the way.  68% White, 7% African American, 17% Hispanic.  Safe R

CD-12  The C shape of this district obviously stands rightly for “conservative”.  The most conservative parts of Americas second largest conservative urban county are here.  Conservative parts of south and west Arlington, West and North Tarrant County lock up this district as a solid GOP seat.  Safe R

CD-26 Situated in Central Fort Worth extending out into south Fort Worth and west into Arlington.  The Democratic Party would lock this one up. 37% White, 21% African American, 37% Hispanic.  Safe Dem

CD-24 This guy straddles the Dallas-Tarrant County line and is in an area of Dallas and Tarrant County where local Democrats have been having a lot of success in state House races the past few cycles.  42% White, 14% Black, 34% Hispanic.  Lean D

CD-30  This was the sole Democratic Representative in DFW after the redistricting of 2003.  CD-30 does remain the most African American in the state, however the district now grabs the conservative enclave of Highland Park in near the center of Dallas county. 25% White, 38% African American, 32% Hispanic.  Safe D

CD-03  Another district where local Democrats have been having great success at winning State House Seats.  42% White, 16% African American, 33% Hispanic and 6% Asian.  I really want classify this seat as Lean D but I don’t think it is quite there yet.  Toss-up

CD-34  Now the “What…” moment will be answered regarding this creatively drawn district.  This district is drawn to strengthen the Democratic presence in CD-32 and CD-03 by moving a lot of the strong GOP north Dallas areas into a safe GOP seat with Plano.  CD-34 cuts straight down into Dallas County and ropes up University Park, a conservative enclave just north of Highland Park.  Plano is one of the most conservative cities in the country and is almost entirely within this district. 64% White, 7% African American, 12% Hispanic, 12% Asian  Safe R

CD-32  This majority Hispanic district is now ready for to be picked up by a Dem.  Heavily Democratic portions of south Dallas are included and heavily GOP sections of north Dallas are included in CD-34.  28% White, 11% African American, 54% Hispanic.  Likely D

Redistricting Contest Coming Soon!

Exciting news, folks: Thanks to the hard work of Dave and Jeffmd, Dave’s Redistricting App now has political data for the state of New York. Just like with Maryland, when you create your new New York maps, you’ll be able to see the Obama-McCain percentage for each district.

With this new feature launched, SSP plans to hold a redistricting contest in the near future. Dave has asked, though, that everyone kick the tires a bit before we officially begin the contest. So head on over to the app and test out the new NY data – and then stay tuned for a more detailed announcement from us soon!