SSP Daily Digest: 2/28

AZ-Sen: Maybe, just maybe, this will be the last time we’ll hear ridiculous speculation about, Joe Arpaio, the thug sheriff of Maricopa County, running for higher office. The 78-year-old Arpaio said he won’t seek Arizona’s open senate seat, following his announcement a few weeks ago that he won’t seek re-election as sheriff, either. I’m wondering if the two developments are not unrelated – Arpaio can silence the senate gossip because he no longer needs to use it to raise money for his next local race. Anyhow, I’ll be glad to be done with this guy. UPDATE: My mistake. I misread a line in the link and thought Arpaio was finally retiring, too – but only Kyl is, unfortunately. Still, Arpaio did say that he will not seek Kyl’s seat.

In other AZ news, what if you threw a teabagger convention and the Republican senate candidate didn’t come? Jeff Flake was a no-show at the Tea Party Patriots’ confab in Phoenix this past weekend, and the ‘baggers seem happy he stayed away. Unlike, say, Maine’s Olympia Snowe, Flake doesn’t appear to be interested in making nice with the nutters. I’m convinced that a more suitable (to the movement conservatives) candidate will emerge.

FL-Sen, FL-13: Not quite sure what to make of this – John Boehner was just down in Sarasota, FL, headlining a high-dollar fundraiser for a guy who hardly needs the money, super-rich car dealer Vern Buchanan. Is this Boehner trying to convince Buchanan to seek re-election to the House and avoid a throw-down with fellow Rep. Connie Mack? Or just the Speaker earning chits while playing a few rounds of golf during a Congressional recess?

HI-Sen: This piece on the Hawaii senate race is worth reading in full. The nominal hook here is Sen. Dan Inouye’s comments that, as Chair of the Appropriations Cmte. (and President Pro Tem of the senate), he won’t have as much time to raise money for his old buddy Dan Akaka, who is facing re-election next year. But there are a whole host of other questions implicated here: Is this just Inouye trying to kick Akaka’s ass into gear? (Akaka only has $66K on hand and faced a serious primary challenge from Rep. Ed Case in 2006.) Will Akaka (88 yo in 2012) actually even run again? Is former Gov. Linda Lingle going to run? If Akaka steps aside, who might take his place on the Dem side? Again, click the link to see the state of play.

ME-Sen, ME-Gov: Eliot Cutler, the independent candidate for governor last year who came in just a couple of points behind the winner (Republican Paul LePage), says he is “unlikely” to challenge Sen. Olympia Snowe, proclaiming he has “no desire to live in Washington.” He also says he isn’t ruling out another gubernatorial bid in 2014. Also, one possible Dem candidate, former AG Janet Mills, just joined a law firm, suggesting she probably isn’t interested in a senate race. (Mills became the first woman AG of Maine in 2009, but because the position is selected by the legislature, she was replaced by a Republican after the GOP swept into power last fall. NB: This is how you avoid Kelly Ayottes.)

MI-Sen, MI-15: Rob Steele, last seen losing to Rep. John Dingell by 17 points in 2010, says he’s considering a challenge to Sen. Debbie Stabenow (who lacks any real high-profile opposition at the moment). Steele also says he doesn’t think he’ll run again Dingell again, whose district might get re-drawn to still include heavily blue Ann Arbor.

MO-Sen, MO-02: I thought Rep. Todd Akin had definitively said “no” to a senate bid, but in response to some renewed chatter about a possible run, he would only say: “Some people want to draft me for Senate but you know engineers. It’s just one thing at a time.” You know engineers! Anyhow, if there’s a chance Akin might get in, this could help explain former state GOP chair Ann Wagner’s recent remarks that she might run for MO-02. (Wagner, of course, is also in the mix for the senate race.)

RI-Sen: State GOP chair Gio Cicione says he won’t take on Sen. Sheldon Whitehouse, citing (like Cranston Mayor Matt Fung before him) the high cost of a race. These guys think a Rhode Island senate race would be expensive? They ought to check things out a state or two to the west. Anyhow, Dave Catanese caught up with former Providence mayor (and well-known felon) Buddy Cianci, whose name surfaced in PPP’s most recent poll of the race. Cianci hasn’t completely ruled out a run, but says it’s not “realistic.” Also of note, PPP has a report card out on Rhode Island politicians’ job approval ratings.

TX-Sen: Former Dallas mayor Tom Leppert, who resigned just a few days ago, made it official: He’s running for senate.

VA-Sen: The already-painful Tim Kaine watch – is it a pimple or a boil? – will soon be over: the DNC chair promises he’ll make a decision in a week, according to the AP’s Charles Babbington. (I predict “gummy bear.”) On the other side of the equation, ultra-far-right insano-Republican, state Delegate Bob Marshall, says he’s considering another run. Marshall almost stole the GOP nomination for VA-Sen in 2008 from the super-sad Jim Gilmore, but that near-upset took place at a Republican convention – this time, the party’s nominee will be selected in a primary.

MO-Gov: Republican Lt. Gov. Peter Kinder says he’ll make an announcement “this spring,” and if it’s anything other than, “I’m running for governor,” I think people will be shocked. Anyhow, mark your calendars – this means Kinder might open his trap again any time between March 20th and June 21st!

NC-Gov: Since North Carolina is their home state, it looks like PPP will be testing NC-Gov just about every month. Incumbent Dem Bev Perdue trails almost-certain opponent Pat McCrory 49-37. (Last month it was 47-40.)

CA-36: 2010 and 2006 primary candidate Marcy Winograd announced she’s entering the special election for departing Rep. Jane Harman’s seat. The CW says Winograd is likeliest to hurt SoS Debra Bowen, but I’m not really sure she’s capable of making any material difference in this race.

CT-05: Former one-term state House Rep. Elizabeth Esty announced she’s running for Chris Murphy’s now-open house seat. Esty (not to be confused with the DIY craft-selling website) narrowly lost a rematch in 2010 after narrowly winning a traditionally Republican district in 2008.

NJ-06: Teabagger Anna Little, who won an upset primary victory in 2008 but lost to Rep. Frank Pallone by 11 points in the general election, says she’s back for a rematch. The woman Little beat for the GOP nomination last year, richie rich Diane Gooch, is also weighing another bid.

NM-01: Dem state Sen. Eric Griego says he’d “seriously consider” running for Rep. Martin Heinrich’s seat if Heinrich makes the jump to the open-seat senate race.

NY-26: Well, that explains that. In other news, Conservative Party chair Mike Long seems to be tipping his hand that his party will in fact support GOP nominee Jane Corwin.

MO-SoS: MO SoS Robin Carnahan says she’s running for re-election to her current post. Republican state Sen. Bill Stouffer, who lost a primary last year to Vicki Hartzler (who went on to beat Ike Skelton in the general), also says he’ll run for the post.

Census: Our friends across the pond in England and Wales will take their census this year. What makes this interesting is that for the first time, Britons will be able to submit their census forms online.

Special Elections: Johnny Longtorso has the goods on tomorrow night’s special elections:

After the excitement of last week, this week is a bit of a letdown. There are three seats up: Florida’s SD-33, formerly held by Frederica Wilson, is merely a formality, with the Democrat likely going to win 80-20 or so. There’s also a formerly Dem-held Senate seat in Mississippi, SD-12; despite no party ID being on the ballot, I’m pretty confident in guessing all three candidates running are Dems (it’s along the Mississippi River, so in heavily-Democratic territory). And in Maine, HD-11, an extremely Republican seat, is up. It would be helpful if Dems picked this one up, as the Republicans only have a slim majority in the House, but this was a seat that went 3-1 for the incumbent in 2010. There was apparently a split among Republicans, so there’s a Republican running a write-in campaign, but it would still be one hell of a long shot.

Redistricting California (Part 2): State Senate

Here is my attempt at redistricting the California State Senate. With over 936,000 people per district, satisfying communities of interest becomes a bit more challenging. Here are the districts I ended up drawing.

Majority-White: 22

Majority-Hispanic: 8

Majority-Minority: 10

Safe Dem: 19

Likely Dem: 1

Lean Dem: 3

Toss-Up: 7

Lean GOP: 3

Likely GOP: 6

Safe GOP: 1

Outer NorCal

Photobucket

SD-01: Coastal NorCal (Previously SD-02) (Noreen Evans)

Description: Similar shape to the old district, plus added Del Norte County and the westernmost part of Solano to satisfy district size

Demographics: 68.4% White, 16.1% Hispanic, 5.6% Asian

2008 President: Obama 69.1%, McCain 28.5% (SAFE DEM: D+16)

SD-02: Central Valley and Yolo County (Previously SD-04) (Doug LaMalfa and Lois Wolk unless she moves to the new SD-05)

Description: Similar to previous configuration only I added Yolo County to satisfy population size. Lois Wolk (from Davis and currently in SD-05) would be put into this district and would lose to LaMalfa unless she moved to the new SD-05.

Demographics: 71.8% White, 16.1% Hispanic, 5.5% Asian

2008 President: McCain 49.9%, Obama 47.9% (LEAN GOP: R+4)

SD-03: All of Marin, eastern San Francisco, and SE Sonoma (Mark Leno)

Demographics: 56.4% White, 17.8% Asian, 15.6% Hispanic, 6.7% Black

2008 President: Obama 82.2%, McCain 15.8% (SAFE DEM: D+29)

SD-04: Mountain counties along most of the Nevada border plus some Sacramento suburbs (Previously SD-01) (Ted Gaines)

Demographics: 80.8% White, 10.0% Hispanic

2008 President: McCain 54.1%, Obama 44.9% (LIKELY GOP: R+8)

SD-05: Most of Solano and Sacramento, NW San Joaquin (Lois Wolk if she moves here from SD-02)

Description: Removed Yolo and included more of Sacramento

Demographics: 59.5% White, 18.2% Hispanic, 10.2% Asian, 7.2% Black

2008 President: Obama 53.4%, McCain 44.9% (TOSS-UP: EVEN)

SD-06: Sacramento and some inner suburbs (Darrell Steinberg)

Demographics: 50.3% White, 17.9% Hispanic, 14.2% Asian, 11.8% Black

2008 President: Obama 65.1%, McCain 33.0% (SAFE DEM: D+12)

San Francisco Bay Area

Photobucket

SD-07: Oakland, Berkeley, Richmond, Martinez (Previously SD-09) (Loni Hancock)

Demographics: 36.0% White, 24.2% Black, 18.5% Hispanic, 16.7% Asian

2008 President: Obama 86.7%, McCain 11.3% (SAFE DEM: D+33)

SD-08: Western half of San Francisco, most of San Mateo (Leland Yee)

Demographics: 46.4% White, 27.6% Asian, 18.3% Hispanic

2008 President: Obama 75.4%, McCain 22.8% (SAFE DEM: D+22)

SD-09: Inland Alameda and Contra Costa (Previously SD-07) (Mark DeSaulnier)

Demographics: 67.9% White, 14.5% Hispanic, 9.3% Asian

2008 President: Obama 63.0%, McCain 35.3% (SAFE DEM: D+10)

SD-10: Western Alameda County and Milpitas in Santa Clara County (Ellen Corbett)

Demographics: 32.9% White, 31.4% Asian, 24.6% Hispanic, 6.1% Black

2008 President: Obama 72.7%, McCain 25.4% (SAFE DEM: D+20)

SD-11: Silicon Valley and Santa Cruz County (Joe Simitian)

Demographics: 58.4% White, 20.2% Asian, 15.9% Hispanic

2008 President: Obama 73.7%, McCain 24.2% (SAFE DEM: D+21)

SD-12: San Jose and part of Stanislaus County (Previously SD-13) (Elaine Alquist)

Demographics: 42.4% White, 31.0% Hispanic, 19.6% Asian

2008 President: Obama 67.4%, McCain 30.9% (SAFE DEM: D+14)

SD-13: Stockton, Modesto, Merced (Previously SD-12) (Anthony Cannella)

Demographics: 50.0% White, 34.1% Hispanic, 6.8% Asian

2008 President: Obama 52.1%, McCain 46.2% (TOSS-UP: R+1)

Central

Photobucket

SD-14: Eastern Central Valley and northern half of Fresno (Tom Berryhill)

Demographics: 57.9% White, 28.7% Hispanic, 5.6% Asian

2008 President: McCain 53.6%, Obama 44.7% (LIKELY GOP: R+8)

SD-15: Central Coast (Sam Blakeslee)

Description: Still a Central Coast-centric district, only I removed Santa Cruz, put Monterey completely within the district, and stretched a little further into Santa Barbara

Demographics: 55.1% White, 33.9% Hispanic

2008 President: Obama 57.0%, McCain 41.0% (LEAN DEM: D+4)

SD-16: Western Central Valley (Michael Rubio)

Description: Did some tweaking to keep it sufficiently Hispanic to satisfy the VRA

Demographics: 60.1% Hispanic, 24.6% White, 5.9% Asian, 5.8% Black

2008 President: Obama 55.6%, McCain 42.8% (TOSS-UP: D+2.5)

SD-17: Inyo County, Tulare, Bakersfield (Previously SD-18) (Jean Fuller)

Demographics: 57.0% White, 32.1% Hispanic

2008 President: McCain 60.8%, Obama 37.4% (SAFE GOP: R+15)

SD-18: Remainder of Santa Barbara and most of Ventura (Previously SD-19) (Tony Strickland)

Description: This time I was able to keep Thousand Oaks and Simi Valley in the same district and not go over in population

Demographics: 58.5% White, 31.0% Hispanic, 5.5% Asian

2008 President: Obama 59.3%, McCain 38.9% (LEAN DEM: D+6)

SD-19: Antelope Valley, keeping Lancaster and Palmdale together (Previously SD-17) (Sharon Runner)

Demographics: 54.1% White, 27.2% Hispanic, 8.2% Asian, 6.8% Black

2008 President: Obama 53.3%, McCain 44.6% (TOSS-UP: EVEN)

Los Angeles/Orange County

Photobucket

SD-20: Hispanic side of the San Fernando Valley (Alex Padilla)

Demographics: 54.2% Hispanic, 30.4% White, 6.9% Asian

2008 President: Obama 73.2%, McCain 24.7% (SAFE DEM: D+20)

SD-21: Burbank, Glendale, Pasadena (Carol Liu)

Demographics: 37.2% White, 32.8% Hispanic, 20.0% Asian, 5.2% Black

2008 President: Obama 67.3%, McCain 30.6% (SAFE DEM: D+14)

SD-22: From Monterey Park to Diamond Bar (Kevin De Leon)

Demographics: 53.9% Hispanic, 26.0% Asian, 14.8% White

2008 President: Obama 64.9%, McCain 33.2% (SAFE DEM: D+12)

SD-23: West Side L.A. without the Ventura portion (Fran Pavley)

Demographics: 70.4% White, 13.0% Hispanic, 9.4% Asian

2008 President: Obama 72.9%, McCain 25.4% (SAFE DEM: D+20)

SD-24: South Central: Culver City, Inglewood, Compton (Previously parts of SD-25 and 26) (Rod Wright) (Curren Price)

Description: Due to demographic trends, it looks like the black populations of the current SD-25 and 26 will be merged into this district, which means Curren Price and Rod Wright will likely be in the same district.

Demographics: 41.8% Hispanic, 41.7% Black, 7.9% White, 5.8% Asian

2008 President: Obama 89.7%, McCain 9.1% (SAFE DEM: D+37)

SD-25: South Central (Previously parts of SD-25 and 26)

Description: Here I took the Hispanic parts of the current SD-25 and 26. Either of Wright or Price may run here, but an Hispanic candidate is far and away the favorite here

Demographics: 61.4% Hispanic, 14.0% Black, 11.4% Asian, 10.4% White

2008 President: Obama 84.2%, McCain 13.8% (SAFE DEM: D+31)

SD-26: Downtown L.A., Whittier, Pico Rivera (Previously SD-24) (Probably Ed Hernandez)

Description: Hernandez’s home is in the new SD-22, though he may move and run here.

Demographics: 79.0% Hispanic, 11.4% White, 5.6% Asian

2008 President: Obama 73.1%, McCain 24.8% (SAFE DEM: D+20)

SD-27: Beach Cities, Carson, and Palos Verdes Peninsula (Previously SD-28) (Ted Lieu)

Demographics: 39.3% White, 31.7% Hispanic, 16.4% Asian, 8.9% Black

2008 President: Obama 62.0%, McCain 36.0% (LIKELY DEM: D+9)

SD-28: South Gate, Norwalk, Artesia, part of Long Beach (Previously parts of SD-27 and SD-30) (possibly Alan Lowenthal and Ron Calderon)

Description: I shifted Long Beach to the coastal OC district and found that I had too many people in that one, so I shifted part of Long Beach into this district. Part of Lowenthal’s and Calderon’s districts are put here, so they may face a primary unless one decides to retire.

Demographics: 55.7% Hispanic, 18.2% White, 12.3% Asian, 10.9% Black

2008 President: Obama 70.9%, McCain 27.0% (SAFE DEM: D+18)

SD-29: Northern L.A. suburbs (Previously parts of SD-29 and SD-31) (Bob Dutton and Bob Huff?)

Description: In L.A. and San Bern Counties to satisfy population size, from Arcadia to my hometown Rancho Cucamonga. Huff’s home in Diamond Bar was shifted to the 22nd so he may move here.

Demographics: 43.8% White, 34.3% Hispanic, 9.3% Asian, 8.9% Black

2008 President: Obama 54.2%, McCain 43.8% (TOSS-UP: D+1)

SD-30: Fontana, Ontario, Chino, Montclair, Pomona (Previously SD-32) (Gloria Negrete-McLeod)

Demographics: 55.7% Hispanic, 25.0% White, 9.9% Black, 6.2% Asian

2008 President: Obama 63.7%, McCain 34.5% (SAFE DEM: D+10)

SD-31: Most of San Bernardino and in Riverside (Open)

Demographics: 64.2% White, 23.9% Hispanic, 5.2% Black

2008 President: McCain 55.2%, Obama 42.6% (LIKELY GOP: R+9)

SD-32: Coastal Orange County and part of Long Beach (Previously SD-35 and part of SD-27) (Tom Harman and Alan Lowenthal?)

Demographics: 69.3% White, 13.5% Hispanic, 12.6% Asian

2008 President: Obama 49.5%, McCain 48.6% (LEAN GOP: R+4)

SD-33: Garden Grove, Anaheim, Santa Ana (Previously SD-34) (Lou Correa)

Demographics: 54.2% Hispanic, 23.5% White, 17.5% Asian

2008 President: Obama 54.6%, McCain 43.5% (TOSS-UP: D+1)

SD-34: Inland Orange County (Previously SD-33) (Mimi Walters)

Demographics: 53.7% White, 27.2% Hispanic, 13.9% Asian

2008 President: McCain 53.1%, Obama 45.0% (LIKELY GOP: R+7)

SD-35: Riverside, Norco, Moreno Valley, Corona (Previously part of SD-37) (Open)

Description: Rapid growth in Riverside County led to this district being excised off the eastern end of the old SD-37

Demographics: 43.0% White, 38.3% Hispanic, 9.2% Black, 5.6% Asian

2008 President: Obama 55.4%, McCain 42.7% (TOSS-UP: D+2)

Outer SoCal and San Diego

Photobucket

Photobucket

SD-36: Most of the rest of Riverside County (Previously SD-37) (Bill Emmerson)

Demographics: 53.7% White, 36.9% Hispanic

2008 President: McCain 49.6%, Obama 48.8% (LEAN GOP: R+3)

SD-37: Temecula, Southern OC, NW San Diego County to Carlsbad (Previously SD-36) (Joel Anderson?)

Demographics: 66.4% White, 21.4% Hispanic, 5.6% Asian

2008 President: McCain 53.5%, Obama 44.7% (LIKELY GOP: R+7)

SD-38: Imperial County and as much of Eastern San Diego as could fit (Previously SD-37 and SD-40) (Mark Wyland)

Demographics: 57.8% White, 31.2% Hispanic

2008 President: McCain 53.2%, Obama 45.1% (LIKELY GOP: R+7)

SD-39: Northern San Diego (Christine Kehoe)

Description: Northern half of San Diego, Solana Beach, Encinitas, Del Mar, Lemon Grove

Demographics: 63.2% White, 14.9% Hispanic, 13.7% Asian

2008 President: Obama 56.9%, McCain 41.4% (LEAN DEM: D+4)

SD-40: Southern San Diego (Previously part of SD-39) (Juan Vargas)

Description: Southern half of San Diego, Coronado, National City, Chula Vista, Imperial Beach

Demographics: 42.4% Hispanic, 32.5% White, 12.0% Asian, 9.4% Black

2008 President: Obama 66.3%, McCain 32.0% (SAFE DEM: D+13)

Analyzing the South Carolina Gubernatorial Election, Part 1

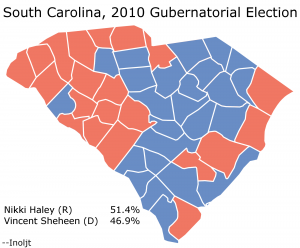
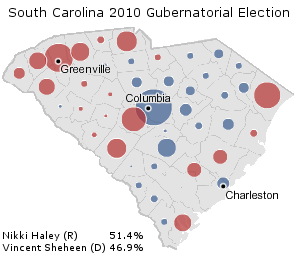
This is the first part of three posts analyzing the 2010 South Carolina gubernatorial election, in which Republican Nikki Haley won a closer-than-expected victory over Democrat Vincent Sheheen. The main focus of these posts will be to explore whether a racial effect accounted for Ms. Haley’s unexpected poor performance.

The next post can be found here.

(Note: This is also part of a series of posts analyzing the 2010 midterm elections.)

Photobucket

More below.

It was the October, 2010 in South Carolina. Nikki Haley, Republican candidate for South Carolina governor, was cruising. She was a conservative candidate – endorsed by none other than Sarah Palin herself – running in a conservative state, in the best Republican year in a generation.

Opinion polls showed the Republican politician leading by double-digits. Even the most pessimistic gave Ms. Haley a high single digit lead.

On election day, however, Ms. Haley won by only 4.5%:

Photobucket

(Note: Edited NYT Image)

What could have accounted for Ms. Haley’s poor performance?

Several factors come to mind. Ms. Haley was not an uncontroversial candidate; her positions were conservative even for South Carolina. The Democratic candidate, Vincent Sheheen, might have been an unnaturally talented campaigner. And there is always the factor of randomness to take into account. There were hundreds of races in November; the polls would inevitably be inaccurate on one or two, and this race just happened to be one of them.

Or perhaps there is another explanation – a particularly ugly one, but one that lurks at the back of everybody’s head. Ms. Haley was an woman of Indian heritage running to govern South Carolina, a state with not exactly the most innocent racial history. Throughout the campaign, Ms. Haley was subject to attacks that implicitly played up the racial angle: she had had affairs with white men (unfortunately for the accusers, this attack doesn’t work as well against women), she wasn’t Christian or was only pretending to be one, and so on.

It is not unimaginable that a sort of Bradley effect took place in South Carolina, that a number of normally steadfast Republicans balked at voting for the first non-white and female governor in history.

This is a serious accusation, and therefore needs serious evidence. The next post will therefore begin an extensive examination of whether Ms. Haley’s race undermined her performance.

–Inoljt

SSP Daily Digest: 2/25

FL-Sen: Here’s one way the rich & powerful are different from you and me: You can, if you’re GOP state Sen. Mike Haridopolos, manage to leave clients worth $100,000 of income and a house valued at $400,000 off of your financial disclosure forms and have it be judged “inadvertent.” Here’s another way: you get to have the people doing the judging be your friends. Indeed, the chair of the committee responsible for punishing Haridopolos, former FL GOP chair & state Sen. John Thrasher, had endorsed his senate bid just last month. When asked if he should have recused himself, Thrasher said, “Hell, no. I think that’s a total political bunch of crap from the Democratic Party of Florida. They’re used to losing, obviously.” And what’s half a million bucks between friends?

MT-Sen, MT-Gov, MT-AL: A firm called NSON Opinion Strategy took a poll of all three Montana races for the a conservative radio host, Aaron Flint of the Northern News Network, and a conservative consulting firm, 47 North Communications. Note that despite our very early point in the cycle, they tested likely voters. Anyhow, they found Rep. Denny Rehberg (R) narrowly leading Sen. Jon Tester, 47-44, in the senate race. In the open house race, they have Republican Steve Daines on top of Dem Frankie Wilmer, 31-22 (and obviously a ton of undecideds). Incidentally, Rehberg just endorsed Daines, the only announced Republican candidate so far.

NSON also checked on the gubernatorial primaries for both parties, but there’s no suggestion of an oversample, and I’m not in the habit of reporting polls where the n is in the vicinity of 200, so you’ll have to click through if you want the numbers.

NV-Sen: I, like you, had been wondering why in the hell Harry Reid would randomly start talking about outlawing prostitution in Nevada. But when I saw that John Ensign felt compelled to weigh in in response – he’s fer it! – I wondered if Reid might be playing a very clever deep game. Goading Ensign into running his mouth off about whoring is a pretty good trick, if you ask me.

WA-Gov: This seems like a pretty unlikely move, what with AG Rob McKenna ready to pounce (and even Rep. Dave Reichert supposedly weighing a run), but another Republican might get into the mix. Businessman and Seattle Port Commission President Bill Bryant won’t even go so far as to say he’s “considering” the race; rather, he’s “listening” to people who have “urged” him to look at the race.

CA-23: A great catch by Aaron Blake: Republican former LG Abel Maldonado filed paperwork with the FEC to run in Dem Rep. Lois Capps’ district. While it would be a hell of a feat for a Republican to win here – Obama won 65% of the vote here – the proverbial “source close to” Maldonado says the candidate is “pretty confident that redistricting will change that district enough” to make it competitive. We’ll see.

CA-26: It looks like we’re finally getting the upgrade we need to successfully challenge Rep. David Dreier, and we have term limits to thank. Democratic Assemblyman Anthony Portantino, who is termed out in 2012, will kick off his campaign next week. As per the above, it’s pretty ballsy to start running when you can’t even know where you’ll be running, but unlike Maldonado, Portantino is getting off to a real start, complete with fundraiser.

CA-36: Has anyone of any stature endorsed Debra Bowen yet? I have no idea, because her website is still just a freakin’ splash page. And I ask because two more members of Congress just endorsed Janice Hahn: Loretta Sanchez and Laura Richardson. Endorsements don’t typically mean a lot, but in this case, Hahn has really piled together an impressive roster in a very short time, which indicates her level of influence is quite strong. Meanwhile, I’m not even sure what Bowen is up to – search for her name on Google News (be sure to sort by date) and you won’t find much about her, but you’ll see plenty of stories about Hahn.

FL-22: Hmm. So much for keeping his recruiting plans on the DL. Steve Israel’s in South Florida this week, talking with potential candidates about taking on Lunatic-in-Chief Allen West next year. It sounds like Israel’s met with ex-Rep. Ron Klein, whom West beat in November, as well as Palm Beach County Tax Collector Anne Gannon, and a guy named Patrick Murphy (no, not that Patrick Murphy), a construction executive. Israel also said he wants to talk to West Palm Beach Mayor Lois Frankel, who is term-limited.

NY-26: You can try to dump your gnarly tins of leftover Scozzafava-brand cat fud into a landfill, but the stench will forever linger on. The Albany Project has this awesome catch: Republican nominee Jane Corwin made the terrible, terrible error of donating $1,000 to Dede Scozzafava during her most ill-fated of congressional runs. Oh, the agony!

OR-01: Two newspapers have already called for Rep. David Wu’s resignation: The Daily Astorian and the Eugene Register Guard, which is actually the second-largest paper in the state. Can the Oregonian be far behind? So far, though, while the chair of the Oregon GOP seems to be calling for Wu to step down, fellow Dem politicians have been very circumspect, and Wu himself said he has no interest in leaving.

TX-15: This might help explain why Rep. Ruben Hinojosa (D) has missed so many votes (40% so far): Earlier this month, he declared bankruptcy, on account of loan guarantees he made to his family’s meat company. The company itself declared bankruptcy in 2008, and though he was paid as a consultant from 2002 to 2007, Hinojosa has said he does not have managerial control over the firm.

UT-02: Jim Matheson is on a bit of a sticky wicket. If the GOP cracks Democratic Salt Lake City when they draw their new maps, he could potentially survive – after all, he’s represented a brutal district for a decade now. But he could be given a super-red district which also includes a lot of new territory, setting him back to square one-and-a-half. Alternately, the Republicans could pack Dem voters into a single district that would actually be fairly blue – in which case the conservative Matheson might find himself vulnerable to a more liberal challenger, particularly thanks to Utah’s convention nomination process. (Recall that Matheson only pulled 55% at last year’s convention against Some Dude Claudia Wright.) One such challenger might be former SLC Mayor Rocky Anderson, who told Aaron Blake he wouldn’t rule out such a run, if the district were suitable.

National Journal: It looks like the NJ’s senate ratings are out (though I’m not sure the complete list is publicly available yet). And guess who is tied for most conservative senator? The circle is now complete. When John McCain left us, he was but the maverick. Now he is the hackster.

Tea Party Express: Open Secrets has an interesting analysis in which they show that no fewer than twenty different federal PACs sprang into being last cycle, but that fully 96% of all money raised was hauled in by just a single entity, the Tea Party Express. But even more fascinating to me are TPX’s final numbers. They donated $37K directly to candidates and spent $2.7 million on independent expenditures, but raised an amazing $7.6. That means that almost five million dollars went… where exactly?

WI St. Assembly: Mark your calendars: Widely-beloved Gov. Scott Walker has set May 3rd as the date for special elections for three now-vacant Republican-held Assembly seats. (All three dudes just took jobs in the Walker administration.) The open seats are the 60th, 83rd and 94th. That last one could be interesting. Obama won only 38% & 35% of the vote in the first two districts respectively, but he took 55% in the 94th. The GOP has a 57-38 edge in the Assembly, though, so we have a long way to claw back.

SSP Daily Digest: 2/24

AZ-Sen: Outgoing Sen. Jon Kyl says he isn’t endorsing a successor – just yet. He wants to see how the field develops first.

IN-Sen: Look who else isn’t endorsing – the forgotten man, Sen. Dan Coats, says he isn’t taking sides in the looming GOP primary battle, not for Lugar or anyone else. Way to stick by your colleagues, huh? I guess maybe Coats is thinking about 2016, when I’d be willing to bet dollars-to-donuts he’ll get teabagged himself (if he doesn’t hang up his spurs before then, something I’d also entertain action on).

Meanwhile, Mourdock is concerned about the possible entry of teabagging state Sen. Mike Delph, who Treasurer (and recently-announced candidate) Richard Mourdock says will split the vote with him if he runs. Delph previously issued the usual state legislator’s incantation, saying he’d wait until the legislative sessions concludes at the end of April before deciding on a run.

NE-Sen: Gotta say this about Don Stenberg: He has no fear of losing. He’s making his fourth try for senate, having failed on his three previous attempts. Still, despite almost achieving perennial candidate status, he did have a triumphant return to statewide office last year, winning the Treasurer race by a landslide. And he served as state AG for over a decade starting in 1991, so it’s not like he can’t win a race. (Attentive law students might also remember him from the caption in Stenberg v. Carhart, the Supreme Court case about so-called “partial-birth abortion.”) In any event, Stenberg is looking to present himself as the far-right alternative to AG and not-exactly-firmly-entrenched frontrunner Jon Bruning.

TX-Sen: Either Tom Leppert just scored a sweet season pass to Six Flags Hurricane Harbor, or he’s going to dive into the crowded GOP senate race. Though he has four months to go, he’s resigning (effective Friday) from his current position as mayor of Dallas, so it’s gotta be one of those two. Who wants to give me ten-to-one on Hurricane Harbor?

Maybe that’s not a bad idea, actually, since the University of Texas (on behalf of the Texas Tribune) didn’t even test Leppert’s name in their new poll (PDF) of the GOP primary. It’s not especially fascinating, though, since “I dunno” leads the way at 52%, LG David Dewhurst (who hasn’t yet announced) is at 27%, and no one else is above 5%. They also looked at a hypothetical Dem primary, between a bunch of guys who aren’t running and no one knows. Click through the link if you insist.

UT-Sen: What to do if you’re a pollster in Utah? You’ve got a major potential teabagging on your hands, but it’s very likely to be decided at a party convention, not in a normal primary. So what do you do? You poll it anyway! I can’t blame the folks at UtahPolicy.com – it’s not like you can really poll convention-goers. And there is worthwhile information you can learn from these sorts of things.

Anyhow, in a hypothetical primary, Sen. Orrin Hatch is tied with Rep. Jason Chaffetz at 42 apiece. This says to me that GOP state delegates are likely to be even more anti-Hatch than Republican voters at large, so the incumbent is probably in very serious trouble indeed. I’m not convinced Chaffetz will make the race, though – in response to this poll, he noted that he’s already a subcommittee chair in just his second term, and that it would be “pretty hard to walk away” from his newfound influence in the House majority. But certainly someone will step up.

NY-26: I’ve been dismissive of him so far, and I remain skeptical, but David Bellavia is at least showing that can-do spirit. The former Army staff sergeant and Iraq war veteran filed paperwork with the FEC to form an exploratory committee, and his spokesman pointed to Republican nominee Jane Corwin’s support for abortion rights (at least “during the first trimester,” which, guys, hasn’t been the legal framework for twenty years). It’ll be interesting to see if a teabagger candidacy can use a social issue likes this as its hook. Anyhow, if he doesn’t score an existing third-party line, Bellavia will need 3,500 valid signatures to get on the ballot as an independent, which is a lot harder than it sounds.

TX-15: Felicia Sonmez runs down the House members with the highest absentee rates so far – several have missed in the range of 30% of votes in the early going of the 112th Congress. But all of them have obvious excuses (mostly bereavement and health-related), except for one: Ruben Hinojosa, who has skipped over 40% of roll calls. His spokesman didn’t respond to The Fix, but I’m really curious to know what’s going on here. Could retirement be looming?

DCCC: The D-Trip is doing a wave of robocalls, along with some web ads and emails, into fifty Republican districts. The Hill doesn’t seem to have (or at least, have published) the entire list, and NWOTSOTB. (That’s “No Word On The Size Of The Buy,” in case you haven’t seen that one before. Remember it, because candidates and organizations frequently launch tiny paid media campaigns with the hopes of garnering free press. If you don’t see information about how much a media buy actually costs, then odds are it falls into this category. Don’t let yourself get played, and always be looking for the size of the buy.)

Census: Here’s a new tidbit from the Census Bureau: 760 of the nation’s 3,000+ counties are experiencing “natural decrease:” deaths are outweighing births. Although most of these counties are rural counties, it’s not purely a red state phenomenon; at the state level, four states (all of which, you might notice, have not only older-than-average populations but also low Hispanic populations) also fall into this category: West Virginia, Vermont, Pennsylvania, and Maine. (C)

Analyzing the Illinois Senate Election

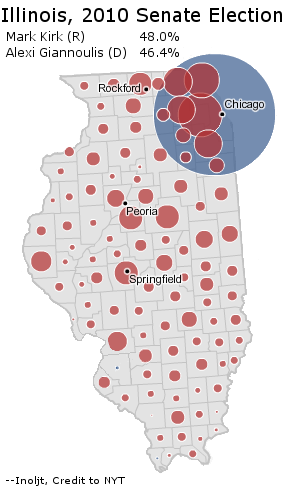
This is a part of a series of posts analyzing the 2010 midterm elections. This post will focus on the Illinois Senate election, in which Republican candidate Mark Kirk pulled out a close Republican victory in a strongly Democratic state.

Illinois’s Senatorial Election

Photobucket

More below.

Senator Mark Kirk’s victory follows the contours of a previous post, titled Previewing Senate Elections: Illinois. This post argued:

So what does Mr. Kirk have to do? Say that  he gets 35% of the vote in Cook County – propelled by inner-ring  suburban strength and minority apathy – and wins a landslide everywhere  else in the state (for instance, a 3:2 margin). This gives him 50.3% of  the vote in the 2008 Illinois electorate. If white Republicans downstate  turn out, and minorities in Chicago do not, Mr. Kirk may get bumped up  to a 2-3% victory.

As it turns out, this is almost exactly what actually happened in the election.

The previous analysis divided Illinois into three sections: Chicago, the suburbs of Chicago, and downstate Illinois. Let’s take a look at what Mr. Kirk did in each part of Illinois.

Chicago

Illinois is generally a Democratic stronghold. Cook County, home to the  city of Chicago, composes more than 40% of the state’s population, and  Democrats always win by a landslide in the county. Republicans have to  stretch themselves to the limit everywhere else in the state – winning  even the areas that normally vote Democratic – to get close.

But Republicans also must dampen Democratic margins in Cook County. This happens if Republicans can do well in the parts of Cook County outside Chicago, which are whiter and more conservative. In the city of Chicago itself, most voters are so Democratic that they will prefer not voting to casting the ballot for a Republican. There, low turn-out is more important for Republicans than actually winning over voters.

In 2010, Democratic candidate Alexi Giannoulias won 64.3% of the vote in Cook County.

At first glance, this sounds quite good. Winning 64.3% of the vote is nothing to sniff at. No president has ever won that much of the popular vote in history.

But Senator John Kerry won 70.2% of the vote in Cook County. And President Barack Obama took 76.2% of the vote. In modern Illinois politics, a Democratic candidate who takes only 64.3% of the vote in Cook County is in deep trouble.

Chicago’s Suburbs

“Previewing Senate Elections, Illinois” stated that:

The true test of Mark Kirk’s candidacy will come in the Chicago suburbs…

He will not just have to win the suburbs, but  turn the clock back two decades – back to the glory years in which  Republicans won around 70% of the vote in DuPage County. (Mr. Kirk will  probably not have to do that well, given rising Republican strength  downstate.)

Is this doable? Given that Republicans seem  to be winning suburbs everywhere this year, it is certainly possible.  Mr. Kirk, moreover, has spent a decade representing a Chicago suburb  congressional district; this is why Republicans have nominated him.

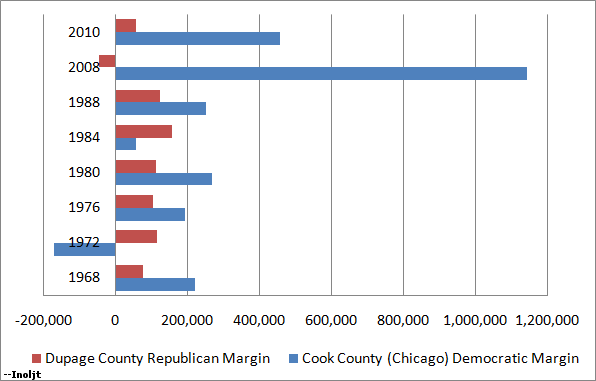
As it turned out, Mr. Kirk passed the test with flying colors. His moderate image and suburban origin led to double-digit victories in every one of the collar counties surrounding Cook County.

In the past, Republicans have won Illinois through massive support in the Chicago’s suburbs to offset the Democratic advantage in Chicago itself. Mr. Kirk was able to somewhat replicate this model in 2010:

Photobucket

This strength did not extend to all Republicans. Republican candidate Bill Brady, for instance, still won the Chicago suburbs. But his margins were just the slightest bit off – a high single-digit rather than double-digit victory here; a 15-point rather than 20-point margin there – and ultimately this led to Mr. Brady’s defeat.

Downstate Illinois

Imagine that the year is 1990, and Republican Mark Kirk pulls the exact same numbers in the Chicago metropolis.

Most analysts in that year would say that Mr. Kirk is on his way to a sure loss – after all, Democrats are quite competitive in downstate Illinois, and Mr. Kirk just hasn’t squeezed enough juice from the collar counties.

Today, however, downstate Illinois has trended firmly Republican. Without this trend Mr. Kirk would not have won.

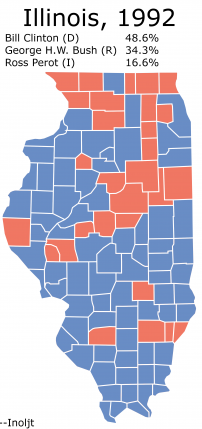
Here is an illustration of Illinois in the 1992 presidential election:

Photobucket

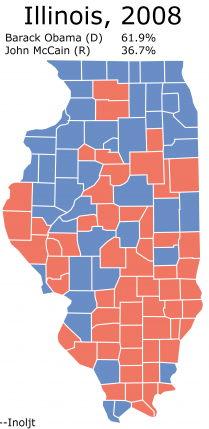
President Bill Clinton is doing quite well, winning almost every single county downstate – many by double-digits. Compare this to President Barack Obama’s performance:

Photobucket

Mr. Obama is actually doing much better in Illinois than Mr. Clinton, and yet he loses a number of the downstate counties Mr. Clinton won.

This illustrates the shift in downstate Illinois to the Republican side, and in 2010 Mr. Kirk took full advantage of that trend to win re-election.

Conclusions

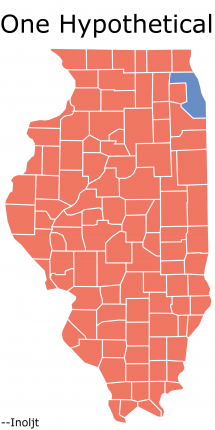
The post “Previewing Senate Elections: Illinois” concluded by mapping, somewhat light-heartedly, a hypothetical Republican victory:

Photobucket

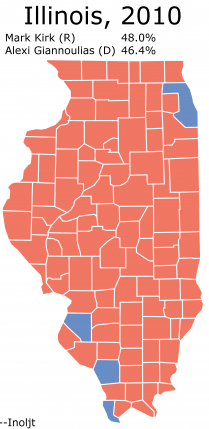
Mr. Kirk’s victory ended up looking extremely similar:

Photobucket

All in all, it is always exciting to see a Republican victory in a Democratic  stronghold, or a Democratic victory in a Republican stronghold. Mr.  Kirk’s victory is the first time a Republican has won Illinois in quite a  while. It constitutes one of the Republican Party’s greatest triumphs  in the 2010 midterm elections.

–Inoljt

Growing Republican Strength Along the Rio Grande River?

By: Inoljt, http://mypolitikal.com/

The state of Texas is one of the Republican Party’s most valuable strongholds. It adds a good 38 electoral votes to the Republican candidate’s electoral vote; Democrats have not been competitive in the state for at least a decade.

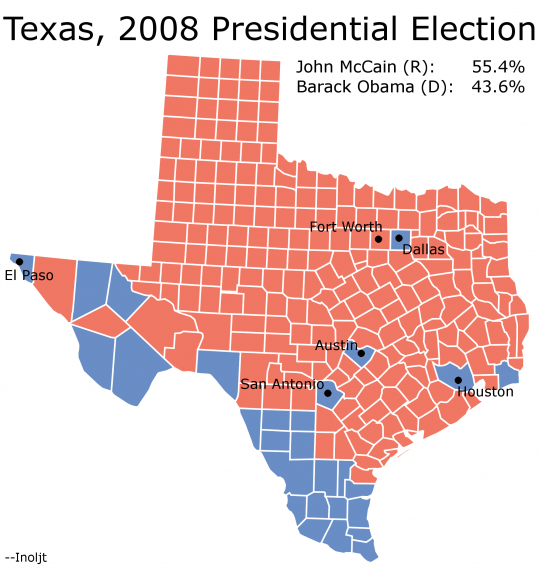
One of the only Democratic regions in Texas lies along the Rio Grande River:

Photobucket

More below.

This region is the part of Texas that borders Mexico. It is readily apparent in the map above as the only group of blue counties that President Barack Obama won outside of a major city.

The area is one of the most Hispanic areas in the United States; there are places, especially next to the border of Mexico, where the Hispanic percentage approaches 100%. Some of these people have lived along the Rio Grande for hundreds of years, with roots dating back to when Texas was a part of Mexico.

There are several other distinguishing characteristics. The parts of Texas along the Mexican border are among the poorest regions in the United States. Politically speaking, voter turn-out is very low – perhaps lower than any other part of the country.

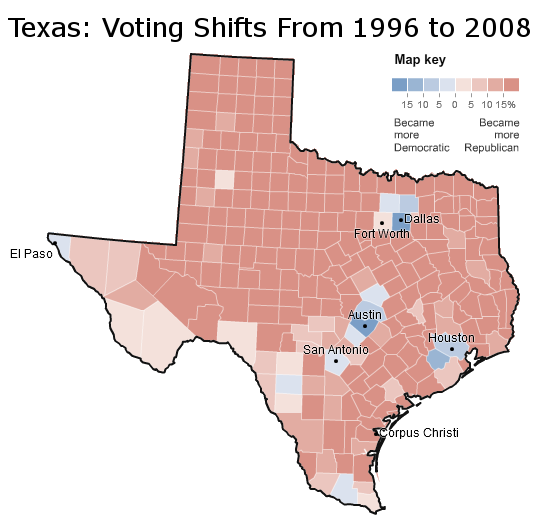
When the rest of Texas moved steadily Republican, South Texas swung leftwards for much of the twentieth century. In 1996 the Democratic presidential nominee won almost every single county south of San Antonio, some with over 80% of the vote.

Since then, however, Republicans have recovered their verve. President George W. Bush did incredibly well amongst Hispanics in Texas; in 2004 he even won 86% Hispanic Cameron County in the Rio Grande Valley. In 2008 the Democratic presidential candidate once again posted solid numbers along the Rio Grande. Nevertheless, they ran well behind their 1996 performance throughout the region:

Photobucket

(Note: Edited NYT Image)

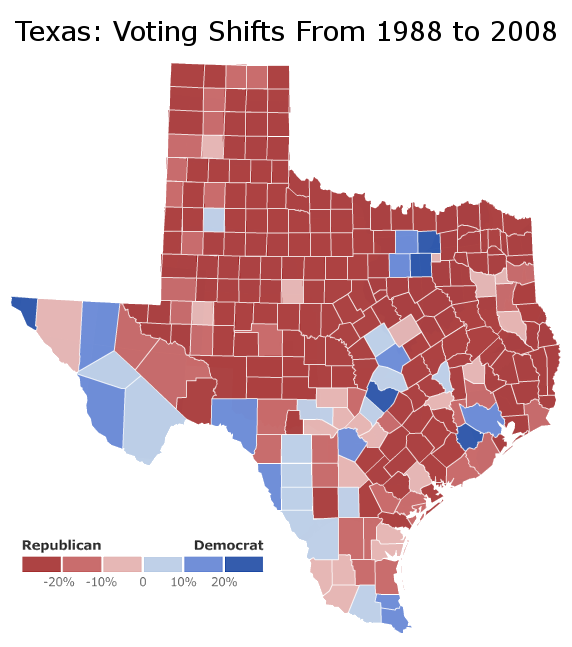
Compared to 1988 – a year in which the Democratic presidential candidate suffered a resounding national defeat – the 2008 nominee, despite winning a solid national victory, also failed to improve markedly in the Rio Grande area:

Photobucket

(Note: Edited Center For American Progress Image This image can be accessed here.)

Note that in 2008 Democrats lost Texas by 11.8%; in 1988 they lost Texas by 12.6%.

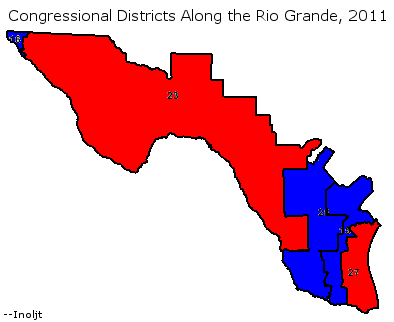
In the 2010 midterm elections Republicans also made several gains in South Texas, winning two heavily Hispanic congressional districts. The first was the 23rd congressional district, which is 65.5% Hispanic; the second the 27th congressional district, which is 71.6% (!) Hispanic.

Photobucket

These patterns are not unique to Texas. In rural south Colorado, for instance, traditionally Hispanic counties have also trended Republican since the 1990s.

Whether the areas of Texas bordering the Rio Grande River will continue moving Democratic or Republican is up-to-question. In Texas, the effects of Mr. Bush’s appeal to Hispanics still are heard; Hispanics in the state are some of the more conservative in the country. The Texas Republican Party has also been relatively moderate on immigration issues. For instance, Republican Governor Rick Perry – a firecracker on other issues – opposes SB 1070.

Needless to say, Republican success at cutting Democratic margins in the counties bordering the Rio Grande would constitute a major achievement for the party.

If a Democrat is ever to win Texas – and none has done so for more than a decade – he or she will need enormous margins there. If Republicans go from 30+% to 40+% of the vote in El Paso or Hidalgo County, it is very difficult to imagine Democrats ever winning Texas.

For more than a decade Democrats have latched onto the Great Hispanic Hope: that growing numbers of Democratic-voting Latinos in Texas will one day turn the state blue. Republican success at winning Hispanics would crush that dream.

Analyzing the Florida Gubernatorial Election

This is a part of a series of posts analyzing the 2010 midterm elections. This post will discuss the 2010 Florida gubernatorial election, which Republican candidate Rick Scott won in an extremely close contest.

Florida’s Gubernatorial Election

On November 2010, Democrat Alex Sink faced an extremely flawed Republican opponent: multimillionaire Rick Scott, a businessman accused of heading the biggest fraud in Medicare history.

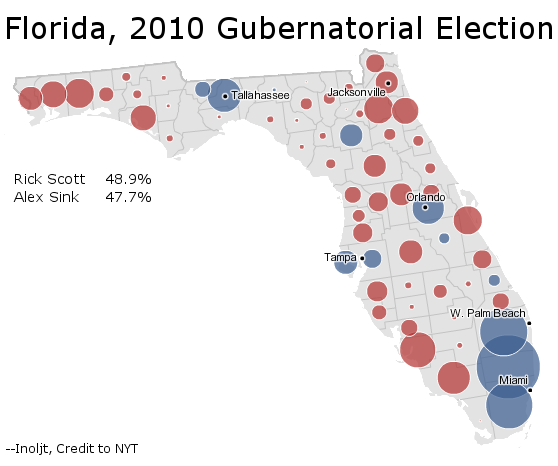
Ms. Sink still lost, running in a Republican leaning state in a very Republican environment. Here is what happened:

Photobucket

More below.

This constitutes a classic map of a close race in Florida. Ms. Sink wins the counties that she needs to win in the I-4 central corridor. For a Democrat, she performs relatively strongly in conservative northern Florida.

Turn-Out

What kills Ms. Sink, however, is Democratic turn-out.

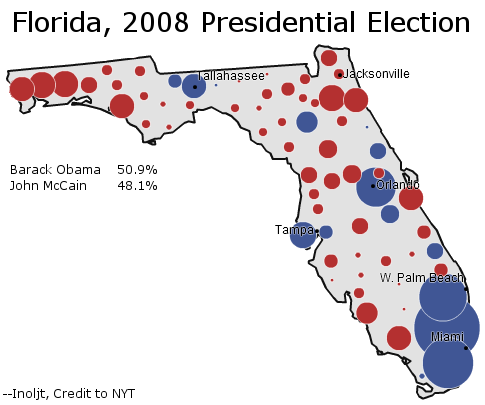
To gain some perspective on this, let’s compare Ms. Sink’s performance with that of President Barack Obama’s:

Photobucket

Note that the circles depicted here are not equivalent. In 2008 8.4 million people voted; in 2010 only 5.3 million did. So the absolute margins of 2008 – regardless of whether Mr. Obama won or lost the county – are much bigger.

Nevertheless, one can see that Mr. Obama gets quite a bit more mileage out of the counties he wins than Ms. Sink does. This is especially true along the Democratic, minority-heavy strongholds of Orlando and South Florida.

In 2008 these places composed a greater share of the Florida electorate than they did in 2010; minority and Democratic turn-out fell disproportionately in the mid-term. In 2008 Orlando and South Florida (i.e. Broward, Miami-Dade, Orange, and Palm Beach counties) composed 31.6% of the electorate; in 2010 they composed 29.2% of the electorate. This does not seem like much, but it makes a difference when the margin of victory is 1.2%.

On a county-by-county basis, Mr. Scott’s margin would be cut from 61,550 to 15,226 in the 2008 electorate, even if his share of each county’s vote does not change (only the number of voters in each county does). I suspect that if you adjust this on a precinct level – if you give each precinct the same number of voters it had in 2008, without changing the percent of the vote Ms. Sink and Mr. Scott got in that precinct – Ms. Sink would have won outright.

Turn-Out

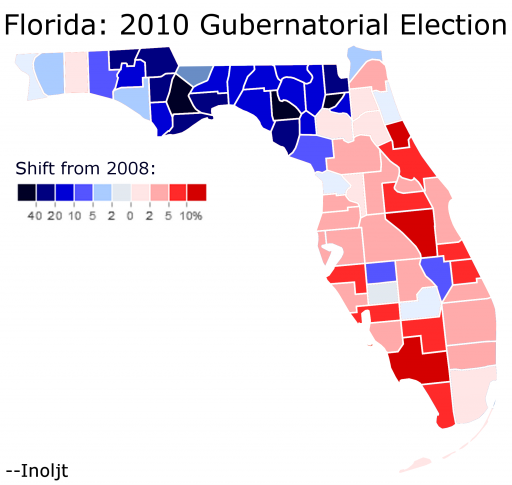
There is one part of Florida, however, in which Ms. Sink did much better than Mr. Obama. It’s hard see this in the previous maps, due to the low population of this region. Here is a better illustration:

Photobucket

As the map indicates, Northern Florida moved quite strongly towards Ms. Sink, although not strongly enough to offset her losses elsewhere.

There are a variety of explanations for why this might be. The rural, poor, Southern voters there might have been turned off a wealthy businessman as a Republican candidate. Ms. Sink might have overperformed amongst Republicans.

It is also true that Mr. Obama did quite poorly amongst these voters, losing many of these counties by 40+ margins. Partly this had to do with his status as a big-city Chicago liberal. Mostly, however, Mr. Obama did poorly because he was black.

Half a century ago northern Florida was the most Democratic part of the state, back in the days of the Solid South. Since then the Democratic Party has moved away from these voters (see: John Kerry, Barack Obama); it gets progressively harder each election for a Democrat to win them, although some still do. Ms. Sink’s improvement over Mr. Obama, then, might have been the last gasp of a dying breed: white Dixie Democrats.

Conclusions

In the dying days of Florida’s gubernatorial campaign, Democratic candidate Alex Sink was accused of cheating during the gubernatorial debate. The scandal broke during the final days of the campaign, derailing a crucial time for any campaign. Pundits will point to the scandal as responsible for the 1.2% margin by which Ms. Sink lost.

Yet it may have been another event, seemingly unrelated, that truly undid Ms. Sink. During the campaign’s final days, Independent Charlie Crist – running for Florida’s Senate seat – mounted a concerted effort to get Democrat Kendrick  Meek to drop-out. The coverage dominated national news, blackened the image of both participants, and demoralized Democrats everywhere in Florida.

It may have also led to Ms. Sink’s defeat. In many ways the candidate did what she had to do – she won the right places and improved on Mr. Obama in the most Republican part of Florida. I remember looking at her northern Florida numbers on election day and feeling somewhat optimistic about her chances. With the vote in at 50%, Ms. Sink stood behind by 5% – but the Democratic Gold Coast hadn’t started reporting. She could close things once the Democratic strongholds Palm Beach, Broward, and Miami-Dade counties came in.

But Ms. Sink never did fully close the gap. Democratic turn-out killed Ms. Sink, as it did with many others in 2010.

–Inoljt

P.S. Here is a table I created, some of whose information is used in this post.

Republican Margin: Change   from 2008 to 2010 2010 County Percent of Vote 2008 County Percent of Vote Change in Turn-Out Sink Under 2008 Electorate County
0.11% 1.38% 1.50% -0.12% -26919 Alachua
-29.35% 0.15% 0.13% 0.02% 3091 Baker
-2.73% 1.03% 0.97% 0.06% 30805 Bay
-17.09% 0.15% 0.14% 0.01% 2706 Bradford
2.87% 3.66% 3.43% 0.23% 38254 Brevard
3.50% 7.83% 8.74% -0.90% -229201 Broward
-32.24% 0.08% 0.07% 0.01% 504 Calhoun
6.87% 1.11% 1.02% 0.09% 12047 Charlotte
-0.81% 1.02% 0.91% 0.11% 11629 Citrus
0.12% 1.19% 1.13% 0.06% 40617 Clay
10.14% 1.92% 1.69% 0.23% 46331 Collier
-12.40% 0.35% 0.34% 0.02% 6001 Columbia
-1.01% 0.13% 0.12% 0.01% 1146 Desoto
-30.47% 0.10% 0.09% 0.01% 1047 Dixie
3.81% 4.88% 4.95% -0.07% 23793 Duval
-0.78% 1.79% 1.84% -0.05% 28636 Escambia
11.39% 0.62% 0.59% 0.04% 4833 Flagler
-28.01% 0.08% 0.07% 0.00% -10 Franklin
-7.45% 0.31% 0.27% 0.04% -10451 Gadsden
-18.49% 0.10% 0.09% 0.01% 2214 Gilchrist
-0.63% 0.05% 0.05% 0.00% 832 Glades
-15.77% 0.09% 0.09% 0.01% 1693 Gulf
-13.24% 0.07% 0.07% 0.01% 75 Hamilton
-5.83% 0.10% 0.09% 0.01% 1761 Hardee
5.24% 0.12% 0.13% -0.01% 1354 Hendry
4.90% 1.09% 1.05% 0.04% 7458 Hernando
2.20% 0.56% 0.53% 0.02% 9074 Highlands
3.79% 5.93% 6.12% -0.19% -17133 Hillsborough
-24.68% 0.11% 0.10% 0.01% 3460 Holmes
6.92% 0.88% 0.84% 0.04% 15364 Indian River
-24.48% 0.28% 0.26% 0.02% 754 Jackson
-14.85% 0.12% 0.09% 0.02% -1476 Jefferson
-43.33% 0.05% 0.04% 0.01% 574 Lafayette
2.61% 1.90% 1.75% 0.15% 23697 Lake
11.33% 3.39% 3.21% 0.19% 58504 Lee
-11.04% 1.86% 1.77% 0.09% -52485 Leon
-5.68% 0.24% 0.22% 0.01% 3976 Levy
-45.26% 0.04% 0.04% 0.00% -43 Liberty
-10.71% 0.12% 0.11% 0.01% -680 Madison
5.42% 1.98% 1.81% 0.17% 18952 Manatee
2.02% 2.13% 1.93% 0.20% 22073 Marion
2.07% 1.01% 0.93% 0.08% 12257 Martin
1.82% 9.11% 10.28% -1.17% -123556 Miami-Dade
5.01% 0.49% 0.48% 0.01% 48 Monroe
-4.23% 0.50% 0.46% 0.04% 15161 Nassau
0.69% 1.14% 1.14% 0.00% 43580 Okaloosa
-5.99% 0.15% 0.15% 0.00% 1684 Okeechobee
7.48% 5.07% 5.50% -0.43% -51546 Orange
13.29% 1.00% 1.20% -0.20% -6459 Osceola
4.16% 7.15% 7.03% 0.12% -110658 Palm Beach
4.88% 2.55% 2.56% -0.01% 18217 Pasco
2.55% 5.66% 5.53% 0.13% -26374 Pinellas
4.83% 2.99% 2.92% 0.07% 26880 Polk
0.37% 0.40% 0.40% 0.00% 6523 Putnam
-3.26% 0.93% 0.91% 0.02% 34011 Santa Rosa
4.40% 2.71% 2.47% 0.24% 9360 Sarasota
4.00% 2.46% 2.45% 0.01% 13996 Seminole
-1.39% 1.40% 1.26% 0.13% 31952 St. Johns
7.18% 1.41% 1.44% -0.03% -5928 St. Lucie
1.21% 0.78% 0.58% 0.20% 13803 Sumter
-13.75% 0.25% 0.21% 0.04% 5189 Suwannee
-17.01% 0.12% 0.11% 0.01% 2058 Taylor
-46.53% 0.07% 0.06% 0.00% 169 Union
7.74% 2.94% 2.91% 0.03% 5093 Volusia
-21.92% 0.21% 0.17% 0.03% 415 Wakulla
-5.00% 0.35% 0.32% 0.03% 11029 Walton
-16.60% 0.15% 0.13% 0.02% 3462 Washington
3.97% 100.00% 100.00% 0.00% 15226 Total

The Future of the Asian-American Vote

Asians are one of the most ignored constituencies in American politics. When most politicians think about the Asian vote, they don’t.

Yet the Asian-American population is increasing, both in absolute terms and relative ones. By 2050, the Census estimates that Asians will compose 7.8% of the American population. Although their voting rates will still fall far short of this, the population is becoming more influential. Predicting their future voting path therefore has some utility.

In previous posts, this blogger has argued that the Latino vote will likely trend Republican, as Latinos follow the path of previous immigrants and become more assimilated.

Will the same happen for Asian-Americans?

More below.

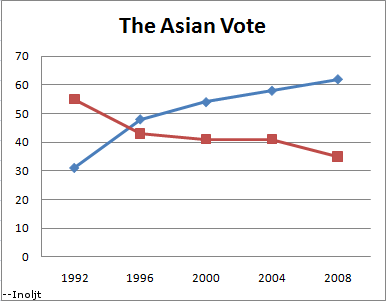
Probably not:

Photobucket

As the graph above shows, the Asian vote has steadily moved Democratic, in quite a significant manner. In 1992 Republican President George H.W. Bush won 55% of the Asian vote while losing the popular vote. 12 years later, his son won only 41% of Asians, despite winning the popular vote.

The trend also does not look bright for the Republican Party. Asian-Americans who have been born in the United States are, if anything, more Democratic than those who immigrated into the country (to be fair, the latter group dominates the Asian population and will continue to do so unless immigration is drastically curtailed).

Take, for instance, the Vietnamese-American population – strong supporters of the Republican Party. The Asian American Legal Defense and Education Fund, after conducting an extensive exit poll of Asians (perhaps the only detailed exit poll of the group in the country), found that:

Vietnamese American voters gave McCain the strongest support of all Asian ethnic groups at 67%. However, further analysis of Vietnamese American voters revealed 69% of those born in the U.S. and 60% of those 18-29 years old voted for Obama. Among Vietnamese American respondents, 15% were born in the U.S. and 25% were between the ages of 18 and 29.

The analysis goes on to conclude that:

AALDEF’s exit poll data shows that younger, U.S.-born, more recently naturalized, and English proficient Asian American citizens voted for Barack Obama for President by wide margins. Older, foreign-born citizens with limited English proficiency and who had been naturalized more than ten years ago voted in greater proportions for McCain.

There are several explanations for why this is happening. One quite plausible argument is that immigration has shifted the Asian-American population from Orange County anti-communists to Silicon Valley liberals.

Another revealing insight can be gained by comparing Asians to another very Democratic group: Jews. In many ways the two have a startling amount in common. Both groups are highly educated; both are primarily located in urban metropolitan areas; both have achieved substantial success in American society; and both have encountered quite similar types of discrimination. Even the stereotypes are similar.

Given these similarities, it is very conceivable that Asians could end up voting like Jews – one of the most liberal-minded groups in the nation.

–Inoljt, http://mypolitikal.com/

The Worst Republican Senate Candidates of 2010, Part 1

This is the first part of two posts analyzing patterns in the 2010 Senate midterm elections. The second part can be found here.

The 2010 congressional midterm elections constituted, by and large, a victory for the Republican Party. In the Senate Republicans gained six seats. While this was somewhat below expectations, it was much better than Republican hopes just after 2008 – when many expected the party to actually lose seats.

The Senate results provide some interesting fodder for analysis. The table below indicates which Republicans Senate candidates did the worst in 2008. It does so by taking the Republican margin of victory or defeat in a given state and subtracting this by the Cook PVI of the state (the Cook PVI is how a state would be expected to vote in a presidential election in the event of an exact tie nationwide). Given that Republicans won the nationwide vote this year, the average Republican candidate would be expected to do better than the state’s PVI. A bad Republican candidate would actually do worse than the state’s PVI.

Let’s take a look at this table below the flip.

State Republican Margin Cook PVI Republican Overperformance
South Dakota 100.00% 8.9% 91.10%
North Dakota 53.91% 10.4% 43.51%
Kansas 43.72% 11.5% 32.22%
Iowa 31.05% -1.0% 32.05%
Idaho 46.25% 17.4% 28.85%
Oklahoma 44.50% 16.9% 27.60%
Florida 28.69% 1.8% 26.89%
South Carolina 33.83% 7.8% 26.03%
New Hampshire 23.22% -1.6% 24.82%
Arizona 24.14% 6.1% 18.04%
Alabama 30.47% 13.2% 17.27%
Ohio 17.44% 0.7% 16.74%
Georgia 19.31% 6.8% 12.51%
Arkansas 20.96% 8.8% 12.16%
Missouri 13.60% 3.1% 10.50%
Illinois 1.60% -7.7% 9.30%
Louisiana 18.88% 9.7% 9.18%
Utah 28.79% 20.2% 8.59%
Indiana 14.58% 6.2% 8.38%
North Carolina 11.77% 4.3% 7.47%
Wisconsin 4.84% -2.4% 7.24%
Pennsylvania 2.02% -2.0% 4.02%
Kentucky 11.47% 10.4% 1.07%
Washington -4.73% -5.0% 0.27%
Alaska 11.94% 13.4% -1.46%
Colorado -1.63% 0.2% -1.83%
California -10.01% -7.4% -2.61%
Nevada -5.74% -1.3% -4.44%
Connecticut -11.94% -7.1% -4.84%
Delaware -16.58% -7.0% -9.58%
Oregon -17.98% -4.0% -13.98%
New York (S) -27.84% -10.2% -17.64%
Maryland -26.44% -8.5% -17.94%
West Virginia -10.07% 7.9% -17.97%
Vermont -33.41% -13.4% -20.01%
New York -34.10% -10.2% -23.90%
Hawaii -53.24% -12.5% -40.74%
Total/Average 5.54% 2.3% 8.08%

(Note: The data in Alaska and Florida refer to the official candidates nominated by the parties, not the independent candidates – Senator Lisa Murkowski and Governor Charlie Crist – who ran in the respective states).

This table reveals some fascinating trends. There is a very clear pattern: the worst Republican candidates ran in the bluest states – and the bluer the state, the more the Republican underperformed. This does not just mean that these Republicans lost, but that they lost by more than the average Republican was supposed to in the state. Republican candidates did worse than the state’s PVI in thirteen states; nine of these states had a Democratic PVI.

There seems to be a PVI tipping point at which Republicans start underperforming: when a state is more than 5% Democratic than the nation (PVI D+5). Only one Republican in the nine states that fit this category overperformed the state PVI (Senator Mark Kirk of Illinois ).

Something is puzzling about this pattern. It is true that states like Connecticut or Maryland will probably vote Democratic even in Republican victories. The Cook PVI predicts that Democrats will win by X% in the event of a national tie in the popular vote. One would thus have expected Republican candidates to do better than this in 2010, given that 2010 was the strongest Republican performance in a generation.

Yet this did not happen. In a lot of blue states Democrats actually did better than the Cook PVI would project them to do – that is, said blue states behaved like the Democrats had actually won the popular vote, which they certainly did not in 2010. The bluer the state, the stronger this pattern.

There are a couple of reasons why this might be. The first thing that comes to mind is the money and recruiting game. The Republican Party, reasonably enough, does not expect its candidates to win in places like New York and Maryland . So it puts less effort into Republican candidates in those states. They get less money – and therefore less advertising, less ground game, and so on. Nobody had any idea who the Republican candidate in Vermont was, for instance. That probably contributes to Republican underperformance in deep-blue states.

The second factor might be a flaw in the model the table uses. Democratic and Republican strongholds, for whatever reason, behave differently from “uniform swing” models. In almost all the counties President Barack Obama won, for instance, he improved upon President Bill Clinton 1992 and 1996 performance – despite the fact that Mr. Clinton won by similar margins in the popular vote. This holds true from San Francisco to rural Mississippi . In the 2010 Massachusetts special Senate election, the most Democratic areas of Massachusetts swung least towards Republican Senator Scott Brown. The fact that the worst Republican candidates ran in the bluest states fits the pattern.

The table presents another startling pattern, which will be discussed in the next post: there are surprisingly few Republicans who did worse than they were supposed to in red states.

–Inoljt