Indiana, North Carolina, Ohio & Utah Primary/Convention Preview

The primary season gets underway in earnest this week, with contests in Indiana, North Carolina, and Ohio tomorrow. Additionally, Utah’s state GOP convention is on Saturday. Also note that North Carolina has a top-two run-off (scheduled for June 22nd) for any races where the leading candidate fails to clear 40% in the first round. (For a complete primary & run-off calendar, click here.)  Below is a roundup of some of the key races to watch for:

Indiana:

  • IN-Sen (R): This may well be the most interesting primary on Tuesday. It’s a true ground zero face-off between the establishment and the teabaggers. In one corner is Dan Coats, who couldn’t get more bougie if he tried. Not only is he a former Senator, he’s spent the last decade as a Washington lobbyist for a host of unsavory clients. In the other corner… well, there are two corners. One is occupied by certified nutball ex-Rep. John Hostettler, who is as allergic to raising money as he is to sanity. The latter quality has endeared him to the base, but the former is a big obstacle to, well, winning. Which leaves state Sen. Marlin Stutzman, who has been eating a good portion of Hostettler’s lunch – among other things, he’s secured the endorsement of Jim DeMint, the patron saint of hopeless right-wing primary candidates. There’s been precious little polling of the race, but what we’ve seen indeed suggests that Stutzman and Hostettler are splitting the crazies, which could allow Coats to sneak through with a very underwhelming vote total. This is one of those races where it’s just hard for a Democrat to say who we’d be better off with as our opponent – they’re all great! (David)
  • IN-02 (R): Most people have assumed that state Rep. Jackie Walorski – “Wacky Jackie” to those who know her best – will be the GOP’s nominee in the 2nd, as she was the NRCC’s prize pick and she’s well-known (as a former local TV news reporter and a member of GOP leadership in the state House). She still faces a challenge from Jack Jordan, the president of the Bremen school board. Despite a long stint as an executive at local pharma company Eli Lilly, Jordan seems to be working the angry average-guy angle, and if there’s a year to be doing that, it’s this year. (Crisitunity)
  • IN-03 (R): Republican incumbent Mark Souder, a notorious under-performer in this deeply Republican district, may finally be running out of rope. A recent SUSA poll only gave Souder a 35-29 edge over auto dealer Bob Thomas, with attorney and former Dan Coats staffer Phil Troyer gobbling up nearly 20%. One way or the other, though, Souder’s time in Congress is rapidly coming to a close — he recently told Brian Howey that he’s strongly inclined to retire in 2012 if he survives this dogfight. The winner of this pie fight gets to face ’06 Democratic nominee Tom Hayhurst, a physician and former Fort Wayne city councilor. (James)
  • IN-04 (R): With incumbent Republican Steve Buyer making this term his last in this deeply Republican suburban donut district, the GOP primary is where it’s at. Secretary of State Todd Rokita may think he has control of the two turntables and the microphone in this race, but state Sen. Brandt Hershman has been raising a respectable sum of cash – and has Buyer’s endorsement. State Sen. Mike Young is also in the mix, but his fundraising is barely existent. (J)
  • IN-05 (R): If there was ever a year to give GOP Rep. Dan Burton’s ass the boot, it’s this one. After winning a surprisingly close primary contest against former Marion County Coroner John McGoff, four viable Republicans have stepped up to challenge Burton this year – including McGoff again. Joining them are state Rep. Mike Murphy, ex-state Rep. Luke Messer, and former Dan Quayle/Dan Coats staffer Brose McVey. With a field chopped up in so many ways, Burton just may survive. (J)
  • IN-08 (R): Republicans were caught off guard in this district after Democrats managed to beam up incumbent Rep. Brad Ellsworth to the Senate race, and they lack a well-known name to take advantage of this open seat. However, NRCC-types like surgeon Larry Buschon, who has managed to bank a decent amount of coin for his bid. However, he’ll have to fight through a field crowded with seven other candidates, including teabagger fave Kristi Risk. The theory swirling around the tubes is that, since this district is ground zero for John Hostettler nut-wing Republicans, Hoss’s Senate campaign may excite enough ‘baggers to threaten Buschon. It’d be surprisng if this one plays out that way, though. (J)
  • IN-09 (R): Douchebag ex-Rep. Mike Sodrel is making his fifth crack at this seat, but he’s facing somewhat stiff competition in the primary from attorney Todd Young, who seems to be the favorite of an establishment tired of the retread Sodrel. Also waiting in the wings is teabagger Travis Hankins, who has raised enough scrilla to keep himself in the game. (J)

North Carolina:

  • NC-Sen (D): North Carolina Democrats will head to the polls to give either Secretary of State Elaine Marshall, ex-state Sen. Cal Cunningham, and attorney Ken Lewis the right to take on anonymous frosh GOP Sen. Richard Burr in November. One of these candidates will need to break the 40% barrier in order to avoid a June runoff. While no one has polled close to that marker yet, local boy Tom Jensen is betting that one of Cunningham (the man with the money) or Marshall (the name you know) will cross that barrier. (J)
  • NC-08 (R): Republicans have been licking their chops over the chance to dethrone Larry Kissell after just one term in the House, but their field of candidates is decidedly second-tier. Businessman Tim d’Annunzio has spent nearly $1 million, making him something of a favorite – but he’s also racked up a long list of unflattering incidents on the campaign trail that suggest his campaign, though well-funded, is completely unhinged. D’Annuzio will face ex-sportscaster Harold Johnson, retired Army Col. Lou Huddleston, and engineer Hal Jordan in the primary. It wouldn’t be a shock to see this one go to a runoff. (J)
  • NC-11 (R): This one may not rank very highly on the GOP’s target list, but Republicans have a number of warm bodies in the race against sophomore Dem Rep. Heath Shuler, in case things get interesting. Businessman Jeff Miller and ophthalmologist Dan Eichenbaum have both spent over $100K on their campaigns as of mid-April, while Hendersonville Mayor Greg Newman is running on spare change and a pocketful of dreams. (J)

Ohio:

  • OH-Sen (D): Two Democrats are fighting for the right to take on Republican Rob Portman, the former congressman and Bush budget director: Lt. Gov. Lee Fisher and Secretary of State Jennifer Brunner. Fisher, who’s enjoyed a sizable fundraising edge as well as support from the DSCC, has seen his lead expand a good deal in recent public polling. Turnout will probably be low, which always increases unpredictability, so it may not be quite a done deal – but Fisher is looking pretty good. (D)
  • OH-02 (D): The choice for Dems is between Surya Yalamanchili, a former star of the reality show “Apprentice,” and novelty playing-cards mogul David Krikorian, who took 18% as an independent in 2008. “Chili,” as he is known, has not raised very much but appears to have consolidated the support of much of the local establishment (including endorsements from the past two Dem nominees in the district, Vic Wulsin and Paul Hackett). Meanwhile, Krikorian (a self-described “Reagan conservative”) seems to have ticked a few people off and apparently mocked his opponent’s name at a recent campaign event. Not pretty. (D)
  • OH-02 (R): Jean Schmidt, who hasn’t been in Congress all that long, has faced serious primary challenges in both of her re-election campaigns, escaping by just 5% in 2006 and a somewhat more respectable 18% in 2008. Part of the reason Schmidt survived both times is because of the split field facing her. The same is true this year. Warren County commissioner Mike Kilburn is probably Schmidt’s most legitimate challenger, but Some Dudes Debbi Alsfelder and Tim Martz are also in the race. Kilburn has only raised $30K, though, while Schmidt has spent more than $400 grand. Still, with anti-incumbent sentiment running as high as it has in ages, and with Schmidt being Schmidt, I suppose you never know. (D)
  • OH-16 (R): Businessman and former smalltown mayor Jim Renacci is the NRCC’s favorite here, and he’s raised over half a million to date (plus he’s given himself a $120K loan). But he’s facing a challenge from his right in the form of Matt Miller, a former Ashland County Commissioner. Miller is no run-of-the-mill teabagger. In 2006, he pulled in 42% of the vote against incumbent Rep. Ralph Regula (who was running what would be his last race). And in 2008, with the seat open, Miller came within 5 points of snatching the nomination from establishment-preferred state Sen. Kirk Schuring. Against this history, Renacci has already spent $500K to Miller’s tiny $24K. An upset is a definite possibility here. The winner takes on freshman Rep. John Boccierri. (D)
  • OH-18 (R): In a somewhat similar scenario, state Sen. Bob Gibbs is the GOP bigs’ favorite to challenge sophomore Rep. Zack Space. Classically, this means that Gibbs is hated by the teabag set, and he faces some real opposition, especially given his un-awesome fundraising. Fred Dailey, the 2008 nominee who got splattered by Space 60-40, is running, and he’s been howling loudly about the alleged “favoritism” the establishment has shown toward Gibbs. The other notable candidate is Jeanette Moll, who lost to Dailey in the primary last cycle and has run radio ads attacking Gibbs as a tax-increasing libruhl. Both this race and the contest in the 16th CD ought to provide an interesting read on how big the split really is between the grassroots and the powers-that-be in the Republican Party. (D)

Utah:

  • UT-Sen (R): Saturday is D-Day for Bob Bennett, who seems poised to become the first incumbent member of the Senate to fall this year. Oddly, though, the voters may not even get to take the chance to take their anger out on him, because he may not be able to make it out of the state Republican convention onto the primary ballot. In fact, Bennett would probably prefer that the broader population of primary voters, rather than the right-wing activists who dominate the convention, decide his fate. That’s because a variety of polls of convention delegates suggest that Bennett will be hard pressed to even make it to the final round of balloting (where Mike Lee and Tim Bridgewater seem to poll better). And even if Bennett somehow does make it to the final round against Lee, Lee is likely to consolidate all the anti-Bennett votes and clear the 60% mark needed to nail down the GOP nomination without a primary. Bennett is by no means a moderate, but he’s guilty of occasionally trying to legislate in conjunction with Democrats, which in this climate means he’s likely to get his walking papers. (C)
    SSP Daily Digest: 4/27 (Morning Edition)

  • KY-Sen: Obnoxious theocrat James Dobson is endorsing establishment dude Trey Grayson over weirdo Rand Paul. It feels like it’s gotten late early around here, with Grayson badly trailing in the last few polls, so you gotta wonder whether this or anything else can make much of a difference.
  • NV-Sen: According to Reid Wilson, the Tea Party Express (the political action wing, such as it is, of the teabaggers) says they’ll spend $100 to $150K on behalf of wingnut favorite Sharron Angle. Angle’s trailed pretty badly in most polling, though.
  • OH-Sen: With Ohio’s primary around the corner, the Hotline is reporting that the DSCC will apparently step into the race on Lee Fisher’s behalf. The not-terribly-well-funded Fisher is facing off against the almost-penniless Jennifer Brunner, but apparently Bob Menendez doesn’t want to take any chances.
  • WI-Sen: One-time beer baron Dick Leinenkugel officially decided to join the now-crowded GOP field hoping to take on Sen. Russ Feingold. Leinenkugel’s chief problem appears to be the fact that he just resigned as the governor’s Commerce Secretary… and the governor of Wisconsin is Jim Doyle, a Democrat. The Kugel’s new opponents were, needless to say, quick to point this out.
  • AZ-Gov: A couple of tidbits from a PPP poll that is slated to be released later today:
  • • Brewer has seen a significant improvement in her job approval numbers with Republicans. When we looked at the state in September she was under water even with voters of her own party, as 37% of them expressed disapproval of her job performance while only 28% felt she was doing a good job. Now 54% of Republicans approve of her and only 27% disapprove, so she’s seen a good deal of improvement on that front, which should be particularly helpful for her prospects of winning nomination for a full term against a crowded field of primary opponents.

    • At the same time Democratic candidate Terry Goddard leads Brewer 71-25 with Hispanics. That may seem ho hum, but consider this: Barack Obama only won Hispanic voters in the state by a 56-41 margin. So Goddard’s outperforming him by more than 30 points there. And on our September poll Goddard was up just 53-33 with Hispanics so it’s a 26 point improvement on the margin even relative to that.

  • FL-22: Combustible Republican Allen West is flashing an internal poll (from Wilson Research Strategies) which allegedly has him up 44-42 over incumbent Dem Ron Klein.
  • IN-09: Todd Young, seeking the GOP nod against ultra-retread Mike Sodrel, has a new ad up on TV, trying to paint himself as the “true conservative” choice. To CQ’s credit, they asked how much is being spent on the ad. To the Young campaign’s discredit, they declined to say.
  • MI-01: The Republican field in this race is getting’ mighty crowded here, too. GOP state Sen. Jason Allen, who is term-limited, is the latest to seek the Republican nod to replace Bart Stupak.
  • Fundraising: CQ has a handy chart of pre-primary fundraising filings in the three states which have primaries next week: Indiana, North Carolina, and Ohio.
  • Immigration: The Hill surveys the races out West where Arizona’s new immigration law may bolster Latino turnout – and help Dems. Jon Ralston notes that Brian Sandoval, the GOP’s would-be savior in the NV-Gov race, has come out in favor of the law. This could all get very ugly – well, even uglier than it already is.
  • Theoretical, improbable majority-minority districts

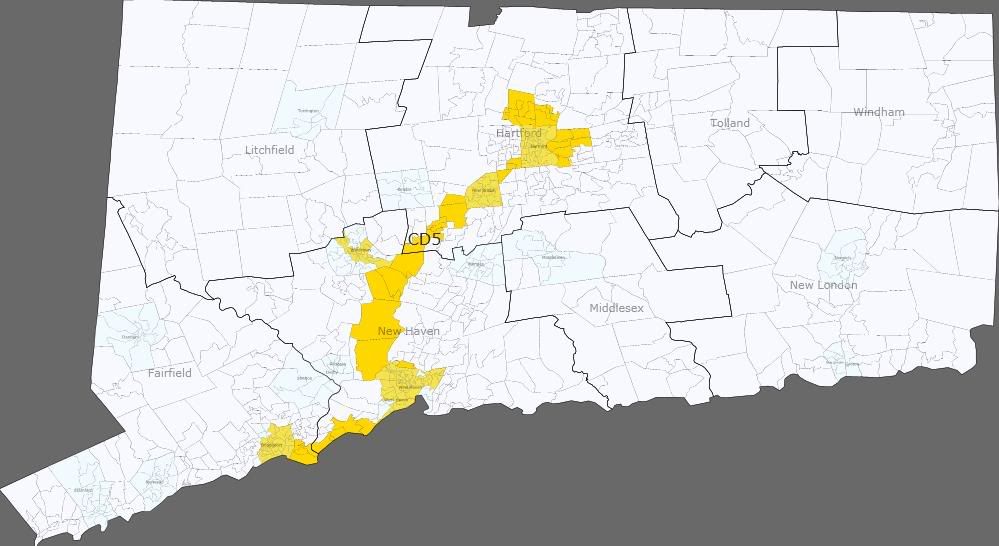
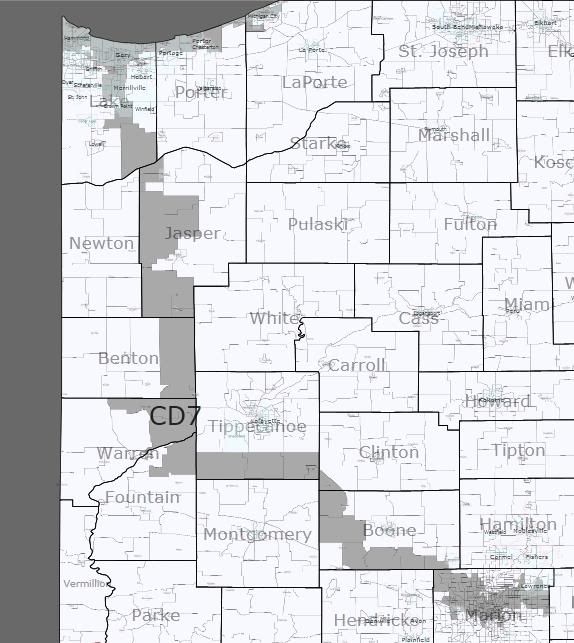
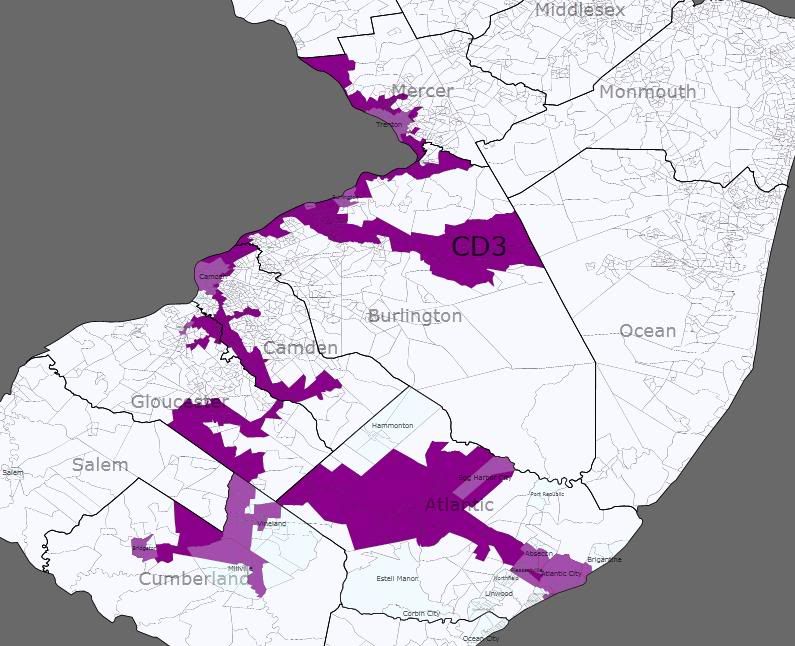
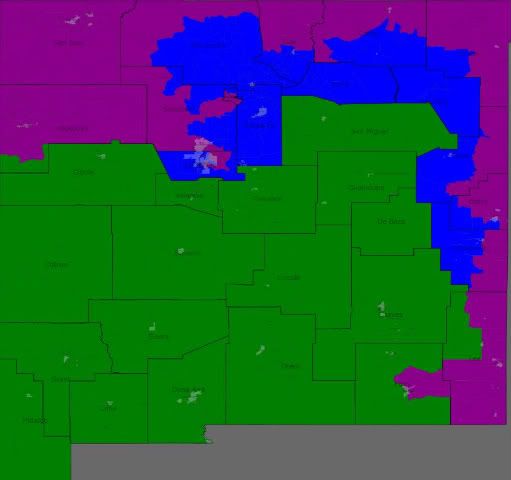
    I thought it would be interesting to use Dave’s Redistricting App to show that it was possible to create minority-majority districts in places that people might not necessarily expect, yet are indeed possible. I know that most of these districts will probably never be created, but it was an interesting chance to see what districts could be created. Technically, the definition of a majority-minority district according to the Supreme Court is any district that is less than 50% white (a coalition district), not necessarily a majority for one specific group. So some of these districts are +50% for one group, such as black or Hispanic, others have a plurality for another group, while others are just less than 50% white. So here are some of the districts I looked at:

    California

    Photobucket

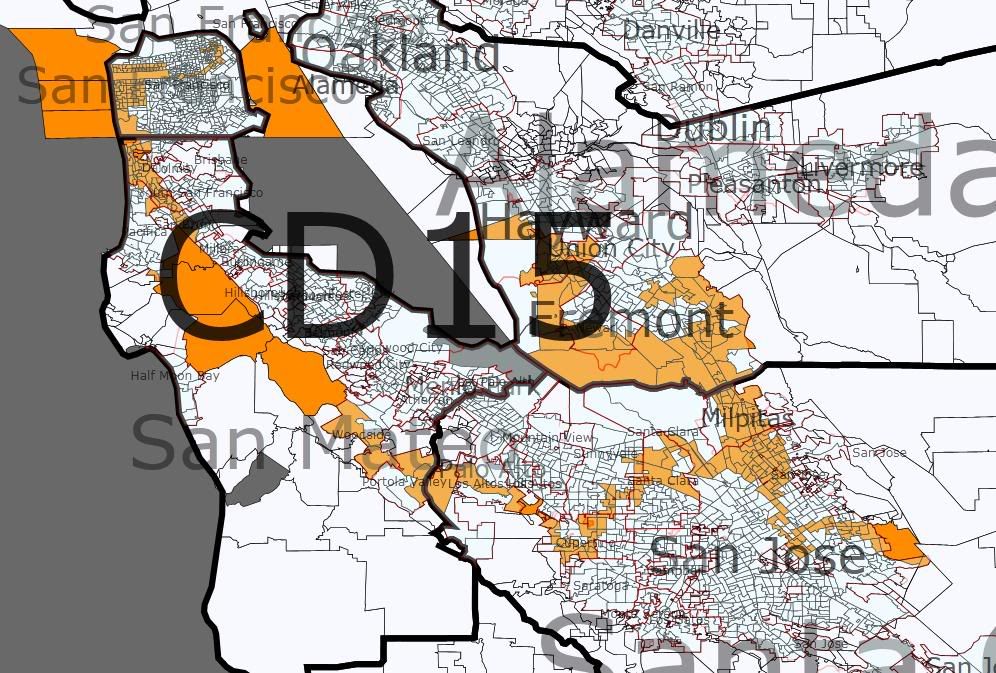
    Racial stats: 51% Asian, 29% white, 12% Hispanic, 4% other, 3% black

    This is an Asian majority district in the Bay Area. While several current districts have an Asian plurality with current Census data, none of them have an Asian majority. This district would probably elect an Asian representative, most likely Rep. Mike Honda, who already represents many Asian areas in San Jose. I think this might be the first Asian majority district to ever exist outside of Hawaii.

    Colorado

    Photobucket

    Racial stats: 51% Hispanic, 37% white, 7% black, 3% Asian, 1% Native American, 1% other

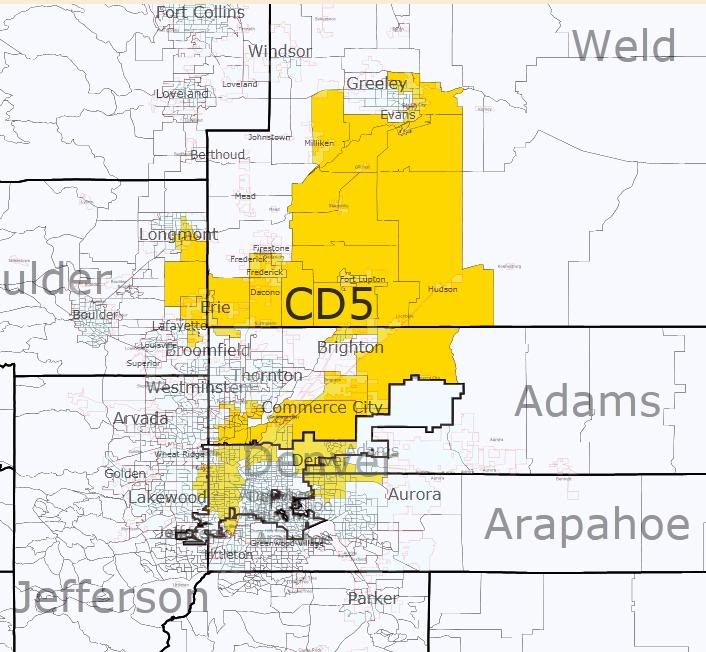
    It was actually possible to create a district in the Denver area that is majority-Hispanic. I linked Hispanic areas in the cities of Lakewood, Denver, Commerce City, Longmont, Brighton, and Greeley. Most of the voters come from Diana DeGette’s 1st district and Ed Perlmutter’s 7th district, although Jared Polis’s 2nd district and Betty Markey’s 4th district also lose some voters. I assume this district would elect a Democrat, possibly Diana DeGette, or possibly someone else.

    Connecticut

    Photobucket

    Racial stats: 43% white, 27% black, 24% Hispanic, 3% Asian, 3% other

    By linking minority areas in the cities of Bridgeport, New Haven, Waterbury, New Britain, and Hartford, it was possible to create a district that is majority-minority in Connecticut. The district has the homes of John Larson and Rosa DeLauro, and takes in all of the major urban centers in the four eastern and central districts, so it would probably help Republicans in some of the other districts. While the district is less than 50% white, it is almost evenly split between the district’s Hispanic and black populations, so it would be interesting to see what would happen in an election here.

    Indiana

    Photobucket

    Racial stats: 45% black, 43% white, 9% Hispanic, 2% other, 1% Asian

    By connecting heavily black areas in Indianapolis and Gary, it is possible to create a district that is plurality (yet not majority) black. I assume that Andre Carson would run here and win, although he would probably be challenged in the primary by Pete Visclosky. However, this district is more Indianapolis, so I think Carson would defeat Visclosky. This district would be incredibly Democratic either way, I’m sure Obama broke 75% here, maybe even 80%.

    New Jersey

    Photobucket

    Racial stats: 39% white, 34% black, 21% Hispanic, 4% Asian, 2% other

    This district connects minority areas in Atlantic City, Camden, and Trenton, and could probably be made even less white than this version is. Battle Royale between John Adler and Robert Andrews that would allow a minority candidate to slip through the primary? Thanks to andgarden for this idea.

    New Mexico

    Photobucket

    1st district (blue): 53% Hispanic, 37% white, 5% Native American, 2% other, 2% black, 1% Asian

    2nd district (green): 51% Hispanic, 42% white, 4% Native American, 1% black, 1% other, 1% Asian

    3rd district (purple): 55% white, 22% Hispanic, 17% Native American, 2% other, 2% black, 1% Asian

    As it stands now, all three New Mexico districts are majority-minority, although Dave’s Redistricting App shows a Hispanic majority in only one district, the current NM-02, with updated 2008 numbers. So I wanted to see if it was possible to create not just one, but two Hispanic majority districts. I accomplished this task without too much difficulty, although I admit that it looks a bit strange. The 2nd district remains almost unchanged, although it picks up Torrance County and Hispanic-majority San Miguel County and loses the cities of Carlsbad and Hobbs. Meanwhile, the city of Albuquerque is split in half, along with the northern and eastern edges of the state. The Hispanic western half of Albuquerque as well as other Hispanic areas to the north and east of the 2nd district, as well as Santa Fe go into the 1st district. Meanwhile, the mostly white eastern half of Albuquerque is put into the sprawling 3rd district, which goes from Gallup and Farmington in the northwest all the way down to Hobbs in the southeast.

    This would set up an interesting chain of events assuming the three Democratic congressmen currently in office (Heinrich, Teague, and Lujan) were still in office. No one would probably want to run in the new 3rd district, which is the white-majority district and the most Republican of the three. Teague would most likely run in the 2nd district, which is similar to his current district, although he would have to move as his home in Hobbs is now in the 3rd district. Meanwhile, Lujan and Heinrich would probably face off in the 3rd district, although I imagine Lujan would be the favorite since he represents much of this district already and there is now a Hispanic majority in the district. Meanwhile, a Republican would likely win the 3rd district seat, although perhaps I am wrong since New Mexico is a pretty Democratic state on the whole and this district still has significant Hispanic (22%) and Native American (17%) populations. This map would never occur with a Democratic legislature/governor, although perhaps the Republicans would attempt this if they controlled the state government, which is highly unlikely for now.

    Ohio

    Photobucket

    Racial stats: 53% black, 42% white, 2% other, 1% Asian, 1% Hispanic

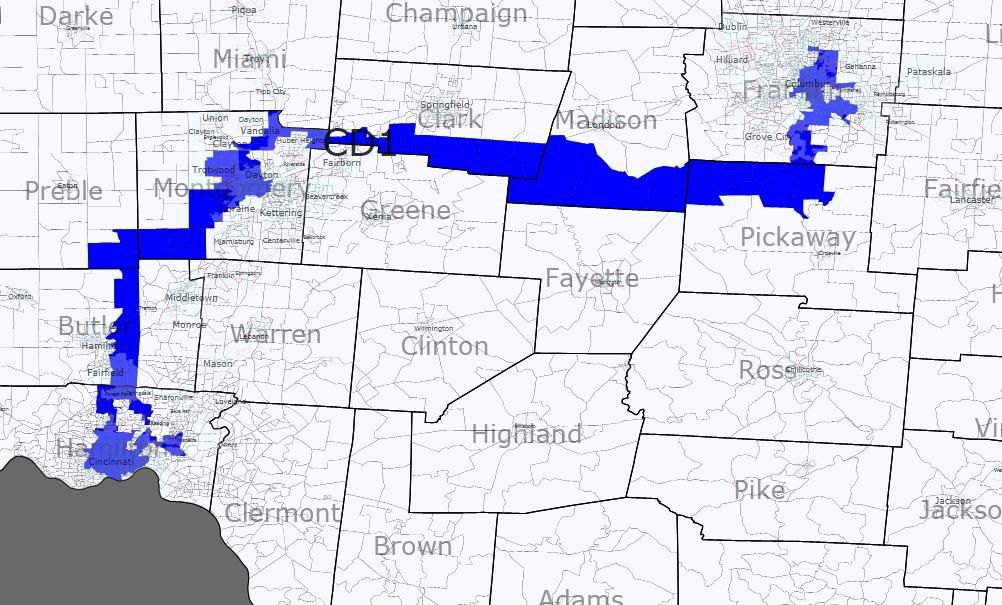
    This district actually inspired the rest of the diary after I thought of it over the summer. This new majority-black district links African-American areas in the cities of Cincinnati, Dayton, and Columbus, and manages to look cleaner than even the current NC-12 (Mel Watt’s district). It would almost certainly elect a black Democrat, and at the same time would take pressure off of other Republicans such as Pat Tiberi and Mike Turner. If Steve Chabot was elected in 2010, he would probably have to run against Boehner or Schmidt in the primary as this district would take up much of the current OH-01’s turf in Cincinnati. If Steve Driehaus hung on in 2010, I think he would probably lose the primary to an African-American, although who knows what would happen.

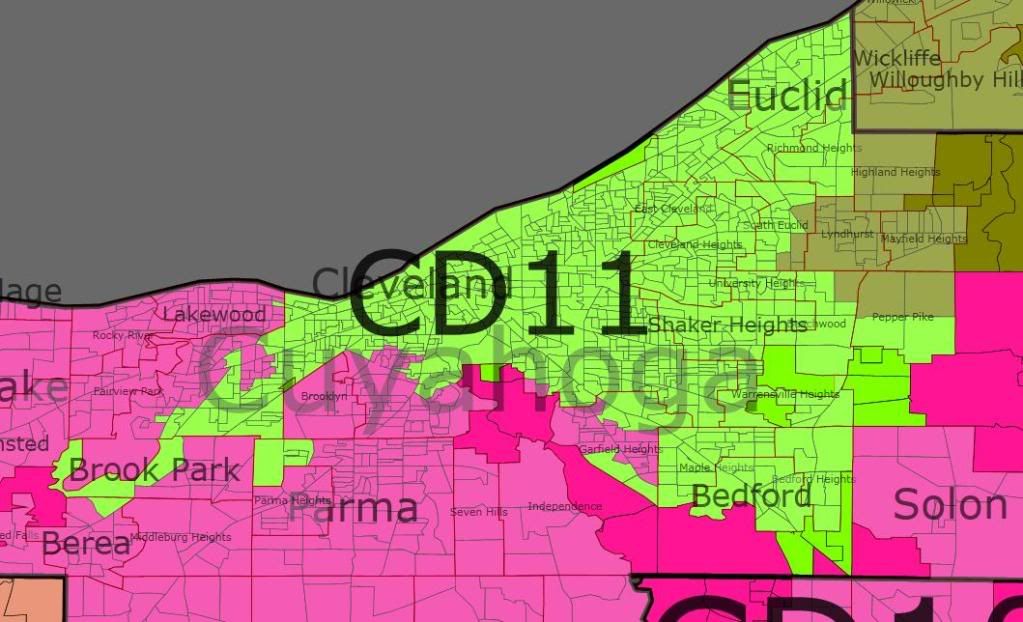
    Also, several people have said that they have been unable to keep OH-10 as a majority-black district in Cleveland without going into Akron.

    It is indeed possible, here is a map:

    Photobucket

    Racial stats: 50% black, 41% white, 5% Hispanic, 2% Asian, 1% other

    The main way I did this was by taking a lot of the population from Dennis Kucinich’s district, which puts his district 270,000 people in the red, which makes it almost a given his district will be combined with Sutton’s district in my opinion.

    Texas

    Photobucket

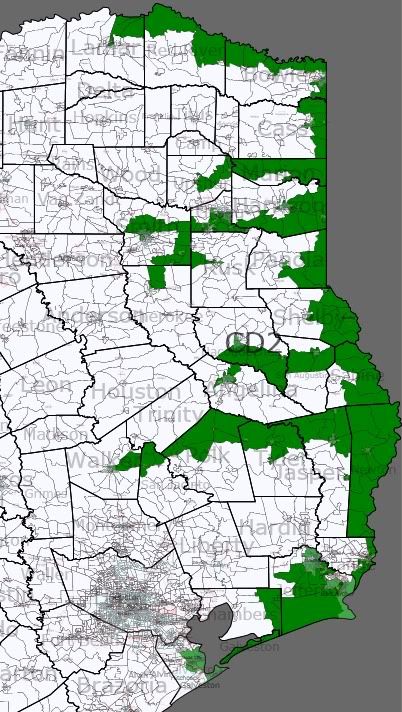
    Racial stats: 44% white, 33% black, 19% Hispanic, 1% Asian, 1% other

    I know that there are a lot of pockets of black and Hispanic voters in East Texas, so I wanted to see if it would be possible to make a minority-majority district in East Texas without going into Houston or Dallas at all. So I was able to make a meandering district that picks up minority voters in Galveston, Beaumont, Port Arthur, Orange, Huntsville, Lufkin, Longview, Tyler, Texarkana, and Paris. It looks a bit like Cleo Fields’ old district in neighboring Louisiana, although this district emerges at just 33% black. Still, that might be enough to put a black Democrat through the primary and into office, as the entire district is just 44% white overall and many of those white voters are Republicans and wouldn’t vote in the Democratic primary anyway. I made this district before Dave put in the partisan data, so I haven’t calculated the presidential numbers yet, although I imagine that it was probably in the low 50s for McCain, nowhere near as Republican as the current East Texas districts.

    So I know that many of these districts are highly theoretical, but I still thought it was an interesting exercise in seeing what is possible and what may even be required by law someday as voting rights law evolves. Let me know what you think of these districts and this subject!

    By what margin will Bob Shamansky win?

    View Results

    Loading ... Loading ...

    IN-Sen: Bayh retiring

    So says the Indianapolis Star:

    Sen. Evan Bayh will not run for re-election, a decision that will shock Democrats and Republicans alike in Indiana.

    In prepared remarks, Bayh, 54, cited excessive partisanship that makes progress on public policy difficult to achieve as the motivation for his decision.

    “After all these years, my passion for service to my fellow citizens is undiminished, but my desire to do so in Congress has waned,” he said.

    “My decision was not motivated by political concern,” he added. “Even in the current challenging environment, I am confident in my prospects for re-election.”

    Among other things, Bayh cited the recent Senate vote against a bipartisan commission to deal with the deficit (which would likely have recommended big cuts in entitlements).

    Do we have any bench in Indiana? I assume not.

    Introducing PBI (Party Brand Index)

    I have been working on (with some much appreciated help from pl515) a concept I’m calling PBI or Party Brand Index, as a replacement for PVI.  PVI (Partisan Voting Index), which is measured by averaging voting percentage from the last two presidential elections in each house district, and comparing it to how the nation as a whole voted, is a useful shorthand for understanding the liberal v. conservative dynamics of a district. But in my opinion it falls short in a number of areas. First it doesn’t explain states like Arkansas or West Virginia. These states have districts who’s PVI indicates a Democrat would be in a hard position to win, never the less Democrats (outside of the presidency) win quite handily. Secondly why is that the case in Arkansas but not Oklahoma with similar PVI rated districts?

    Secondly PVI can miss trends as it takes 4 years to readjust. The main purpose of Party Brand Index is to give a better idea of how a candidate does not relative to how the presidential candidate did, but rather compared to how their generic PARTY would be expected to perform. I’m calling this Party Brand Index.

    My best case for arguing against PVI is Indiana.  Bush won Indiana quite easily in 2000 and 2004. The PVI of a number of it’s districts showed them to be quite Red. Yet in 2006 democrats won several districts despite their PVI’s. Also Obama won Indiana in 2008 a state, which based on the make up of the districts PVIs, made little sense. I therefor chose Indiana as my first test case for PBI.

    Indiana also had a number of other oddity that made it an interesting test case. Indiana has Senators from opposite parties that each won election by large blowouts. Lugar’s in particular was enormous as he was essentially unopposed. Indiana also had a number of districts that flipped in the 3 election cycle expanse that I’m examining. Finally it makes the best case for why PVI can be misleading.

    To compute PBI I basically did the following. I weighed the last 3 presidential elections by a factor of 0.45. Presidential preference is the most indicative vote since it’s the one politician people follow the most. The POTUS is the elected official people identify with or despise the most, thus illuminating their own ideological identification. I then weighed each house seat by 0.35. House seats are gerrymandered and the local leader can most closely match their districts make up in a way the POTUS can’t. So even though they have a lower profile I still gave them a heavy weight. Lastly I gave the last two Senate elections a weight of 0.2. Senatorial preference can make a difference, although I think it’s less than that of the President or the House members. Also (more practically) because I have to back calculate (estimate) Senate result totals from county results, a smaller number helps lessen the “noise” caused by any errors I may make.

    I was then left with this chart:

    I now began to look at the results. Under my system Democratic leaning have a positive number, the GOP has a negative number. Donnelly in the Indiana 2nd is a perfect example of my issues with PVI. Under PVI Donnelly is in a Republican district with a PVI of -2. But look at how democrats have recently performed in this district. In 2008 Donnelly won reelection by 37%! Obama won this ditrict by 9 points, and Bayh won it by 22%! Does this sound like a lean GOP district? Under PVI it is, under PBI it’s not it’s a +11 democratic district.

    I then decided to go all Nate Silvaish and gave more recent elections a greater weight. I gave an addition 5% weight to each election as it got closer to the most recent election. To be honest I pulled 5% out of my dairy air but Nate gave a similar weighting to poll results as fresher ones came in 2008, so I copied this formula. This resulted in the following:

    The next issue I decided to tackle was to develop a way to weight for incumbents.  The reelection numbers for incumbants is so high it would be a mistake to weight a district soley on the fact that an incumbat continues to get elected. There is a long list of districts that have PVI that devate from their incumbant members, whom none the less keep getting elected. These disticts then change parties as soon as the incumbant member retires. This is evidence that incumbancy can disguise the ideology of voters in a district.

    I decided on a weight of about 7% for House members. I remember reading that incumbency is worth about 5-10%. Also Nate wrote in a 538.com article that a VP pick from a small state was worth about a 7% swing, a house seat could in fact be thought of as a small state, that seems as good a number as any to start from. Conversely I will deduct 7% from an incumbents win. I think this will score them closer to the natural weight of a district. By the way I’m weighting the win 7% less, not actually subtracting 7% from the number.  Open seat races will be considered “pure” events and will remain neutral as far as weighting goes.  A seat switching parties will also be considered a neutral event. The 1st defense of a seat by a freshman house member will be given a weighting of 2%. The toughest race for any incumbant is their 1st defense. I decided to adjust for this fact. Note: Indiana’s bloddy 9th was a tough call a case could be made that when a seat keeps flipping, and the same two guys run 4 straight times in a row each election should be a neutral event.

    Senate weighting will be as follows. In state with a single House seat the Senate seat will be weighted the same as a house. In states with mutiple seat, the Senate will get a wighting of 2%. Nate Silva stated that a VP pick in a large state is worth this amount. An argument could be made for a sliding scale of Senate weighting from 2-7%, this added complexity may be added at a later date. I will give incumbant presidents a 2% weighting, until I get better data on how powerful a “pull” being the sitting POTUS is, I will give them the same weighting as a senator.

    The main purpose of Party Brand Index is to give a better idea of how a candidate does not relative to how the presidential candidate did, but rather compared to how their generic PARTY would be expected to perform. I’m calling this Party Brand Index.

    ______________________________________

    The last major issue is how to deal with the “wingnut” factor. Sometimes a politician like Bill Sali (R-Idaho) or Marylin Musgrove (R-CO)lose because their voting record is outside of the mainstream of their district. I decided to try and factor this in.

    First I had to take a brief refresher on statistics. I developed a formula based on standard deviations. Basically I can figure out how much the average rep deviates from their district.  If I then compare where a reps voting pattern falls (in what percentile) and compare it to their district’s PVI, I can develop a “standard deviation factor”. Inside the standard deviation will get a bonus, outside a negative.

    For example, if Rep X is the 42 most conservative rep, that would place her in the 90th percentile. But if her district’s PVI was “only” the in the 60th, their is a good chance her margins would be effected. Using a few random samples I found most reps lie within 12% of their district’s PVI.

    Using these dummy numbers I then came up with this.  


       SQRT[(30-12)^2 /2] = about 13%

        Her factor would then be 100 – 13 = 0.87.

    So her victory margin would be weighted by 0.87 because she is more than 12% beyond her acceptable percentile range it making the victories in her district approximate 13% less “representative”.

        My theory yields the following formula:

            If rep’s voting record is > PVI then

                100 – SQRT[({Record percentile – PVI} – Standard PVI Sigma)^2 /2] = factor

            else if rep’s voting record < PVI

                 100 + SQRT[({Record percentile – PVI} – Standard PVI Sigma)^2 /2] = factor

    To really do this I need to compute the standard deviation for all 435 reps, which is a pretty large undertaking. Instead  I will do a google search  to see if anyone has already done this. If not well it will take some time. But this would deal with the wingnut factor. Since politician tend to vote relatively close to their districts interest (even changing voting patterns over time) this may not be a major issue. But developing this factor may eventually allow the creation of a “reelection predictor”, so I am still going to work on it.

    One last note, the corruption factor (for example Rep. Cao (R-LA) beating former Rep. Jefferson) is outside of any formula I can think of. The only saving grace here is that because my formula uses several elections, the “noise” from a single event will eventually be reduced.

    Next Up: Colorado ( have the data done already) and Virginia

    Rust Belt Redistricting Musings

    The following are my thoughts on redistricting each of the Midwestern states-from Iowa and Missouri to Western Pennsylvania. I think in general, things look good for Dems right now, with the exceptions of Indiana and Missouri. But read on and tell me what you think.

    In alphabetical order

    Iowa

    I think that in some ways, Iowa is the most predictable state because of the way they redraw their lines. You know that there will be a Democratic leaning 1st District in the northeast, a stronger Democratic 2nd in the southeast part, a Polk County/Des Moines based 3rd, and Steve King’s wingnut friendly 4th in the Western part of the state.

    Indiana

    With the GOP likely to run remap here, the consensus is that they’ll target Baron Hill by stripping him of Bloomington. I think that’s potentially dangerous, as neither Buyer or Burton are good campaigners. Furthermore, I think Baron Hill would be a great candidate for Governor, so the Indiana GOP better be careful what it wishes for……

    Illinois

    Two thoughts: if Kirk runs for Senate and we win his 10th (or if we win it outright), I’m guessing the ultimate target would be Judy Biggert, who’s older and less politically talented than Roskam. The best bet might be to pair them together in an ultra GOP DuPage based district and use the Dem leftovers with parts of say, the 9th to create a new Dem district.

    Now my evil little thought: I wonder if we could create a Democratic leaning monstrosity with the most Democratic friendly parts of Rockford, Peoria, Champaign/Urbana, and Springfield. Yeah it’d be ugly, but so is Phil Hare’s 17th…..

    Michigan

    In Michigan, if Dems run remap, there are several ways to go with it. My guess is that they would draw Thad McCotter into an Ann Arbor based district that he couldn’t win-that’s by far the easiest. I also think they’ll. The other thing they should do is draw a Lansing based Democratic District drawn for Virg Bernero and give the GOP parts of the 8th to Candice Miller and pack all of the GOP’s Southeast strongholds into a single district. I suppose there’s also the outside possibility of a Dem Western district that combines the city of Grand Rapids with some of the Dem leaning counties on Lake Michigan, but I’m not sure Vern Ehlers wouldn’t win that anyways….

    Minnesota

    Regardless of whether the state ends up with 7 or 8 CDs, the objective of Minnesota’s redistricting plan (if Dems control, and I think they will) will be to get rid of Michele Bachmann. The only difference being how you do it. If there are 8 CDs, you simply draw a 6th that is is close to even and friendly to State Senator Tarryl Clark. If there are 7, slam her into an uber-GOP (Sherburne, Wright, Carver,Scott and the most GOP friendly parts of Dakota, Anoka, and Hennepin)  district with John Kline.

    The big question here in either case is whether the DFL goes after the 3rd by swapping some of the more Democratic suburbs like St. Louis Park and Hopkins for GOP friendly stuff like Edina.

    Missouri

    Dems have to pray that Missouri holds onto its 9th CD so they can simply play incumbent protection and draw a more friendly 4th CD along the I-70 corridor from KC to Boone County. If Missouri goes to 8, I’m almost certain that Skelton’s district is toast.

    Ohio

    If Dems control redistricting and Ohio loses 2 seats, here’s some possibilities

    -The basic premise is to pack the GOPers into 4 ultra GOP districts: the 4th, 5th, 7th and 8th while creating a Dem Dayton district, cracking the 14th into 3, and the 2nd into 3 parts plus creating a Democratic leaning mashup of the 18th and 12th designed for Zack Space.

    -Create a Democratic 3rd by combining Montgomery County with Oxford and the most Dem friendly turf you can find in Greene.

    -Eliminate Jean Schmidt’s 2nd with the Dem parts of Hamilton going to the 1st, the GOP suburban stuff splitting between the 7th and 8th CDs and the Dem leaning Ohio River Counties into the 6th.

    -Drop the GOP parts of the 15th into the 4th, 5th, and 7th and pick up Dem friendly turf in Franklin. However be careful because….

    -To protect Zack Space, try and take what’s left of Franklin and mate it to the friendliest portions of the 18th while dropping as much of the GOP stuff into the 7th as possible.

    -Finally, crack Steve LaTourette’s 14th into 3 between Marcia Fudge’s 10th (as much of Geauga  as you can get away with), Tim Ryan’s new district (which would be something like half of Lake and what’s left of Geauga, Astabula, Trumbull and the most Dem parts of Mahoning with some Dem strength going to Boccieri in the 16th), Finally, put the other half of Lake into Kucinich’s 10th by connecting it along Lake Erie.

    Pennsylvania

    As I remarked in another diary, Tim Murphy is almost certainly toast because the map is likely to be redrawn by a judge due to the split in the state legislature. Flat out, there is no way that any sane judge would draw something similar to Murphy’s one step short of fictitious 18th CD that he has now. He’ll either wind up running against Murtha (and will lose) or will end up in something similar to Frank Mascara’s old 20th (which he’d lose as well).

    Wisconsin

    I think the best target for Wisconsin Dems, should they control the trifecta, would be to go after Paul Ryan rather than Tom Petri-its much easier to play mix and match with the heavily Democratic 2nd and 4th than it is with Petri’s 6th. Ryan’s also waaaay to conservative for his district as it is, and Petri is something of an institution in his district anyways, even if on paper it is slightly more Democratic.

    9 Competitive Districts for Indiana

    In a “now for something completely different” moment, I decided to redistrict a state in such away where all districts would be maximally competitive.  Indiana is ideal for this since it was extremely close in the last election and does not have large enough minority populations to invoke the VRA.

    Without further ado:

    I used the town totals from the back of this data set to split Lake and LaPorte counties. For the other split counties, notably Marion and Hamilton, I just came up with reasonable numbers for what I wanted the split to be, figuring it would be relatively easy to adjust the lines to make it a reality.

    Estimates of margins of victory and political analysis

    District 1 (Blue):  Obama by 3500.  Hammond and Terre Haute are balanced against some conservative Indianapolis suburbs. Open seat.

    District 2 (Green): Obama by 4900. Loses Michigan City and gain some Conservative territory to the East, but retains its South Bend base assuring Donnelly’s relatively easy reelection.

    District 3 (Purple): McCain by 700, the only one he wins. This Fort Wayne based district now gains some Democratic turf in Muncie and Anderson. Souder had challenging races in his old district, so would presumably draw even stronger challenges here.

    District 4 (Red): Obama by 5800. Gary and Lake County weigh against a broad swath of conservative turf, setting up a battle royale of Visclosky verses Buyer.  Theoretically the most Democratic district, but the estimates are a bit sketchy for some of the splits.

    District 5 (Gold): Obama 1400. Some Democratic turf near the lake and Tippecanoe County weigh against the conservative interior, most notably deep red Kosciuskco.  Open seat.

    District 6 (Turquoise): Obama by 3300. Some of the more Democratic parts of Marion weigh against Republican rural areas and suburbs.  Carson will need to convince enough of those folks that it’s okay to send a Muslim to congress that Indianapolis can carry the day.

    District 7 (Gray): Obama by 4200.  A good urban suburban mix.  Burton will need to convince those urban voters that his golf habit won’t prevent him from representing them.

    District 8 (Lavender): Obama by 3400.  This district is slight more Democratic than the old Eighth, since it picks up Monroe county. Blue Dog Ellsworth should have no trouble.

    District 9 (Cyan): Obama by 2600.  I would think that moderate Democrat Hill would have the advantage over the ultra conservative Pence, who may prefer to run in the Sixth, but Hill has never won by particularly large margins, so who knows.

    GE 2008, the Democratic pick up states: an exhaustive summary analysis

    Now that all 9 Democratic pick-up states plus NE-02 have been analysed, I have also provided an exhaustive and most unique non-partisan summary of the pick-up states. I can guarantee you that there is information in this summary that you will not find anywhere else in this quality, clarity or combination.

    There are a number of side-documents that go with the summary, plus links to all of the nine analyses and the GE 2008 final analysis for the entire Union.

    I want to explain again that I have farmed this kind of thing out to Google Docs as it makes it easier for me to publish charts, tables and graphics. It is my hope that you will read the summary in it’s entirety. There are surprises all over the place that only become apparent when one scratches under the surface and researches the GE 2008 at the county level, county for county. In the case of the 9.25 pick-ups, we are talking about 696 counties.

    The summary is divided into 2 parts and all of this information is after the jump.

    Part I of the summary contains:

    – links for the individual analyses for all the pick-up states plus the links for the GE 2008 analysis for the entire Union are given again. They will be reproduced at the bottom of this diary entry.

    – an overview of the raw vote and percentage totals for the pick-ups states, first for 2008 only and then a comparison to 2004.

    – three maps. One shows the geographic position of the pick-ups within the USA. The second shows the geographical relationship between the pick-ups and the Democratic retentions from 2004. The third shows the Democratic states from 2008 plus the 5 leanest GOP wins from 2008.

    – a question: “How does this compare on a historical level?”

    The question is referring to the number of electoral votes that changed parties in 2008, namely, 113 EV. I then provide a table showing each general election back to 1948 and how many electors changed parties, and in which direction. The answer to the question is that Obama’s EC shift is on par with the last election cycle, but less than in the 1980s.

    Afterward, there is an introduction to the county-level analysis, including an exact numeric count of counties per state: Democratic retentions, Democratic pick-ups, Republican retentions and Republican pick-ups.

    Quote:

    “In the pick-up states, the Democratic party retained 146 of 148 Democratic counties from 2004 and then picked-up an additional 89 counties, for a total of 235 counties (33.76%). The Republican party lost 89 counties from 2004, retaining 459 counties and then picked-up 2 counties, for a total of 461 (66.24%). 235 + 461 = 696 counties.”

    “Nationally, all 9 states trended Democratic as Obama won them and their electors according to the WTA (winner-takes-all) system, but when we look at the inner details, the picture is much clearer: 642 of 696 counties in the pick-up states (92.24%) swung Democratic. The remaining 54 counties (7.76%) swing Republican. This indicates a statistical grand sweep for the Democratic party in the pick-up states.

    In 4 states, the ENTIRE state trended Democratic: Colorado, New Mexico, Nevada (all three western pick-ups) and Indiana.The pick-up in Indiana is historic not only because this is the first time since 1964 that a Democrat has won the state, but it also had the largest partisan shift of all 50 states in the GE 2008: +21.71%

    The state with the largest contra-trend (Republican) against the national trend: Florida.”

    Part I ends with maps of Ohio, Virginia and North Carolina, showing the geographic position of the 28 counties that swung Republican, showing their proximity to Appalachia.

    You can link to Part I via Google Docs.

    Part II starts with an extensive study of the 39 largest counties out of the 9.25 pick-ups states, plus Durham County (NC) as honorable mention.

    Quote:

    “I have done a statistical analysis of the 39 largest counties of the 9.25 pick-ups. These are all counties that had a total vote of more than 170,000 and at least one candidate should have also gotten at least 100,000 of those votes or very,very close to it. All of those counties meet both criteria. Two counties (Stark County / OH, Washoe County / NV) had no candidate with 100,000 votes or more, but in both cases one candidate was very close to 100,000 and the countwide total vote was well over 170,000.  Those 39 counties accounted for 44.49% of the total popular vote of the pick-up states, which is actually slightly LESS than it was in 2004 for the same states: 44.91%. Nonetheless, when only 39 of 696 analysed counties (5.60%, numerically) have almost half the electoral firepower of the region, then it is statistically very clear that the large urban areas have the real electoral firepower in presidential elections. The candidate who sweeps the urban areas has a far better chance of winning the presidency.

    Of these 39 counties, there were 21 Democratic retentions, 8 Democratic pick-ups and 10 Republican retentions. This means that of the same 39 counties in 2004, the picture was much more even: in 2004, there were 21 Democratic counties of these 39 and 18 Republican counties.

    The Democratic party picked up Hillsborough (Tampa) and Pinellas (Clearwater) counties in Florida, Wake (Raleigh) county in North Carolina, Washoe (Reno) County in Nevada, Hamilton (Cincinnati) County in Ohio, Jefferson (Golden) and Arahapoe (Littleton) counties in Colorado and Douglas (Omaha) County in Nebraska.”

    The important thing about this study is it’s depth and breadth: each of the 39 (40) counties are analysed comparing 2008 to 2004, measuring raw vote and margin differences, also the counties’ percentual take of their respective states’ popular vote and also their take of the pick-up states combined. But the counties are also each given a spreadsheet to trace their voting history back to 1960 and the results are nothing less than amazing!

    Next, from the analysis in Part II:

    Superlatives:

    – the largest raw vote total of all 39 counties: Miami-Dade County, FL: 864,636 votes

    – the largest Democratic winning raw vote total: Miami-Dade County, FL: 499,831 votes

    – the largest Democratic raw-vote margin of the pick-ups: Cuyahoga County, OH (Cleveland): +258,542 vote margin

    – the three highest Democratic winning percentages: Denver- CO,  Boulder, CO and Cuyahoga- OH: 75.45%, 72.29% and 68.70%, respectively.

    – the three largest Democratic winning margins (by percent): Denver- CO,  Boulder- CO and Cuyahoga- OH: +52.41%, +46.14% and +38.74%, respectively

    – the highest democratic margin-shift (swing): Marion County, IN: +26.40% margin shift. This is especially impressive, as this shift was not from a pick-up, but rather, a Democratic retention county.

    – the largest Republican winning raw vote total: Duval County, FL: 210,537 votes

    – the largest Republican raw-vote margin of the pick-ups: El Paso County, CO: +51,419 vote margin

    – the three highest Republican winning percentages: Butler – OH, El Paso- Co and Lee- FL:  60.52%, 58.69% and 54.67%, respectively

    – the three largest Republican winning margins (by percent): Butler – OH, El Paso- CO and Brevard- FL: +22.58%, +18.82% and +10.37%, respectively

    – the lowest negative Republican margin-shift (swing): Brevard County, FL: -5.73% margin shift

    All of the Democratic retentions and pick-ups showed raw vote, percentual and margin GAINS.

    All of the Republican retentions showed percentual and margin LOSSES.

    4 of the Republican retentions showed raw-vote gains: Brevard, Lee, Polk and Pasco counties, all in Florida. The other 6 Republican retentions showed raw-vote losses.

    9 Republican or Democratic tipping-point (margin = less than 4%) counties from 2004 became solid Democratic wins in 2008: Pinellas, Volusia and Orange Counties-FL, Wake, Guilford and Mecklenburg Counties- NC, Montgomery and Stark Counties – OH, Arapahoe County- CO

    5 Republican retentions have become tipping point counties for 2012: Sarasota (+0.10%), Virginia Beach (+0.71%), Duval (+1.90), Seminole (+2.70%) and Pasco (+3.75%) . Statistically this means that 1/2 of the Republican retentions studied here are endangered territory for 2012 and (this has been proven historically many times over) in the case of a sucessful re-election campaign for the Democratic party in 2012, these five counties are the most likely candidates to become Democratic pick-ups in 2012.

    O Democratic retentions or pick-ups are tipping-point counties for 2012.

    Here is the EXCEL SPREADSHEET that has all of the raw calculations for the 39 (40) largest counties.

    In order to simplify the look of the table and make the information easier to see, I created a table to show the chronological progression of each county from 1960 to 2008. For each county and year, I have assigned either a D, R or an I, depending on which party won the county in that year. And then I have shaded each cell according to winning party. I then organized the table in order from CORE GOP counties to CORE DEM counties. Take a good, hard look at the table when you read Part II, it is most enlightening.

    You can link to Part II via Google Docs.

    Quotes:

    “In the case of some counties that visually look as if they should be core GOP counties there is instead the marking steady; these are GOP counties that should be core counties, but which almost flipped in 2008, so their status is now uncertain. And some Democratic counties are marked as steady as the margins are very lean.

    But the table makes it very easy to see which years are landslide years: 1972 and 1984, to a smaller extent 1992 and 2008. In 1972, we see a sea of red go through all counties except Lucas County, OH. In 1984, we see a sea of red go through all counties except the bottom 5. At the top we see 3 core GOP counties that also resisted the Johnson landslide of 1964. Notice that all three counties are in Florida.

    Starting in 1988, the Democratic party started re-building in the urban areas:

    3 counties were added to the Democratic column in 1988, resisting the GOP pull in that year: Boulder, Summit and Lucas counties. And those counties have become core DEM counties since then.

    8 counties joined the Democratic column in 1992 and have stayed there since then: Palm Beach, Broward, Volusia, Bernalillo, Franklin, Montgomery, Clark, Miami-Dade. They are mostly strong DEM counties, save for Montgomery and Volusia, which tend to go with leans margins. There are 4 more counties that joined the Democratic column in 1992, but were reclaimed by the GOP in either 1996 or 2000: Pasco, Wake, Stark, Guilford. Pasco returned to the GOP in 2004 and has stayed there. It is therefore the only county to complete buck the blue trend, in spite of reduced margins in 2008.

    Mecklenburg and Pinellas counties joined the Democratic column in 1996, were reclaimed by the GOP in 2000 or 2004 and were reclaimed by the Democratic party in 2004 or 2008.

    Fairfax joined the Democratic column in 2000 and has stayed there since, with ever increasing margins.

    Orange and Marion counties joined in 2004 and were retained in 2008. Both of these retentions had massive margin shifts toward the Democratic party in 2008: +18.41 and +26.40%, respectively.

    The 8 counties that Obama picked-up are clear to see in the middle of the table. Six of those counties have one thing in common: this is the first time they have gone Democratic since 1964, statistical evidence of a sweep similar to but not as extreme as Johnson in 1964: Hamilton, Douglas, Jefferson, Wake, Hillsborough and Pinellas counties were slightly smaller wins for the Democratic party than in 1964. However, Washoe and Arapahoe counties were larger wins for the Democratic party than in 1964, thus breaking a 44 year record. Notice that both of those counties are in the west.

    We can see clearly from the table that the last time a party had flipped 8 counties or more was in 1992, when Bill Clinton picked-up 12 counties. George W. Bush, Jr. picked up 3 counties in 2000 and 1 more in 2004. Those counties returned to the Democratic party in 2000 or 2004.

    In 1988- just analyzing these 40 counties- there were 8 Democratic counties and 32 Republican counties. In 1992, out of the same mix of 40 counties, there were 20 Republican counties and 20 Democratic counties, an even split. In 2000, there were 21 Republican counties and 19 Democratic counties. But in 2004, in spite of a republican re-election, the Democrats had 22 counties, the Republicans 18. And now in 2008, it’s 30 Democratic, 10 Republican. There can be no doubt about it: statistically, the urban areas in the Union have moved decisively to the Democratic party in 47 of 50 states (the evidence for which I will present before the end of 2009). This example from the 9.25 Democratic pick-ups is mild in comparison to the statistical data that came out of cities in core Democratic territory: Philadelphia (83% for Obama), Detroit (74% for Obama), New York (86% for Obama), Los Angeles (69% for Obama), Seattle (70% for Obama), Portland (77% for Obama) Chicago (76% for Obama), Boston (64% for Obama), Honolulu (70% for Obama), Milwaukee (67% for Obama), Madison (73% for Obama), New Orleans (79%), Baton Rouge, Dallas (deep in GOP territory: 57% for Obama), St. Louis (60% for Obama) etc, etc, etc.”

    Conclusion:

    “The Democratic wins in the pick-up states, as in the retentions, was not the example of the Democratic party barely holding on the to so-called “blue” states plus one “red” state or getting to one vote over 50%. The sweep through the pick-ups is statistically clear. The last time a sweep like this happened in the Republican party, it held the white house for 12 years. On the other hand, Johnson and Nixon had massive sweeps in 1964 and 1972 and in spite of this,the White House switched hands in the following cycles. So, though such a sweep is no forecast for the future, the data tells us quite clearly where the new battle lines will form in these nine states for the 2012 General Election. And both parties will be targeting key counties in key districts in 2010 in order to sway the affected area to their side before 2012 even gets off the ground.”

    ————————————————————–

    Here the links to the individual analyses, with a detailed description afterwards:

    Mid-west:

    OHIO – Part I, Part II, Part III , raw data / INDIANA – Part I, Part II and Part III, raw data

    IOWA – Part I, Part II, Part III, raw data / NEBRASKA CD-02 – raw data

    South:

    VIRGINIA – Part I, Part II, Part III, raw data / NORTH CAROLINA – Part I, Part II, Part III, raw data  

    FLORIDA – Part I, Part II, Part III, raw data

    West:  

    COLORADO – Part I , Part II , Part III , raw data, special 9-county 48-year voting history study

    Supplemental to Colorado: DEMOGRAPHIC and ECONOMIC profile of Colorado (p.4, hispanic population)

    NEW MEXICO – Part I, Part II, Part III, raw data, special 12 county 48-year voting history study   Supplemental to Nevada: DEMOGRAPHIC and ECONOMIC profile of New Mexico (p.4, hispanic population)  

    NEVADA – Part I, Part II , Part III, raw data, special 6 county 48-year voting history study  

    Supplemental to Nevada: DEMOGRAPHIC and ECONOMIC profile of Nevada (p.4, hispanic population)   Quick Census facts on Nevada  

    An analysis for NE-02 (which is the „.25″ part of „9.25″) will be published when I have received the complete precinct data for Douglas and (part of) Sarpy counties from election officials who are willing to dig up the data over 48 years for me. But a comparison 2008 to 2004 is already possible and here is the raw-data.

    Links to the large analysis for the entire Union

    Full analysis Part I

    Full analysis Part II  

    Full analysis Part III

    Full analysis Part IV  

    Full analysis Part V

    raw-vote total data  

    Obama’s standing in the national rankings since 1824  

    Obama’s standing in the rankings, per state

    Indiana Governor 2012: Roy Dominguez voices plans already

    Happened across this while skimming Blue Indiana.  Apparently, the Sheriff of Lake County, Roy Dominguez, announced when addressing a gathering of law school students his hopes to run for Governor of Indiana in 2012.

    http://www.blueindiana.net/dia…

    I’ll be the first to say I know absolutely nothing about Indiana, the distant gubernatorial race, or Dominguez.  I take that back…I know I’d like to see Evan Bayh swallowed and then spit out by an anaconda…but that’s all!  This guy may turn out to be a gadfly or for all I know he could turn out to be an underdog we can root for, I don’t know.

    What I do know is that the guy seems interesting:

    http://www.lakecountysheriff.c…

    He also didn’t fall flat on his face with his choice of venue.  He apparently tied the announcement in very nicely with the speech topic of overcoming racism and prejudice and following your dreams, so it sounds like the guy can weave a narrative and impress people:

    http://www.post-trib.com/news/…

    Also of interest, there’s polling out on the favorability ratings of Bayh and Lugar as well as Obama:

    http://www.blueindiana.net/dia…

    I’m surprised Obama has such high favorables to be honest, and if he can keep them at that level in 2012 then maybe there’s a chance we can drag some Dems into the governorship and Lugar’s seat if he retires.  It may be a little too early to think about this, but it’s out there so we might as well do so.  Personally, I’m hoping to hear from someone who can provide more information on this than me.

    In-depth county by county analysis of INDIANA

    Before I analyzed OHIO, I first did an intensive analysis of INDIANA, which you can find at Google Docs, in three parts:

    Part I

    Part II

    Part III

    Excel Document with all raw data.

    If you don’t have a gmail account, you probably don’t have access to the excel document, you can get it from me over email by writing to me here

    Rationale: Obama, who took the Hoosier state by a +1.03% margin, was the first democratic candidate to win this state since 1964. This means that two complete generations of citizens from Indiana had voted in the majority for the republican presidential candidate until 2008.

    A number of myths and angry retorts have gone around (mostly from the GOP and the extreme right) about what happened in INDIANA since election day, so I decided to do an exact analysis to get to the facts and to dispel myth and rumour. The results of this analysis are quite amazing.