Ohio, Part 2

By: Inoljt, http://thepolitikalblog.wordpr…

This is the second part of an analysis on the swing state Ohio.

Photobucket

Unlike Florida and Pennsylvania, Ohio cannot be easily divided into geographically distinct regions (although they do exist). Instead, I will be examining it through the lens of both partys’ strongholds in the state.

History

During the late eighteenth century Ohio was a consistently Republican state, the equivalent today of North Dakota or Arizona. Democrats often came close behind – four or five points – but never quite won the state until 1912. Their stronghold lay in a ring of rural counties populated by German immigrants (a pattern that has completely disappeared today). But this was never enough to overcome Republican strength everywhere else.

It was Franklin Roosevelt who changed this pattern forever. He laid the foundations of Ohio’s structural politics, which exist to this very day. Roosevelt brought in previously hostile working-class counties along the northeast section of the state. He also shifted most of Ohio’s northern cities to the Democratic side – which had previously leaned Republican.

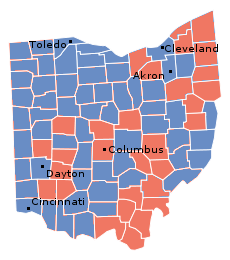
To see the effect, here is Roosevelt’s 2.85% victory in 1932:

Photobucket

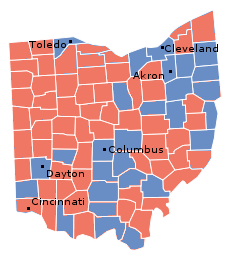
Here is his 4.4% victory eight years later:

Photobucket

The maps are practically inverses of each other – courtesy of the New Deal.


Democratic Ohio

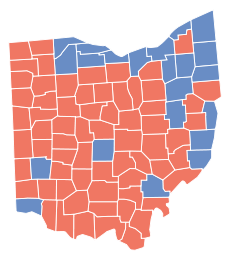
Today Roosevelt’s coalition remains, for the moment, intact; Democrats still dominate the union vote and northern cities. Because both populations reside along Ohio’s northern and eastern borders, Ohio’s Democratic results often form a blue “7.” The greater the Democratic margin of victory, the “fatter” and more defined the shape becomes.

For example, below the flip is Bill Clinton’s 1996 performance, in which he took the state by 6.4%.

PBI (Party Brand Index) Part 7: Ohio

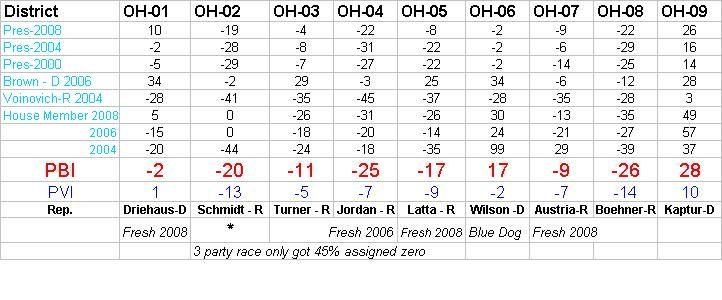
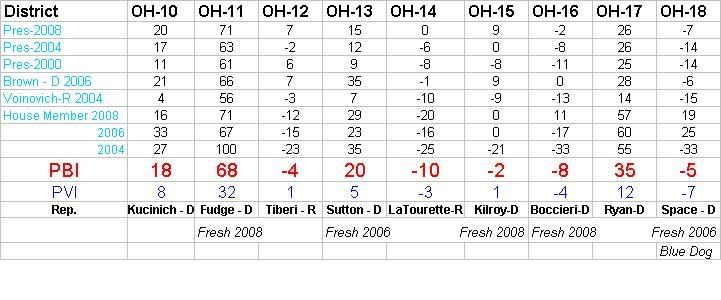
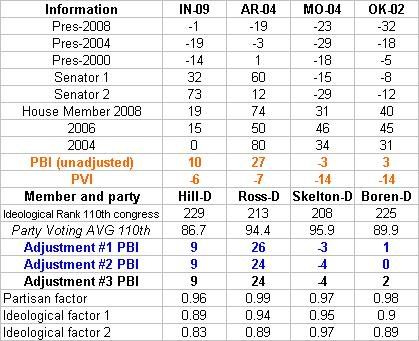
PBI or Party Brand Index is a concept I developed (with some much appreciated help from pl515) as a replacement for PVI.  PVI (Partisan Voting Index), which is measured by averaging the percentage of the vote from the last two presidential elections in each house district, and comparing it to the nation as a whole, is a useful shorthand for understanding the liberal v. conservative dynamics of a district. But PVI in my opinion it falls short in a number of areas. First it doesn’t explain states like Arkansas or West Virginia. These states have districts who’s PVIs indicates a Democrat shouldn’t win, yet Democrats (outside of the presidency) win quite handily. Secondly why is this the case in Arkansas but not Oklahoma with similar PVI rated districts?

Lastly PVI can miss trends as it takes 4 years to readjust. The purpose of Party Brand Index is to give a better idea of how a candidate does not relative to how the presidential candidate did, but compared to how their generic PARTY should be expected to perform. I’ve tackled IN, NC, CO, VA, MO, OK, AR, WV, and NH. Now I will look at the swing state of Ohio.

I had to take a break from my analysis for personal reasons, but I will try to return to my pattern of one diary a week. Like always I would like to post the data, then I will offer some analysis. My basic pattern is to work my way “out” from the “Purple States” to the more Blue and Red ones. (Although once in a while I like to skip my normal pattern of working out from purple states.  I’m often curious on how my model would work in states like that are deeply blue at the local level, but deeply red at the presidential level.) Let’s examine the swing state of Ohio, the first large state I have examined.

OHIO Part 1

OHIO Part 2

Based on the difference between PVI and PBI I will conjecture the following. Rep. Tiberi R-OH who according to PVI is in a D+1 District will continue to survive as PBI shows him to actually to have a 4% GOP edge in a house race. Representatives Driehaus (+1D PVI, – 2 PBI), Kilroy (+1D PVI, – 2 PBI), and  Boccieri (+4 R PVI, – 8 PBI) will be in for slightly tougher than expected races, while Rep. Space will win by a slightly larger than expected margin (+7 R PVI, – 5 PBI) My source for the election result data for Ohio is the Ohio Secretary of State.

One final note after I come across a few “conservative” Democrats, I run a “correction” factor to account for them being Blue Dogs. The general idea is that the distance they are able to maintain from the national party may help them win over voters who are more reluctant to vote for Democrats. I want to examine another swing state before I “recompute” Ohio’s Blue Dogs.

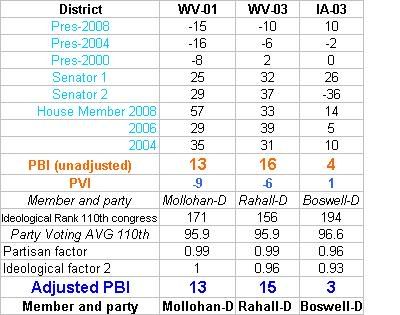
As a recap, here are the first “batch” of Blue Dogs, and rural Democrats (West Virginia’s Democrats aren’t members of the Blue Dogs) that I examined correcting for partisanship and ideology.

FOUR BLUE DOGS

THREE BLUE DOGS

As a reminder ranking a members ideology is a somewhat subjective decision. Potentially what’s one person “liberal” position, is another person “conservative” ones, remember the wingers developed a model that ranked the Sen. Obama as more liberal than Bernie Sanders or Russ Feingold. But partisanship, how often a member votes with their party is an absolute number. A Democrat who represents a “republican district” would be expected to “break with their party” on votes that don’t reflect their districts values.

I couldn’t find a website that ranks all the districts based on their PVI (I only could find list of them by state not rank, help please anyone), therefor I substituted a PVI ranking with where each member ranked in the Democratic caucus. In the 110th Congress the average Democrat had an ideological ranking of 170 (by the way this is a result of several members being tied, this is the medium not the midpoint). The average of members towards the center was 191, former Daily Kos celeb Ciro Rodriguez fell at exactly 191. The average of members towards the liberal side was 121, which falls between Rep. Larson of Conn. and Rep. Eshoo of CA. As or partisanship in the 110th Congress the average Democrat voted with their party 92.3% of the time.

As a clarification in Adjustment #1, I used a deviation factor based on how far each member was from the center of the Democratic caucus. Adjustment #2 was based on how far each member was from outside the standard deviation of the caucus. In Adjustment #3 I removed the partisanship factor to see what effect it would have. As I explained a few diaries ago I will use ADJUSTMENT FACTOR 2 in all subsequent corrections.

Because there are “only” 50 states (as opposed to evaluating 435 house members), I will at a later date have all the states ranked by PVI so I can adjust the Senator’s rankings. I developed Senate factors for the four states the four blue dogs came from. In the interest of full disclosure, my source for ideological rankings is Voteview, and for partisanship it was the Washington Post. This is still a work in progress, I’m making adjustments, and continuing to crunch numbers for more states. I also will use the adjustment factor on a liberal member of congress to see what effect that will have.

Anthology

PBI (Party Brand Index) Part 6 WV and NH

PBI (Party Brand Index) Part 5 Nevada and Iowa

PBI (part 4) MO, AR, OK

Party Brand Index (part 3) North Carolina

Party Brand Index (part 2) Colorado and Virginia (updated)

Introducing PBI, Party Brand Index (Updated)

Ohio, Part 1

By: Inoljt, http://thepolitikalblog.wordpr…

Is Ohio a liberal place? Or is it a conservative place?

I suspect far more people would say the latter rather than the former.

In many respects, Ohio is politically similar to Florida. Both are well-known swing states that hold a bountiful electoral prize. Both lean Republican. Both have large cites that function as pools of Democratic votes. Both also have considerable rural, Republican regions.

But in other ways they could not be more different. Sunny Florida is diverse, growing, and service-oriented. While Florida often votes Republican, it is not exactly conservative. Cold, northern Ohio is a rust-belt giant. It is not very diverse. It is definitely not growing. Florida is new. Ohio is old and conservative.

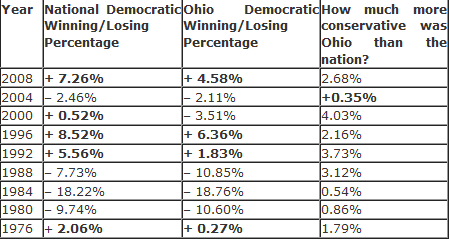
For the moment Ohio is a bit more conservative than the country at large. For the past eight out of nine presidential elections, it has been a bit redder than the nation. Not much redder, but enough to be noticeable.

Photobucket

I do not think that the future looks bright for the Democratic Party in Ohio. The two are moving in opposite directions. Demographically, Ohio is staying static while the country at large changes. And there are not many truly liberal spots in Ohio – places like Boulder, CO or Seattle. There never were.

Ohio has a lot of unionized, working-class folk who are still voting against Herbert Hoover; they are a core part of its Democratic base. I am not sure how long they will continue to support a party that is becoming, quite frankly, fairly upper-class in ethos. People in West Virginia certainly don’t anymore.

Not that Ohio is doomed to become a Republican stronghold. Places like Columbus are rapidly turning blue, perhaps fast enough to offset losses in working-class counties. And it isn’t inevitable that those counties will start voting Republican. If West Virginia is a prime example of working-class voters who deserted the Democratic Party, Michigan is a prime example of working-class voters that still support it. Barack Obama won a landslide in that state.

Nevertheless, my gut still tells me that Ohio and the Democratic Party are shifting farther and farther away from each other. These things can reveal themselves very quickly in politics. In 1988, California was a red state that had voted Republican for six elections in a row. Then one day it was won by Bill Clinton – and it has never gone back since then. In 1996 West Virginia had gone blue for five out of the past six elections. Then George Bush won the state – and now we consider it a rock-hard Republican state.

That may be the fate of Ohio.

OH-Sen, KY-Sen: Democratic Senate Candidates Appeal to the Progressive Netroots

With the 2010 Senate races in Ohio and Kentucky featuring two of the most competitive Democratic primaries of the cycle, in two of the key Senate battleground states, Senate Guru contacted the Democratic primaries’ major candidates – in Ohio, Lieutenant Governor Lee Fisher and Ohio Secretary of State Jennifer Brunner; in Kentucky, Lieutenant Governor Dan Mongiardo and state Attorney General Jack Conway – to ask them all one question:

Why should the progressive netroots support your campaign in you state’s 2010 Democratic Senate primary?

To see the Ohio candidates’ responses side-by-side, click here.  To see the Kentucky candidates’ responses side-by-side, click here.

On the web:

Senate Guru

Senate Guru Facebook Group

Redistricting Ohio (now with maps!)

This is my first diary, so please excuse my formatting and other technical ineptitudes.  I have maps, so if someone can tell me in the comments how to add them, I will add them.

I wanted to gerrymander Ohio (using Dave’s Redistricting App) for the likely 16 districts it will have after the 2010 census with the following goals in mind:

1) Make sure Republicans lose both seats lost to redistricting

2) Create(or maintain) strong Democratic districts in Southern Ohio in Cincinnati and Dayton

3) Eliminate Steve Latourette

4) Keep Ohio’s major cities and counties as intact as possible.

With that in mind, the following gerrymander would potentially create a 12-4 democratic split in Ohio (maybe even 13-3).

SW ohio

Southwest Ohio

District 1 (Royal Blue)- Steve Driehaus should love this new district as it now falls completely within Hamilton County and excludes the parts of more conservative Butler county were harder for him to win.  Although his home actually falls just outside of the district boundaries as drawn, the map could be tweaked to include his home while still strengthening the Democratic lean.

District 2 (Forest Green)- This district now becomes a suburban Cincinnati district, including Warren and Butler counties and parts of Hamilton and Clermont.  Although it is regionally much more compact, this district should still be one of three slam dunk Republican districts.

District 3 (Purple)- The new shape of this district should help to swing it to the Democratic column.  Including all of the urban parts of Montgomery County (Dayton), the suburban parts of Greene county, and Springfield in Clark county, Mike Turner’s days would be numbered.

District 4 (Red)- Another slam dunk Republican district that packs as many uber-red counties into one seat.  Now stretches from the Indiana border all the way through Holmes and Knox counties in east-central Ohio.  Would be even safer for Jim Jordan

NW ohio

Northwest Ohio

District 5 (Yellow)- This is where things start to get interesting.  This is Bob Latta’s district, and it still should stay Republican, but almost by accident, I have made this district significantly more swingy.  Giving its far western counties to the 9th in exchange for Sandusky county and big chunks of Lorain county (including Oberlin and Elyria) a moderate populist Democrat could surely compete here.  I haven’t yet figured out how to calculate the PVI of this new district…definitely closer to a toss-up than a Republican slam dunk.

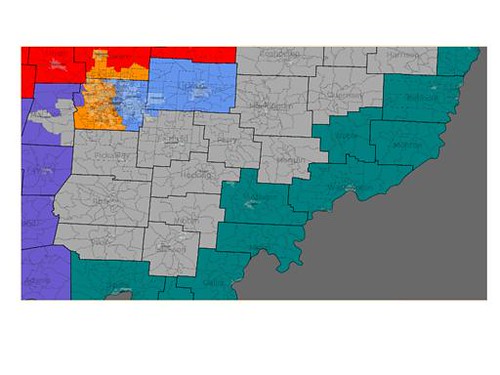
District 6 (Teal Blue)- This district did not change very much for Charlie Wilson except that it had to get bigger because of the loss of seats statewide.  Adding in the rest of Athens county and Scioto county (Democratic areas) and a bit of Portage county (Republican) should basically leave the district with little change.

SE ohio

Southeast Ohio

District 7 (Grey)- This massive district in central and southern eastern Ohio is really a combination of the old 7th and 18th.  Because it still includes most of Zach Space’s old district (Tuscarawas, Muskingum, and Ross counties) as well as the Columbus exurbs, this should be a Democratic hold, although not being able to strengthen Zach Space is definitely one of the weaknesses of this map.

District 8 (Lavender) Just to screw with John Boehner, this district became the catch-all Southern Ohio republican district.  Still a deep shade of red, this district now stretches from the Indiana border all the way to Columbus and down to the Ohio River.  Making Boehner campaign in 3 media markets (Cincinnati, Columbus, and Dayton) sure would be fun, although this seat is just as safe as his old one.

District 9 (Aqua Blue) In the first of three pissed of Democratic incumbents, Marcy Kaptur probably would not love these changes to her district, although it really does not weaken her Democratic strength too much.  Having her pick up the four rural northwest Ohio counties while giving parts of Lorain and Sandusky county to the fifth should allow her to still cruise based on the strength of her base in Lucas county, while giving Democrats a legitimate change to knock of Bob Latta.

NE ohio

Northeast Ohio

District 10 (Hot Pink) Some big changes to Kucinich’s district, although it will remain heavily democratic.  In exchange for giving up a bit of his inner city west side of Cleveland territory, Dennis picks up the city of Lorain and the northern part of Elyria in Lorain county.  This district makes much more sense than the current lines which have this part of Lorain County lumped in with much more distant Akron (Betty Sutton’s district).  Should remain reliably Democratic (if this is what you can call Dennis).

District 11 (Lime Green) This district doesn’t change too much, although it had to get bigger to account for the loss of population in some of these Cleveland suburbs.  This district grows a bit further into the west side of Cleveland (to keep it majority-African American) and quite a bit into the eastern suburbs of Cuyahoga and Geauga county.  Steven Latourette would now live in this district, although he would have no chance to win it.

District 12 (Powder Blue) The first of the Columbus districts, these lines were changed to take out Delaware county in exchange for the rest of Licking and the rest of Southern Franklin county.  This district will remain a swing district, possibly with a slight Republican lean.  Hopefully it would give a strong Democratic candidate a chance to knock of Tiberi.

District 13 (Light Pink) In what could be pissed off incumbent Democrat number two, Betty Sutton’s district gets a major facelift, giving up parts of Lorain and Media counties in exchange for all of Summit county and some of the Republican parts of Geauga and Portage counties.  Since she lives outside Akron and has her base in Summit county, this should allow her to still get reelected easily, even though the district becomes slightly more Republican.  Should still be an easy Democratic hold.

District 14 (Olive Green) This district becomes the battle royale between the old 17th and 14th.  Because it includes all of Trumbull county and the city of Youngstown in Mahoning, Ryan should easily be able to end Steve Latourette’s political career (not a moment too soon!)  Including the Northeast corner of the state including swingy Lake county, Ryan could really build a political base for a future statewide run from this district.

District 15 (Orange) This district should hopefully strengthen Mary Jo Kilroy by giving her larger portions of Franklin county and the suburban areas of Delaware county.  Losing Union and Madison counties takes the most heavily Republican areas out of this district.

District 16 (Bright Green)  This district doesn’t change much, but the minor changes should help to strengthen John Boccieri.  The district gives up Republican Ashland county while picking up Kent in Portage County (university town) and the Cleveland suburbs in northern Medina county.

Rust Belt Redistricting Musings

The following are my thoughts on redistricting each of the Midwestern states-from Iowa and Missouri to Western Pennsylvania. I think in general, things look good for Dems right now, with the exceptions of Indiana and Missouri. But read on and tell me what you think.

In alphabetical order

Iowa

I think that in some ways, Iowa is the most predictable state because of the way they redraw their lines. You know that there will be a Democratic leaning 1st District in the northeast, a stronger Democratic 2nd in the southeast part, a Polk County/Des Moines based 3rd, and Steve King’s wingnut friendly 4th in the Western part of the state.

Indiana

With the GOP likely to run remap here, the consensus is that they’ll target Baron Hill by stripping him of Bloomington. I think that’s potentially dangerous, as neither Buyer or Burton are good campaigners. Furthermore, I think Baron Hill would be a great candidate for Governor, so the Indiana GOP better be careful what it wishes for……

Illinois

Two thoughts: if Kirk runs for Senate and we win his 10th (or if we win it outright), I’m guessing the ultimate target would be Judy Biggert, who’s older and less politically talented than Roskam. The best bet might be to pair them together in an ultra GOP DuPage based district and use the Dem leftovers with parts of say, the 9th to create a new Dem district.

Now my evil little thought: I wonder if we could create a Democratic leaning monstrosity with the most Democratic friendly parts of Rockford, Peoria, Champaign/Urbana, and Springfield. Yeah it’d be ugly, but so is Phil Hare’s 17th…..

Michigan

In Michigan, if Dems run remap, there are several ways to go with it. My guess is that they would draw Thad McCotter into an Ann Arbor based district that he couldn’t win-that’s by far the easiest. I also think they’ll. The other thing they should do is draw a Lansing based Democratic District drawn for Virg Bernero and give the GOP parts of the 8th to Candice Miller and pack all of the GOP’s Southeast strongholds into a single district. I suppose there’s also the outside possibility of a Dem Western district that combines the city of Grand Rapids with some of the Dem leaning counties on Lake Michigan, but I’m not sure Vern Ehlers wouldn’t win that anyways….

Minnesota

Regardless of whether the state ends up with 7 or 8 CDs, the objective of Minnesota’s redistricting plan (if Dems control, and I think they will) will be to get rid of Michele Bachmann. The only difference being how you do it. If there are 8 CDs, you simply draw a 6th that is is close to even and friendly to State Senator Tarryl Clark. If there are 7, slam her into an uber-GOP (Sherburne, Wright, Carver,Scott and the most GOP friendly parts of Dakota, Anoka, and Hennepin)  district with John Kline.

The big question here in either case is whether the DFL goes after the 3rd by swapping some of the more Democratic suburbs like St. Louis Park and Hopkins for GOP friendly stuff like Edina.

Missouri

Dems have to pray that Missouri holds onto its 9th CD so they can simply play incumbent protection and draw a more friendly 4th CD along the I-70 corridor from KC to Boone County. If Missouri goes to 8, I’m almost certain that Skelton’s district is toast.

Ohio

If Dems control redistricting and Ohio loses 2 seats, here’s some possibilities

-The basic premise is to pack the GOPers into 4 ultra GOP districts: the 4th, 5th, 7th and 8th while creating a Dem Dayton district, cracking the 14th into 3, and the 2nd into 3 parts plus creating a Democratic leaning mashup of the 18th and 12th designed for Zack Space.

-Create a Democratic 3rd by combining Montgomery County with Oxford and the most Dem friendly turf you can find in Greene.

-Eliminate Jean Schmidt’s 2nd with the Dem parts of Hamilton going to the 1st, the GOP suburban stuff splitting between the 7th and 8th CDs and the Dem leaning Ohio River Counties into the 6th.

-Drop the GOP parts of the 15th into the 4th, 5th, and 7th and pick up Dem friendly turf in Franklin. However be careful because….

-To protect Zack Space, try and take what’s left of Franklin and mate it to the friendliest portions of the 18th while dropping as much of the GOP stuff into the 7th as possible.

-Finally, crack Steve LaTourette’s 14th into 3 between Marcia Fudge’s 10th (as much of Geauga  as you can get away with), Tim Ryan’s new district (which would be something like half of Lake and what’s left of Geauga, Astabula, Trumbull and the most Dem parts of Mahoning with some Dem strength going to Boccieri in the 16th), Finally, put the other half of Lake into Kucinich’s 10th by connecting it along Lake Erie.

Pennsylvania

As I remarked in another diary, Tim Murphy is almost certainly toast because the map is likely to be redrawn by a judge due to the split in the state legislature. Flat out, there is no way that any sane judge would draw something similar to Murphy’s one step short of fictitious 18th CD that he has now. He’ll either wind up running against Murtha (and will lose) or will end up in something similar to Frank Mascara’s old 20th (which he’d lose as well).

Wisconsin

I think the best target for Wisconsin Dems, should they control the trifecta, would be to go after Paul Ryan rather than Tom Petri-its much easier to play mix and match with the heavily Democratic 2nd and 4th than it is with Petri’s 6th. Ryan’s also waaaay to conservative for his district as it is, and Petri is something of an institution in his district anyways, even if on paper it is slightly more Democratic.

GE 2008, the Democratic pick up states: an exhaustive summary analysis

Now that all 9 Democratic pick-up states plus NE-02 have been analysed, I have also provided an exhaustive and most unique non-partisan summary of the pick-up states. I can guarantee you that there is information in this summary that you will not find anywhere else in this quality, clarity or combination.

There are a number of side-documents that go with the summary, plus links to all of the nine analyses and the GE 2008 final analysis for the entire Union.

I want to explain again that I have farmed this kind of thing out to Google Docs as it makes it easier for me to publish charts, tables and graphics. It is my hope that you will read the summary in it’s entirety. There are surprises all over the place that only become apparent when one scratches under the surface and researches the GE 2008 at the county level, county for county. In the case of the 9.25 pick-ups, we are talking about 696 counties.

The summary is divided into 2 parts and all of this information is after the jump.

Part I of the summary contains:

– links for the individual analyses for all the pick-up states plus the links for the GE 2008 analysis for the entire Union are given again. They will be reproduced at the bottom of this diary entry.

– an overview of the raw vote and percentage totals for the pick-ups states, first for 2008 only and then a comparison to 2004.

– three maps. One shows the geographic position of the pick-ups within the USA. The second shows the geographical relationship between the pick-ups and the Democratic retentions from 2004. The third shows the Democratic states from 2008 plus the 5 leanest GOP wins from 2008.

– a question: “How does this compare on a historical level?”

The question is referring to the number of electoral votes that changed parties in 2008, namely, 113 EV. I then provide a table showing each general election back to 1948 and how many electors changed parties, and in which direction. The answer to the question is that Obama’s EC shift is on par with the last election cycle, but less than in the 1980s.

Afterward, there is an introduction to the county-level analysis, including an exact numeric count of counties per state: Democratic retentions, Democratic pick-ups, Republican retentions and Republican pick-ups.

Quote:

“In the pick-up states, the Democratic party retained 146 of 148 Democratic counties from 2004 and then picked-up an additional 89 counties, for a total of 235 counties (33.76%). The Republican party lost 89 counties from 2004, retaining 459 counties and then picked-up 2 counties, for a total of 461 (66.24%). 235 + 461 = 696 counties.”

“Nationally, all 9 states trended Democratic as Obama won them and their electors according to the WTA (winner-takes-all) system, but when we look at the inner details, the picture is much clearer: 642 of 696 counties in the pick-up states (92.24%) swung Democratic. The remaining 54 counties (7.76%) swing Republican. This indicates a statistical grand sweep for the Democratic party in the pick-up states.

In 4 states, the ENTIRE state trended Democratic: Colorado, New Mexico, Nevada (all three western pick-ups) and Indiana.The pick-up in Indiana is historic not only because this is the first time since 1964 that a Democrat has won the state, but it also had the largest partisan shift of all 50 states in the GE 2008: +21.71%

The state with the largest contra-trend (Republican) against the national trend: Florida.”

Part I ends with maps of Ohio, Virginia and North Carolina, showing the geographic position of the 28 counties that swung Republican, showing their proximity to Appalachia.

You can link to Part I via Google Docs.

Part II starts with an extensive study of the 39 largest counties out of the 9.25 pick-ups states, plus Durham County (NC) as honorable mention.

Quote:

“I have done a statistical analysis of the 39 largest counties of the 9.25 pick-ups. These are all counties that had a total vote of more than 170,000 and at least one candidate should have also gotten at least 100,000 of those votes or very,very close to it. All of those counties meet both criteria. Two counties (Stark County / OH, Washoe County / NV) had no candidate with 100,000 votes or more, but in both cases one candidate was very close to 100,000 and the countwide total vote was well over 170,000.  Those 39 counties accounted for 44.49% of the total popular vote of the pick-up states, which is actually slightly LESS than it was in 2004 for the same states: 44.91%. Nonetheless, when only 39 of 696 analysed counties (5.60%, numerically) have almost half the electoral firepower of the region, then it is statistically very clear that the large urban areas have the real electoral firepower in presidential elections. The candidate who sweeps the urban areas has a far better chance of winning the presidency.

Of these 39 counties, there were 21 Democratic retentions, 8 Democratic pick-ups and 10 Republican retentions. This means that of the same 39 counties in 2004, the picture was much more even: in 2004, there were 21 Democratic counties of these 39 and 18 Republican counties.

The Democratic party picked up Hillsborough (Tampa) and Pinellas (Clearwater) counties in Florida, Wake (Raleigh) county in North Carolina, Washoe (Reno) County in Nevada, Hamilton (Cincinnati) County in Ohio, Jefferson (Golden) and Arahapoe (Littleton) counties in Colorado and Douglas (Omaha) County in Nebraska.”

The important thing about this study is it’s depth and breadth: each of the 39 (40) counties are analysed comparing 2008 to 2004, measuring raw vote and margin differences, also the counties’ percentual take of their respective states’ popular vote and also their take of the pick-up states combined. But the counties are also each given a spreadsheet to trace their voting history back to 1960 and the results are nothing less than amazing!

Next, from the analysis in Part II:

Superlatives:

– the largest raw vote total of all 39 counties: Miami-Dade County, FL: 864,636 votes

– the largest Democratic winning raw vote total: Miami-Dade County, FL: 499,831 votes

– the largest Democratic raw-vote margin of the pick-ups: Cuyahoga County, OH (Cleveland): +258,542 vote margin

– the three highest Democratic winning percentages: Denver- CO,  Boulder, CO and Cuyahoga- OH: 75.45%, 72.29% and 68.70%, respectively.

– the three largest Democratic winning margins (by percent): Denver- CO,  Boulder- CO and Cuyahoga- OH: +52.41%, +46.14% and +38.74%, respectively

– the highest democratic margin-shift (swing): Marion County, IN: +26.40% margin shift. This is especially impressive, as this shift was not from a pick-up, but rather, a Democratic retention county.

– the largest Republican winning raw vote total: Duval County, FL: 210,537 votes

– the largest Republican raw-vote margin of the pick-ups: El Paso County, CO: +51,419 vote margin

– the three highest Republican winning percentages: Butler – OH, El Paso- Co and Lee- FL:  60.52%, 58.69% and 54.67%, respectively

– the three largest Republican winning margins (by percent): Butler – OH, El Paso- CO and Brevard- FL: +22.58%, +18.82% and +10.37%, respectively

– the lowest negative Republican margin-shift (swing): Brevard County, FL: -5.73% margin shift

All of the Democratic retentions and pick-ups showed raw vote, percentual and margin GAINS.

All of the Republican retentions showed percentual and margin LOSSES.

4 of the Republican retentions showed raw-vote gains: Brevard, Lee, Polk and Pasco counties, all in Florida. The other 6 Republican retentions showed raw-vote losses.

9 Republican or Democratic tipping-point (margin = less than 4%) counties from 2004 became solid Democratic wins in 2008: Pinellas, Volusia and Orange Counties-FL, Wake, Guilford and Mecklenburg Counties- NC, Montgomery and Stark Counties – OH, Arapahoe County- CO

5 Republican retentions have become tipping point counties for 2012: Sarasota (+0.10%), Virginia Beach (+0.71%), Duval (+1.90), Seminole (+2.70%) and Pasco (+3.75%) . Statistically this means that 1/2 of the Republican retentions studied here are endangered territory for 2012 and (this has been proven historically many times over) in the case of a sucessful re-election campaign for the Democratic party in 2012, these five counties are the most likely candidates to become Democratic pick-ups in 2012.

O Democratic retentions or pick-ups are tipping-point counties for 2012.

Here is the EXCEL SPREADSHEET that has all of the raw calculations for the 39 (40) largest counties.

In order to simplify the look of the table and make the information easier to see, I created a table to show the chronological progression of each county from 1960 to 2008. For each county and year, I have assigned either a D, R or an I, depending on which party won the county in that year. And then I have shaded each cell according to winning party. I then organized the table in order from CORE GOP counties to CORE DEM counties. Take a good, hard look at the table when you read Part II, it is most enlightening.

You can link to Part II via Google Docs.

Quotes:

“In the case of some counties that visually look as if they should be core GOP counties there is instead the marking steady; these are GOP counties that should be core counties, but which almost flipped in 2008, so their status is now uncertain. And some Democratic counties are marked as steady as the margins are very lean.

But the table makes it very easy to see which years are landslide years: 1972 and 1984, to a smaller extent 1992 and 2008. In 1972, we see a sea of red go through all counties except Lucas County, OH. In 1984, we see a sea of red go through all counties except the bottom 5. At the top we see 3 core GOP counties that also resisted the Johnson landslide of 1964. Notice that all three counties are in Florida.

Starting in 1988, the Democratic party started re-building in the urban areas:

3 counties were added to the Democratic column in 1988, resisting the GOP pull in that year: Boulder, Summit and Lucas counties. And those counties have become core DEM counties since then.

8 counties joined the Democratic column in 1992 and have stayed there since then: Palm Beach, Broward, Volusia, Bernalillo, Franklin, Montgomery, Clark, Miami-Dade. They are mostly strong DEM counties, save for Montgomery and Volusia, which tend to go with leans margins. There are 4 more counties that joined the Democratic column in 1992, but were reclaimed by the GOP in either 1996 or 2000: Pasco, Wake, Stark, Guilford. Pasco returned to the GOP in 2004 and has stayed there. It is therefore the only county to complete buck the blue trend, in spite of reduced margins in 2008.

Mecklenburg and Pinellas counties joined the Democratic column in 1996, were reclaimed by the GOP in 2000 or 2004 and were reclaimed by the Democratic party in 2004 or 2008.

Fairfax joined the Democratic column in 2000 and has stayed there since, with ever increasing margins.

Orange and Marion counties joined in 2004 and were retained in 2008. Both of these retentions had massive margin shifts toward the Democratic party in 2008: +18.41 and +26.40%, respectively.

The 8 counties that Obama picked-up are clear to see in the middle of the table. Six of those counties have one thing in common: this is the first time they have gone Democratic since 1964, statistical evidence of a sweep similar to but not as extreme as Johnson in 1964: Hamilton, Douglas, Jefferson, Wake, Hillsborough and Pinellas counties were slightly smaller wins for the Democratic party than in 1964. However, Washoe and Arapahoe counties were larger wins for the Democratic party than in 1964, thus breaking a 44 year record. Notice that both of those counties are in the west.

We can see clearly from the table that the last time a party had flipped 8 counties or more was in 1992, when Bill Clinton picked-up 12 counties. George W. Bush, Jr. picked up 3 counties in 2000 and 1 more in 2004. Those counties returned to the Democratic party in 2000 or 2004.

In 1988- just analyzing these 40 counties- there were 8 Democratic counties and 32 Republican counties. In 1992, out of the same mix of 40 counties, there were 20 Republican counties and 20 Democratic counties, an even split. In 2000, there were 21 Republican counties and 19 Democratic counties. But in 2004, in spite of a republican re-election, the Democrats had 22 counties, the Republicans 18. And now in 2008, it’s 30 Democratic, 10 Republican. There can be no doubt about it: statistically, the urban areas in the Union have moved decisively to the Democratic party in 47 of 50 states (the evidence for which I will present before the end of 2009). This example from the 9.25 Democratic pick-ups is mild in comparison to the statistical data that came out of cities in core Democratic territory: Philadelphia (83% for Obama), Detroit (74% for Obama), New York (86% for Obama), Los Angeles (69% for Obama), Seattle (70% for Obama), Portland (77% for Obama) Chicago (76% for Obama), Boston (64% for Obama), Honolulu (70% for Obama), Milwaukee (67% for Obama), Madison (73% for Obama), New Orleans (79%), Baton Rouge, Dallas (deep in GOP territory: 57% for Obama), St. Louis (60% for Obama) etc, etc, etc.”

Conclusion:

“The Democratic wins in the pick-up states, as in the retentions, was not the example of the Democratic party barely holding on the to so-called “blue” states plus one “red” state or getting to one vote over 50%. The sweep through the pick-ups is statistically clear. The last time a sweep like this happened in the Republican party, it held the white house for 12 years. On the other hand, Johnson and Nixon had massive sweeps in 1964 and 1972 and in spite of this,the White House switched hands in the following cycles. So, though such a sweep is no forecast for the future, the data tells us quite clearly where the new battle lines will form in these nine states for the 2012 General Election. And both parties will be targeting key counties in key districts in 2010 in order to sway the affected area to their side before 2012 even gets off the ground.”

————————————————————–

Here the links to the individual analyses, with a detailed description afterwards:

Mid-west:

OHIO – Part I, Part II, Part III , raw data / INDIANA – Part I, Part II and Part III, raw data

IOWA – Part I, Part II, Part III, raw data / NEBRASKA CD-02 – raw data

South:

VIRGINIA – Part I, Part II, Part III, raw data / NORTH CAROLINA – Part I, Part II, Part III, raw data  

FLORIDA – Part I, Part II, Part III, raw data

West:  

COLORADO – Part I , Part II , Part III , raw data, special 9-county 48-year voting history study

Supplemental to Colorado: DEMOGRAPHIC and ECONOMIC profile of Colorado (p.4, hispanic population)

NEW MEXICO – Part I, Part II, Part III, raw data, special 12 county 48-year voting history study   Supplemental to Nevada: DEMOGRAPHIC and ECONOMIC profile of New Mexico (p.4, hispanic population)  

NEVADA – Part I, Part II , Part III, raw data, special 6 county 48-year voting history study  

Supplemental to Nevada: DEMOGRAPHIC and ECONOMIC profile of Nevada (p.4, hispanic population)   Quick Census facts on Nevada  

An analysis for NE-02 (which is the „.25″ part of „9.25″) will be published when I have received the complete precinct data for Douglas and (part of) Sarpy counties from election officials who are willing to dig up the data over 48 years for me. But a comparison 2008 to 2004 is already possible and here is the raw-data.

Links to the large analysis for the entire Union

Full analysis Part I

Full analysis Part II  

Full analysis Part III

Full analysis Part IV  

Full analysis Part V

raw-vote total data  

Obama’s standing in the national rankings since 1824  

Obama’s standing in the rankings, per state
SSP Daily Digest: 4/24

NY-20 (pdf): Last evening’s total from the BoE had Scott Murphy leading Jim Tedisco by 401. With his chances approaching the “statistically impossible” realm, we may reportedly see a Tedisco concession today.

MN-Sen: Norm Coleman could take a few pointers from Jim Tedisco. The five justices of the Minnesota Supreme Court who’ll hear the election contest (two justices who’ve been actively involved in the count recused themselves) announced that their expedited hearing isn’t all that expedited: it’ll happen on June 1, to give the parties adequate time to file briefs and replies. In the meantime, that gives Minnesotans more than one more month with just one senator.

GA-Gov, GA-03: Just one day after his name was suddenly floated for GA-Gov, Rep. Lynn Westmoreland flushed that idea, saying he’ll stay in the House.

PA-Gov: Allegheny County Executive Dan Onorato was bandied about as the early front-runner for the Democratic nomination for the open governor’s race in 2010, but we’ve heard nary a peep from him on the matter. Apparently, he is in fact interested, as he says he’s “laying the groundwork” and expects a formal announcement later in the year.

TN-Gov: Businessman Mike McWherter made official his candidacy for the Democratic nod in the open Tennessee governor’s race. McWherter hasn’t held elective office, but benefits strongly from links with his father, popular ex-governor Ned McWherter.

SC-Gov: Lawyer Mullins McLeod (and apparent scion of a political family, although one that pales in comparison to the Thurmonds or Campbells) announced his bid for the Democratic nomination in the open governor’s race. He joins two Democratic state senators Vincent Shaheen and Robert Ford in the chase.

CA-10: Assemblywoman Joan Buchanan, who previously issued an internal poll showing her leading senator Mark DeSaulnier, has officially jumped into the special election field. With Lt. Gov. John Garamendi’s entry into the race, splitting the white-guy vote, Buchanan probably feels that her hand has been strengthened.

CO-03: Rep. John Salazar has drawn a solid Republican challenger in this R+5 district: Martin Beeson, who’s the district attorney for Pitkin, Garfield, and Rio Blanco Counties. Blue Dog Salazar has had little trouble with re-election despite the district’s lean.

CA-36: Jane Harman’s high-profile role in the still-unfolding wiretap scandal has liberal activists in the 36th, long frustrated by Harman’s hold on this D+12 district, wondering if they finally have an opening to defeat her in a primary. Marcy Winograd, who won 38% against Harman in 2006, has been urged to run again and is “thinking about it.”

MI-07: For real? Republicans in DC (read: the NRCC) are telling MLive.com’s Susan J. Demas that their top choice to take on frosh Dem Mark Schauer is none other than… ex-Rep. Joe Schwarz, who was ingloriously defeated in a 2006 primary by wingnut Tim Walberg. Schwarz, who went so far as to endorse Schauer over Walberg last fall, tells Demas that he’s not interested in running again. (J)

NH-02: Democratic New Hampshire State Rep. John DeJoie has formed an exploratory committee for the seat Paul Hodes is leaving open. (D)

KS-04: Democrats have their first candidate in the open seat in the 4th: Robert Tillman, a retired court services officer, and former precinct committeeman and NAACP local board member. There’s more firepower on the GOP side of the aisle in this now-R+14 district, including RNC member Mike Pompeo and state senator Dick Kelsey.

Redistricting: Republican Ohio state senator John Husted (who will probably be the GOP’s candidate for SoS in 2010) has introduced legislation that would totally change the way redistricting is done in Ohio. It would create a 7-member bipartisan commission that would draw both congressional and state district lines (removing congressional district authority from the legislature, and legislative district authority from the 5-member panel that Dems currently control). It remains to be seen, though, whether this proposal would make it past the Democratic governor and state house.

Nostalgia: Yahoo is shutting down the venerable Geocities. What ever will former Louisiana senate candidate John Neeley Kennedy do? (D)

OHIO 2008 – a gentle shift to victory

I have done an intensive county-by-county analysis study of the state of OHIO vis-a-vis the presidential election from 2008.

The document is in three parts and published at GOOGLE DOCS.

Part I

Part II

Part III

The excel spreadsheet with all the raw data

As was the case with INDIANA, the study of OHIO was fascinating and provides much thought provoking information.

The advantage of GOOGLE DOCS is that I can continue to update and correct a document and it will be automatically republished without the link changing.

Next state for intensive county by county study: VIRGINIA

Everything that you need to know about Ohio

Ohio is, in reality, a knife edge “purple” state. Voters here (as opposed to bloggers) are kitchen table Democrats (econ issues) but drift rightward on social issues and are extremely susceptible to crafty framing on wedge issues.

The world had to endure the last four years of hell because 118,000 Ohio voters put The Shrub back in office for two reasons. One was Tom Noe’s ill gotten booty (and it WAS MUCH more than what has been revealed) that he pumped into the GOP here and because they came out to vote for The Hate Amendment.

Recently, we have seen press speculation about Rep. Tim Ryan already working on running for Lt. Gov. with Ted Strickland and eventually becoming Gov.

Of course, there’s a back story. Let’s call it “Ted’s Grand Plan.”

Class, let’s review…

The Ohio House in the General Assembly is barely in Dem control but the Senate is an absolute disaster on every level and completely hopeless. We currently control the STATE redistricting board by one vote. If we lose either AG or SoS, (or the Ohio House) control would flip.

Richard Cordray would have been my choice for the US Senate but he agreed to Ted’s request to move into the state AG spot to replace the disgraced Marc Dann. (Thus eliminating one strong contender for the US Senate) Good move in terms of better government. He’ll do a great job.

You’ve gotta remember that Gov. Ted is all in for Lee Fisher as Senator, so with Cordray settled in at AG, that’s one less obstacle for Fisher.

Ryan was the other obstacle. So, Ted offers him the title of governor heir apparent. (Which is, in fact. all this discussion really means.) Ryan (and Ted) are taking the very long view.

Ryan’s current US House is District is one of four obscenely gerrymandered Dem “quarantine” districts that the GOP created at nearly 70% (or more!) Democratic turnout. This was to confine Dem voters to as few districts as possible in order to create as many GOP majority Districts as they could.

The strongly Dem districts are held by Marcy Kaptur, Dennis the Menace, Ryan and Marcia Fudge (formerly held by the late Tubbs-Jones) The latter district is the only one that will survive as such an overwhelmingly Dem district –on the grounds of minority representation.

Ohio will lose two House seats after the current census. Marcy, Dennis and Ryan’s districts will all have to lose some measure of Democratic majority in order to create more Dem majority districts, which cannot be done with these three districts running far too Democratic.

Which is what makes the specter of a Cafaro candidacy so nauseating. If that District becomes even vaguely competitive, she’ll blow it.

[Ed. Note: I would mention that that OH-14 is one of the most closely divided US House Districts to be represented by a GOPer. I say: “blow that sucker right off of the map!” Just eliminate it altogether.]

So here’s the plan: We control the Ohio redistricting process and threaten the GOP with… well… exactly what they did to us. And THAT is our leverage when, during US reapportionment, the Ohio House produces a Dem majority map and the Ohio Senate produces another one of their obscenities.

So had it not been for Judge Brunner’s decision to run for the US Senate, Ted had his plan all worked out. But now, if we lose control of Ohio SoS, the wheels completely come off. That’s why there is already a big hubub over who will run for SoS. Now the buzz is for Franklin County Commissioner Marilyn Brown. (Judge Brunner is supporting her, but I bet Ted was consulted.)

But if you look at the big picture, you can see why people are making these kinds of announcements which seem so far removed from when anything will actually happen.

OK, I’m going back to the real world now..