SSP Daily Digest: 2/7

AZ-Sen: One more fundraising number to report from Q4: Republican #2 and potential retiree Jon Kyl raised $106K, leaving him with $682K CoH. That’s a difficult number to assess as a tea leaf: it’s too much for him to look like he’s clearly about to hang it up, but also not enough to make it look like he’s actively engaging his race yet.

CT-Sen: Rep. Chris Murphy looks like he can count on a lot of hometown backing in his bid for the Senate (where the real challenge may be getting out of the Dem primary). He just rolled out the endorsement of 60 Democratic leaders from around CT-05, including three state Reps.

IN-Sen: State treasurer Richard Mourdock confirmed over the weekend at the Tippecanoe County Republican Women’s Club that he’ll be challenging long-time incumbent Richard Lugar in the GOP Senate primary in 2012, although he didn’t serve up much tea-spiked red meat in doing so, instead ladling on the praise of Lugar but touting the need for competition of ideas. He specified Feb. 22 as the official date of his campaign launch, though.

MI-Sen: Saul Anuzis (who I’ve just noticed is one typo away from being the Egyptian jackal god… maybe getting tough on grave robbers will be at the top of his agenda) is now the subject of a draft website, encouraging him to get into the Michigan Senate race.

MN-Sen: Buried deep in this article about Amy Klobuchar is some pretty clear indication that Rep. Michele Bachmann isn’t going to run for Senate in 2012; the GOP state party chair says that Bachmann was “very emphatic” to him that she wasn’t going to run. (Does she have any mode other than “very emphatic?”)

MT-Sen: In case you were hoping that all those leaks and rumors last week about Denny Rehberg announcing for the Senate were some sort of gigantic miscommunication, sorry, no such luck. The Republican Rep. officially announced his bid against Jon Tester on Saturday.

NJ-Sen: That Woody Johnson-for-Senate rumor a few weeks ago is continuing to get some continued oxygen, with revelations that the New York Jets owner dined at Drumthwacket (sorry, I just like saying “Drumthwacket”) with both Chris Christie and Mitt Romney several weeks ago. To me, this seems more like Johnson, a big Republican donor (although a John McCain backer in 2008) being there on Romney’s behalf than a Senate tea leaf. (Just found out he’s actually “Robert Wood Johnson IV,” as in the do-gooding Robert Wood Johnson Foundation, and big pharma company Johnson & Johnson.)

SC-Sen: Lindsey Graham — not up until 2014, so this is mostly academic at this point — is sporting some rather Olympia Snowe-ish approval numbers in the way they break down. He’s at 40/37 overall in PPP’s South Carolina sample, but at 31/38 among Democrats and only 43/36 within his own party. He’s looking better positioned to win the general in ’14 than to win his own primary.

UT-Sen: Orrin Hatch is grinning and bearing it: eager to avoid the fate of fellow Senator Bob Bennett, who ignored the tea partiers at his own peril, Hatch will participate in an online town hall sponsored by Tea Party Express (whose Sal Russo offered Hatch some rhetorical cover last week). He’ll be the establishment odd-man-out, sharing face time with Rand Paul, Michele Bachmann, and Steve King.

KY-Gov: Republican state Senate president David Williams, the establishment canddiate in the Kentucky gubernatorial GOP primary, looks to be pretty safe from a teabagging, if his own internal poll is any indication. A poll from Got Focus shows him at 47, with Bobbie Holsclaw at 10 and tea-flavored businessman Phil Moffett at 9.

PA-Gov: Here’s an intriguing rumor, although one that doesn’t have much to it beyond eavesdropped rumblings at the state Democratic committee meeting: ex-Rep. Joe Sestak for governor in 2014. Can he be the one who stops the state’s clockwork alternation between the parties for 8-year gubernatorial terms?

WV-Gov: You can count Republican zillionaire John Raese, who lost the 2010 Senate race by an unexpectedly wide margin, out from this year’s gubernatorial special election; he said “no thanks” (after already having declined a 2012 senatorial rematch against Joe Manchin). And the election dates are finally official, with acting Gov. Earl Ray Tomblin signing off on the compromise legislation that set the primary on May 14 and general on Oct. 4.

FL-25: The hits just keep coming for freshman Rep. David Rivera. On top of the $500K in mysterious dog track money and the $60K in mystery expenditures while a state legislator, now the AP is reporting on an entirely separate $150K paid from the Miami-Dade Republican Party to a key ally of Rivera (to consultant Esther Nuhfer for “media” expenses) without any of the usual paper trail. $35K was used to purchase radio ads, but the whereabouts of the remainder is anybody’s guess.

LA-03, LA-07: While we reported on Friday that Jeff Landry was considering a state AG run as a way out of his likely redistricting-related demise, it looks like he’s still fighting to keep a viable House district for himself too. He and LA-07’s Charles Boustany are publicly at odds over the state’s new redistricting map. Landry wants a district that spans the whole coastline of the state (which would put him on a collision course with the Lafayette-based Boustany), while Boustany says there needs to be one district for the New Orleans suburbs (which would probably wind up pitting Landry against Steve Scalise in current LA-01 instead).

MI-09: It sounds like Democratic Rep. Gary Peters may also have a Plan B in the event of the elimination of his district via redistricting. Based on the war of words emerging between Peters and Republican Oakland Co. Executive L. Brooks Patterson, it’s possible that Peters is eyeing a 2012 run to become head of the state’s second largest county. Oakland Co. is one of those prototypical mostly-affluent inner-ring suburban counties that has moved pretty solidly into the Dem column at the presidential level but still has a lot of Republican strength further down the ballot; MI-09 currently occupies most of the county.

MO-05, MO-06: In that one or two weeks where it looked like Rep. Sam Graves was going to run for Senate (thus opening up the 6th), that prompted Republican state Rep. Jerry Nolte to officially throw his hat into the ring for the presumably open seat. Now that he knows Graves is sticking around, though, Nolte apparently isn’t going to let his newly-opened federal account go to waste. He says he might run against Emanuel Cleaver in MO-05 instead. (Nolte lives in Gladstone in the KC suburbs, currently in the 6th but a possible inclusion in the 5th after redistricting, as the 5th will need to gain a lot of population.)

Redistricting: The Fix’s ongoing series of profiles on state redistricting turns to Pennsylvania this week, the state whose 2002 map became almost synonymous with one of our favorite words here: “dummymander” (i.e. a map that looks like a coup at first but is so flimsy that it blows up in your face the minute the political winds turn against you). The state GOP, in charge of the process again in 2012, seem to have learned from their mistakes and don’t plan to get so “greedy” this time. As we’ve mentioned here, the likeliest approach to lose the one seat will be to draw western PA Reps. Jason Altmire and Mark Critz into one district. The alternative would be to try to take out the seemingly-indestructible Tim Holden in PA-17, although reddening his already GOP-leaning district would probably make things even worse for Lou Barletta, whose PA-11 is currently D+4.

2012 Prez: Jake McIntyre’s presidential cattle calls have been a rich tradition over at Daily Kos for years now, and this one is no exception. (It’s so good we’re actually breaking the first rule of Swing State Project: no talking about presidential politics.)

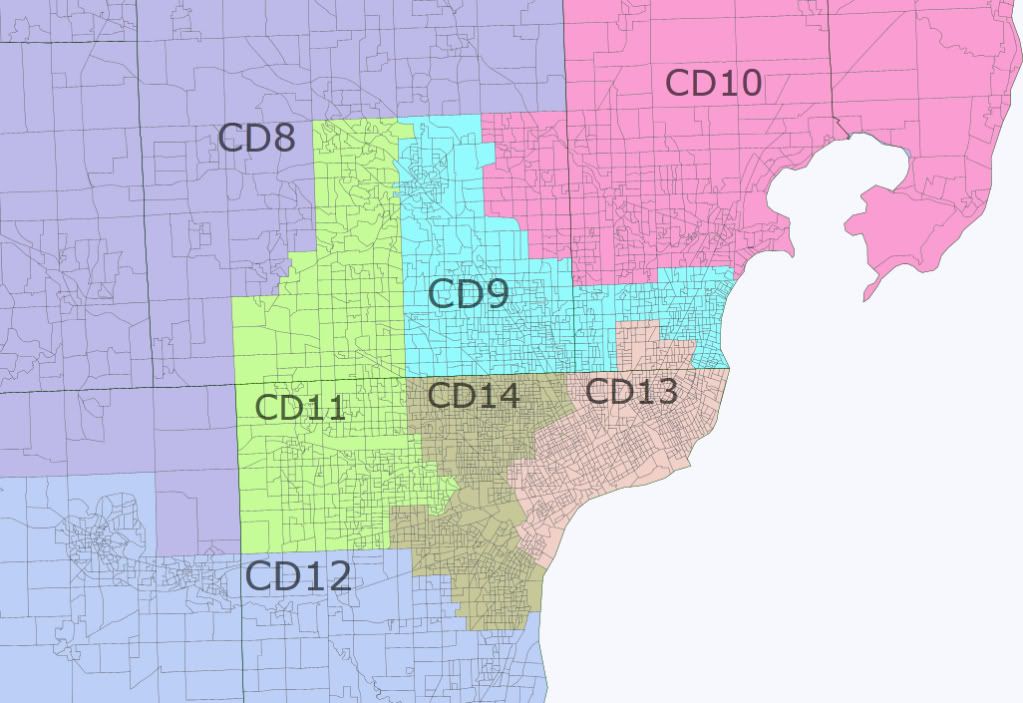
Michigan redistricting: rolling the dice?

The Michigan Republicans are in the enviable position of controlling the governor’s office and both houses of the legislature, as they were back in 2001. The state has a fairly restrictive redistricting law that stresses respecting city and county boundaries and forbids really abusive gerrymanders, so the state’s districts will probably look more or less like they do on the current map, which is Republican-friendly but has nothing outrageous.

The state will lose one of its seats, and like most people I assume that they will throw Dem incumbents Gary Peters and Sander Levin into one district. Most of the population losses have been in the inner Detroit area, and they probably can’t mess with Hansen Clarke’s MI13 or John Conyers’ MI14  too much as it is easy to draw two compact majority-black districts for them. The Republicans must face a major decision: do they try to hold all 9 seats they currently have and risk losing a bunch of them in a blue wave year, or do they sacrifice one of them to shore up some of the others? They have one glaring problem: Ingham county. As in Ohio, the seat of state government and a huge public university create a big blue menace in the middle of a bunch of Republican-held districts. Obama won it by 50k votes, about 2-1. Michigan Reeps attached it to Republican areas further east in Mike Rogers’ MI8, thus creating two swing districts instead of one red one and one blue one. This worked out for them except in 2008 when Mark Schauer took MI7 south of Lansing from Tim Walberg. Maximizing the number of winnable districts worked well for the Reeps for most of the 00s, and for that reason I expect them to try it again. However, the state as a whole has been trending blue for some time and I think they would have an easier time holding the House if they try to push up their floor instead of their ceiling. So here are two scenarios: one in which they sacrifice a seat in the Lansing area and one in which they try to hold everything.

Scenario 1: Throw Walberg under the bus!

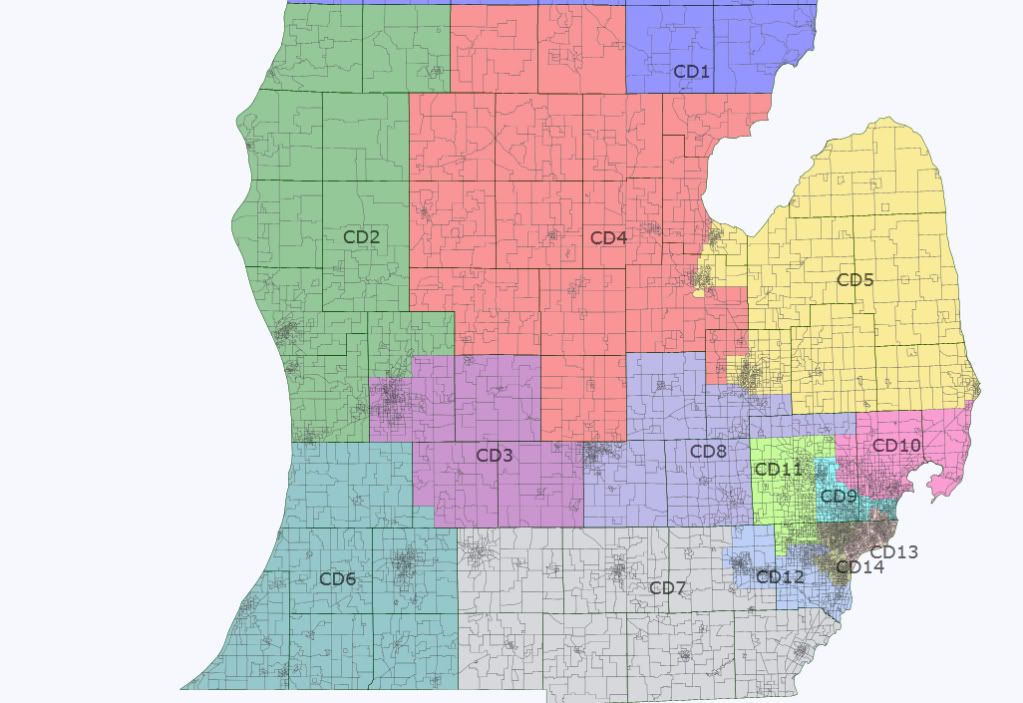
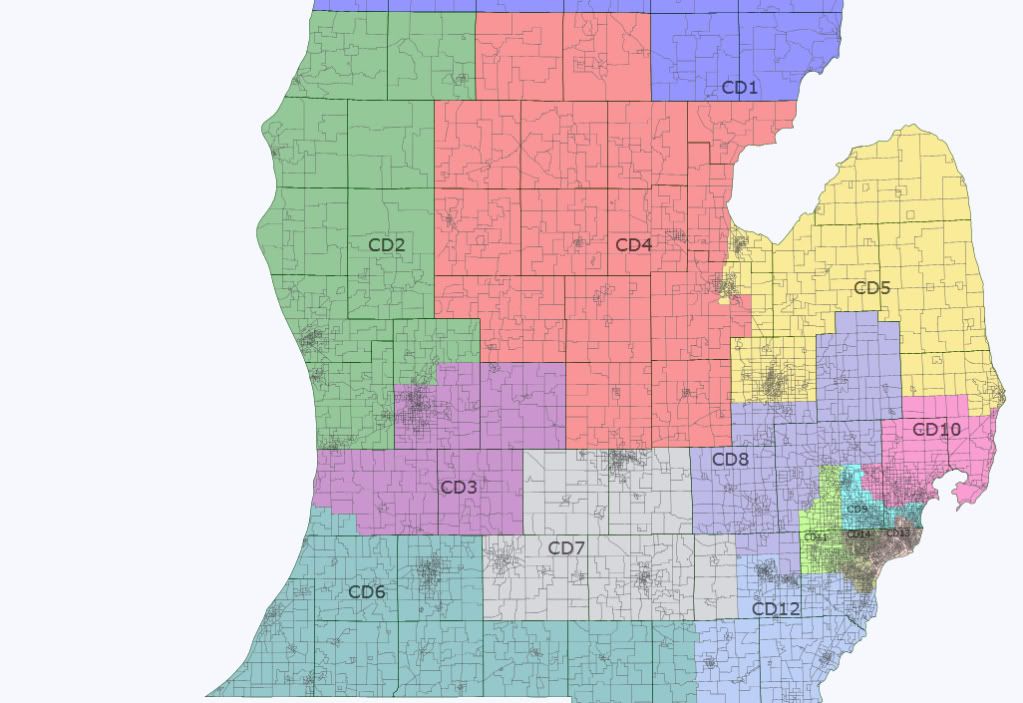
Here they create a Democratic sink in the Lansing area primarily from Walberg’s district to make things easier for Rogers and Justin Amash. The state map:

Michigan

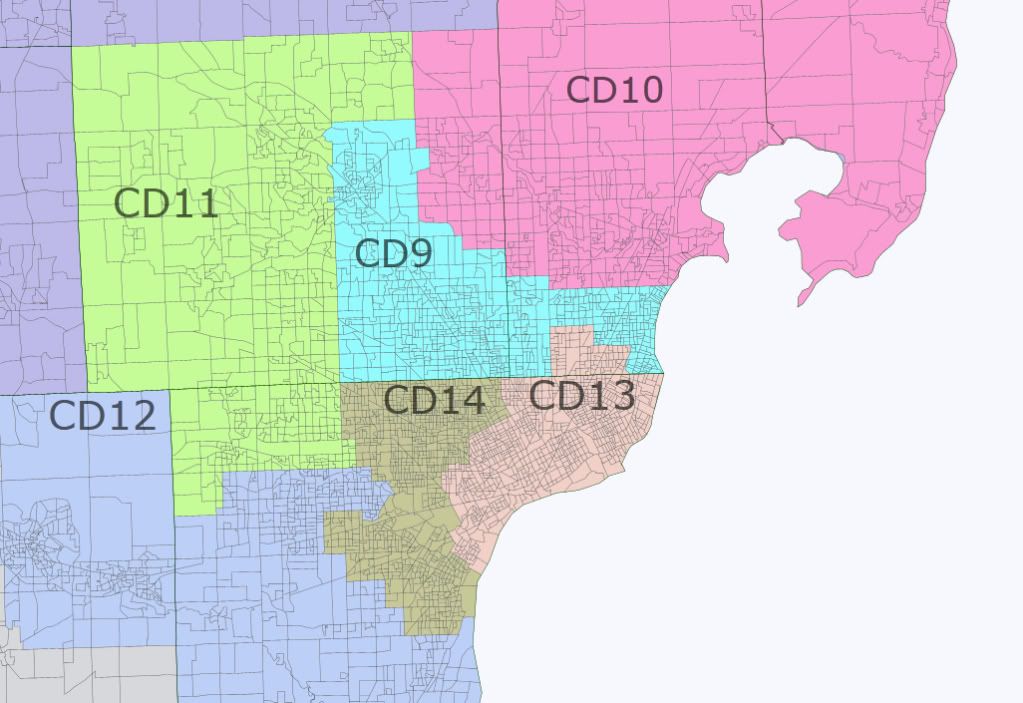
Everything north of the top edge is in Dan Benishek’s MI1. The Detroit-area closeup:

Detroit area

Notes on districts follow. In each case O or M followed by a number indicates Obama’s or McCains’s 2008 margin in thousands of votes.

MI1 (blue): Loses Arenac and Gladwin which combined are O1, and the northern part of Bay which is probably more like those two counties than the rest of Bay, which was O9 overall. Gains Kalkaska, Grand Traverse, Benzie, and Leelanau which collectively are M1. There isn’t much opportunity for mischief here since the district is shoved into the northern end of the state and the northern lower peninsula has very few counties where either candidate won by as much as 10%. It would still be R+3.

MI2 (green): Rookie Bill Huizenga’s district loses Benzie and northern Allegan and gains suburban and exurban precincts north of Grand Rapids. The current district is the reddest in the state at R+7 and this would not change much.

MI3 (purple): Amash’s district will probably be pushed south to some extent as MI1 needs to expand, which will likely push MI2 into MI3. Here the lost northern suburbs and exurbs are replaced with most of Allegan, which was M6 (roughly R+9). The current district is R+6 and the new one would likely be about the same.

MI4 (red): Dave Camp is the chair of the Ways and Means committee and I think the Reeps will ensure that his district, currently just R+3, is not weakened. Here it swaps out marginal areas near Traverse City with similar areas near Saginaw Bay (see MI1 above), loses a few (bluish?) precincts near Saginaw, and picks up O0 (that’s Obama by less than 500 votes, roughly R+3) Clinton and the southern part of O3 Shiawassee.

MI5 (yellow): Dale Kildee’s district will be pushed east if Levin and Peters are thrown together. The thumb has to go somewhere, and it can’t stay in Candice Miller’s MI10. Here it loses (bluish?) suburbs and exurbs south of Flint, and gains M1 Huron, M2 Sanilac, and most of O2 St.Clair. This district is currently D+11 and would probably be D+9 or D+10 under the proposed map. It serves the same purpose: a blue sink with Flint, Saginaw, and Bay City.

MI6 (teal): Fred Upton’s district makes up for the loss of much of Allegan with M1 Branch and M2 (roughly R+10) Hillsdale, along with less-populated parts of purple Lenawee. Overall PVI of zero before and after. Kalamazoo (O25, D+7) is this district’s big problem, but you may not be able to legally make a blue sink that takes in both Lansing and Kalamazoo.

MI7 (gray): Here we create a blue sink from what used to be Walberg’s R+2 district. He loses Branch, Hillsdale, Lenawee, and purplish areas of Washtenaw and gets stuck with O49 (D+13) Ingham. The new MI7 also has O5 (D+1) Eaton, O6 (D+1) Calhoun, O2 (R+2) Jackson, and the west end of Washtenaw. Obama won the whole thing by at least 60k, and it’s hopeless for a Republican. Joe Schwarz might be able to lose respectably here, but he wouldn’t be able to win.

MI8 (blue-gray): Rogers moves east, ridding himself of Ingham, Clinton, and southern Shiawassee and swaps in M1 (R+5) Lapeer and suburban/exurban parts of Oakland, Washtenaw, and Genesee. The district’s new areas are less red than M13 (R+10) Livingston, but it’s likely R+6 to R+8 overall whereas the current MI8 is just R+2.

MI9 (toothpaste blue): What’s left after you merge Peters and Levin is another blue sink with blue pieces of southern Oakland and Macomb. For what it’s worth Levin lives here and Peters doesn’t.

MI10 (pink): Miller has to pick up some vacated areas from the current MI9 and MI12, and she gets Rochester Hills, much of Troy, Mt. Clemens, and part of Sterling Heights. This area is probably less safe overall than the reddish areas of the thumb that she has to vacate, and I suspect that the district’s PVI would drop from R+5 to R+3 or R+4. But there isn’t much of an alternative if you want to merge Levin and Peters.

MI11 (pea soup green): Thad McCotter’s district moves east but retains its base in northwestern Wayne County. In Wayne, it drops Belleville and blue Redford and picks up Dearborn Heights. In Oakland, he keeps Novi and not much else, losing the exurban western areas to MI8 and picking up Waterford and the (more problematic?) West Bloomfield and Farmington Hills from MI9. The current MI11 has a PVI of zero and I suspect the new changes would be about a wash. I think the biggest problem with the new MI11 is that is Peters lives there. Having MI8 reach down to pick up W. Bloomfield might violate the compactness or community of interest provisions of the redistricting law, although it might be feasible  to swap some northern parts of Oakland county for pieces of Washtenaw and Livingston that I have going into MI8.  

MI12 (lighter blue-gray): John Dingell’s old MI15 moves slightly west, but still contains Ann Arbor and Ypsilanti and is therefore a blue fortress. His home in Dearborn will probably end up in MI14 as the Detroit districts need to expand.

MI13 (faded pink): Clarke’s district has to cross 8 Mile to pick up part of Warren and Eastpointe. It’s 56% black.

MI14 (brown): Conyers’ district moves west to pick up Dearborn, Redford, and Inkster. It’s 53% black. Both MI13 and MI14 still have PVIs of D+fuhgeddaboutit.      

Scenario 2: A 9-5 map, if you can keep it

Here Rogers keeps Lansing, and as before most of the other central and eastern districts have to move in the direction of the areas vacated by merging Levin and Peters. State map:

Michigan1

Detroit area map:

Detroit1

District comments. Unless otherwise noted, “changes” here are relative to the map discussed above, not the current map.

MI1, MI2: no changes.

MI3: Here Amash cannot pick up Allegan, as Upton will need the rest of it as a substitute for Branch and Hillsdale. He has nowhere to go but Eaton, and the result is a district that Obama won: Ionia was M1, Barry M3, and Eaton O5. Kent was O2, and Amash’s piece (Grand Rapids and everything south or west of it) is clearly more blue than the county average. Overall the new MI3 would be R+3 at best, and Amash would likely be vulnerable in a year that is average or better for Dems.

MI4: Here Camp loses northern Shiawassee and replaces it with suburban/exurban areas of Genesee and Saginaw. Probably minimal impact.

MI5: Picks up Lapeer and some of St. Clair, loses bits of Genesee and Saginaw, still a blue sink.

MI6: Picks up the rest of Allegan instead of Branch and Hillsdale. Probably about a wash.

MI7: This time it isn’t sacrificed. Relative to the current MI7 it has to move east, so it swaps out O5 (D+1) Eaton for O3 (R+1) Monroe and makes minor changes in Washtenaw and Calhoun. Probably still R+2, which doesn’t bode well for Walberg after his narrow win on the red wave of 2010.

MI8: Again relative to the current map, it swaps out O0 (R+3) Clinton and part of exurban northern Oakland for northern Shiawassee (O3, D+1) and southern Genesee. This appears less favorable for Rogers than his current district, and would likely move it from R+2 to R+1 or even.

MI9, MI10: Trivial changes.

MI11: Loses much of its Wayne turf including Dearborn Heights, Westland, and Canton and retains more of western and northern Oakland. Possibly better for McCotter than the MI11 from the first map, but this time he is in no position to get any favors from Rogers who is saddled with a shaky district.

MI12: Has more of Dingell’s old stomping grounds. Still a blue sink.

MI13, MI14: no changes.

In the first map, the Reeps give up Walberg’s seat to make Amash somewhat safer and Rogers much safer. Alternatively, they may be able to have Rogers take on a bit more risk (albeit much less than he has now) to make McCotter somewhat safer. The second map is a dummymander in my opinion. Amash, Walberg, and possibly Rogers would all be at serious risk. McCotter would almost certainly be vulnerable to a challenge from Peters, although this is also true of the first map as shown. Politically Michigan is much more like Wisconsin than Ohio: it has lots of purple and not much deep red, and it’s difficult to do a Republican gerrymander.


By what margin will Bob Shamansky win?

View Results

Loading ... Loading ...

Coloring Inside the Lines: A Florida Fair Districts Map

This diary presents a 27-seat map for Florida using the new ACS data and the guidelines of the newly passed Fair Districts amendment. It goes very heavy on respecting local boundaries, sometimes to the detriment of minority districts; a couple of alternate area maps are presented at the end to rectify that. My hope is that this map represents the most extreme fidelity to local boundaries that’s possible, in order to serve as a baseline for other proposed maps. Please let me know if you think there’s someplace that fidelity can be enhanced.

Florida’s gaining two seats. It’s pretty easy to say that one is FL-19, based in Indian River, St. Lucie, and Martin Counties on the south central Atlantic coast. The second one is harder to discern; I think it’s best to say that the old FL-03 is gone and has been replaced by the new districts in Orlando and Jacksonville.

As drawn, the map renumbers all of the districts from northwest to southeast. Here’s an overview map.
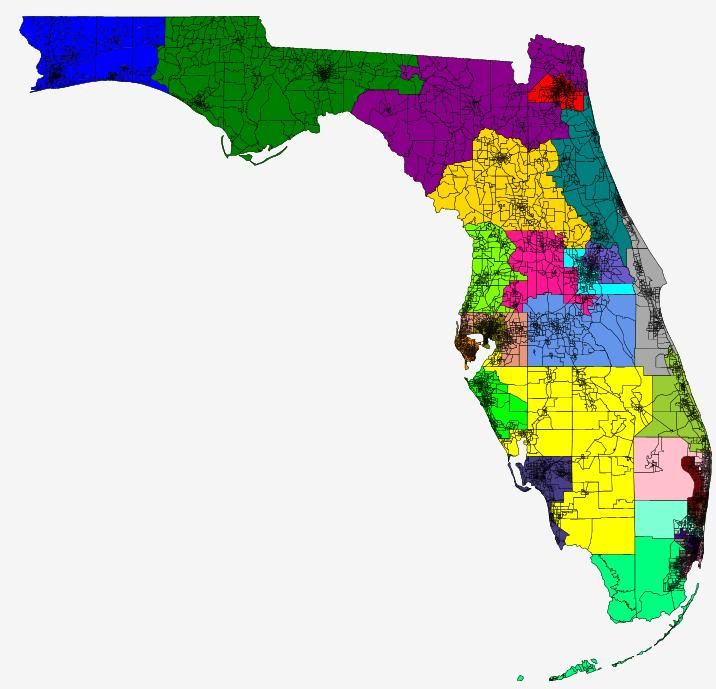
Fair Districts

For reference, here’s the ballot summary of the Fair Districts law:

Congressional districts or districting plans may not be drawn to favor or disfavor an incumbent or political party. Districts shall not be drawn to deny racial or language minorities the equal opportunity to participate in the political process and elect representatives of their choice. Districts must be contiguous. Unless otherwise required, districts must be compact, as equal in population as feasible, and where feasible must make use of existing city, county and geographical boundaries.

Not taking political ramifications into account was actually easy. Florida’s a pretty difficult state to get elections information for. So much so that even after drawing the map, I’m having a hard time assessing it. My comments are based on existing PVIs as listed on Wikipedia and the map from Inoljit’s recent diary on the 2010 governor’s race. Feedback from those with knowledge about Florida’s politics is greatly appreciated.

Following existing local boundaries has a pretty dramatic impact on the overall map. Currently, the 10th district in Pinellas County is the only district entirely within one county. Under this new map, there are nine districts that are wholly within a single county: two each in Miami-Dade and Broward and one each in Palm Beach, Pinellas, Hillsborough, Orange, and Duval. Overall, I’m happy with my map’s compactness and respectfulness of local lines, although I’d be happy to see other attempts. Note that the only boundaries I had references for are the county lines and the incorporated cities lines available in the old version of the App. I don’t even know if Florida has something equivalent to midwestern townships, so if it does, I wasn’t able to take them into account.

Protecting the opportunities of racial and language minorities was a more difficult aspect of this map. My lay understanding of the current state of VRA law runs something like this: minorities that can be given compact districts where they’re 50% or more of the population must be given them, but it’s unconstitutional to “gerrymander” together unwieldy districts for them — although considering that NC-01 apparently passes muster, I’m not quite sure how to tell what’s too unwieldy. There’s also, I suppose, the question of to what extent the Fair Districts language goes beyond what the VRA requires.

For my main map, I decided that both Brown’s and Hasting’s districts were too unwieldy to be maintained. Dismantling Hasting’s district is probably the worse call. While ugly, it could be drawn at more than 50% African American while staying entirely within two counties; anything similar to Brown’s current district wouldn’t pass the 50% mark and would require a whole lot of county-splitting. At the same time, however, breaking up Hasting’s district allows for four of the six districts wholly or partially in Broward and Palm Beach to be majority-minority (although three of those are white-plurality.) Constructing something similar to Hasting’s current district causes four of those six districts to become white majority.

The Decision Points

Putting that another way, I really consider myself to have made only three significant decisions on this map – everything else seemed more or less dictated by the geography and demographics. Now, that might not be an accurate self-perception, but that’s how I feel about it.

Two I’ve already covered:

1) Will the plurality African American district in north Florida be maintained?

2) Will the majority African American district in Palm Beach and Broward Counties be maintained?

And then there’s the previously unforeshadowed:

3) Polk and Osceola Counties together are 150k too many people for a district. Which 150k people are they and to which district are they being attached?

For my main map, the answers are “no”, “no”, and “Kissimmee and environs are going north to the western Orlando suburan/exurban district”. I’ll talk more about this third choice in the district-by-district descriptions.

At the end of the diary, I’ve included alternate versions that look at the other answers to those questions. The map that switches the first answer to a yes is based on powera’s diary from a few weeks ago, with a Jacksonville-Tallahassee majority-minority district. The map that switched the second answer to a yes is based on the existing FL-23, altered to better suit the Fair Districts requirements. And then the final map changes the answer to the third question to “Lakeland and environs are going north and west connecting to a district in Pasco County”.

District-by-district description is after the jump.

Monroe & Miami-Dade
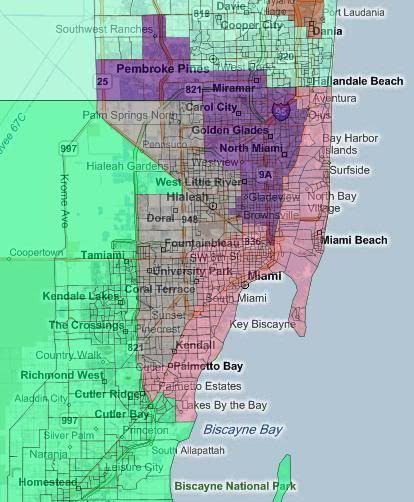
FL-24 – Indigo – North Miami/Miramar (VRA: B 54%, H 30%, W 13%)

FL-25 – PaleVioletRed – Miami/Miami Beach (VRA: H 61%, W 31%)

FL-26 – Gray – Hialeah (VRA: H 83%, W 12%)

FL-27 – SpringGreen – Monroe/Outer Miami-Dade (VRA: H 62%, W 24%, B 11%)

FL-27 takes in all of Monroe County and then enough of Miami-Dade to make up the balance. This roughly corresponds to the area west of the Turnpike and south of SW 216th St. The African-American blocks in northern Miami-Dade form the core of FL-24, spilling over into southern Broward. FL-25 takes in the rest of Miami proper that’s not in FL-24, and then snakes up and down the coast to hit population equality. FL-26 takes up the balance of the county.

Broadly speaking, New-27 is Old-25, New-26 is Old 21, New-25 is Old-18 and New-24 is Old-17.

To the best of my scanty ability to tell, I haven’t significantly changed the partisan of any district. MassGOP had a recent comment about how the area south of Miami is Demoractic-heavy and split up perfectly amongst the existing districts. This map (quite inadvertently) sustains that. I suppose that Ros-Lehtinen might face some trouble, since she’s picking up territory north of Miami Beach that I would assume is in Wasserman Schultz’s district for a reason. Diaz-Balart and Rivera won’t live in their districts, but they don’t now anyway. Wilson has a potential problem in that she would now have Hastings as a constituent (and therefore possible primary rival).

Broward and Palm Beach
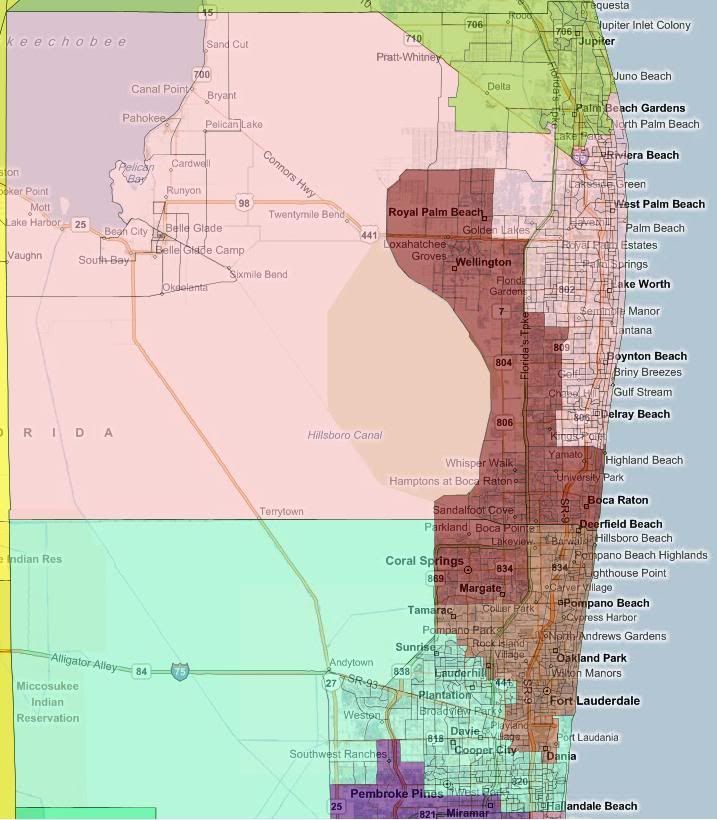
FL-20 – Pink – Delray Beach/Boynton Beach/West Palm Beach/Pahokee (VRA: w 49%, B 25%, H 23%)

FL-21 – Maroon – Coral Springs/Boca Raton/Wellington (VRA: W 73%, H 14%)

FL-22 – Sienna – Ft Lauderdale/Pompano Beach/Deerfield Beach (VRA: W 48%, B 33%, H 16%)

FL-23 – Aquamarine – Plantation/Davie/Hollywood (VRA: W 49%, H 28%, B 17%)

Starting at the extreme south, there’s the rest of FL-24, taking in Miramar and parts of Pembroke Pines. It took experimentation to figure out how to arrange the boundaries of the rest of the incorporated localties to best fit the congressional district size while keeping all three districts minority-majority. Eventually, I hit upon this arrangement of FL-23, which to the extent that the census blocks match municipal boundaries, doesn’t involve any boundary breaking. I couldn’t find a similar arrangement for FL-22, so it ended up picking up a few arbitrary blocks of Margate from FL-21. The arrangement between between FL-20 and FL-21 is to maximize the minority population of FL-20 while respecting local lines. After the creation of these four districts, there’s about 160k leftover population in Palm Beach Gardens/Jupiter that gets sent up to FL-19.

The districts in this area were previously so intertwined that I’d have a hard time mapping them onto the new ones, but if forced, I would say that New-23 is Old-20, New-22 is Old-23, New-21 is Old-19 and New-20 is Old-22.

I believe that all four of these districts would have PVIs of at least D+8, which is sad for West. Hastings has been drawn into FL-24 with Wilson. West has been drawn into FL-23 with Wasserman Schultz. I’m guessing that Hastings would seek to represent FL-22 if he tried to stay in office, but that’s just a guess – I suppose he could take on Wilson. About West, I have no clue. Deutch lives in FL-21. FL-20 is open.

Southwest Florida
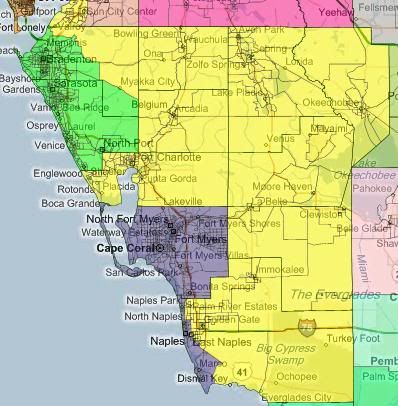
FL-16 – Lime – Manatee County/Sarasota County (VRA: W 81%, H 10%)

FL-17 – DarkSlateBlue – Lee County/Naples (VRA: W 74%, H 16%)

FL-18 – Yellow – the rest of southwest Florida (VRA: 69%, H 22%)

The ten counties that I’m calling Southwest Florida (Charlotte, Collier, DeSoto, Glades, Hardee, Highland, Lee, Manatee, Okeechobee, and Sarasota) have about 50k too few people for three districts. Hillsborough and Pinellas Counties together came up about 55k too many for three districts, so that’s where the disparity gets made up. Sarasota County and Manatee County together are about 4k over a district, so that’s where FL-16 comes from. Lee County, on the hand, is about 100k short of being a district. I couldn’t find a 100k subdivision of Charlotte County that didn’t break municipal lines, so Lee’s FL-17 ran down the coast of Collier County through Naples to Marco Island. FL-18 takes up the rest of Southwest Florida, plus about 50k in and around Sun City Center in Hillsborough County.

Roughly speaking, New-18 is Old-16, New-17 is Old-14, and New-16 is Old-13.

All three of these districts should continue to have Republican PVIs. FL-16 should be somewhat less Republican than it was previously, since it’s losing rural territory and gaining the minority-heavy parts of Brandenton. I’d expect FL-17 to be about the same, which FL-18 is probably more Republican than previously, since it’s no longer involved with St. Lucie County. Buchanan and Mack continue to live in their districts. Rooney lives in what’s essentially a new district in FL-19, so FL-16 is open.

Hillsborough Pinellas
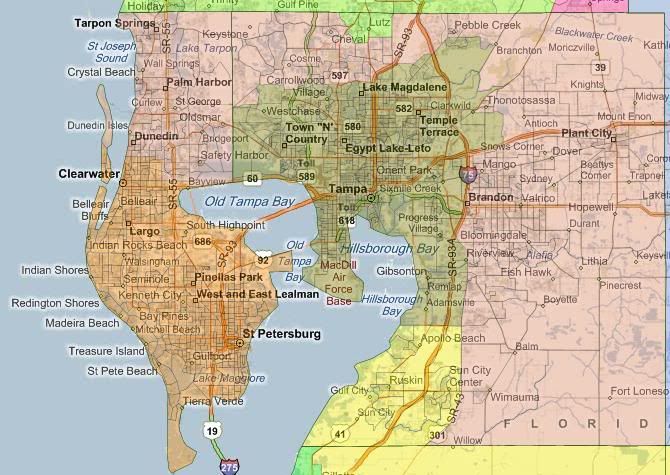
FL-13 – DarkSalmon – Outer Hillsborough/Pinellas (VRA: W 74%, H 14%)

FL-14 – Olive – Tampa/inner suburbs (VRA: W 49%, H 25%, B 21%)

FL-15 – DarkOrange –  St. Petersburg/Clearwater (VRA: 76%, B 12%)

FL-13 and FL-14 pretty much drew themselves. FL-13 starts at the southern tip of Pinellas County and works north, taking in most but not all of Clearwater, due to population equality concerns. FL-14 took in all but the very north reaches of Tampa (since those were needed to maintain contiguity for FL-15), and then focused on taking in as many minorities as possible to make FL-14 (just barely) minority-majority. Even after donating 50k people south to FL-18, the combined three districts are about 5k over populated. Those are donated northwards to FL-11. The exact blocks chosen for donation are entirely arbitrary – any group along the border between FL-11 and FL-13 that maintains population equality could be used.

Roughly speaking New-15 is Old-10, New-14 is Old-11, and New-13 is Old-9.

Bilirakis, Young, and Castor are all fine from a residency standpoint. I imagine, although I’m not sure, that all three Representatives have been hurt from PVI standpoint. Castor has lost the minority parts of Brandenton and St. Petersburg; Young has taken on all of St. Petersburg; and Bilirakis has lost all of his territory in Republican Pasco County. Castor and Bilirakis have some room to maneuver; but Young was already in an R+1 district. Another few points to the Democrats could flip the seat, especially if Young retires.

Central Florida

FL-08 – SlateBlue – Seminole County/Northeast Orlando suburbs (VRA: W 64%, H 20%, B 10%)

FL-09 – Cyan – Orlando (VRA W 44%, H 25%, B 25%)

FL-10 – DeepPink – Kissimmee/West Orlando suburbs/Lake County/Sumter County/western Pasco County (VRA: W 67%, H 20%)

FL-11 – Chartreuse – Citrus County/Hernando County/eastern Pasco County (VRA: W 85%)

FL-12 – CornflowerBlue – Polk County/Osceola County minus Kissimmee (VRA: W 66%, H 18%, B 13%)

Starting at the southern part of this region, Polk and Osceola together were almost 150k over populated for a single district. I briefly looked at separating them, but that resulted in far more ugliness than keeping them together entails. This resulted in the choice I referred to in my intro. There are two ways that I found to take 150k people out of the district in a way that respects local lines: attach Kissimmee and Celebration to an Orlando-based district or attach Lakeland to a Pasco-based district. I tried both and ultimately choose the first option because it better fit my subjective impression of “compactness”. The number of county splits ended up being the same either way, if I counted correctly. It was just a matter of where the county splits are. The main detriment (if it is one) is that the Disney Empire doesn’t end up in the same district as Orlando-proper.

After that, the rest of Central Florida fell into place. Coastal FL-12 takes up Citrus and Hernando Counties along with western Pasco County (roughly speaking, the area west of I-75). On the opposite side of the region, FL-09 picks up Orlando proper, along with minority-heavy areas to the east, west, and northwest – all within Orange County. Meanwhile FL-08 combines Seminole County with enough of the whiter suburbs to the east of Orlando in Orange County to make a district. It took some playing around to figure out how best to draw those while respecting local lines. In the end, the only infidelity that I know of is a couple of blocks that straddle Ocoee and Apopka. Finally, FL-10 picks up the leftover areas of the region: Kissimmee, Winter Garden-Ocoee, Sumter County, eastern Pasco County, and most of Lake County. (All of Lake County would have been 50k too many. I moved the northeast corner of the county up to FL-05.)

Roughly speaking, New-12 is Old-12, New-11 is Old-05, New-10 is Old-08, New-09 is one of the new districts, and New-08 is Old-24.

Politically, I suspect that all of these districts, except for the new majority-minority FL-09, are likely Republican. Ross and Nugent are okay from a residency standpoint. Mica now lives in the new FL-08. Webster and Adams are both listed as Orlando, so they’re both looking for new districts to run in – possibly the new open FL-10.

Atlantic Coast
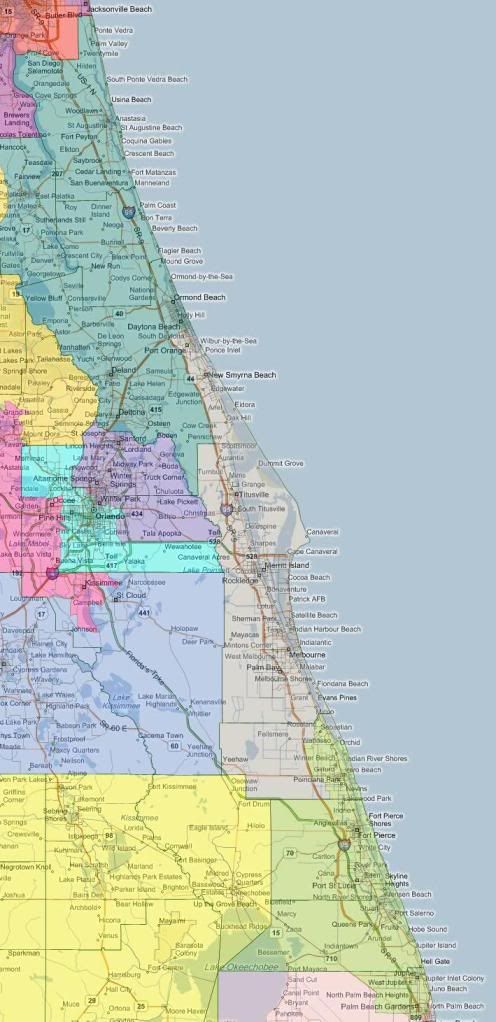
FL-06 – Teal – St. Johns County/Flagler County/eastern Putnam County/most of Volusia County (VRA: W 75%, B 13%)

FL-07 – DarkGray – Space Coast/New Smyrna Beach/Titusville/Melbourne (VRA: W 81%)

FL-19 – YellowGreen – Indian River County/St. Lucie County/Martin County (VRA: W 76%, H 11%, B 10%)

Three districts hug the Atlantic Coast. Starting with the new district on the south central coast: FL-19 takes in the rest of Palm Beach County, along with St. Lucie, Martin, and all but 9k people in Indian River (which are donated north to FL-07.) FL-07 takes in those 9k in Indian River, all of Brevard, and the strip of Volusia east of I-95 and south of Daytona Beach. FL-06 then takes in in the rest of Volusia, along with Flagler and St. Johns. At that point, it’s about 50k short, so it moves inland to take about the eastern half (by area, more like two-thirds by population) of Putnam County,

Roughly speaking, New-19 is a new district, New-07 is Old-15, and New-06 is Old-07.

Politically, I’m pretty sure that these are all safely Republican; I’m least certain of that with regards to FL-19. Rooney (in the new FL-19) and Posey (in the new FL-07) have districts to themselves. The new FL-06 is open.

North Florida
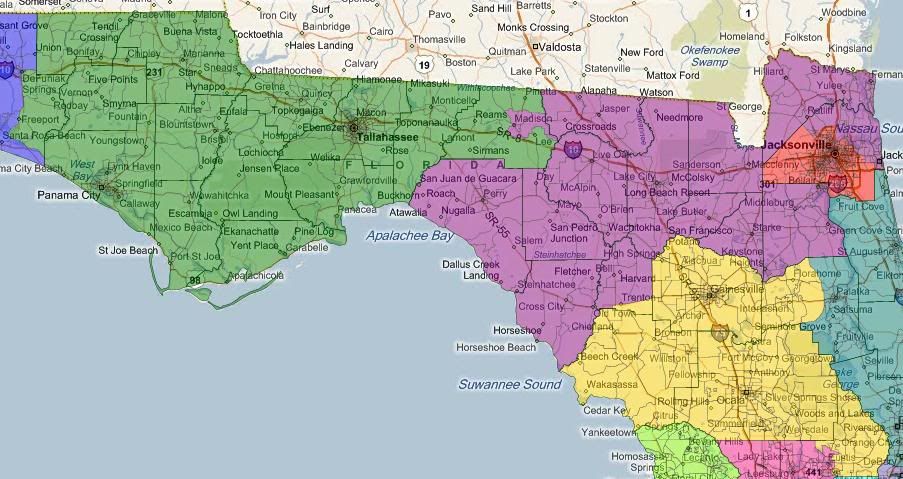
FL-01 – Blue – Western Panhandle/Pensacola (VRA: W 76%, B 14%)

FL-02 – Green – Eastern Pandhandle/Tallahasee/Panama City (VRA: W 68%, B 24%)

FL-03 – DarkMargenta – Suwanee River/Jacksonville suburbs (VRA: W 78%, B 13%)

FL-04 – Red – Jacksonville (VRA: W 55%, B 33%)

FL-05 – Gold -North central Florida/Ocala/Gainsville (VRA: W 75%, B 13%)

This time starting in the west. The Pensacola-based FL-01 shrinks by three counties, taking in only the westernmost three counties and about 42k of Walton’s 50k. FL-02 therefore also shifts west, losing all but 10k of its population east of Jefferson County. Skipping down to the southern part of the region, FL-05 takes in all of Levy, Marion, and Alachua Counties, plus the northeastern portion of Lake County. That leaves it about 3k short – I decided the southern block of Gilchrist makes the “compact” addition. FL-04 stays wholly within Duval County. This is probably the closest thing to a successor to the old FL-03, so in deference to that, I drew it as minority-heavy as possible. It’s still 55% white. The new FL-03 takes up the rest.

These are a bit more straightforward to map back onto the old districts: New-01 is Old-01, New-02 is Old-02, New-03 is Old-04, if New-04 is anything it’s Old-03, and Old-05 is New-06. All incumbents are fine from a residency standpoint. I’m much less sure about electorally. I would suspect that FL-02 has gotten more Democratic, since Leon County is a bigger proportion of its population. FL-03 is, of course, substantially more white that Brown’s current district. Duval as a whole is a Republican-leaning jurisdiction, so far as I can tell, but I’m not sure what it is once you’ve removed its whitest 170k worth of Census blocks.

Alternate Maps

Here are the three alternate scenarios I mentioned in the introduction: a majority-minority north Florida district, detaching Lakeland instead of Kissimmee from FL-12, and a majority-African-American Palm Beach-Broward district.

Minority-Majority North Florida
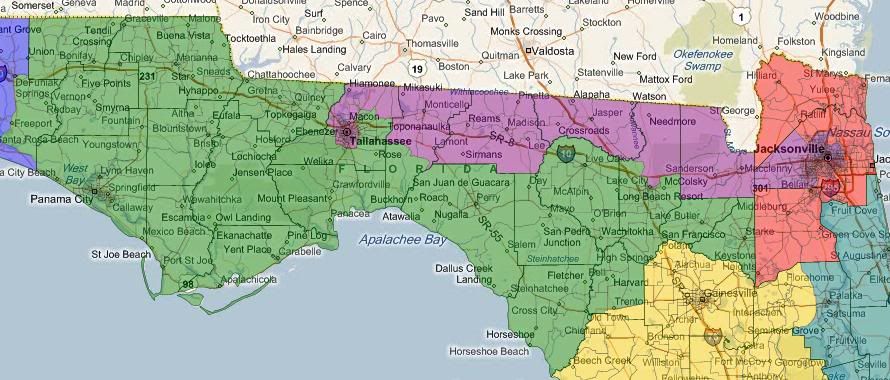
This involves shifting around the main map’s FL-02, FL-03, and FL-04 – everything else is unchanged.

ALT-02 – Green – Eastern Panhandle (VRA: W 74%, B 18%)

ALT-03 – DarkMagenta – Tallahassee to Jacksonville (VRA: W 49%, B 41%)

ALT-04 – Red – Jacksonville suburbs (VRA: W 77%, B 11%)

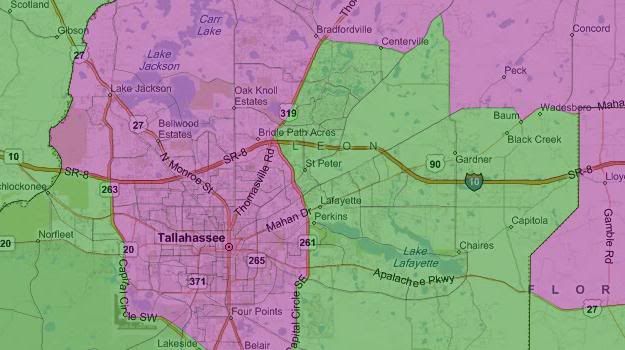
This is a bare-bones version of a north Florida majority-minority district, covering Tallahassee inside the Capital Circle highway, northern Leon County to connect eastward, all but the southernmost block of Jefferson County, all of Madison and Hamilton Counties, only the northernmost block of Columbia County to connect eastward, all of Baker County, and then much of interior Duval County, where I tried to strike a balance between compactness and minority-heaviness. ALT-02 takes in the area from Bradford County west. ALT-04 takes in the remainder.

ALT-03 could be made more minority; I just decided that the price wasn’t worth it. For example, Gadsden County, to the west of Tallahassee, is a 54% African American jurisdiction with a population of about 45k, but adding it would require sacrificing either the relatively clean lines in Leon County or the very clean line between Bradford and Clay Counties.

Here are closeups of Leon and Duval Counties.


Detaching Lakeland Instead of Kissimmee

It’s possible to detach Lakeland from Polk instead of Kissimmee from Osceola to make FL-12 work. This results to two subscenarios. Either way, the new ALT-12 has VRA stats of W 59%, H 25%, B 11%.

The simpler scenario is to just swap Lakeland and Kissimmee between FL-10 and FL-12.
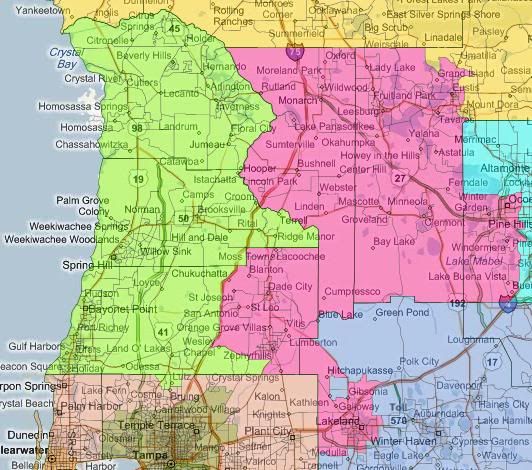
This results in an ALT-08A with VRA stats of W 73%, H 12%, B 11%.

Alternatively, from that point, you could choose other county splits between FL-10 and FL-11. For example, you could consolidate Pasco into one district, picking up Lakeland and that little bit of leftover Hillsborough, leaving you about 65k short of a district. Splitting Hernando now instead of Pasco to get that 65k results in this.
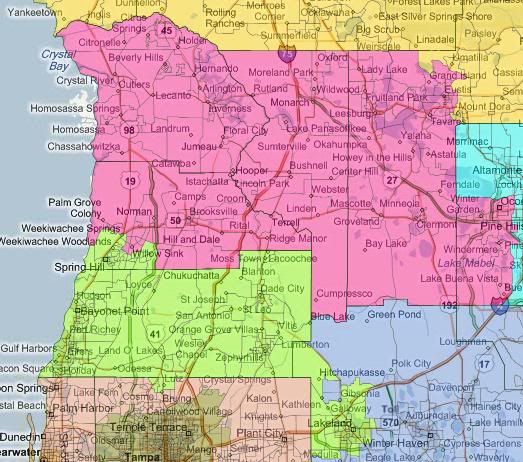
ALT-10B has VRA stats of  W 79%, H 10%. ALT-11B has VRA stats of W 80%, H 10%.

Choosing between any of these three scenarios (the main and the two sub scenarios) is essentially arbitrary from a demographic standpoint. Without partisan motivation, explicitly disallowed by the Fair Districts standpoint, I’m not sure why you’d choose one over the others. I also have no idea which one of the three scenarios would be most favorable to Democrats.

Majority African American Palm Beach-Broward

It looks like this:
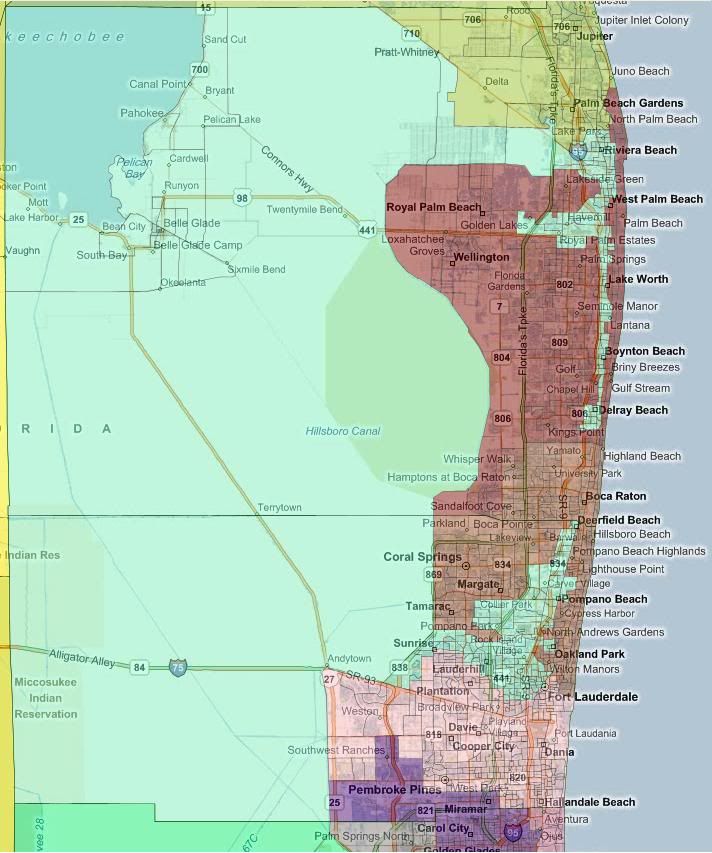
I swapped colors around for working purposes and forgot to put them back for display purposes, so for this map only ALT-20 is the light blue one and ALT-23 is the pink one. ALT-21 is the redder of the two browns; ALT-22 is the other district.

ALT-20 – VRA: B 51%, W 27%, H 19%

ALT-21 – VRA: W 67%, H 18%, B 11%

ALT-22 – VRA: W 72%, H 16%

ALT-23 – VRA: W 53%, H 28%, B 13%

Politically, I don’t think it matters. It mostly whether this district is legally required.

Summary

Since my grasp of Florida politics is not a firm as I’d like, this is pretty tentative. But the rough upshot is that I think that Fair Districts is worth about three districts to the Democrats: West’s, Young’s, and the new Orlando seat. Which I think is a pretty common view anyway.

The goal of this wasn’t to figure out the politics anyway. It was to try to figure out how few boundaries can be broken. Please let me know if you see anyway to improve the map on that score.
Census 2010 Quick Cuts: A 5-5-1 Virginia

As David posted earlier, Census data for the first four states has been released.

Democrats don’t control redistricting in Virginia…but that doesn’t mean it wouldn’t be interesting to see what could happen.

Here’s one proposal, a 5-5-1 map, with the swing district being perfect for a Tom Perriello comeback.

Greetings, loved ones.  Let’s take a journey…

We’ll start out in Hampton Roads:


County Pop Black% Hisp% Asian% Obama% McCain% Deeds% McD%
1 727,092 14.63% 4.50% 3.69% 40.87% 58.15% 30.98% 68.93%
Accomack 33,164 28.05% 8.59% 0.55% 48.69% 50.14% 37.56% 62.42%
Chesapeake City 142,972 19.74% 3.66% 3.08% 40.39% 58.73% 31.76% 68.16%
Gloucester 36,858 8.67% 2.54% 0.78% 35.98% 62.89% 27.77% 72.09%
Hanover 61,394 7.67% 2.06% 1.54% 29.98% 69.24% 20.95% 78.94%
James City 56,095 11.96% 4.01% 2.26% 44.34% 54.78% 33.85% 66.03%
Mathews 8,978 9.17% 1.16% 0.35% 35.55% 63.53% 29.96% 69.92%
Middlesex 10,959 18.05% 1.51% 0.34% 39.81% 59.02% 30.43% 69.52%
New Kent 18,429 13.48% 2.12% 0.88% 34.96% 63.91% 25.47% 74.43%
Northampton 12,389 36.55% 7.05% 0.67% 57.70% 41.19% 48.86% 51.03%
Poquoson City 12,150 0.64% 1.82% 2.14% 24.74% 74.01% 19.78% 80.16%
Virginia Beach City 301,190 14.05% 5.77% 5.97% 44.17% 54.80% 33.24% 66.67%
York 32,514 6.34% 3.29% 3.56% 35.23% 63.69% 27.26% 72.65%

Rob Wittman’s 1st district shifts eastward, now taking in part of the Northern Neck, the Virginia section of the Delmarva, and parts of Virginia Beach and Chesapeake City. A side consequence of this would be the turf war between Wittman and Scott Rigell, as this district is 22% from the old 1st and 48% from the old 2nd. Nothing much else to see here, Obama lost by 17, Deeds by 38, Steve Shannon (2009 Dem AG nominee) by 35, and Jody Wagner (2009 Dem LG nominee) by 29.


County Pop Black% Hisp% Asian% Obama% McCain% Deeds% McD%
2 727,700 38.14% 7.08% 3.93% 64.62% 34.46% 51.85% 48.03%
Chesapeake City 79,237 47.98% 5.64% 2.50% 69.76% 29.49% 59.19% 40.73%
Hampton City 96,757 42.01% 4.83% 2.51% 63.23% 35.91% 50.30% 49.57%
James City 10,914 19.20% 7.07% 2.19% 48.64% 50.46% 36.88% 63.09%
Newport News City 114,167 34.85% 9.71% 3.75% 60.62% 38.53% 46.36% 53.53%
Norfolk City 242,803 43.11% 6.65% 3.29% 71.03% 28.06% 60.08% 39.79%
Virginia Beach City 136,804 31.89% 8.49% 6.42% 62.03% 37.00% 46.33% 53.57%
Williamsburg City 14,068 13.99% 6.69% 5.74% 63.77% 34.67% 54.60% 45.26%
York 32,950 20.30% 5.53% 6.21% 47.38% 51.55% 35.25% 64.58%

Bobby Scott’s current 3rd is clearly overpacked, with the choicest parts of Hampton, Norfolk, Newport News, and Portsmouth dumped into his district. We unpack the 3rd a bit, lending some of its Democratic strength here.  This new district contains the entirety of Norfolk, parts of Newport News, Chesapeake, and VA Beach.  There’s also an arm to grab Williamsburg,  one of the few instances in this area of relatively white precincts voting Dem.  19% old 1st, 37% old 2nd, and 33% old 3rd, we get a district that Obama won by 30% (!!), and was even carried by all three Dems in 2009.


County Pop Black% Hisp% Asian% Obama% McCain% Deeds% McD%
3 727,246 50.91% 5.89% 1.84% 71.40% 27.79% 60.71% 39.13%
Charles City 7,256 48.42% 1.21% 0.34% 68.34% 31.01% 58.53% 41.38%
Chesterfield 56,895 42.34% 17.85% 2.96% 66.34% 32.93% 54.21% 45.58%
Hampton City 40,679 67.49% 3.84% 1.38% 82.45% 16.87% 74.80% 25.03%
Henrico 145,098 51.47% 5.37% 2.45% 70.10% 29.14% 60.91% 38.95%
Hopewell City 22,591 37.04% 6.55% 0.80% 55.49% 43.56% 37.38% 62.39%
Isle Of Wight 22,515 26.29% 1.91% 0.95% 44.01% 55.21% 34.97% 64.94%
Newport News City 66,552 50.67% 3.76% 1.01% 68.96% 30.31% 55.37% 44.52%
Petersburg City 32,420 79.11% 3.75% 0.82% 88.64% 10.19% 80.99% 18.97%
Portsmouth City 95,535 53.26% 3.06% 1.07% 69.27% 29.97% 59.76% 40.18%
Prince George 26,433 35.43% 6.87% 1.67% 47.60% 51.60% 31.72% 68.17%
Richmond City 204,214 50.60% 6.27% 2.33% 79.09% 20.03% 69.23% 30.55%
Surry 7,058 46.10% 1.22% 0.34% 60.72% 38.45% 53.61% 46.18%

The 3rd, having been unpacked, sees its black percentage drop from 56% to 51%. However, the VAP also remains over 50% African-American. In what would be a relief to Randy Forbes, Petersburg is removed from this district, which becomes more Richmond-centric. 59% old 3rd, 20% old 7th, and 15% old 4th. Obama dominated here (no surprise), and all three Dems in 09 scored 20%+ wins.


County Pop Black% Hisp% Asian% Obama% McCain% Deeds% McD%
4 727,955 17.68% 3.79% 3.88% 42.13% 56.97% 30.93% 68.95%
Amelia 12,690 23.10% 2.29% 0.21% 38.11% 60.81% 28.85% 71.10%
Chesterfield 259,341 17.48% 4.90% 3.32% 42.25% 56.88% 30.45% 69.38%
Colonial Heights City 17,411 10.24% 3.87% 3.32% 28.95% 69.63% 16.83% 83.14%
Dinwiddie 28,001 32.87% 2.41% 0.44% 48.45% 50.62% 37.34% 62.60%
Fluvanna 25,691 15.33% 2.96% 0.57% 48.57% 50.41% 36.48% 63.39%
Franklin City 4,422 25.28% 2.53% 1.40% 38.99% 60.08% 32.73% 67.27%
Goochland 21,717 19.25% 2.10% 1.04% 38.31% 60.84% 29.11% 70.77%
Hanover 38,469 11.95% 2.21% 1.05% 37.48% 61.65% 28.09% 71.75%
Henrico 161,837 9.88% 4.46% 10.20% 43.75% 55.40% 31.29% 68.58%
Isle Of Wight 12,755 21.90% 1.79% 0.53% 40.77% 58.29% 32.36% 67.61%
Louisa 33,153 17.71% 2.30% 0.48% 45.45% 53.29% 34.58% 65.34%
Nottoway 15,853 39.28% 3.84% 0.32% 48.84% 50.07% 41.58% 58.28%
Powhatan 28,046 13.63% 1.79% 0.47% 29.31% 69.78% 20.03% 79.85%
Prince George 9,292 22.22% 2.60% 1.10% 38.52% 60.75% 29.86% 70.09%
Southampton 8,698 24.88% 0.86% 0.39% 39.95% 59.19% 33.08% 66.89%
Suffolk City 41,589 27.77% 2.93% 2.29% 44.48% 54.73% 35.79% 64.17%
Sussex 8,990 57.33% 2.49% 0.46% 57.72% 41.49% 42.28% 57.72%

With the eastward shift of the 1st, the 4th and 7th also rotate accordingly along the Richmond-Norfolk axis created by the 2nd and 3rd. Nothing to see here, other than we’ve cut out part of Forbes base and drew in much of the old 7th (53% is from the old 7th, compared to 43% old 4th). But Cantor could clearly run in the new 7th and Forbes in the new 4th.  Dems in 09 lost by 30%+.


County Pop Black% Hisp% Asian% Obama% McCain% Deeds% McD%
5 727,351 29.89% 3.43% 2.03% 57.47% 41.45% 47.35% 52.54%
Albemarle 98,970 9.70% 5.47% 4.67% 58.43% 40.36% 49.41% 50.48%
Amherst 12,637 22.50% 1.75% 0.51% 47.46% 51.77% 38.61% 61.39%
Brunswick 17,434 57.31% 1.71% 0.28% 62.84% 36.35% 49.41% 50.49%
Buckingham 17,146 35.08% 1.68% 0.37% 49.89% 49.01% 36.60% 63.40%
Charlotte 12,586 29.80% 1.91% 0.21% 43.93% 54.77% 33.24% 66.62%
Charlottesville City 43,475 19.41% 5.11% 6.37% 78.35% 20.35% 73.65% 26.21%
Cumberland 10,052 32.61% 1.80% 0.35% 47.73% 51.19% 35.87% 64.09%
Danville City 43,055 48.30% 2.89% 0.94% 59.13% 40.02% 44.93% 54.96%
Emporia City 5,927 62.53% 4.42% 0.73% 65.04% 34.28% 47.57% 52.35%
Franklin 38,514 8.83% 2.68% 0.49% 39.06% 59.55% 31.66% 68.25%
Franklin City 4,160 90.53% 0.70% 0.05% 94.65% 4.88% 91.81% 8.06%
Greensville 12,243 59.80% 1.41% 0.29% 63.88% 35.38% 52.64% 47.36%
Halifax 36,241 36.68% 1.62% 0.37% 48.23% 51.04% 38.25% 61.53%
Henry 11,930 39.81% 5.58% 0.45% 57.61% 41.49% 51.27% 48.73%
Lunenburg 12,914 34.75% 3.64% 0.19% 47.84% 51.33% 37.45% 62.52%
Lynchburg City 25,110 53.21% 2.53% 0.67% 71.04% 27.58% 61.07% 38.72%
Martinsville City 13,821 44.95% 3.99% 0.93% 63.48% 35.44% 51.66% 48.18%
Mecklenburg 32,727 36.82% 2.46% 0.67% 47.26% 51.83% 32.32% 67.67%
Montgomery 46,128 3.37% 2.88% 7.02% 58.99% 39.52% 53.93% 45.87%
Nelson 15,020 13.10% 3.06% 0.45% 53.99% 44.84% 46.23% 53.67%
Pittsylvania 37,893 26.92% 1.56% 0.19% 42.81% 56.26% 32.76% 67.24%
Prince Edward 23,368 33.19% 2.25% 0.88% 54.34% 44.46% 44.95% 54.97%
Roanoke 3,003 3.13% 0.93% 0.27% 40.93% 57.70% 31.39% 68.51%
Roanoke City 97,032 28.46% 5.51% 1.76% 61.15% 37.76% 51.89% 48.01%
Southampton 9,872 48.14% 1.30% 0.12% 57.84% 41.21% 48.82% 51.13%
Suffolk City 42,996 57.15% 2.78% 0.92% 69.00% 30.31% 55.41% 44.47%
Sussex 3,097 60.35% 1.42% 0.23% 69.11% 30.45% 57.34% 42.66%

A leaner, meaner 5th for Tom Perriello.  We could have also tried to bring back Rick Boucher, but when you’re forced to decide between a young up-and-coming progressive vs. a career Blue Dog in a more hostile district, the choice is obvious. This is a pretty blatant gerrymander, meant to string together all the Dems in Southside and to connect them to Dems in Charlottesville, Roanoke, … and even Blacksburg. The result is a district Obama won by 16%, a massive improvement from the 3% loss he earned in the old 5th.  63% of the population is retained, along with 19% of the old 6th. Deeds kept it respectable, losing by 5; Shannon lost by 6 and Wagner by 3.


County Pop Black% Hisp% Asian% Obama% McCain% Deeds% McD%
9 727,482 4.65% 1.92% 0.90% 37.28% 61.12% 30.64% 69.28%
Bland 6,824 3.34% 0.57% 0.26% 29.20% 68.64% 24.06% 75.88%
Bristol City 17,835 5.66% 1.24% 0.68% 36.21% 62.22% 27.48% 72.44%
Buchanan 24,098 2.56% 0.39% 0.22% 46.52% 51.99% 36.74% 63.22%
Carroll 30,042 0.59% 2.58% 0.18% 32.67% 65.08% 26.96% 72.97%
Craig 5,190 0.10% 0.69% 0.15% 33.46% 64.67% 32.17% 67.76%
Dickenson 15,903 0.32% 0.54% 0.11% 48.54% 49.22% 39.46% 60.46%
Floyd 15,279 1.83% 2.70% 0.23% 39.08% 59.09% 34.08% 65.77%
Franklin 17,645 6.66% 2.23% 0.35% 34.81% 63.58% 29.69% 70.26%
Galax City 7,042 6.23% 14.04% 0.53% 43.80% 54.83% 37.38% 62.40%
Giles 17,286 1.51% 1.21% 0.32% 40.95% 57.24% 36.56% 63.35%
Grayson 15,533 2.06% 2.68% 0.10% 34.35% 62.88% 29.71% 70.29%
Henry 42,221 16.80% 4.45% 0.43% 39.85% 58.67% 32.38% 67.61%
Lee 25,587 3.70% 1.59% 0.22% 34.89% 63.13% 25.71% 74.27%
Montgomery 48,264 4.48% 2.50% 3.89% 41.25% 57.32% 35.04% 64.83%
Norton City 3,958 6.32% 1.72% 1.41% 49.14% 49.21% 39.34% 60.55%
Patrick 18,490 5.87% 2.40% 0.23% 33.75% 64.37% 29.86% 70.04%
Pittsylvania 25,613 14.91% 2.89% 0.42% 30.51% 68.54% 23.11% 76.89%
Pulaski 34,872 5.04% 1.24% 0.51% 39.32% 58.85% 34.84% 65.12%
Radford City 16,408 7.79% 2.35% 1.56% 53.97% 44.54% 45.33% 54.56%
Roanoke 59,667 5.22% 2.27% 3.29% 39.92% 58.89% 32.83% 67.01%
Russell 28,897 0.81% 0.95% 0.18% 42.91% 55.59% 37.55% 62.42%
Salem City 24,802 7.11% 2.42% 1.62% 41.63% 57.13% 33.39% 66.45%
Scott 23,177 0.58% 1.01% 0.16% 27.59% 70.68% 21.14% 78.81%
Smyth 32,208 1.99% 1.64% 0.25% 34.46% 63.54% 26.38% 73.53%
Tazewell 45,078 2.96% 0.66% 0.64% 32.80% 65.65% 26.58% 73.36%
Washington 54,876 1.26% 1.32% 0.37% 32.91% 65.62% 25.10% 74.87%
Wise 41,452 5.16% 1.14% 0.34% 35.33% 63.05% 29.55% 70.33%
Wythe 29,235 2.80% 0.96% 0.44% 32.88% 65.70% 27.24% 72.63%

There simply isn’t enough Democratic strength down here to support both Perriello and Boucher, and protecting Boucher would likely be a poor investment given the political trends.  We cede this district to Morgan Griffith, who retains 81% of his current territory.  With the adjustments to help Perriello, we see a bit of a shift rightward, with Obama losing by 24. Again, all the 09 Dems lost by 35%+.


County Pop Black% Hisp% Asian% Obama% McCain% Deeds% McD%
6 726,966 7.04% 3.79% 1.10% 36.94% 61.83% 29.18% 70.72%
Alleghany 16,250 4.68% 1.08% 0.23% 48.22% 50.41% 61.23% 38.71%
Amherst 19,716 16.76% 2.05% 0.46% 38.06% 60.93% 28.68% 71.25%
Appomattox 14,973 20.08% 1.12% 0.23% 34.61% 64.26% 25.65% 74.33%
Augusta 73,750 3.97% 2.07% 0.50% 29.47% 69.35% 22.53% 77.40%
Bath 4,731 4.69% 2.13% 0.15% 42.89% 55.47% 63.47% 36.47%
Bedford 68,676 5.74% 1.59% 1.03% 30.75% 68.16% 22.87% 77.07%
Bedford City 6,222 20.19% 2.15% 0.66% 44.18% 54.75% 35.25% 64.75%
Botetourt 33,148 3.03% 1.07% 0.53% 32.71% 65.90% 28.56% 71.26%
Buena Vista City 6,650 5.22% 1.55% 0.44% 45.73% 52.91% 39.05% 60.95%
Campbell 54,842 14.16% 1.67% 1.00% 31.34% 67.58% 22.90% 76.92%
Covington City 5,961 12.51% 1.54% 0.57% 55.40% 43.33% 65.79% 34.07%
Frederick 42,487 2.93% 4.92% 0.80% 36.23% 62.27% 23.78% 76.07%
Greene 18,403 6.34% 4.24% 1.40% 38.43% 60.29% 27.37% 72.53%
Harrisonburg City 48,914 6.36% 15.67% 3.51% 57.54% 41.21% 42.16% 57.67%
Highland 2,321 0.26% 0.78% 0.17% 37.97% 59.85% 44.93% 55.07%
Lexington City 7,042 9.66% 3.85% 2.20% 62.24% 36.87% 60.53% 39.34%
Lynchburg City 50,458 17.40% 3.30% 3.37% 37.43% 61.36% 30.31% 69.59%
Madison 13,308 9.78% 1.77% 0.56% 42.72% 56.10% 30.46% 69.47%
Page 24,042 1.94% 1.55% 0.30% 40.76% 58.16% 29.73% 70.15%
Roanoke 29,706 4.84% 1.92% 1.67% 36.46% 62.48% 29.68% 70.19%
Rockbridge 22,307 2.66% 1.33% 0.47% 42.64% 56.22% 41.88% 58.07%
Rockingham 76,314 1.67% 5.34% 0.60% 31.36% 67.40% 21.75% 78.14%
Shenandoah 41,993 1.75% 6.14% 0.52% 35.96% 62.45% 25.00% 74.85%
Staunton City 23,746 12.15% 2.16% 0.78% 50.56% 48.39% 41.40% 58.54%
Waynesboro City 21,006 10.61% 6.36% 0.73% 44.09% 54.35% 30.97% 68.91%

Again, nothing to see here. Goodlatte retains 68% of his old territory, a strip along the Blue Ridge. The 2009 Dems lost by 40%+; Warner only won by 10 here in 2008.


County Pop Black% Hisp% Asian% Obama% McCain% Deeds% McD%
7 727,428 15.09% 7.03% 1.94% 46.08% 52.82% 33.13% 66.74%
Caroline 28,545 29.34% 3.36% 0.62% 55.45% 43.48% 43.47% 56.47%
Clarke 14,034 5.32% 3.49% 0.90% 46.52% 51.68% 36.59% 63.31%
Culpeper 46,689 15.78% 8.90% 1.30% 44.59% 54.26% 29.61% 70.25%
Essex 11,151 38.09% 3.13% 0.77% 54.70% 44.35% 39.19% 60.81%
Fauquier 65,203 8.16% 6.41% 1.28% 42.71% 56.19% 31.10% 68.77%
Frederick 35,818 5.39% 8.59% 1.76% 41.35% 57.16% 26.68% 73.19%
Fredericksburg City 24,286 22.64% 10.73% 2.84% 63.60% 35.27% 50.84% 48.94%
King & Queen 6,945 28.44% 2.65% 0.24% 51.77% 47.58% 41.03% 58.87%
King George 23,584 17.87% 3.35% 1.16% 42.71% 56.22% 29.69% 70.18%
King William 15,935 17.69% 2.03% 0.74% 39.87% 59.20% 28.40% 71.54%
Lancaster 11,391 27.95% 1.04% 0.57% 46.63% 52.57% 35.16% 64.59%
Northumberland 12,330 25.33% 3.10% 0.30% 44.72% 54.56% 34.39% 65.41%
Orange 33,481 12.71% 3.40% 0.73% 44.98% 53.83% 32.66% 67.28%
Prince William 48,819 7.26% 8.41% 5.35% 40.63% 58.36% 29.10% 70.79%
Rappahannock 7,373 4.35% 3.09% 0.53% 47.79% 50.56% 42.20% 57.70%
Richmond 9,254 30.30% 5.51% 0.43% 43.20% 55.86% 31.69% 68.26%
Spotsylvania 122,397 15.25% 7.58% 2.31% 46.05% 52.91% 31.51% 68.35%
Stafford 128,961 16.97% 9.21% 2.81% 46.37% 52.69% 32.44% 67.39%
Warren 37,575 4.62% 3.51% 0.96% 43.39% 55.06% 31.32% 68.58%
Westmoreland 17,454 28.02% 5.74% 0.57% 54.64% 44.40% 41.38% 58.57%
Winchester City 26,203 10.93% 15.42% 2.33% 52.02% 46.66% 39.18% 60.67%

We could try to screw Eric Cantor out of a district, but again, that wouldn’t necessarily be successful. Democratic voters(which would have likely had to come from NoVA) are better kept in the three decently solidly Dem NoVA districts. Without touching the Dems in NoVA though, we still try to draw as Democratic a district as possible, taking in various parts of the Northern Neck and the DC exurbs.  Hopefully, those areas – Fauquier, Culpeper, Winchester, etc. – will keep drifing left as DC’s influence grows. While Obama lost by 7 here, there are still miles to go, with the 09 Dems having lost by 30% or more.  56% of this district is from the old 1st, 17% from the old 7th, and 21% from the old 10th (showing some of the growth it’s experienced).


County Pop Black% Hisp% Asian% Obama% McCain% Deeds% McD%
8 727,839 9.84% 13.29% 11.17% 63.39% 35.60% 53.71% 46.10%
Alexandria City 139,966 21.78% 16.09% 6.02% 71.73% 27.26% 62.76% 37.04%
Arlington 207,627 8.49% 15.11% 9.60% 71.71% 27.12% 65.49% 34.26%
Fairfax 82,317 2.50% 6.38% 16.70% 56.50% 42.63% 48.79% 51.06%
Falls Church City 12,332 4.31% 8.99% 9.42% 69.56% 29.19% 64.92% 34.94%
Loudoun 285,597 7.31% 12.76% 13.32% 53.59% 45.48% 38.92% 60.94%

Again, a shameless gerrymander.  But, we did manage to keep Alexandria and Arlington intact. Jim Moran probably needs a little more support than most Dems, which also factored into this decision. He keeps 52% of his old territory, with the balance coming from the 10th. Obama romped with a 28% victory, and Deeds even scored an 8% win here.


County Pop Black% Hisp% Asian% Obama% McCain% Deeds% McD%
10 726,728 6.69% 14.60% 20.33% 59.46% 39.56% 48.16% 51.68%
Fairfax 677,449 6.75% 14.82% 20.12% 59.69% 39.33% 48.49% 51.34%
Fairfax City 22,565 4.75% 15.76% 15.21% 57.69% 41.16% 46.91% 52.98%
Loudoun 26,714 6.85% 7.98% 29.86% 54.50% 44.69% 37.43% 62.46%

The 10th has grown massively, and accordingly, needed to contract. This iteration of the 10th becomes an almost all-Fairfax affair, with a slight section of Loudoun added. This would have swingy-ish characteristics in bad years, but Obama won by 20 and Deeds only lost by 3.5; both Shannon and Wagner won here as well.  Only 30%, though, is from the old 10th (30%), with more being from the old 11th (54%); this district is probably a bit more inner suburban than outer (think Annandale v. Sterling).


County Pop Black% Hisp% Asian% Obama% McCain% Deeds% McD%
11 727,237 18.72% 21.55% 9.69% 61.05% 38.08% 46.98% 52.89%
Fairfax 321,960 15.98% 19.52% 12.30% 62.16% 36.93% 50.62% 49.23%
Manassas City 37,821 13.72% 31.40% 4.98% 55.17% 43.85% 38.00% 61.92%
Manassas Park City 14,273 12.98% 32.54% 8.97% 59.49% 39.47% 39.83% 60.17%
Prince William 353,183 21.99% 21.90% 7.84% 60.51% 38.66% 43.76% 56.10%

Gerry Connolly’s district shifts southward a bit, taking in more of Prince William County.  But unlike before, this district takes in the southern (and Democratic) part of PW.  Connolly retains 47% of his old territory, but the parts he sheds he won’t necessarily miss.  Interestingly, Obama did better here than in the new 10th (23 point win), but this area swung harder against the Dems in 09, with Shannon and Wagner losing by 1 and Deeds by 6. This, of course, is still an improvement over the 10-point loss Deeds suffered in the current 11th.

SSP Daily Digest: 2/4

CT-Sen: Ex-Rep. Rob Simmons has previously sounded unlikely to run (and rather sulky about it), but now he’s saying he’s “considering” the race and will make a decision by March. He’s also seeking to replace state GOP party chair Chris Healy, who he thinks favored Linda McMahon during the nomination process. Simmons also had some kind words for state Sen. Scott Frantz as an option in case he himself doesn’t run.

FL-Sen: Already having the backing of the man he replaced as state Senate president (John Thrasher), now Mike Haridopolos got the endorsement of the Republican leader of the other chamber, state House speaker Dean Cannon. (Not that those kinds of endorsements move a lot of actual votes, but this could be harmful in the behind-the-scenes game to former state House majority leader Adam Hasner if he runs, as he’d probably have expected Cannon’s help.)

MA-Sen, MA-06: Rep. John Tierney didn’t sound much like a candidate in the Senate race when asked about it at an appearance with area high schoolers, saying he’s focused on his current job and plans to run again. That, on top of Barney Frank’s announcement yesterday that he’s running again (and the months-ago announcement from John Olver that he’s running again) point to an increasing likelihood that two of the state’s 10 Dem Congresspeople will have to face off in a primary (unless either Mike Capuano or Stephen Lynch roll the dice on a Senate bid). One other total wild card here that came into sharper relief today: John Kerry seems to be amping up his lobbying to become Secretary of State. While there’s no indication that Hillary Clinton is in any hurry to leave, that does raise the specter of another special election if there’s a changing of the guard at SoS after the 2012 election. That possibility, and the chance at an open seat run instead of going up against Scott Brown’s millions, might induce Capuano and Lynch to keep their House jobs for now.

NE-Sen: PPP gives AG Jon Bruning a substantial lead in the GOP Senate primary, for the right to take on Ben Nelson. He leads state Treasurer Don Stenberg 47-19, with throw-ins Pat Flynn and Deb Fischer at 7 and 6 apiece. Bruning’s faves among Republicans are 57/12.

VA-Sen: Jamie Radtke, the principal tea party opponent to George Allen in the GOP Senate primary so far, has shown she can compete, at least on the financial front. She raised $100K in the fourth quarter; Allen didn’t report anything since his candidacy didn’t launch until the new year.

WA-Gov, WA-AG: Democratic Rep. Jay Inslee is launching some rhetorical salvos in Republican AG Rob McKenna’s direction over health care reform in what’s very likely the beginnings of the 2012 gubernatorial general election; McKenna is one of the few blue-state AGs who signed on to the multi-state suit against HCR implementation, a possible foot-shooting move that seems more oriented toward fending off primary opposition from the right than enhancing his electability in November. By the way, if you’re wondering about who’s planning to replace McKenna in the AG slot, there’s word that ambitious King County Councilor Bob Ferguson is about to announce his candidacy next week. His likeliest GOP opponent is fellow King County Councilor (and progeny of WA-08’s Jennifer Dunn) Reagan Dunn.

WV-Gov: It looks like we finally have some consensus on when that pesky special election for Governor is going to be. The state House and Senate ironed out a compromise that will hold the primary on May 14 and the general election on Oct. 4. Acting Gov. (and candidate) Earl Ray Tomblin has agreed to sign off on the deal, even though it contains a different primary date than he wanted.

IA-03: Here’s some more evidence that 77-year-old Leonard Boswell is seriously gearing up for a 2012 battle to stay in the House, despite possibly facing two major opponents (first Christine Vilsack in a Dem primary, then Tom Latham in a redistricting-forced general). He named his former campaign manager Julie Stauch as his new chief of staff. (His fundraising may say otherwise, though; see below.)

LA-03, LA-AG: Jeff Landry, who’s been in the House all of one month, is the likeliest Rep. to get squeezed in a 6-district map of Louisiana, by virtue of his lack of seniority and depopulation in his district (and the need to keep next-door LA-02 a VRA district). So, it seems sensible that he’s already contemplating some alternate plans. Rumors are flying now that the reason that AG Buddy Caldwell is planning switch over to the Republican party is because Landry is looking at challenging Caldwell in this year’s AG race (although Caldwell’s switch would just move that challenge to the primary, if it goes through). David Rivera might not even have the shortest stay among this year’s freshman class, if Landry wins the AG race and leaves the House after one year.

Fundraising: This Politico piece on fundraising among House members has some interesting red flags from Q4 that may portend retirement. On the GOP side, CA-41’s Jerry Lewis raised $1,700, while MD-06’s Roscoe Bartlett raised all of $0. For the Dems, NY-05’s Gary Ackerman raised $924, NY-28’s Louise Slaughter raised $320, and MI-05’s Dale Kildee raised the strangely specific sum of $1.42. They also point to how fundraising may have dried up for several likely casualties of redistricting, including MI-09’s Gary Peters (down to $88K CoH), IA-03’s Leonard Boswell ($66K CoH), PA-12’s Mark Critz (net negative-$36K), and LA-03’s Jeff Landry (net negative-$24K).

Redistricting: As expected, the battle over Florida’s Fair Districts initiative is moving into the courts, starting with a new suit filed by the amendments’ backers (including the League of Women Voters and NAACP) demanding that Rick Scott re-engage the process of seeking VRA preclearance for the chances to Florida’s system. (Scott has apparently been dragging his feet on preclearance in hopes that the initiative’s requirements won’t be in place by the time of 2012 redistricting, which could let the GOP legislature gerrymander to their hearts’ content.) Meanwhile, the GOP legislature in Georgia is already consolidating their power to take advantage of their control of the trifecta there: they removed primary responsibility for map-drawing from the nonpartisan Carl Vinson Institute at UGA, and instead are creating a new Legislative and Congressional Reapportionment Office more directly under their control.

Census: If you tried to open the ftp version of the new Census data yesterday and found yourself looking at incomprehensible txt files (that, if you scroll through them quickly enough, look like you’re able to see through The Matrix), fear not. They’re available via American FactFinder now, and even through interactive widget form.

FEC: I’m not sure how many max-out donors we have among our readership, but the FEC has raised contribution limits for this cycle, meaning you can give a little more to your favorite candidate or committee before hitting the ceiling. You can now give up to $2,500 per candidate and $30,800 per committee.

Trivia: I had absolutely no idea this number was so low: there have been only four open seat Senate races in Texas since the 1920s. (Not only do Senators there tend to have long tenures, but vacancies tend to manifest themselves in special elections.) The races were in 1948, 1952, 1984, and 2002.

LA, MS, NJ, VA: Population by CD for First Four States

As devoted Swingnuts are aware by now, the Census Bureau has produced its first batch of redistricting-level data. Because Louisiana, Mississippi, New Jersey and Virginia all have state-level elections this year, they get bumped to the head of the line. So that means we now know the current population of each congressional district as presently drawn. While the Census Bureau didn’t exactly make this data available in the most accessible format, the greasemonkeys down in the Skunkworks at SSP Labs have crunched the numbers, and here’s what they look like. Note that the “Deviation” column means how far off each current district is from the new ideal (and in the case of LA and NJ, we divided by their new seat totals of 6 and 12 respectively):


District Population Deviation
LA-01 686,961 (68,601)
LA-02 493,352 (262,210)
LA-03 637,371 (118,191)
LA-04 667,109 (88,453)
LA-05 644,296 (111,266)
LA-06 727,498 (28,064)
LA-07 676,785 (78,777)
Total: 4,533,372


District Population Deviation
MS-01 788,095 46,271
MS-02 668,263 (73,561)
MS-03 756,924 15,100
MS-04 754,015 12,191
Total: 2,967,297


District Population Deviation
NJ-01 669,169 (63,489)
NJ-02 692,205 (40,453)
NJ-03 680,341 (52,317)
NJ-04 724,596 (8,062)
NJ-05 666,551 (66,107)
NJ-06 668,806 (63,852)
NJ-07 672,885 (59,773)
NJ-08 660,424 (72,234)
NJ-09 661,379 (71,279)
NJ-10 634,343 (98,315)
NJ-11 674,349 (58,309)
NJ-12 701,881 (30,777)
NJ-13 684,965 (47,693)
Total: 8,791,894


District Population Deviation
VA-01 786,237 58,871
VA-02 646,184 (81,182)
VA-03 663,390 (63,976)
VA-04 738,639 11,273
VA-05 685,859 (41,507)
VA-06 704,056 (23,310)
VA-07 757,917 30,551
VA-08 701,010 (26,356)
VA-09 656,200 (71,166)
VA-10 869,437 142,071
VA-11 792,095 64,729
Total: 8,001,024

SSP Daily Digest: 2/3

CT-Sen: This is starting to sound like a broken record, but Rep. Joe Courtney is in the news again for saying that he’s still vaguely interested in getting into the Dem Senate primary. At least he has a somewhat more definite timetable, saying he’ll decide “by the end of this month.”

FL-Sen: Quinnipiac is out with its first Florida poll of the 2012 cycle, and it’s remarkably similar to the other polling they’ve been doing so far this cycle (like OH and PA): they find a surprisingly high number of people with no opinion about the incumbent Democrat, and find him polling in the mid-40s on a generic ballot question, but still winning by an OK margin. Bill Nelson’s specific numbers vs. Generic R are 41-36; his approvals are pretty good at 45/21 and his re-elect is 43/33. On a related note, Nelson has the most cash of any Dem heading into 2012, in what, if only by virtue of the state’s population, may be 2012’s most expensive Senate race; he has more than $3 million CoH.

MA-Sen, MA-04: I was a little surprised to see Barney Frank’s name even on the long list of potential candidates for the Massachusetts Senate race – he’s 70 years old and, if for some reason there’s a Democratic wave election in 2012 he could get his gavel back – so it’s not unusual to see his announcement today that he’s running for another term in the House in 2012.

MN-Sen: Courtesy of Minnesota Public Radio, here’s a long list of additional Republicans who aren’t running for Senate in Minnesota. (The list of ones who are running would be more interesting but is much shorter, since it has zero names on it, with the possible exception of Harold Shudlick, who lost the 2006 Senate nomination with a proto-teabag candidacy.) Most notably it includes former state Rep. Laura Brod (who’s apparently on the short list to become a Univ. of Minnesota Regent instead), but also state Sen. Julie Rosen, state Sen. David Hann, Hennepin Co. Sheriff Rich Stanek, attorney Ron Schutz, and Bill Guidera, who is the state party’s finance chair but is employed as “lobbyist for News Corp.”  A Roll Call article from several weeks ago buried a few other “no thanks” too: businesswoman Susan Marvin, former T-Paw CoS Charlie Weaver, and former state Rep. Paul Kohls. (H/t Brian Valco.)

MT-Sen, MT-AL: After a lot of rumors last week, it’s official as of today: Republican Senate candidate Steve Daines is dropping down to the open seat House race, where he probably becomes something of a frontrunner (rather than a speed bump for Denny Rehberg). He can transfer over the $200K he raised for his Senate race. The Fix has some additional names who might consider the House race (in addition to Democratic state Rep. Franke Wilmer, who started floating her name several days ago): businessman Neil Livingstone and state Sen. Roy Brown for the GOP, and state Sen. minority whip Kim Gillan, state Sen. Larry Jent, up-and-coming state Sen. Kendall Van Dyk (netroots candidate, anybody?), or attorney Tyler Gernant.

WI-Sen: Is this the opening salvo of the 2012 Senate race? It comes from a familiar face (one who lost the 1998 Senate general election and 2010 GOP gubernatorial primary), ex-Rep. and real estate development magnate Mark Neumann. He engaged in the traditional pre-announcement tactic of penning an op-ed attacking the incumbent, in this case Herb Kohl and his vote against HCR repeal. If so, it would set up the battle of the self-funders.

WV-Sen: The NRSC is out with its first ad of the cycle, and they’re getting right to work going after Joe Manchin, after he surprised at least some people by keeping ranks with the Dems and voting against HCR repeal. No trucker hats or plaid here… instead, they seem to be taking that “San Francisco values” (read: gay gay gay!) tack pioneered by Sam Graves in a notorious MO-06 ad in 2008, by comparing joined-at-the-hip pals Barack Obama and Joe Manchin to other legendary campy duos, like Sonny and Cher, and Siegfried and Roy.

IN-Gov: Somebody’s not waiting for Mike Pence to make his move on the Indiana governor’s race! I say “somebody” because I really have no idea who this guy is, although he’s one step up from Some Dude by virtue of having been a Hamilton County Commissioner. Jim Wallace is the first to actually say he’ll seek the Republican nomination; he’s touting his business background (as a consultant to health insurance companies).

WV-Gov: I’m not sure I’ve ever seen such a chaotically-planned election before, but now the state House and Senate in West Virginia can’t agree on what date they’re going to set for the special election to replace Joe Manchin. The House moved it up to Sep. 13, but then the Senate’s bill kept it at Oct. 4, which was the date proposed by Earl Ray Tomblin. At least they’re in agreement on the primary date, June 20. (There’s also a rundown on filings so far: the three Dems to file are the one’s you’d expect (Tomblin, Natalie Tennant, and Rick Thompson), while in addition to two expected GOPers (Betty Ireland, Mark Sorsaia), there’s also one whose name I hadn’t heard before, state Del. Patrick Lane.

FL-25: You know you’re in for a short stay in the House when the Beltway media is already compiling lists of likely successors during your first month on the job. The Fix’s list of possible Republicans who might pick up after David Rivera in the event of a resignation/expulsion includes state Sen. Anitere Flores, former state Sen. Alex Villalobos, state Sen. Miguel Diaz de la Portilla, Miami-Dade school board member Carlos Curbelo, and former state Rep. J.C. Planas.

MS-LG: With Lt. Gov. Phil Bryant the likeliest person to become Mississippi Governor in 2011, the jockeying to become Lt. Gov in 2011 (and thus probably become Governor in 2019) is underway. Republican state Treasurer Tate Reeves is the first to announce his bid.

DCCC/Crossroads: The announcement that they were targeting 19 vulnerable Republicans this early in the cycle was a good move for the DCCC, but a lot of the wind subsequently went out of their sails when it was revealed (courtesy of Nathan Gonzales) that the effort was really more of a press release backed up by tiny radio ad buys, with a total of about $10,000 spent, working out to about $500 per member (and as low as $114 in VA-05, which is a cheap market, but still…). That was met by a retaliatory buy from the Karl Rove-linked GOP dark money outfit American Crossroads, where the clearly telegraphed subtext was “You’re broke; we have money.” They spent $90,000 to air radio ads in those same markets, which at less than $5,000 per member is still chicken feed but, in terms of The Math, noticeably larger. Of course, that $114 is a pretty good return on investment, if it got Robert Hurt publicly backpedaling on just how much he wants to cut infrastructure spending.

Mayors: The Las Vegas mayoral race just took an interesting turn yesterday, when former school board president (and more notably, wife of outgoing mayor-for-life Oscar Goodman) Carol Goodman reversed course and said that she would, in fact, run for mayor. By virtue of name rec, that may catapult her to the front of the line.

Redistricting: This may be our first-ever episode of Swingnuts in the News, but Josh Goodman (now writing for Stateline) has an interview with Dave Bradlee (of Dave’s Redistricting App fame) in his new article on the rise of DIY redistricting in general. (He also briefly cites abgin’s now-legendary map of New York state.) He also points out that at least two states, Idaho and Florida, will make similar applications available online for tinkerers, as well as the Public Mapping Project’s efforts to create a more comprehensive public service.

Census: The 2010 data for Louisiana, Missisippi, New Jersey, and Virginia is out… at least in cumbersome FTP form. American FactFinder won’t have the data until later today or tomorrow. (Looks like Dave Wasserman’s already cracked open the data and has tweeted one interesting tidbit: New Orleans’ population came in 29.1% lower than 2000, and even 3.1% below the 2009 ACS estimate.

2R-1D Gerrymander of NM

Just for fun, I decided to see how pro-GOP you could make a map of New Mexico. My strategy was to pack as many Democrats as possible into a super-Democratic district running from Albuquerque up along the Rio Grande, thus making the other districts as Republican as possible. This is what I came up with:


The districts are:

NM-01 (Blue)

32% W, 6% N, 57% H

74%O-25%M

NM-02 (Green)

44% W, 18% N, 34% H

49%O-50%M

NM-03 (Purple)

49% W, 44% H

48%O-50%M

Two McCain districts in a state that voted for Obama by a 15% margin. That’s what horrendously ugly gerrymandering like this can do. You could actually get the blue district up to the high 70’s by taking it into the Navajo Reservation area, but that would inevitably end up splitting up the Navajo Reservation which was too much for even this map. What’s really interesting to me about this map is that all of the districts are majority-minority here, but two of them still vote Republican.

Safe 11-5 GOP in Ohio

I have done a couple things I’ve never seen anywhere else in an Ohio map.  I’m not sure if it’s good or bad.

Here’s the state:

Photobucket

Let’s start in the Southwest

Photobucket

1st-yellow: Steve Chabot

Chabot loses some bluer precincts to the east and expands into the suburbs, probably making this Likely R rather than Toss-Up.  Lean R in a bad year like ’08.  

2nd-green: Jean Schmidt

Schmidt’s district is safe for anybody but her.  I don’t really think any Democrat could hold it, so if she goes down and is replaced by someone with the same voting record but not as crazy, the GOP shouldn’t mind.  They will hold this 8 of the 10 years, at least.  Plus, endangering her is the only way to make Chabot safe.

3rd-tan: Mike Turner

Turner loses a rural county and adds some suburbs.  If anything, it gets a little bit safer.

Photobucket

8th-red: John Boehner

The Speaker must take on some new territory.  He might live out of the district, in which case he can swap a bit of territory with Chabot for no partisan effect.  Anyone worried about a defeat, incumbents don’t lose in R+10 districts without a huge scandal or gaffe (see Sali, Bill)

4th-yellow: Jim Jordan

The RSC chair swaps some rural counties.  That’s basically it.  Except he doesn’t really live in the district.  I should have looked into that before I drew the map.  However, who is going to challenge him and win?  He can run in the 4th anyways.

5th-turquoise: Bob Latta

Latta takes on the (swingy? lean r? someone from ohio inform me) Toledo suburbs and some other swingy areas.  It’s probably only Lean R rather than Likely, but it would be an uphill climb for any Democrat.

Photobucket

I created the Columbus Dem vote sink many people agree should exist, most likely eliminating Steve Stivers, the most moderate Ohio GOPer anyways.

7th: Steve Austria-gray

Austria takes on more of the Columbus suburbs and the whiter parts of Columbus.  He’s still safe.

15th: Columbus–area Democrat–salmon

It’s safe for our side, and makes the surrounding districts safe as well.

12th: Pat Tiberi-light blue

Tiberi’s district gets much safer.  He could face a primary challenge I guess, or he’ll tack right a bit.

Photobucket

Then there’s the 6th: Bill Johnson-pink in zoomed in maps, blue in statewide map

Johnson gets much safer with the elimination of the rest of Mahoning County.  He still has Athens in the district, though.

16th: Jim Renacci-orange

Renacci loses inner-city Canton, something else I’ve never seen.  This should make him safe, with an already R-tilting district.

This sets up the incredibly ugly:

13th: Tim Ryan-bright green

Taking in industrial areas along Lake Erie, Democratic Mahoning and Warren Counties, inner-city Canton, Alliance, and the most populated parts of Portage County, Ryan has an incredible gerrymander going for him.  It’s ugly, but makes Kucinich’s elimination possible and makes Renacci safe.

14th: Steven LaTourette-brick

I’d be concerned about replacing him in a completely 50 50 district.  He’s probably safe, but a successor might not be.

How was this all possible?

Photobucket

By using water contiguity in Lake Erie.

9th: Marcy Kaptur-gold

Taking in Toledo, Lorain County, and Western Cuyahoga, Kaptur’s new district is an uber-Dem vote sink.  She could be primaried by Kucinich, as this district is more liberal with less of a Toledo influence in the Democratic primary, and he probably doesn’t have anywhere else to go.

10th: Betty Sutton-pale pink

Sutton takes in much of Kucinich’s Cleveland Suburbs, the Democratic parts of Summit County, and some exurbs in between for a safe district that is shaped similarly to her own but contains some new territory.

11th: Marcia Fudge-puke

A fitting color for a representative who tried to weaken ethics laws.  Fudge’s district is slightly under 50% Black, which could be tweaked if it looked uglier (possibly)

And there you have it!

By what margin will Bob Shamansky win?

View Results

Loading ... Loading ...

SSP Daily Digest: 2/1

MI-Sen: This looks like a tea leaf that Peter Hoekstra isn’t a likely Senate candidate for 2012: he’s joining big DC law/lobby firm Dickstein Shapiro, a popular destination for outgoing Congresspeople and certainly not the usual route for someone who wants to keep in touch with the little people back home. (Current “senior advisors” there include Dennis Hastert, Tim Hutchinson, and Albert Wynn.)

MN-Sen: Norm Coleman comes right out and says it explicitly: he’s not going to run against Amy Klobuchar in 2012 (although he didn’t rule out eventual other runs). Not that anyone rational was expecting it, but now we can check that box.

NV-Sen: Cue up some doomy soundtrack music for John Ensign: despite his having dodged the DOJ, the Senate Ethics Committee has decided to plow ahead on its inquiry of him, just in time for the cycle where he’s up for re-election. Today a special counsel in l’affaire Ensign was announced.

NY-Sen: Going up against Kirsten Gillibrand in 2012 (in the wake of her cresting 60% in the down year of 2010) seems like an unenviable task for any Republican, and the duties might fall to former Lt. Gov. turned health insurance industry astroturfer Betsy McCaughey. Speaking before a confab for New York’s Conservative Party, when asked about the race, she said she’s “considering it.”

WA-Gov: We can’t officially shut the door on a highly-unusual run for a third term by Chris Gregoire until she actually says “no” herself, but state Dem party chair Dwight Pelz is publicly saying that he’s looking ahead to electing a new governor in 2012. Don’t expect Gregoire to say anything until the end of the legislative session, though.

WV-Gov: Get out your calendars and your red pen, because it looks like things are getting switched around yet again in West Virginia. The state House passed a bill authorizing the upcoming elections (including a primary, which wasn’t considered a done deal because of the cost involved), but they’ve moved the dates around again. Now the primary date is May 14 (instead of June 20), and the general special election date is Sept. 13 (instead of Oct. 4). Of course, that’s only the House version, so the state Senate could monkey around with it even more. Meanwhile, one Republican candidate is already exiting the field: state party chair Mike Stuart, who probably saw the writing on the wall given his 1% showing in PPP’s sample of the primary. A few more GOPers that we haven’t mentioned before are thinking about getting in to replace him, though: state House minority leader Tim Armstead, and state Del. Mitch Carmichael.

CT-05: This is a bit of a surprise, and ought to create a wide-open Republican field in the open seat race created by Chris Murphy’s quest for a Senate seat. State Sen. Sam Caligiuri, who made a competitive race of it in 2010, says he won’t run again in 2012.

MT-AL: As Denny Rehberg-related rumors got ramped up over the last few days, there’s been a corresponding rise in rumors that Steve Daines (the Republican businessman who lost the 2008 Lt. Gov. race and announced a Senate bid in November) might bail out of the Senate race and drop down to the now-open House race instead. That would be a bit of a turnaround for Daines, who had already consolidated some backing from right-wing orgs for a possible tea-flavored primary rumble, but the House is a path of much less resistance for him. No confirmation from Daines today, but as of yesterday he sounded open to the idea.

State legislatures: This article about how state legislature constituencies are getting too populous for legislators to maintain effective old-school communications with their voters is most noteworthy for its neat interactive graphic. You can compare the legislator-to-constituent ratio for each state (unsurprisingly, California and Texas are the worst, while North Dakota and New Hampshire are the best).

Fundraising: We have fundraising numbers from 2010 Q4 for five different Senate Dems up in 2012, and we’ll start with the weakest link: Dan Akaka, who has $66K CoH. (Not that that should presage retirement or even encourage Linda Lingle, as he doesn’t really fundraise outside the cycles where he’s up for re-election; he had $83K at this point six years ago.) Next up: Jim Webb, who has $444K CoH but raised only $12K last quarter, a number that by itself screams retirement… but as we know, Webb marches to his own drummer and could turn that around quickly. Ben Nelson is also in camped out in the land of the mediocre (and of the potential retirees), raising only $81K, though he has a more robust $1.4 million CoH.

Jeff Bingaman, on the other hand, seems to be heading for another term, albeit in slightly lukewarm fashion, raising $216K last quarter; he has $511K CoH. Debbie Stabenow is looking pretty aggressive, by contrast: she raised $537K and has more than $2 million CoH. One Republican to report on, as well: Orrin Hatch, likely to face a serious primary, raised $400K and is sitting on $2.5 million CoH (compared with Jason Chaffetz’s $140K CoH).

Redistricting: Here’s more on the growing worries from plugged-in Republicans that they don’t have the money in place to effectively fight the legal battles associated with redistricting. The sense is that they’re victims of their own success: they spent so much money on winning state legislatures last year that they didn’t leave any leftovers budgeted for the aftermath.