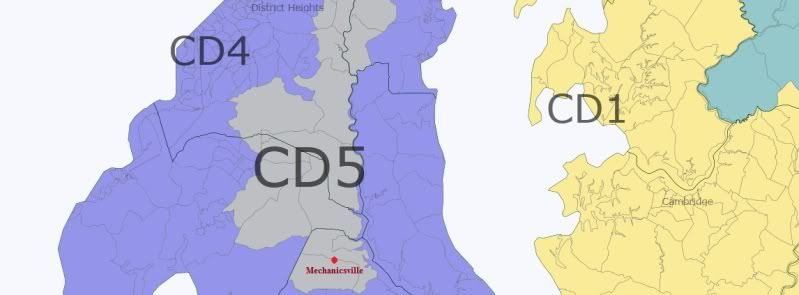
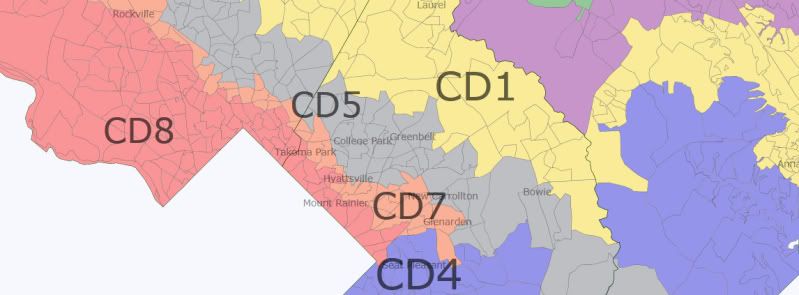
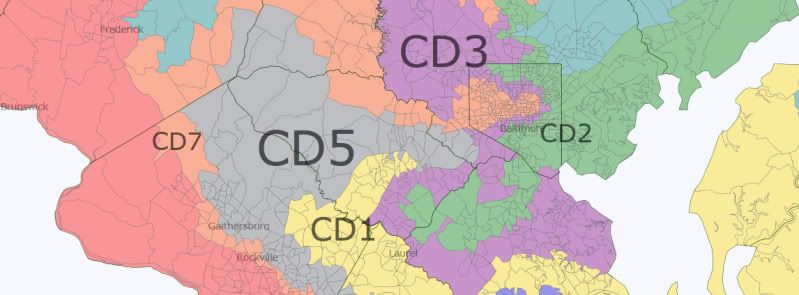
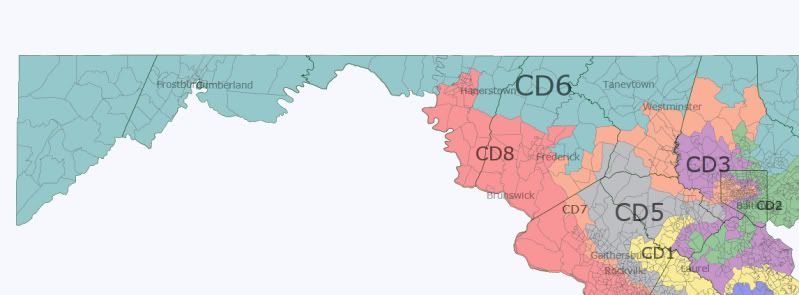
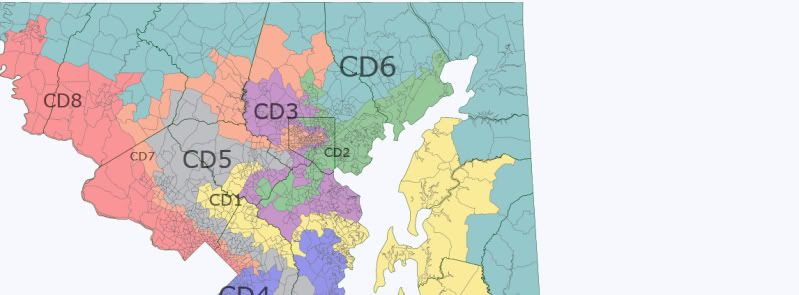
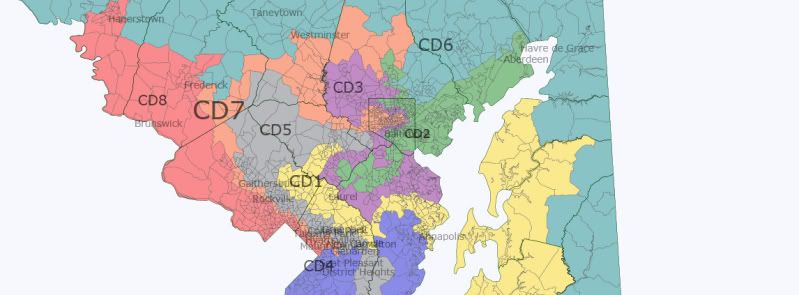
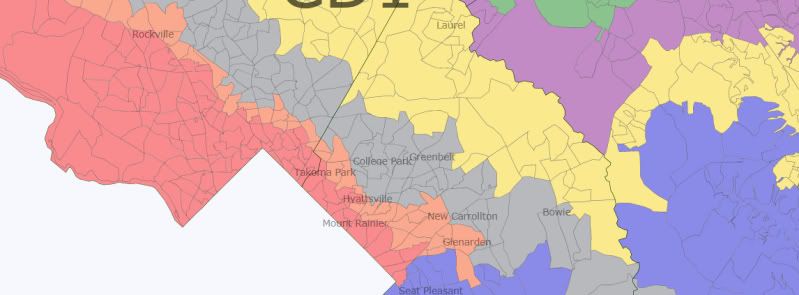
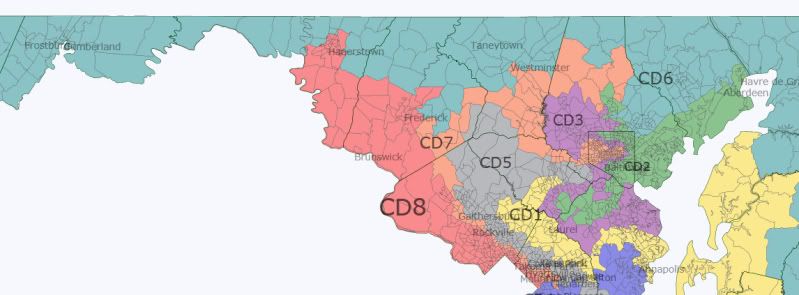
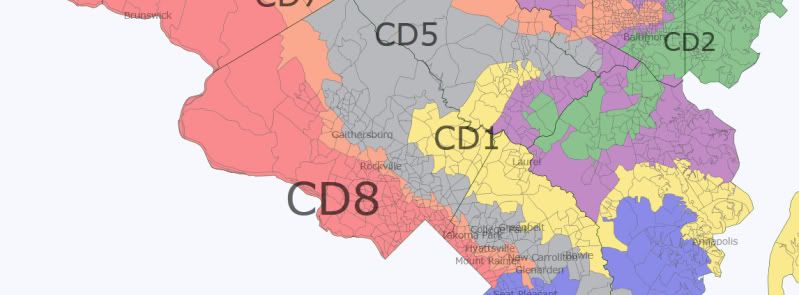
Redistricting: A Maryland Monstrosity (7-1 Dem Map)

Maryland, my Maryland. The Democrats currently have a 6-2 edge in representation in this fairly blue state, and with redistricting just around the corner, the question on Democrats’ minds is how can we make this an even larger edge? An 8-0 map has seemed impossible to make where it would sufficiently protect the incumbent Democrats, although I’m confident that someone will make one. I know there have been recent attempts but those created an essentially perfect swing district in MD-01 to get us to 7-1 (or 8-0).

My goal is to create a 7-1 map where MD-01 is sufficiently blue so that a moderate Democrat like Frank Kratovil can retake the district and hold it while accounting for:

1.Based on Nathaniel90’s recent “Redistricting Outlook” that discussed Maryland, it appears that I need to keep two minority-majority black districts while I pursue the goal of 7-1.

2. Keeping the Democratic incumbents’ hometowns in their respective districts (I actually ended up drawing both Republicans out of their residences).

3. Increasing the partisan advantage of the more “vulnerable” incumbents.

As for how this map turned into a monstrosity…When you add together the sandbox atmosphere of Dave’s Redistricting App with the already crazily drawn districts in Maryland, you can end up with an absurd map like this one.

NOTE: I used the new population estimates with voting precincts.

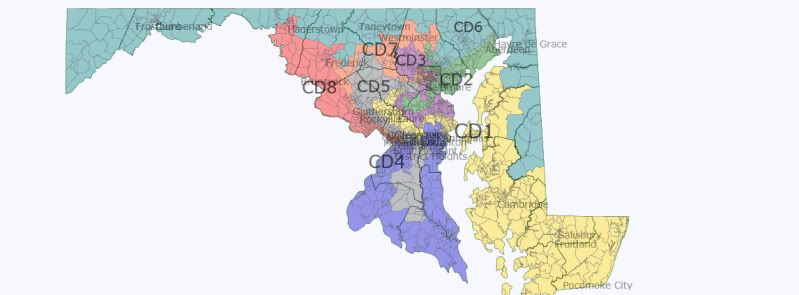
So here’s what I came up with:

Photobucket

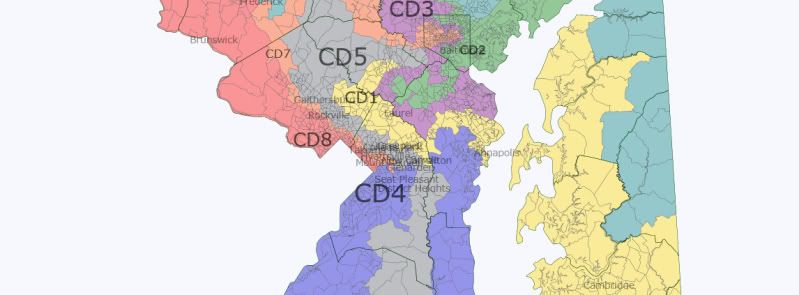
Clearly, there are some ridiculous districts on this map. But let’s break them down.

MD-01 (Yellow)

Naturally, we’ll start with MD-01.

Photobucket

Here’s the data on Mr. Kratovil’s old and hopefully new district:

Photobucket

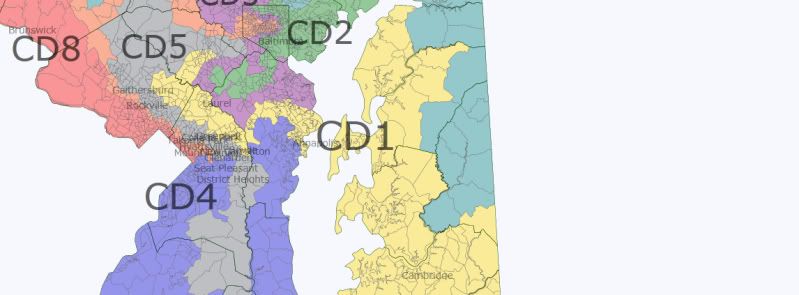
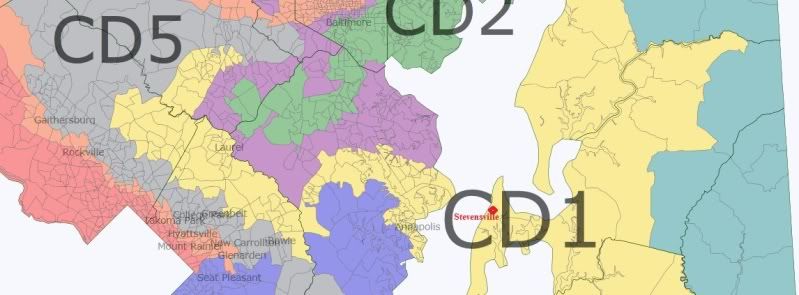
A zoom in on this district’s mainland “hook”:

Photobucket

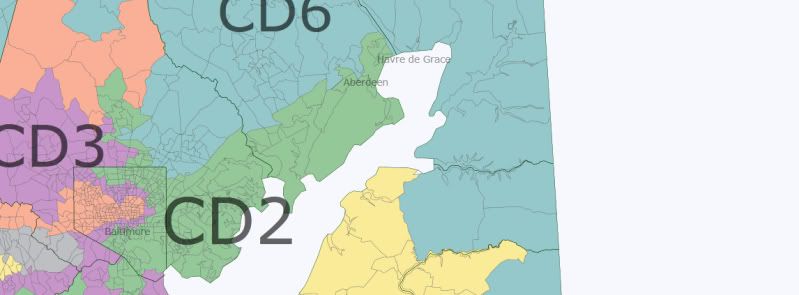
Based on Wikipedia, the old PVI for this district was R+13. With the President’s numbers from 2008, the new district would be a solid D+5, thus very winnable for a candidate like Kratovil (whose hometown Stevensville is shown above). Most importantly, Kratovil’s hometown is in this district whereas GOP incumbent Andy Harris’ is not (it’s in the new 7th and he would have to challenge Elijah Cummings to return). The only question mark about this district is whether or not crossing the Chesapeake Bay allows the district to still be considered “contiguous.”

MD-02 (Green)

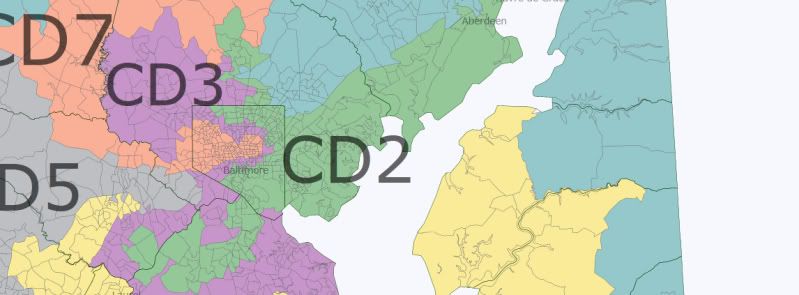
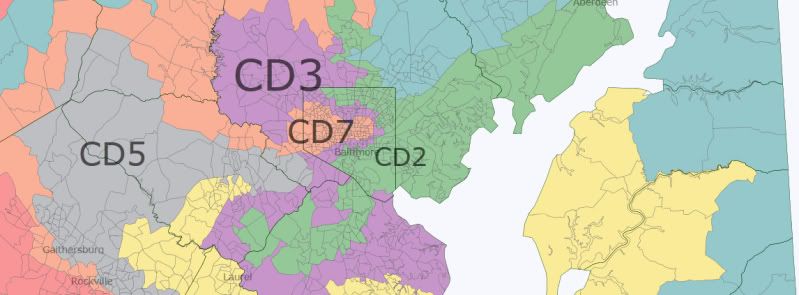
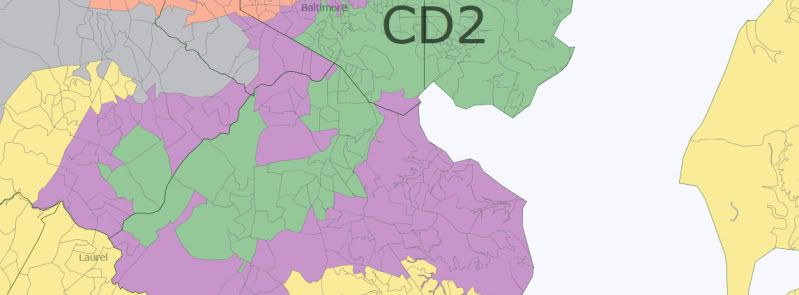
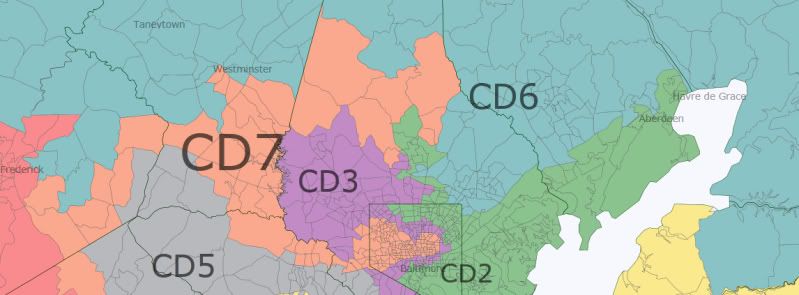
Now, for MD-02. Dutch Ruppersberger’s new district looks like this:

Photobucket

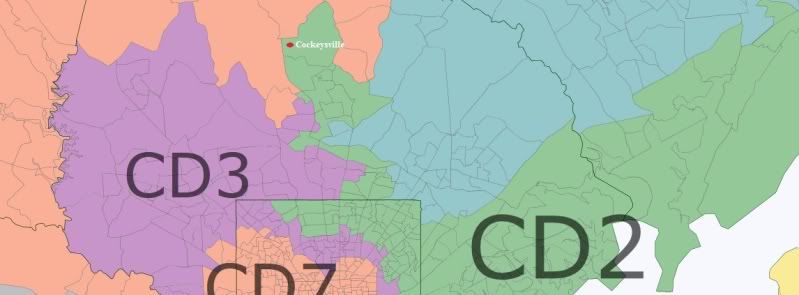
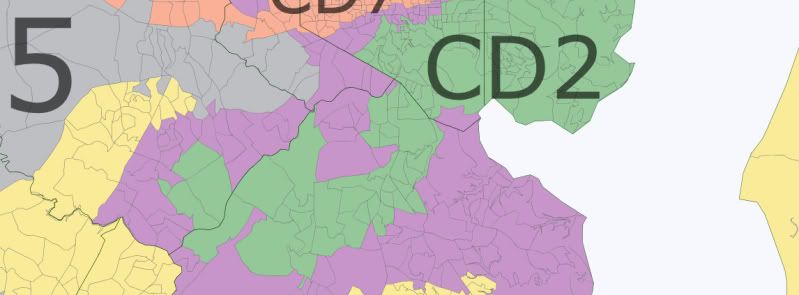
The most north-central part stretches up to snare Cockeysville, Ruppersberger’s hometown (Andy Harris lives somewhere in the vicinity as well because his hometown is listed there, too). The rest of the district is based somewhat on his current set up except that now his seat is even more secure. The data:

Photobucket

Some more pictures of the new MD-02. Here’s the most northern part so you can actually see its fullest extent:

Photobucket

The central part where Cockeysville is:

Photobucket

And the southern section:

Photobucket

MD-03 (Purple)

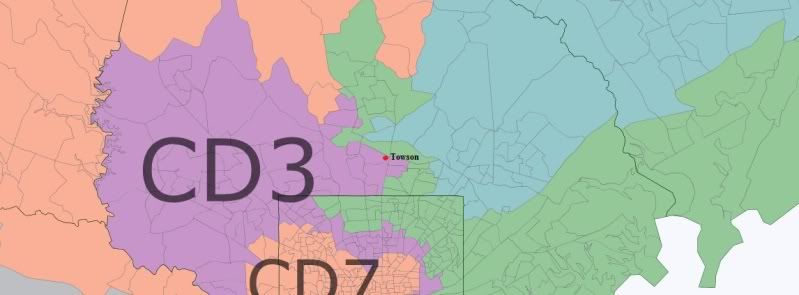
Now, the other non-minority-majority Baltimore district, MD-03. Incumbent John Sarbanes is fairly safe but I’ve made his work even easier.

Photobucket

And the data for MD-03:

Photobucket

While I know which district on this redistricting map is the “worst,” this one is certainly competing for the second most meandering. Like Ruppsberger’s hometown, Sarbanes’ Towson is barely in his district.

Photobucket

And the most southern part of the MD-03, curling in with MD-02 and MD-01:

Photobucket

MD-04 (Blue)

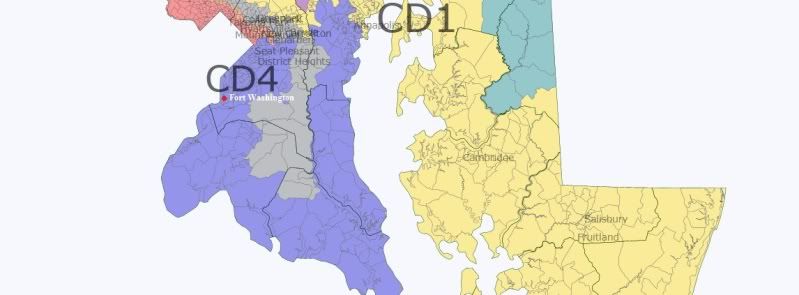
Moving on, we have MD-04, represented by Donna Edwards. It’s the first minority-majority district to discuss. Basically, much of the district is Steny Hoyer’s old district, forming a large U from D.C. to suburban Annapolis for reasons to be explained shortly in the MD-05 (gray) section. Edwards lives in Fort Washington, so that’s not an issue.

Photobucket

The data for MD-04:

Photobucket

Fifty-one percent African American puts it over the hump for continuing to be a minority-majority district. Although it loses some PVI, it had plenty to lose in the first place.

MD-05 (Gray)

Originally when I was drawing up this map, I gave Donna Edwards all of southeastern Maryland because I thought Steny Hoyer lived closer to College Park. Turns out his home is in Mechanicsville, and I don’t think you can draw the Democratic Minority Whip out his district. Thus, the even more extended nature of his district, which I had going into the suburbs of Annapolis first. Now Edwards goes there and Hoyer stretches down to his hometown.

Photobucket

More specifically, the southern part of the district and Hoyer’s hometown:

Photobucket

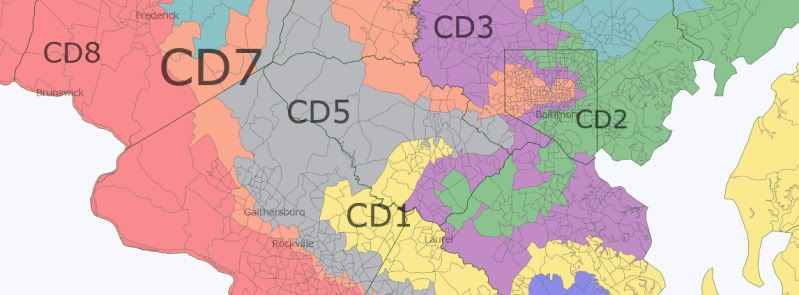
Hoyer’s district, like the prospective MD-01, crosses through the D.C. suburbs and stretches northwest. That stretch looks like this:

Photobucket

The northern-most part looks like this:

Photobucket

And MD-05’s overall result? A safer district for Steny:

Photobucket

MD-06 (Teal)

Now for the lone safe Republican seat on this map. The giant L of a district has to violate any rules about compactness but it sure isolates the Republicans. As Roscoe Bartlett lives in Frederick, this map actually draws him out of his district because Frederick is now in Chris Van Hollen’s MD-08.

The western part of the district:

Photobucket

And the eastern part:

Photobucket

MD-06’s data:

Photobucket

MD-07 (Orange)

People are going to ask how in the hell did I end up sending this district from central Baltimore all the way to Prince George’s County. Basically, I was having trouble keeping the 7th over 50% black because it is the other minority-majority district. My original draw out had made MD-04 nearly 60% black so I decided I would “steal” African American voters from it, and at the same time I could leave more of the less-black Democratic areas of greater Baltimore to Sarbanes and Ruppersberger. At the same time, I managed to eat up a lot of blank GOP space that wouldn’t have to go into Hoyer or Van Hollen’s district as I stretched it west. I also drew Andy Harris into the 7th, forcing him to either move or find something else to run for. The end result was the “claw.”

Photobucket

Obviously, this would seem to break any rule on “communities of interest” as we’d have central Baltimore coupled with part of Laurel in suburban D.C. But it satisfied the minority-majority clause as we can see from the data:

Photobucket

The northern part of the district:

Photobucket

The narrow stretch curling down into greater D.C.:

Photobucket

And the suburban D.C. area:

Photobucket

MD-08

Lastly, we have Chris Van Hollen’s MD-08 which now stretches well beyond suburban D.C. all the way to Hagerstown, capturing the few very Democratic areas in Frederick and Hagerstown.

Photobucket

In the southern part of the district, it mixes in with MD-04 and MD-07:

Photobucket

And lastly, MD-08’s data:

Photobucket

In conclusion, here is the data from all eight districts:

Photobucket

Thanks for reading!

Possible Iowa Map

I drew this map upon release of the new Census data for Iowa.  I paid no attention to partisanship and tried to correlate each district with a geographical area of the state.  Starting with Des Moines, I drew a district around it, then drew a district for the southeast, northeast and western Iowa.  My goal was to have each district within 1,000 persons of the ideal district population.  Amazingly, my configuration worked out on my very first try (which means there’s probably many possible combinations to how the state can be drawn).  Nevertheless, I kind of like the map here because I think it does a good job in keeping the different regions of the state together (in that respect, I think it’s better than, for example, the 1990’s Iowa map which had one district run from Des Moines to  the western border).

The population numbers are as follows:

blue – 762,255

green – 761,010

purple – 760,876

red – 762,214

ideal pop. is 761,589

Photobucket

I originally posted my map as part of  a comment on another diary , http://www.swingstateproject.c…  and reader OGGoldy crunched the partisan numbers for the map as follows:

blue – 55.3% Obama, 44.7% McCain

green – 58.8% Obama, 41.2% McCain

purple – 58.9% Obama, 41.1% McCain

red – 46.3% Obama, 53.7% McCain

8-0 Maryland Revisited

My last diary attempted to draw an effective 8-0 map of Maryland. This ran into problems, because my idea of drawing MD-01 across the Chesapeake from the Eastern Shore to St. Mary’s county left Steny Hoyer without a clear district to run in. In light of that, I have played around some more with the map of Maryland, and this is the best way I have come up with to guarantee Hoyer a district while drawing 8 democratic districts:

In the west the pattern is similar to my last plan. Chris Van Hollen’s MD-08 takes in the panhandle and becomes 61%O/38%M. MD-06 now stretches down into Montgomery County and is now 60%O/38%M. MD-05 is a district drawn for Steny Hoyer. It’s basically his ideal district, composing Southern Maryland, Eastern PG Co, and part of Anne Arundel County. It is 61%O/38%M, and should be safe for Hoyer. MD-04 stretches out of PG Co to take up the part Anne Arundel that isn’t in MD-05 (except for two precincts that are in the 2nd). It is just barely majority-black (51%B/38%W), but safely democratic at 73%O/25%M. The 1st district composes Frank Kratovil’s base in the Eastern Shore, Aberdeen Proving Ground in Harford Co, some parts of SE Baltimore county, and some heavily Democratic areas in Baltimore city. The district as a whole is 50%O/49%M. That is much more democratic than the previous district, but still Republican leaning on a national level. I believe, however, that this would be even better for Kratovil than the district I drew for him in my last diary. Most of the voters in this district’s section of Baltimore county are conservative Reagan Democrats who vote Republican on a national level but still elect conservative Democrats at a local level. These voters should be generally friendly to a conservative Democrat like Kratovil. In addition, these conservative Democrats would help make act as a buffer against an unelectable liberal democrat winning the primary. Between them, the Democrats in Baltimore city, and the Eastern Shore voters who have typically been Kratovil’s base, I think Kratovil should not have trouble winning this district. The 7th stretches up along the 95-or along I-95, as some east coast people say (see the old diary for those who don’t get the reference). It takes in many conservative areas, but is still 51%B/43%W and 68%O/31%M. The 3rd composes most of the close-in suburbs of Baltimore and is even safer D than before (63%O/35%M). The 2nd takes in the northern part of Baltimore county, some rural areas, much of Howard county, and some DC suburbs in PG and MontCo. The partisanship is the same as it is now, 59%D/39%R.

The big problem with this district is not political but regional. In this map, the PG+Montgomery areas of the 2nd district composed around 300K of the district’s 700k people. The areas outside of PG, Montgomery, and Howard counties only total 200K of the district’s population. This means that a majority of the Democratic primary in that district would probably be DC area voters instead of Baltimore area voters, because the areas in PG and Montgomery are much more Democratic than the other areas and because turnout rates are higher in Democratic primaries in PG Co and Mont Co as the Democratic primaries there are effectively the general election. I don’t know whether or not Ruppersburger would face a primary challenge (he could move to Columbia, which would put him in the center of the district and would probably be a good idea anyway given that these districts are going to have to be drawn somewhat differently from the above map due to population shifts to that area), but I know that the Baltimore area state legislators would not be happy with losing the influence of one congressman, especially since Andy Harris who lives in the Baltimore area would be gone as well. With that in mind, I drew another map of the state that preserves Baltimore’s influence in Congress, however with less clean lines overall.

This map draws MD-03 down into PG county a little and gives MD-02 some majority-black areas of Baltimore county. This has the effect of making both districts a little closer to each other in partisanship (MD-02 is 61%O/37%M and MD-03 is 62%O/36%M), and it allows the Baltimore area to dominate both districts. None of the other districts are changed. This map has many advantages, but it definitely looks more gerrymandered than the first one.

Utah: 2 Obama Districts ??

I was inspired by Alizarin’s diary “Republican Gerrymander of New York”: http://www.swingstateproject.c…  as well as abgin’s “finding limits” series of diaries to try to make a Utah map with two Obama districts.  The resulting map actually has both districts at McCain under 50% — in the green district, Obama has a plurality, while in the blue one McCain is slightly ahead, though still under 50%.  

The partisan data was not in the Application.  The major problem I had was lack of precinct data from the various counties.  I did this map purely for fun so I used a variety of data sources and estimation techniques here – some of which may come with caveats.  Therefore, I cannot guarantee that my end result is exactly accurate.  The point, nevertheless, is not whether one can actually have 2 Obama districts BUT that one can certainly draw 2 districts in Utah that at least come very close to being Obama plurality or majority. (In all likelihood, though, it would probably be technically possible to draw 2 Obama districts in Utah if certain precincts could be split and the map was a little more gerrymandered than the one here.  I also played with this using the “old” population numbers, and in that case I can guarantee that two Obama districts could be drawn.)

For Salt Lake County, I used city data provided by sysm29 in the diary “Let’s Redistrict Utah !”: http://www.swingstateproject.c… (I estimated/extrapolated the numbers for a couple of precincts in unincorporated areas).  For Davis, Tooele and Utah Counties good precinct data was available, although I had to use maps provided on the county sites to match existing precincts to those in the Application, as the borders and numbers have changed in many cases over the last decade.  For San Juan and Uintah counties I estimated the percentages based on some information I had re. how Native American areas voted.  (In San Juan, for example, the total county vote was 51 McCain – 47 Obama, but that hides the fact that the Navajo areas voted overwhelmingly for Obama, while the white areas were overwhelmingly for McCain).

For many counties, like Weber and Wasatch I couldn’t find precinct breakdowns; thus I was very limited in how to create the districts.  I decided to include the whole county in both cases in my green Obama plurality district as the Obama percentages were relatively high for the state.  I feel that if I had precinct data, especially for Weber, I could redo this map so that 2 districts would result with Obama pluralities.  Nevertheless, here is the map in its imperfect form.  The population deviation, using the “new” population estimates was 266 to 388 persons above an ideal district size for the blue, green and purple districts, and 967 persons under the ideal size for the red district:

Photobucket

Photobucket

Photobucket

Here’s a breakdown of each district (please NOTE that the partisan data comes with a caveat explained above, so may not be completely accurate):

Green: Obama 48.4 – McCain 48.3

Blue: Obama 47.2 – McCain 49.9

Purple: Obama 23.1 – McCain 74.1

Red: Obama 21.0 – McCain 75.7

One interesting fact: to show you just how Republican much of Utah still is, it turns out that the most Democratic part of Davis Co. is Hill Air Force Base !

I should also note that approximately 27% of the population of the green district would be current constituents of Jim Matheson, while about 49% of the population of the blue district would be Matheson’s current constituents.  If there’s a parallel universe somewhere out there where the Democrats control their version of Utah, they should definitely go with this map.

AR, IA, IN, and MD: Population by CD for Four More States

Four more states were released this week; again, we pick out the population by CD to see the relative standings of each district.


District Population Deviation
AR-01 687,694 (41,286)
AR-02 751,377 22,398
AR-03 822,564 93,585
AR-04 654,283 (74,697)
Total: 2,915,918


District Population Deviation
IA-01 596,443 (165,146)
IA-02 620,856 (140,733)
IA-03 642,116 (119,473)
IA-04 609,487 (152,102)
IA-05 577,453 (184,136)
Total: 3,046,355


District Population Deviation
IN-01 705,600 (14,822)
IN-02 679,254 (41,168)
IN-03 723,633 3,211
IN-04 789,835 69,413
IN-05 809,107 88,685
IN-06 676,548 (43,874)
IN-07 676,351 (44,071)
IN-08 694,398 (26,024)
IN-09 729,076 8,654
Total: 6,483,802


District Population Deviation
MD-01 744,275 22,581
MD-02 700,893 (20,801)
MD-03 719,856 (1,838)
MD-04 714,316 (7,378)
MD-05 767,369 45,675
MD-06 738,943 17,249
MD-07 659,776 (61,918)
MD-08 728,124 6,430
Total: 5,773,552

Republican Gerrymander of New York

This diary presents a theoretical Republican gerrymander of New York (27 representatives) that should, in the normal course of events, yield a 16D-11R delegation. Exactly how Republican a seat needs to be to be safe is a matter for debate, but in none of the projected Republican seats did Obama receive more than 47% of the vote which I feel should be safe most of the time. This map make makes quite a bit of use of water contiguity both around Long Island and Lake Ontario, however there is no touch point contiguity. Population deviations are all less than 1000 (within 0.15%).

Districts are numbered in reverse order to the current system, low numbered districts are upstate and high numbered are downstate.

NY-1 (Blue): More or less similar to the current 28th including the most Democratic parts of Buffalo, Niagara Falls, and the western Democratic parts of Rochester. Uses water contiguity on Lake Ontario instead of following the coastline which helps to push the PVI a little more Democratic. O 71% M 27%  

NY-2 (Green): Reasonably similar to the current 26th in that it includes parts of the Buffalo and Rochester suburbs and the areas in between. O 47% M 51%  

NY-3 (Dark Magenta): At this point upstate New York starts to take departures from reality and no longer resembles the current districts. The western parts of the southern tier, the south Buffalo suburbs, and wraps around Rochester to take in the eastern suburbs.  O 47% M 52%  

NY-4 (Red): Eastern and southern democratic leaning areas of Rochester, water contiguity to Oswego and a thin strip to metro Syracuse, tendrils to both Utica and Ithaca. O 64% M 35%  

NY-5 (Gold): The remainder of the southern tier, the territory between Syracuse (including its western suburbs) and Rochester, wraps around to southern Syracuse avoiding Ithaca. O 47% M 51%  

NY-6 (Teal): Northern Syracuse, northern Utica, Rome, north along the Lake Ontario coastline before turning east and then south, terminating short of Albany. O 47% M 52%  

NY-7 (Dark Grey): The Democratic leaning northernmost counties, a narrow strip running down the eastern state line, Saratoga Springs, Schenectady, and Albany. O 62% M 36%  

NY-8 (Slate Blue): Otsego County centred, with arms running off in every direction sucking in Republican leaning districts. O 47% M 51%

NY-9 (Cyan): Both the east and west state lines with convoluted lines grabbing the most Republican parts of Rockford County O 46% M 52%  

NY-10 (Deep Pink): Binghampton, Middletown, Peekskill, Newburgh, Poughkeepsie, Kingston, and the land connecting them. O 60% M 39%  

NY-11 (Chartreuse): The Democratic parts of Rockland and parts of Westchester, down the Hudson river coastline a little. O 66% M 33%

NY-12 (Cornflower Blue): More of Democratic Westchester, including New Rochelle and Mount Vernon, plus some of the northern Bronx. O 85% M 14%  

NY-13 (Dark Salmon): Southern Bronx, much like the current 16th. O 93% M 7%  

NY-14 (Olive): Northern Manhattan, much like the current 15th. O 92% M 7%  

NY-15 (Dark Orange): Southern Manhattan. O 82% M 17%  

NY-16 (Lime): Little bits of Kings, Queens, the Bronx, and Manhattan. O 79% M 20%  

NY-17 (Dark Slate Blue): Mostly Queens. O 81% M 19%

NY-18 (Yellow): North-eastern Kings. O 95% M 5%  

NY-19 (Yellow Green): North-western Kings and the northern shore of Staten Island. O 90% M 9%

NY-20 (Pink): South-western Kings and Staten Island minus its north shore. O 47% M 53%

NY-21 (Maroon): South Eastern Kings, and connected by water contiguity, the entire south coast of Long Island from Long Beach to Montauk.

O 46% M 53%

NY-22 (Sienna): Mostly Queens. O 71% M 29%

NY-23 (Aquamarine): Horrendously tortuous district picking up everything republican in southern Westchester, Bronx County, Queens, and Nassau and using repeated water contiguity over Eastchester Bay and the Long Island Sound to do it. O 47% M 52%

NY-24 (Indigo): Republican areas north of Jamaica bay in Queens, as well as southern Nassau, and a little south-western Suffolk.  O 47% M 52%

NY-25 (Pale Violet Red): The most Democratic parts of central and southern Queens and Nassau. O 90% M 10%

NY-26 (Grey): The republican parts of Eastern Long Island O 47% M 53%

NY-27 (Spring Green): The Democratic parts of Eastern long island, in four sections, each connected by water contiguity along the Long Island Sound. O 63% M 37%

Redistricting Louisiana: Deep fried, heavily seasoned and served hot

Drawing from a rather long comment I had on a previous diary, I’ve decided to expand my one part diary on redistricting in the Bayou State to two.

The first part will run through recent developments in state politics and who controls the redistricting process, while the second will include my proposed map for Louisiana’s 6 congressional districts.

In my honest opinion, Louisiana is the state least alike the other 47 states that make up the continental United States.

Administrative subdivisions are called parishes, not counties. It is a civil law state, as opposed to the other 49 common law states.

Politics in the state are no different.

Party labels are very fluid. In state government, there are conservative Democrats – although less so now – and some fairly moderate Republicans, especially for standards of the Deep South.

In the past few months, Democrats have taken a hit, and in Louisiana, it has been no different.

For the first time since Reconstruction, Republicans control the state house. There is a Republican governor, and after Attorney General Buddy Caldwell’s party switch last week, the only statewide elected Democrat is Sen. Mary Landrieu.

That leaves the state senate, which currently is split right down the middle, 19 Democrats and 19 Republicans.

This gridlock is a result of party switchers, notably state Sen. John Alario, and a single vacancy.

Redistricting in the state is done by the legislature and the governor and it seems the last chance for Democrats to be at the table, outside the Holder DOJ, is the state senate.

Let’s look at that vacancy.

The 26th district is vacant after Sen. Nick Gautreaux resigned to become Bobby Jindal’s commissioner of the Office of Motor Vehicles.

(Just an aside, this appointment and that of a former independent state senator as the Commissioner of the Office of Alcohol and Tobacco Control was smart politically by the governor and is VERY reminiscent of President Obama’s appointments of Jon Huntsman and John Mchugh)

The 26th district includes all of Vermillion parish and parts of Acadia, Lafayette and St. Landry parishes.

The district takes in areas of Cajun country west of Lafayette and stretches down south to include Vermillion parish, ending at the Gulf. To better understand the region, the 2000 census reported about a quarter of people in Vermillion speak French or Cajun French at home.

This area is historically Democratic. In the jungle primary in the 2003 gubernatorial election, 3 of the 4 parishes in district 26 were won by Kathleen Babineaux Blanco, who would win only 7 parishes and grab only 18% of the vote but squeak into the general election against Bobby Jindal.

This small chunk of Acadiana will decide which party will control the state senate.

After Gautreaux’s announcement that he would resign, Republican state Rep. Jonathan Perry, who represents much of the sparsely populated coastal parts of Vermillion and Cameron parishes, entered the race.

Soon thereafter, Democrat Nathan Granger, a member of the Vermillion Parish Police Jury and owner of an oilfield services company, entered the race.

At this stage in the race, both camps have released dueling internals showing each with about a 10 point lead.

Anecdotally, I have heard from a friend from Crowley that the area is swamped with advertisements from Granger and after reviewing campaign finance reports, it appears that is the case.

As of Jan. 31, campaign finance reports show Granger raised about 280k, of which 220k was self-funded, with 100k COH.

Perry has raised 90k and has 30k COH.

Take all this with a grain of salt, but it appears that this Blue Dog might just dispatch a Tea Partier in a very important race for Louisiana politics.

In part 2, the map I unveil will show why Democrats need to have a seat at the redistricting table as I attempt to create a VRA district based in New Orleans that DOES NOT stretch all the way to Baton Rouge.

The Van Hollander (8-0 Map of MD)

Sorry about the corny title. I felt that after the infamous Delaymander of Texas, this needed a similar name, and Steny Hoyer’s name didn’t lend itself to this as much as Chris Van Hollen’s name did. Anyway, this map attempts to defeat Andy Harris and Roscoe Bartlett while keeping all Democratic incumbents safe. And as an added bonus, it draws a new majority-minority district, just for the hell of it. Overall, this map is probably even cleaner looking than the current map of MD (which was always unnecessarily ugly, IMO). The only really ugly looking district is the 3rd, and even that looks better than it did before.

DC Area:

Baltimore:

Starting in the west, the panhandle is now in MD-08. In most of this area, the I-270 serves as the barrier between MD-08 and MD-06, with the area SW of the 270 in the 8th and the area NE of the 270 in MD-06. The 8th is 61%O/38%M and the 6th is 62%O/37%M. Van Hollen should be safe, and Bartlett is toast. MD-05 is the new majority-minority district. The racial stats are 49%W/28%B/15%H/7%A. I actually wasn’t intending to do this, but it just so happened that when I drew MD-05 it turned out 51% white, so I decided to tinker with the borders a little to make it majority-minority. The citizen voting age population is probably still majority-white, but that doesn’t really matter as this wasn’t required anyway. MD-04 takes in Calvert and some GOP parts of Anne Arundel Co. It is 39%W/53%B and 75%O/24%M. The 1st loses all its territory in the Baltimore suburbs and now crosses the water in the south into St. Mary’s, Charles, and a tiny part of PG Co. It is now 50%O/48%M, which would be slightly Republican leaning nationally but should be easy for Kratovil to win, especially now that Andy Harris is drawn out of the district. Interestingly, the PG Co parts of the district make up a tiny 33K people, or 5% of the total population of the district, however without these areas the district goes from 50/48 Obama to 47/51 McCain.

In the Baltimore area, the 2nd and 3rd districts have lost their spagetti-like shape and become much more compact. The 2nd district contains Harford and most of northern Baltimore counties as well as the northern part of Baltimore city. The district is 58%O/40%M, which is slightly less than the previous total of 59%O/39%M, but not significantly enough to affect this district much. The 3rd is now a crescent shaped district that stretches around from John Sarbanes’s home in Towson around Baltimore, Howard, and Anne Arundel counties as well as some liberal white areas of Baltimore around the Inner Harbor and Fells Point. It is now 59%O/39%M, which like the 2nd is slightly less than the 60%O/38%M it was before but not significantly. The 7th composes most of the majority black areas of Baltimore, however it stretches out to grab up Republican areas in Baltimore county from the surrounding districts. It is 42%W/52%B and 70%O/28%M.

I guess this map isn’t technically an 8-0 map, as the 1st still has a slight Republican lean. That could easily be gotten rid of by messing with the borders between the 4th and the 1st some more, however I decided that wasn’t necessary and it would require making the map look a little uglier. This 1st contains Kratovil’s base in the Eastern Shore, where he always did very well, but not the Baltimore suburbs that he consistently lost. I guess it’s theoretically possible that the GOP could pick up the 2nd or 3rd in an open-seat situation (maybe), however I really, really doubt they have much more of a chance than they do under the current map.

By what margin will Bob Shamansky win?

View Results

Loading ... Loading ...

Redistricting New Jersey (with 2010 census data)

Updated with racial data on 2/17/11

The census has just released its data for New Jersey. Not wasting any time, I have made my post-census redistricting plan for New Jersey. This isn’t a partisan gerrymander, I already did one of those. My goal is communities of interest and reasonable compactness, what a good-government redistricting should look like.

New Jersey has 8,791,894 people. That’s 12 districts with 732,657 or 732,658 people each. And it has to be exact or else someone will sue. However some states don’t require exact population equality. For example Arkansas and West Virginia don’t allow county splitting. While New Jersey’s 21 counties are too big for that, you can keep districts close to the ideal population without splitting any of the 566 municipalities. I think NJ should start doing this. In 1960 Newark had more people than a Congressional district, but that is no longer the case.

All districts are within 1% of the ideal population. No one has any grounds to complain about population inequality. I also minimized county splits.

Counties with fewer than 300,000 people were not split at all.

Counties with fewer than 500,000 people were not split more than once.

No county was split more than twice.

I numbered the Congressional districts from south to north. Most districts are already numbered from south to north and I fixed the ones that aren’t.

South Jersey

South Jersey is currently divided into 1 super-packed Democratic district and 3 barely Republican districts. I think this is an immoral gerrymander. NJ has 6 districts that go all the way, or almost all the way, from the Delaware River to the Atlantic Ocean or Hudson River. This probably goes back to when population in NJ was more concentrated in the cities, so the rest of the state got sliced up into segments. Now that more of the population is in the suburbs they should stop doing that. The Delaware Valley and the Shore (Turnpike corridor and Parkway corridor) are 2 separate communities that should get their own districts. Districts 2 and 3 (and 5) follow the Turnpike corridor and Districts 1 and 4 (and 6) follow the Parkway corridor.

1st District (R+1)

Location: Lower shore, Bay shore, and Pine Barrens

Incumbent: Frank Lobiondo

Population: -4551

Largest city: Vineland

Demographics: 68% White, 12% Black, 15% Hispanic, 3% Asian

It’s currently the 2nd district, but I think the big districts at opposite ends of the state should be 1 and 12, so I’m changing it’s number to the 1st. When driving south on the Parkway this district begins where the cities end. It’s urban areas, Atlantic City and Vineland, are separate from the New York and Philly metro areas. It is home to both of New Jersey’s nuclear power plants. (Does any Congressional District have more than 1 nuclear power plant?) It becomes a little bit more Republican but it’s still a swing district. Any district with all of Atlantic, Cumberland, and Cape May counties is going to be a swing district, between D+3 and R+3, no matter what else you add to it.

2nd District (D+10)

Location: Greater Camden

Incumbent: Rob Andrews

Population: -1758

Largest city: Camden

Demographics: 67% White, 16% Black, 11% Hispanic, 3% Asian

Camden County, the suburbs as well as the city, has grown very little since the 2000 census. So the district had to get bigger. It now includes all of Gloucester County. Unlike Camden, Gloucester County has seen some rapid growth. An enormous planned community was built in the sleepy rural township of Woolwich and in the last 10 years its population went from 3032 to 10200.

3rd District (D+9)

Location: Cherry Hill to Hopewell

Incumbent: Jon Runyan

Population: +742

Largest city: Hamilton

Demographics: 64% White, 19% Black, 10% Hispanic, 5% Asian

It’s shaped like Washington DC; a square with a bite formed by a river boundary. This half of Burlington County has 96% of its population. This district is as Democratic as Delaware, which kept reelecting, by a large margin, a Republican Congressman with a moderate reputation. So it is possible but not likely that Chris Smith could run and win here. If Smith wins the 3rd and is able to hold it then I won’t complain because the Democrats aren’t losing something they didn’t already have. I think the most likely outcome is Chris Smith runs in the 4th and Jon Runyan gets the shaft. Republicans will never agree to this so the independent on the commission needs to like this plan better than what the Republicans draw to protect their incumbents.

4th District (R+12)

Location: Mid Jersey Shore

Incumbent: Chris Smith

Population: -55

Largest city: Lakewood

Demographics: 83% White, 3% Black, 9% Hispanic, 3% Asian

The coastal towns all either remained stagnant or lost population while the population further inland skyrocketed. Lakewood gained 32000 people while Jackson and Freehold also had large population gains. This district is incredibly Republican now but that is only a recent trend. It probably voted for Clinton in 1996, and may have voted for McGreevey in 2001. While Chris Smith’s home is in the 3rd, most of his population is in the 4th, so he will probably run in this district.

Central Jersey

Current districts 12, 6 and 7 are skinny districts that span west-east. However like-minded communities in Central Jersey span north-south, and the new districts reflect that. Suburban Middlesex and Somerset Counties have had a lot of growth (for NJ) in the last decade.

5th District (D+10)

Location: Route 1 corridor, from Lawrence to Edison

Incumbent: Rush Holt

Population: +47

Largest city: Edison

Demographics: 51% White, 10% Black, 14% Hispanic, 23% Asian

Districts 5 and 12 trade numbers. This is an affluent, well-educated, diverse, liberal district. It follows the Route 1 and New Jersey Transit corridor. It relies heavily on commuter rail. In fact commuter rail made the growth in this area possible. It is home to both Princeton and Rutgers Universities. It has a good chance of electing an Asian to Congress. As far as I know there are not currently any Asian American Congressmen from any non-Pacific state. This district is more urban than the current 12th because it adds the New Brunswick/Edison/Piscataway area from Frank Pallone’s 6th.

6th District (D+2)

Location: Eastern border, from Neptune to Linden

Incumbent: Frank Pallone

Population: -244

Largest city: Woodbridge

Demographics: 61% White, 11% Black, 18% Hispanic, 8% Asian

This district is more working-class and less affluent than the new 5th. It follows the Garden State Parkway and the North Coast Line. Its strange shape is because it follows the coast. The most Democratic parts of the old 6th were given to Rush Holt and the most Republican parts of the old 12th were given to Frank Pallone. As a result Frank Pallone has a more Republican district. That’s what happens when you un-gerrymander. The territory from Perth Amboy to Linden, which is strongly Democratic, was also given to Pallone. If Pallone ran for reelection in this district in 2010 then he would have won by less than 1%. If a solidly liberal Congressman wins it in a very Republican year then it is still a Democratic district. However if Monmouth County continues to turn more Republican then this district could become winnable for Republicans.

7th District (R+2)

Location: Northwestern suburbs

Incumbent: Rodney Frelinghuysen

Population: +682

Largest city: Parsippany

Demographics: 69% White, 7% Black, 11% Hispanic, 11% Asian

This district is the conservative-leaning suburbs of North Jersey. It is probably one of the most affluent districts in the country. Although it looks different from the current 11th, Rodney Frelinghuysen already represents 47% of its population. This district could turn Democratic in the next 10 years.

North Jersey

The 4 small urban Congressional districts in metro North Jersey have been reduced to 3 because of population loss. I ended the racial gerrymander that caused Newark, Elizabeth and Jersey City to be split along racial lines. The Payne and Sires districts are still minority-majority so there should be no issues with the VRA. Meanwhile Rothman and Garrett get combined into an all-Bergen County district.


Prepared using Dave’s Redistricting App and Bing Maps

8th District (D+30)

Location: Newark, Elizabeth, and surrounding cities

Incumbent: Donald Payne

Population: +813

Largest city: Newark

Demographics: 20% White, 46% Black, 29% Hispanic, 3% Asian

In addition to Newark and Elizabeth, there are smaller mostly-black cities such as East Orange and Irvington, suburbs with large black populations such as Maplewood and Union, and a few white suburbs needed for population equality.

9th District (D+16)

Location: Hudson County and Meadowlands

Incumbent: Albio Sires

Population: +1458

Largest city: Jersey City

Demographics: 36% White, 10% Black, 39% Hispanic, 13% Asian

Instead of trying to split up Hudson County among its different demographics I decided it was better to embrace it as a diverse multi-ethnic district. The district is also economically diverse. It is home to the Gold Coast and to many new-immigrant neighborhoods.

10th District (D+10)

Location: Northern Essex and Lower Passaic

Incumbent: Bill Pascrell

Population: -1543

Largest city: Paterson

Demographics: 47% White, 13% Black, 33% Hispanic, 6% Asian

This district is, for the first time, a minority-majority district. It consists of northern Essex, lower Passaic, and a few towns in Bergen. I chose towns that border Clifton and Paterson because those cities are the center of the district. The Hispanic population in this district keeps increasing, so it has a good chance of electing a Hispanic Congressman. Both Clifton and West Orange had significant population growth in the last decade.

11th District (D+2)

Location: Bergen County

Incumbent: Steve Rothman and Scott Garrett

Population: +3529

Largest city: Hackensack

Demographics: 61% White, 6% Black, 15% Hispanic, 16% Asian

This is where 2 districts get combined into 1. Bergen County is traditionally swingy at the state level, so it’s a good place to combine an incumbent Democrat and Republican. The new 11th consists of 54% of Steve Rothman’s population and 58% of Scott Garrett’s population. That adds up to more than 100% because new districts are bigger than the old ones. This district is fairly affluent and well-educated. It spans from the Ramapo Mountains to the George Washington Bridge.

12th District (R+11)

Location: Skylands

Incumbent: Leonard Lance

Population: +878

Largest city: Mount Olive

Demographics: 83% White, 2% Black, 9% Hispanic, 4% Asian

Rural northwest NJ is a community of interest and up until now it is split 3 ways to help 3 Republican districts in North Jersey. This region should be its own district. By now even this district is more suburban than rural. It is probably one of the wealthiest districts in America. It is solidly Republican unlike neighboring rural areas in Pennsylvania (Poconos) and New York (Catskills). It does not have much area in common with Leonard Lance’s Congressional District, but it does look a lot like Lance’s old State Senate District.

Final Notes

I have been working on New Jersey for a long time and now that the census data is in, this is my final product. If I get positive feedback for it here than I will send it to the actual New Jersey Redistricting Commission.

I am a Democrat and this is what I consider a fair map. I am not claiming it is bipartisan.

Is it better to keep cities together or is it better to divide them in order to maximize black and Hispanic voting power in their respective districts? I don’t know. The best way to find out is to go to Newark, Jersey City, and Elizabeth and ask the black and Hispanic people what they would prefer. However as soon as you split one city you no longer have an excuse not to have exact population equality, and you will be splitting many cities and townships throughout the state.

This should be my last redistricting diary. I don’t plan to do any other states.

Thank you Dave Bradlee for your amazing app! Compare the map I made using Dave’s App to the map I made on my own.

Redistricting outlook: Kansas-Maryland

Now that it’s 2011, the redistricting games will soon begin in earnest, with more detailed Census data expected in the coming weeks and some states holding spring legislative sessions to deal with drawing new maps. Long ago I planned to do state-by-state rundowns of the redistricting process as soon as 2010 election results and Census reapportionment were clear. Now that time has arrived, and it’s time to look at Kansas, Kentucky, Louisiana, Maine, and Maryland.

Previous diary on Alabama, Arizona, and Arkansas

Previous diary on California, Colorado, and Connecticut

Previous diary on Florida, Georgia, and Hawaii

Previous diary on Idaho, Illinois, Indiana, and Iowa

The rest below the fold…

Kansas

Photobucket

Districts: 4

Who’s in charge? Republicans

Is that important? Nope

With an all-Republican delegation, GOP mapmakers may simply try to ensure that Kevin Yoder avoids a close race in the next decade.

Kentucky

Photobucket

Districts: 6

Who’s in charge? Split (Dem Governor and House, GOP Senate)

Is that important? Perhaps

I have heard rumors that Republicans hope to stall the redistricting process past the 2011 state elections, expecting to topple both Gov. Beshear and the Democratic House majority this November. But assuming a continuation of the status quo, Ben Chandler should get a slightly more favorable district than the one he nearly lost in 2010.

Louisiana

Photobucket

Districts: 6, down from 7 in 2002

Who’s in charge? Split (GOP Governor and House, Dem Senate)

Is that important? Not really

The outcome of reapportionment in Louisiana has scarcely been in doubt since Jeff Landry was elected last November. He will be forced against fellow Republican Rep. Charles Boustany in a coastal district. Meanwhile, Cedric Richmond’s VRA-protected seat will have to absorb a lot of new population near Baton Rouge, and Rodney Alexander’s underpopulated northern seat will expand southwest a bit.

Maine

Photobucket

Districts: 2

Who’s in charge? Nonpartisan commission

Is that important? No

Maine does not even traditionally redraw its maps before the election year ending in 2. Sometime in 2013, the commission will make some boundary adjustments, and both Mike Michaud and Chellie Pingree should remain reasonably secure should they still be in office two years from now.

Maryland

Photobucket

Districts: 8

Who’s in charge? Democrats

Is that important? Perhaps

The question here is how aggressive Democrats perceive they can afford to be. They already constructed a master gerrymander in 2002, moving the delegation from a 4-4 split to a thoroughly safe 6-2 Democratic edge. Now, some are pushing for a 7-1 map that remakes Andy Harris’s Eastern Shore seat for a moderate Dem like Frank Kratovil. However, such a map presents serious issues: how to maintain VRA-mandated black majorities in the 4th (represented by Donna Edwards) and 7th (Elijah Cummings)? How to keep the four other Dem incumbents completely safe? With today’s redistricting technology, it can probably be done, but the 1st cannot be made securely Dem lest other districts be jeopardized…only politically competitive enough for Kratovil to stage a comeback.