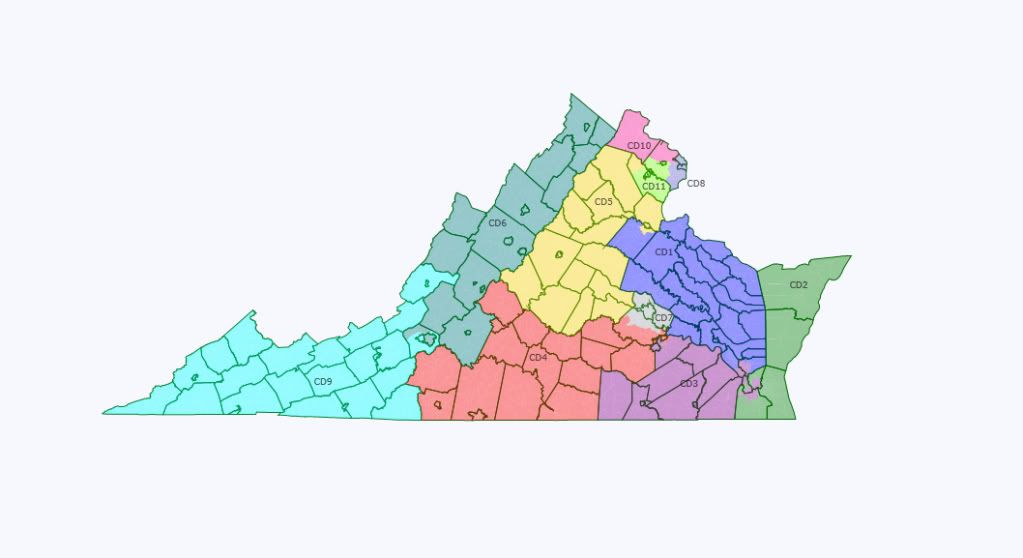
Here is my spin on Virginia with the 2010 Census and political data in Dave’s App. Because of Democratic control of the Senate and Republican control of everything else, a court-drawn map is a reasonable possibility in Virginia. I attempted to prioritize the same goals a court would. These goals were:
1. Preserve a majority-black voter district
2. Avoid county splitting
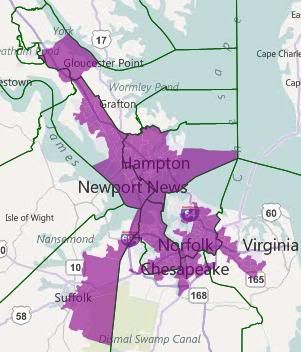
3. Keep each district limited to one region of the state
4. Compactness
District 1: Tidewater
Incumbent: Rob Wittman (R)
Population: 726,817
Two-Party Partisan Performance:
New District: 45.5% Obama, 43.4% Democratic
Old District: 48.4% Obama, 44.8% Democratic
Racial/Ethnic Demographics:
71.3% White
18.8% Black
04.6% Hispanic
02.2% Asian
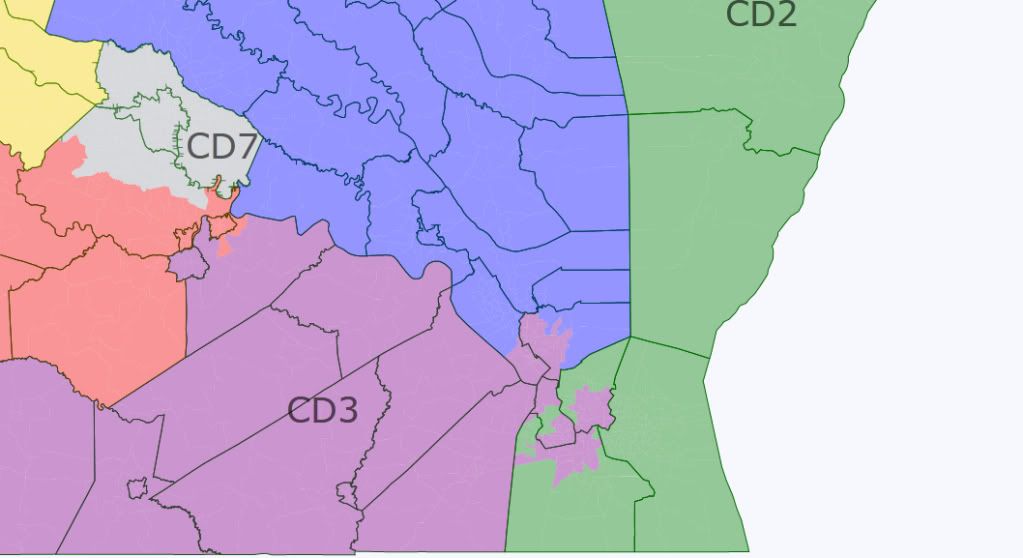
This district takes a portion of the northern peninsula in the Hampton Roads area, the rest of the Tidewater area to the north, and ultra-conservative Hanover County north of Richmond. It becomes less Democratic and safely Republican.
District 2: Hampton Roads
Incumbent: Scott Rigell (R), Randy Forbes (R)
Population: 727,545
Two-Party Partisan Performance:
New District: 49.1% Obama, 46.8% Democratic
Old District: 52.4% Obama, 49.1% Democratic
Racial/Ethnic Demographics:
66.3% White
19.1% Black
06.3% Hispanic
04.9% Asian
The district takes in all of Virginia Beach and the Delmarva Peninsula plus the whiter portions of Chesapeake, Portsmouth, and Norfolk. The district becomes slightly more Republican. It would be tough, but not impossible, for a Democrat to win here. Randy Forbes and Scott Rigell both live in the district, but because this contains much more of Rigell’s territory, I think he’d have the edge.
District 3: Hampton Roads (VRA District)
Incumbent: Bobby Scott (D)
Population: 726,624
Two-Party Partisan Performance:
New District: 69.2% Obama, 65.1% Democratic
Old District: 75.7% Obama, 71.3% Democratic
Racial/Ethnic Demographics:
38.3% White
53.2% Black
04.0% Hispanic
01.8% Asian
This district becomes much more compact, leaving the Richmond area. It is still has a majority of black voters, though that majority is a few percentage points smaller. This district is very safe for Democrats.
District 4: Southside
Incumbent: Robert Hurt (R)
Population: 727,567
Two-Party Partisan Performance:
New District: 42.2% Obama, 43.2% Democratic
Old District: 51.0% Obama, 49.0% Democratic
Racial/Ethnic Demographics:
68.0% White
28.0% Black
03.0% Hispanic
01.1% Asian
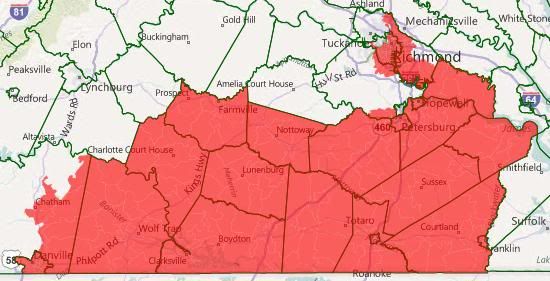
This district shifts west, taking in Virginia’s Southside region. It becomes much more Republican and is probably unwinnable for Democrats.
District 5: Piedmont
Incumbent: None
Population: 728,108
Two-Party Partisan Performance:
New District: 49.7% Obama, 46.2% Democratic
Old District: 48.5% Obama, 47.3% Democratic
Racial/Ethnic Demographics:
73.6% White
14.4% Black
06.2% Hispanic
03.0% Asian
This district shifts north, still containing Charlottesvile but trading Southside for Virginia wine country and portions of the Northern Virginia exurbs. It becomes slightly more Democratic and is winnable with the right candidate. Eric Cantor would probably run here, since it contains a fair amount of his old turf.
District 6: Shenandoah Valley
Incumbent: Bob Goodlatte
Population: 728,381
Two-Party Partisan Performance:
New District: 42.4% Obama, 40.5% Democratic
Old District: 41.9% Obama, 57.9% Democratic
Racial/Ethnic Demographics:
83.9% White
07.9% Black
05.1% Hispanic
01.2% Asian
This is still a Shenandoah Valley district and very, very Republican.
District 7: Richmond
Incumbent: Eric Cantor (R)
Population: 726,869
Two-Party Partisan Performance:
New District: 61.8% Obama, 57.0% Democratic
Old District: 46.6% Obama, 42.1% Democratic
Racial/Ethnic Demographics:
54.0% White
32.7% Black
06.4% Hispanic
04.5% Asian
This district has undergone a huge change, going from a safe Republican to safe Democratic seat. Eric Cantor would stand little chance of victory here. Sen. Donald McEachin and Del. Jennifer McClellan would be the likely Democratic candidates.
District 8: Northern Virginia
Incumbent: Jim Moran (D)
Population: 727,201
Partisan Performance:
New District: 68.2% Obama*, 54.9% Democratic
Old District: 69.3% Obama*, 57.9% Democratic
Racial/Ethnic Demographics:
52.4% White
14.1% Black
18.9% Hispanic
11.3% Asian
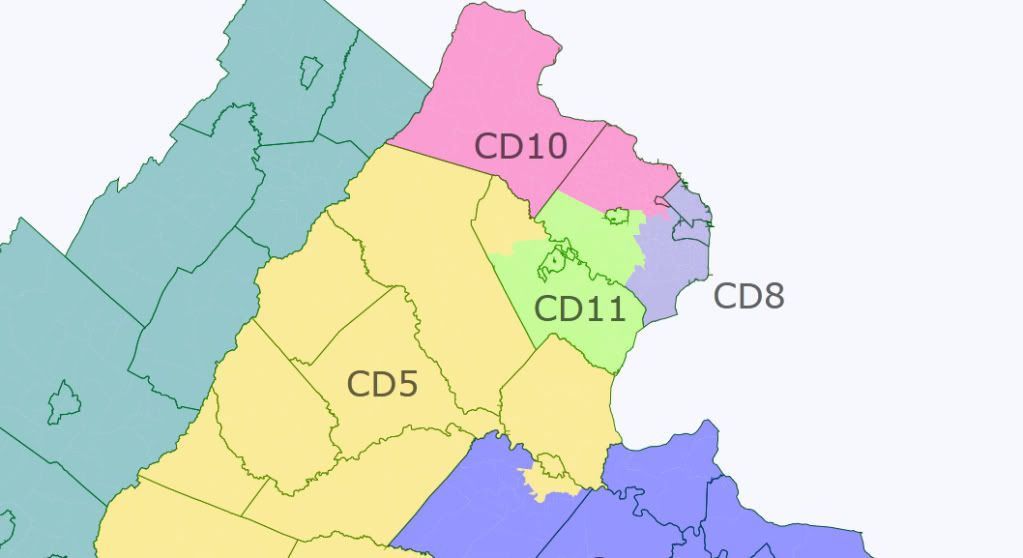
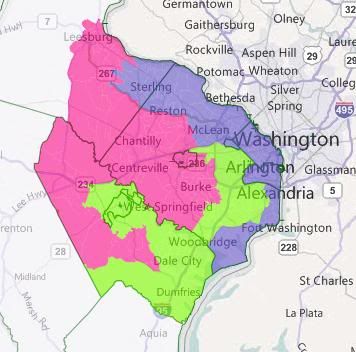
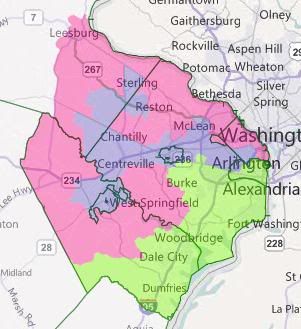
This district contains all of Arlington County and Alexandria City, plus other close-in suburbs in Fairfax County. It becomse slightly less Democratic, but remains safe.
*Note that President Obama’s performance is slightly understated due to an error in the data.
District 9: Southwest Virginia
Incumbent: Morgan Griffith (R)
Population: 728,247
Partisan Performance:
New District: 40.1% Obama, 43.2% Democratic
Old District: 40.3% Obama, 43.7% Democratic
Racial/Ethnic Demographics:
92.2% White
03.4% Black
01.8% Hispanic
01.3% Asian
This district contains Southwest Virginia. Its partisan makeup is unchanged and post-Rick Boucher is probably unwinnable for Democrats.
District 10: Northern Virginia
Incumbent: Frank Wolf (R)
Population: 726,837
Two-Party Partisan Performance:
New District: 54.7% Obama*, 53.6% Democratic
Old District: 50.2% Obama*, 47.2% Democratic
Racial/Ethnic Demographics:
62.8% White
06.0% Black
12.6% Hispanic
16.9% Asian
This district shrinks dramatically, dropping its territory outside Northern Virginia. It contains Loudoun County, the City of Falls Church, and northern Fairfax County. The district becomes significantly more Democratic, which might actually encourage a credible challenger to run against Frank Wolf. My guess would be state Sen. Mark Herring.
*Note that due data errors, this President Obama performed about 2 percentage points better than it appears.
District 11: Northern Virginia
Incumbent: Gerry Connolly (D)
Population: 726,807
Two-Party Partisan Performance:
New District: 57.6% Obama, 51.1% Democratic
Old District: 56.6% Obama, 52.3% Democratic
Racial/Ethnic Demographics:
51.8% White
13.9% Black
17.9% Hispanic
12.6% Asian
This district takes in the remainder of Fairfax County and all of Fairfax City, Mannassas, Manassas Park, and Prince William County. The partisan composition doesn’t change much. Since Conolly survived 2010, I have to beleive he’ll be fine in the future.
This map would probably produce 5 Democrats and 6 Republicans.
