Texas Lege Redistricting

With 4 new congressional seats, Texas of course grew. While we get to increase our congressional delegation, our legislature will stay the same. This means, that state senators will continue to have even larger constituencies and districts than members of congress.

Everyone has speculated where the new congressional districts will be, and looking at the state legislature, especially the house, you can also get a good visual of the growth.

The new population of 25,145,561 means that State Senate districts (31) should have an ideal population of 811,147 and State House districts (150) 167,637.

Which districts will need to grow and which will need to shrink?

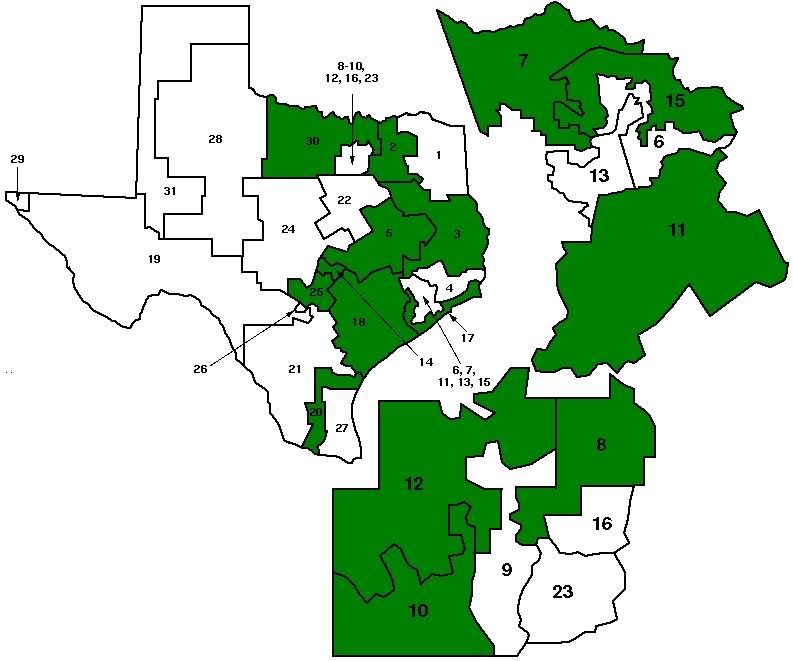
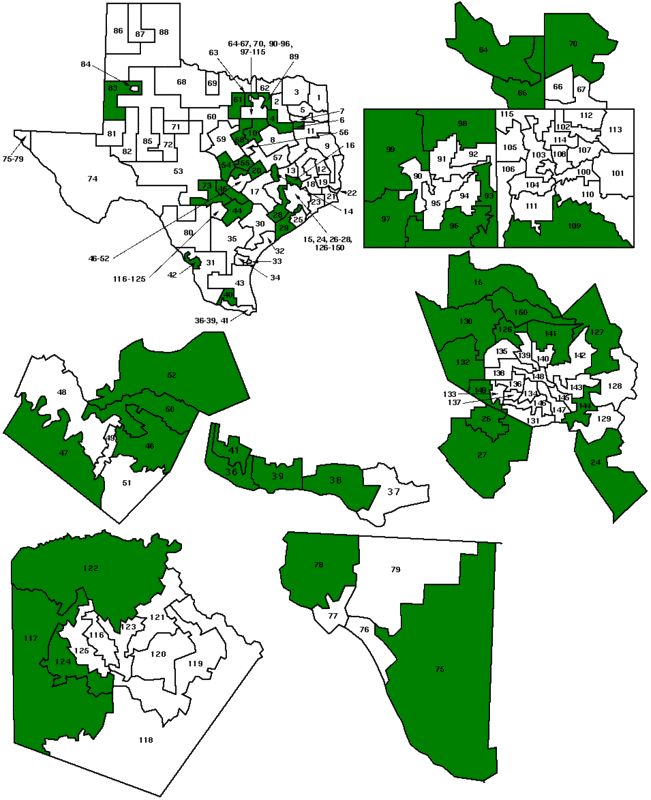
Green colored districts (green because they grew over the past decade) are those that are currently over the ideal population and will need to lose people.  White/non-colored districts are those that will need to add population.

Right now 15 State Senate districts will need to shrink and 16 will need to grow. Half and half.


District Population Deviation Party
1 731,108 (80,039) R
2 856,525 45,378 R
3 818,359 7,212 R
4 790,149 (20,998) R
5 899,155 88,008 R
6 643,019 (168,128) D
7 1,015,027 203,880 R
8 940,963 129,816 R
9 807,907 (3,240) R
10 834,265 23,118 D
11 838,090 26,943 R
12 1,013,641 202,494 R
13 730,086 (81,061) D
14 872,176 61,029 D
15 824,336 13,189 D
16 641,007 (170,140) R
17 847,887 36,740 R
18 861,831 50,684 R
19 766,044 (45,103) D
20 836,938 25,791 D
21 752,602 (58,545) D
22 789,412 (21,735) R
23 749,622 (61,525) D
24 778,148 (32,999) R
25 984,664 173,517 R
26 721,704 (89,443) D
27 786,946 (24,201) D
28 704,340 (106,807) R
29 758,901 (52,246) D
30 823,594 12,447 R
31 727,1151 (84,032) R
Total: 25,145,561

As the list shows, the two largest districts right now, population wise, are 7 & 12. 7 is represented by Republican Dan Patrick who is committed to solving the budget crisis with his abortion sonogram bill. 12 is represented by Republican Jane Nelson.

Patrick and Nelson each represent more people than the states of Wyoming, Vermont, North Dakota, Alaska, South Dakota, Delaware, and Montana. (not combined, just each state individually)

Out of the districts that need to lose population 4 have Democratic state senators (10, 14, 15, 20), with the other 11 having Republican state senators.

Of the districts that need to add people, it’s exactly 8 Democratic districts (6, 13, 19, 21, 23, 26, 27, 29) and 8 Republican districts (1, 4, 9, 16, 22, 24, 28, 31).


District Population Deviation Party
1 146,509 (21,128) R
2 149,622 (18,015) R
3 145,984 (21,653) R
4 181,882 14,245 R
5 159,305 (8,332) R
6 170,168 2,531 R
7 161,276 (6,361) R
8 149,393 (18,244) R
9 145,381 (22,256) R
10 184,699 17,062 R
11 151,703 (15,934) R
12 149,506 (18,131) R
13 156,600 (11,037) R
14 182,078 14,441 R
15 222,505 54,868 R
16 203,299 35,662 R
17 166,171 (1,466) R
18 150,998 (16,639) R
19 139,948 (27,689) R
20 228,091 60,454 R
21 137,058 (30,579) R
22 126,184 (41,453) D
23 144,933 (22,704) D
24 181,472 13,835 R
25 141,704 (25,933) R
26 180,729 13,092 R
27 225,449 57,812 D
28 263,682 96,045 R
29 208,164 40,527 R
30 147,611 (20,026) R
31 165,121 (2,516) D
32 157,055 (10,582) R
33 148,929 (18,708) R
34 143,582 (24,055) R
35 151,882 (15,755) R
36 201,386 33,749 D
37 142,621 (25,016) D
38 182,363 14,726 D
39 172,273 4,636 D
40 215,412 47,775 R
41 185,698 18,061 D
42 171,951 4,314 D
43 148,370 (19,267) D
44 194,258 26,621 R
45 205,670 38,033 R
46 172,464 4,827 D
47 198,311 30,674 R
48 161,817 (5,820) D
49 141,144 (26,493) D
50 191,756 24,119 D
51 158,774 (8,863) D
52 219,345 51,708 R
53 145,845 (21,792) R
54 196,447 28,810 R
55 176,215 8,578 R
56 155,303 (12,334) R
57 144,556 (23,081) R
58 169,146 1,509 R
59 149,195 (18,442) R
60 148,990 (18,647) R
61 176,054 8,417 R
62 154,792 (12,845) R
63 218,386 50,749 R
64 219,345 51,708 R
65 224,883 57,246 R
66 160,543 (7,094) R
67 145,358 (22,279) R
68 135,942 (31,695) R
69 140,554 (27,083) R
70 300,801 133,164 R
71 146,722 (20,915) R
72 139,868 (27,769) R
73 187,204 19,567 R
74 143,566 (24,071) D
75 219,408 51,771 D
76 132,715 (34,922) D
77 132,567 (35,070) D
78 168,785 1,148 R
79 147,172 (20,465) D
80 149,638 (17,999) D
81 159,026 (8,611) R
82 163,234 (4,403) R
83 173,230 5,593 R
84 157,068 (10,569) R
85 143,267 (24,370) R
86 154,914 (12,723) R
87 152,193 (15,444) R
88 141,962 (25,675) R
89 253,976 86,339 R
90 141,349 (26,288) D
91 164,484 (3,153) R
92 154,749 (12,888) R
93 179,024 11,387 R
94 143,509 (24,128) R
95 155,511 (12,126) D
96 231,782 64,145 R
97 168,045 408 R
98 239,343 71,706 R
99 231,238 63,601 R
100 149,033 (18,604) D
101 163,601 (4,036) R
102 131,327 (36,310) R
103 117,346 (50,291) D
104 131,900 (35,737) D
105 164,238 (3,399) R
106 159,716 (7,921) R
107 140,457 (27,180) R
108 143,531 (24,106) R
109 175,255 7,618 D
110 150,703 (16,934) D
111 163,374 (4,263) D
112 148,911 (18,726) R
113 161,303 (6,334) R
114 126,576 (41,061) R
115 140,868 (26,769) R
116 142,944 (24,693) D
117 220,360 52,723 R
118 152,809 (14,828) D
119 157,106 (10,531) D
120 163,187 (4,450) D
121 158,873 (8,764) R
122 246,846 79,209 R
123 132,442 (35,195) D
124 178,044 10,407 D
125 162,162 (5,475) D
126 172,274 4,637 R
127 187,102 19,465 R
128 148,817 (18,820) R
129 150,798 (16,839) R
130 252,386 84,749 R
131 152,889 (14,748) D
132 264,426 96,789 R
133 155,296 (12,341) R
134 147,146 (20,491) R
135 166,937 (700) R
136 146,854 (20,783) R
137 137,876 (29,761) D
138 136,881 (30,756) R
139 150,919 (16,718) D
140 139,275 (28,362) D
141 184,720 17,083 D
142 154,794 (12,843) D
143 127,381 (40,256) D
144 169,715 2,078 R
145 132,730 (34,907) D
146 143,120 (24,517) D
147 146,857 (20,780) D
148 140,946 (26,691) D
149 169,836 2,199 D
150 212,484 44,847 R
Total: 25,145,561

The district with the largest population is 70 represented by Republican Ken Paxton.

54 House districts need to lose population, while 96 House districts need to add people.

Of the districts that need to lose population, 13 are represented by Democrats (27, 36, 38, 39, 41, 42, 46, 50, 75, 109, 124, 141, 149) and 41 are represented by Republicans.

Of the districts that need to add population, 36 are represented by Democrats (22, 23, 31, 37, 43, 48, 49, 51, 74, 76, 77, 79, 80, 90, 95, 100, 103, 104, 110, 111, 116, 118-120, 123, 125, 131, 137, 139, 140, 142, 143, 145-148) and 60 are represented by Republicans.

Of the 24 seats that Republicans picked up last November (I’m also counting the 2 turn coats), 8 districts (40, 45, 47, 52, 78, 93, 96, 117) will need to lose population and 16 districts (1, 3, 12, 21, 33-35, 57, 69, 85, 101, 102, 106, 107, 133, 134) will need to add people.

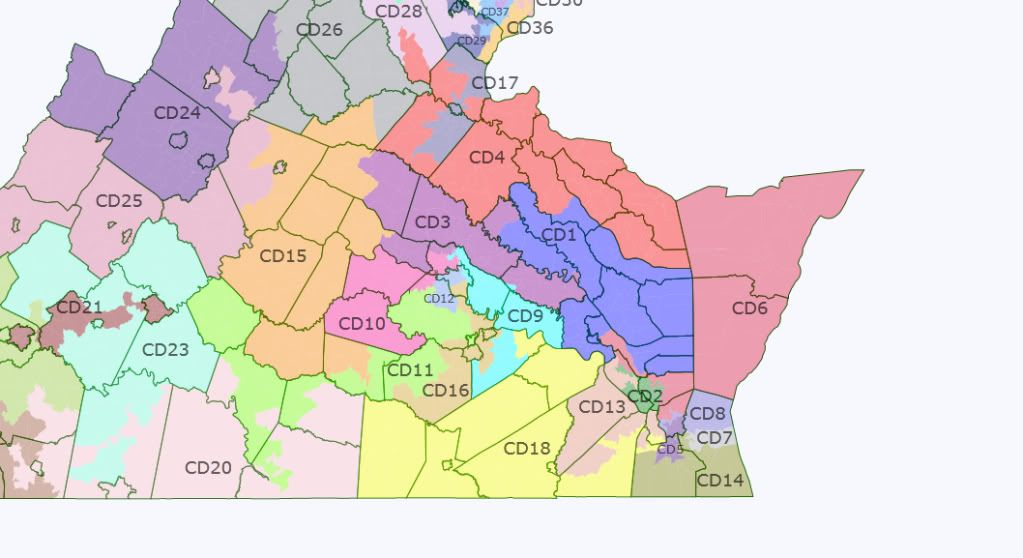
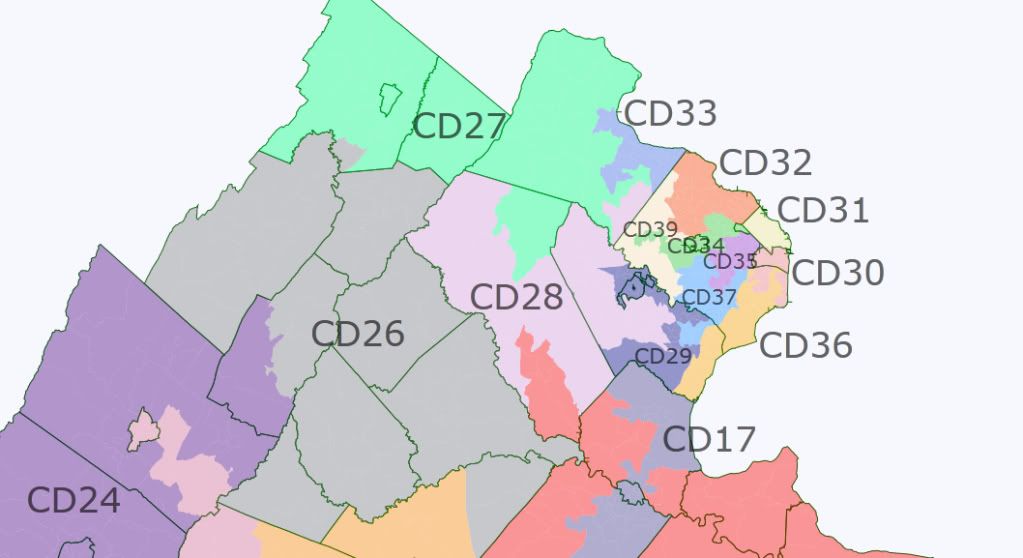
Virginia – 7D, 4R

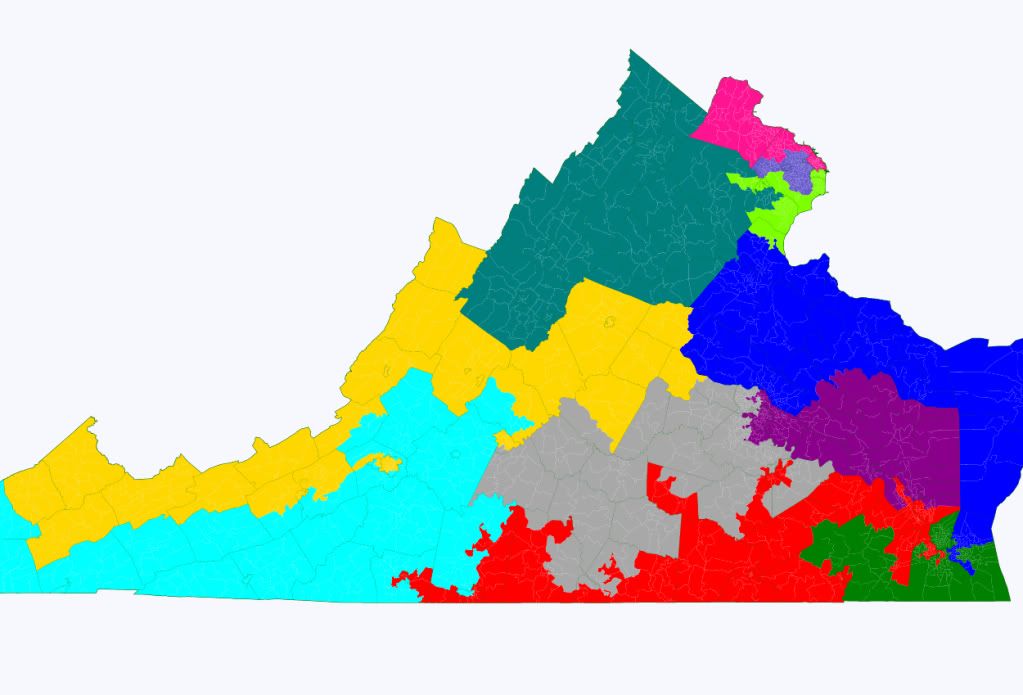
I set out the other day to create a safe 6D, 5R map of Virginia, and found that in fact it’s quite easy to do better.  

Going through the districts in order of partisan lean.  

Solid D

VA-4:

Red district in Southside, Hampton Roads

52% Black, 39% White

67.8% Obama, 63% Democrat

VA-11:

Greenish district in NOVA

48% White, 20% Black, 21% Latino

63% Obama, 57% Democrat

VA-3:

Purple district based in Richmond

53% White, 35% Black

62.2% Obama, 58.5% Democrat

VA-8:

Purple district in Fairfax county

54% White, 19% Asian, 17% Latino, 8% Black

59.9% Obama,  56.2% Democrat

Likely D

VA-10:

Pink district in Loudoun, Fairfax, and Arlington

57.1% Obama, 57.3% Democrat  

Lean D

VA-2:

Green district in Hampton Roads

56.2% Obama, 53% Democrat

VA-5:

Yellow district in West

53.6% Obama, 53.7% Democrat


Solid R:

VA-1:

Blue diestrict in Eastern Virgina

55.8% McCain, 58% Republican

VA-7:

Grey district in Southside/Richmond suburbs

60.2% McCain, 62.1% Republican

VA-6:

Turquoise district based in Shenandoah valley

58.9% McCain, 62.2% Republican

VA-9:

Light blue district in Southwestern Virginia

64.5% McCain, 61.8% Republican.

Admittedly, although favored, Democrats could lose VA-5, VA-2, and VA-10 in the right election, giving them only four absolutely solid seats.  That said, historically Republicans have been very unlikely to hold onto southern seats with any sort of Democratic lean.  

Thoughts?  

Democratic Gerrymander of VA Senate

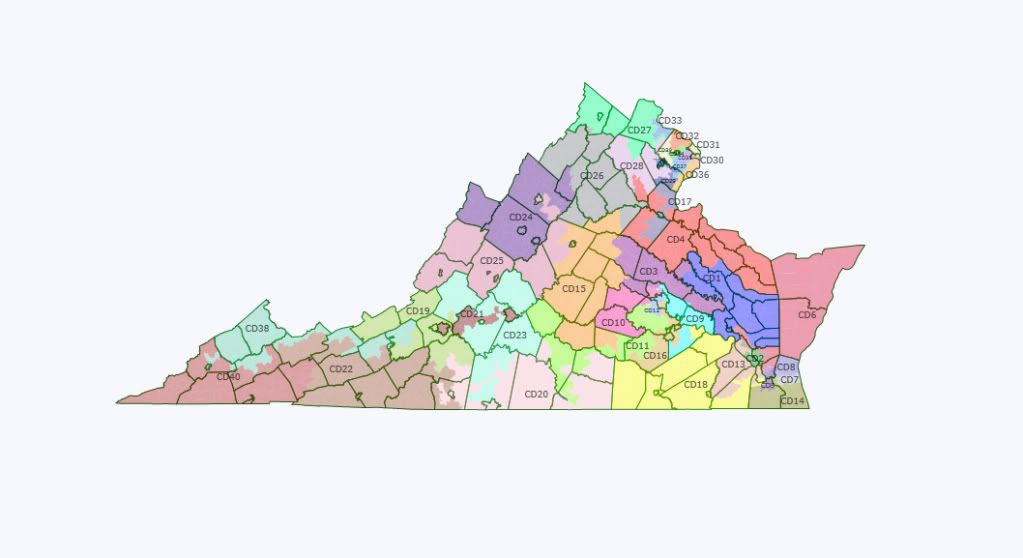
Democratic control of the Virginia Senate gives Democrats the possibility of some leverage in drawing the lines for Congress.  Retaining control of the Senate is very important if Republicans put off redrawing the Congressional lines until after November, but the majority is fairly narrow at 22D-18R, and the entire body is up for re-election this fall.  

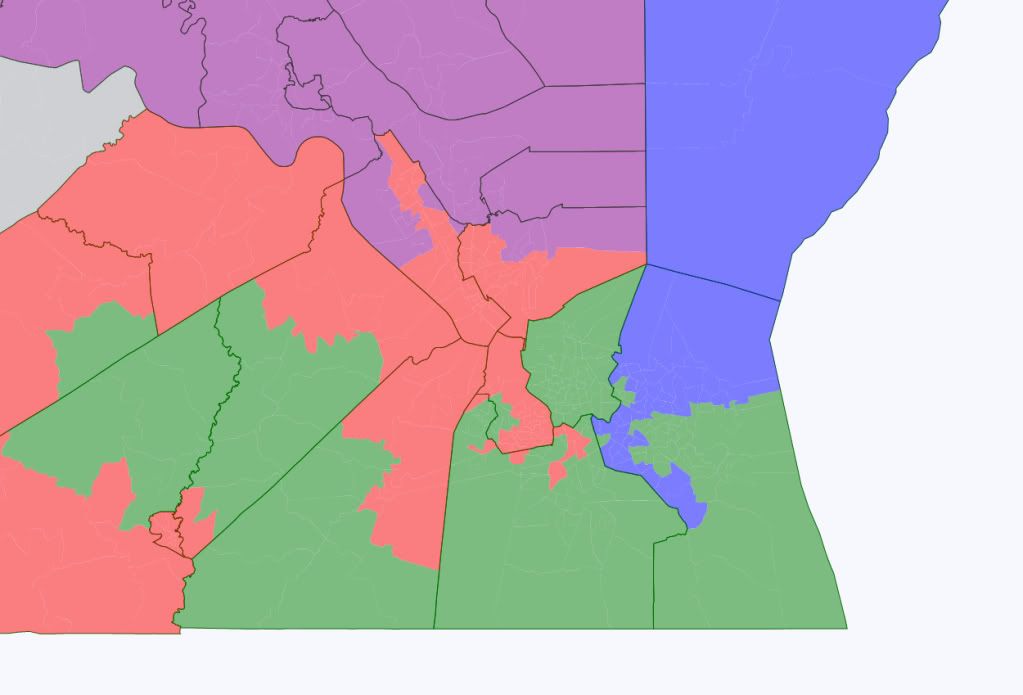
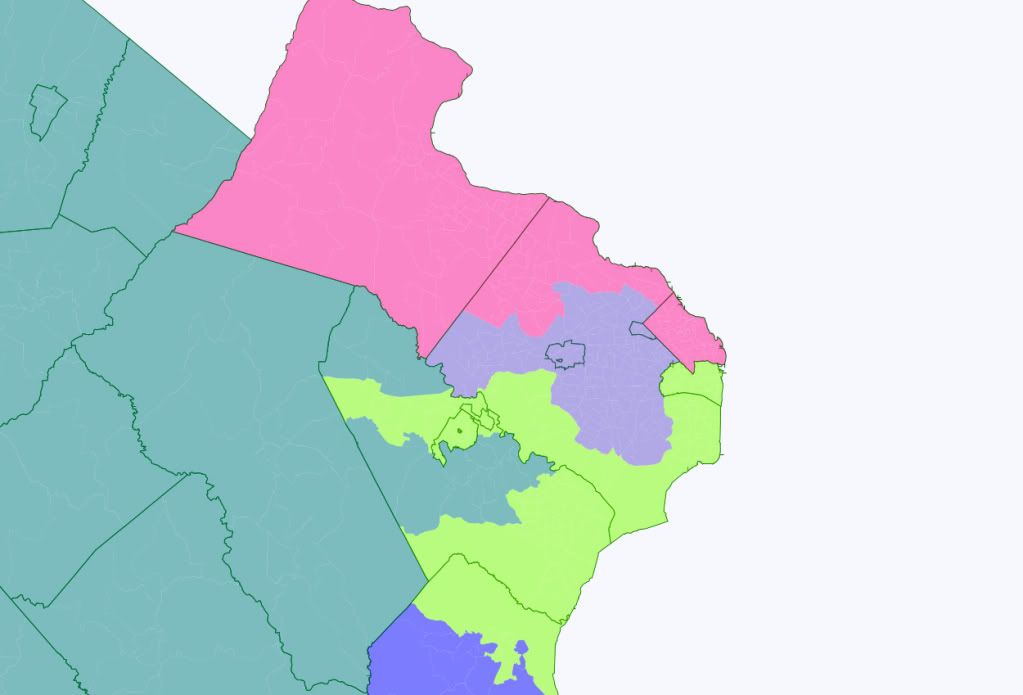
I’ve attempted to create a map that balances the interests of current senators in reelection and the national interests of the party in maintaining control by any means necessary.  I think I’ve been able to sufficiently protect all incumbents while maximizing the number of Democratic districts, and the map is a large improvement over the current Republican gerrymander.  Although conventional wisdom holds that each chamber will draw its own lines, I’m not sure the House of Delegates would approve something like this map.

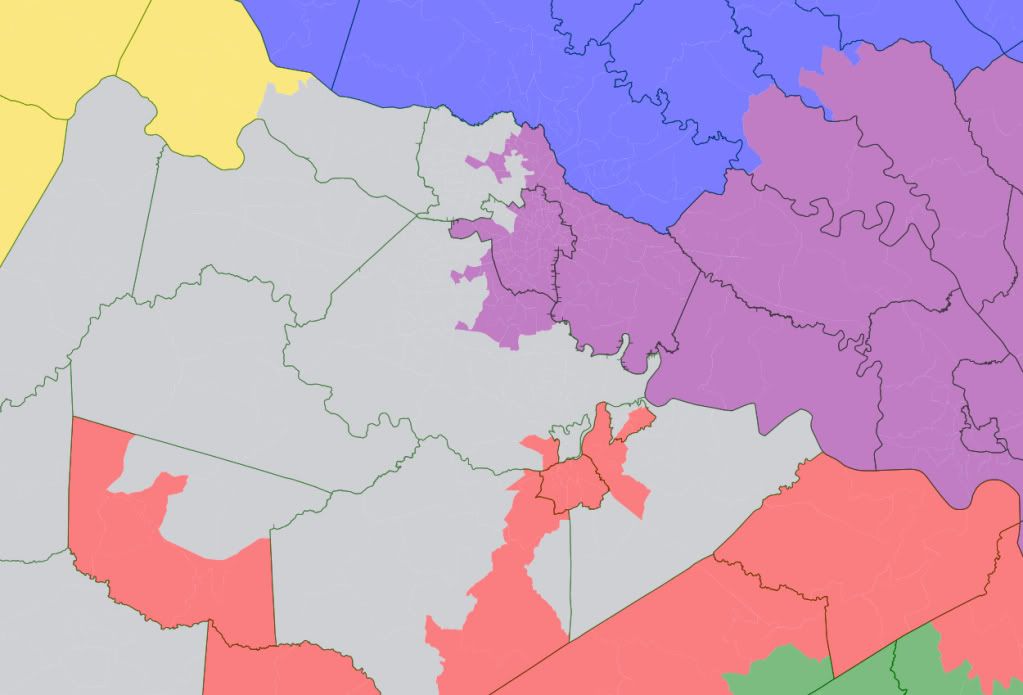
Photobucket

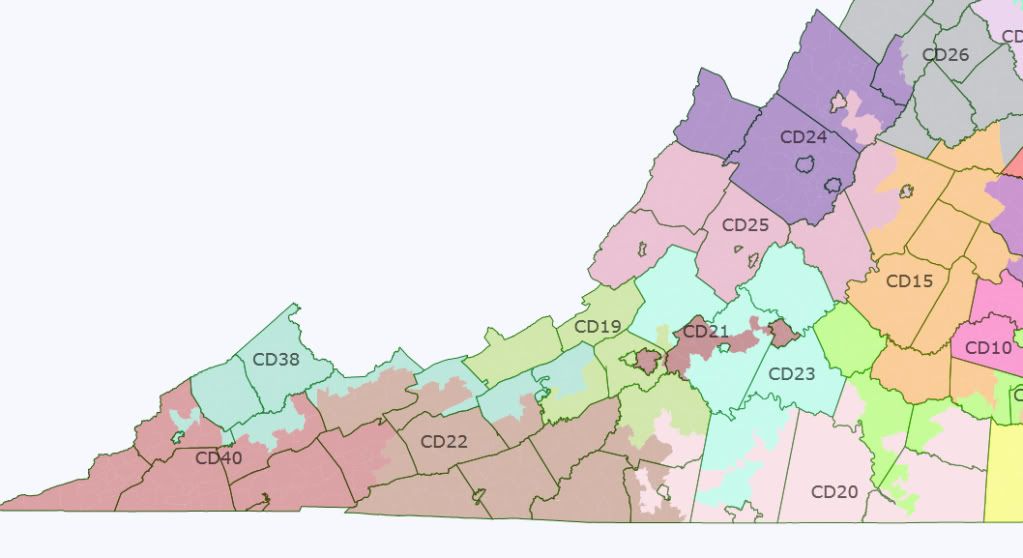
Western Virginia:

Photobucket

District 15: Open

Obama 53.9%

Democratic 51.1%

District 19: Ralph Smith (R)

Obama 38.3%

Democratic 40.1%

District 20: Roscoe Reynolds (D)

Obama 52.2%

Democratic 49.5%

District 21: John Edwards (D)

Obama 52.6%

Democratic 51.8%

District 22: Open

Obama 34.4%

Democratic 38.7%

District 23: Steve Neuman (R), Bill Stanley (R)

Obama 33.5%

Democratic 35.3%

Note: Making a last minute change with the 21st, I accidentally cut this district in half, but it would only require shifting one precinct to make the district contiguous.

District 24: Emmett Hanger (R)

Obama 34.7%

Democratic 33.0%

District 25 Creigh Deeds (D)

Obama 58.4%

Democratic 56.3%

District 38: Phil Puckett (D)

Obama 50.2%

Democratic 52.1%

District 40: William Wampler (R)

Obama 34.1%

Democratic 38.1%

Eastern Virginia:

Photobucket

District 1: Tommy Norment (R)

Obama 41.1%

Democratic 41.2%

District 2: Mamie Locke (D), John Miller (D) (maybe)

Obama 72.3%

Democratic 66.3%

Black VAP 51.1%

District 3: Ryan McDougal (R), Walter Stosch (R)

Obama 35.8%

Democratic 35.2%

District 4: Richard Stuart (R)

Obama 45.1%

Democratic 42.5%

District 5: Yvonne Miller (D)

Obama 72.7%

Democratic 67.9%

Black VAP 51.3%

District 6: Ralph Northam (D)

Obama 56.7%

Democratic 52.5%

District 7: Frank Wagner (R)

Obama 55.1%

Democratic 49.5%

District 8: Jeff McWaters (R)

Obama 53.1%

Democratic 52.2%

District 9: Donald McEachin (D)

Obama 74.7%

Democratic 70.5%

Black VAP 56.7%

District 10: John Watkins (R)

Obama 42.2%

Democratic 39.0%

District 11: Steve Martin (R), Frank Ruff (R)

Obama 37.8%

Democratic 35.6%

District 12: Open

Obama 64.1%

Democratic 59.0%

District 13: Fred Quayle (R), John Miller (D) (maybe)

Obama 50.3%

Democratic 49.5%

District 14: Harry Blevins (R)

Obama 39.7%

Democratic 39.0%

District 16: Henry Marsh (D)

Obama 72.1%

Democratic 65.0%

Black VAP 51.0%

District 17: Edd Houck (D)

Obama 51.2%

Democratic 45.2%

District 18: Louise Lucas (D)

Obama 65.1%

Democratic 61.3%

Black VAP 52.3%

Northern Virginia:

Photobucket

District 26: Mark Obenshain (R)

Obama 41.6%

Democratic 37.9%

District 27: Jill Vogel (R)

Obama 37.9%

Democratic 40.6%

District 28: Open

Obama 43.9%

Democratic 41.0%

District 29: Chuck Colgan (D)

Obama 58.9%

Democratic 50.0%

District 30: Patsy Ticer (D)

Obama 68.6%

Democratic 66.2%

District 31: Mary Margaret Whipple (D)

Obama 68.1%

Democratic 70.3%

District 32: Janet Howell (D)

Obama 59.0%

Democratic 57.2%

District 33: Mark Herring (D)

Obama 54.6%

Democratic 49.2%

District 34: Chap Peterson (D)

Obama 58.8%

Democratic 54.7%

District 35: Dick Saslaw (D)

Obama 61.9%

Democratic 58.9%

District 36: Toddy Puller (D)

Obama 68.4%

Democratic 61.5%

District 37: Dave Marsden (D)

Obama 59.4%

Democratic 54.6%

District 39: George Barker (D)

Obama 56.2%

Democratic 53.0%

I would rate the lean of the seats as follows:

Safe Democratic (Obama and Democratic vote percentage both above 50%): 22

Toss-up (Obama percentage or Democratic vote percentage above 50%): 5

Safe Republican (Everything else): 13

Thoughts?

AL, HI, MO, NV, UT: Population by CD

(Bumped – promoted by DavidNYC)

The Census Bureau unleashed population data from five more states today. First off is Alabama, who remained at seven seats (although they were close to losing one). Their target for 2010 is 682,819, up from about 635K in 2000. Most of the action looks to be in the Birmingham area, where suburban AL-06 was the big gainer and urban VRA district AL-07 was the big loser. While the knee-jerk expectation would be that AL-07 would simply extend out into the suburbs to make up that deficit, it’s likelier that the newly-GOP-controlled legislature will try to extend AL-07 to Montgomery or Huntsville (or both) to incorporate the African-American populations there, in order to make it blacker and the state’s other districts safer for white Republican representatives.


District Population Deviation
AL-01 687,841 5,022
AL-02 673,877 (8,942)
AL-03 681,298 (1,521)
AL-04 660,162 (22,657)
AL-05 718,724 35,905
AL-06 754,482 71,663
AL-07 603,352 (79,467)
Total: 4,779,736

Hawaii is pretty drama-free; its new target is 680,151, up from 605K in 2000. With Maui as the fastest growing part of the state, the 2nd will need to give a little population to the 1st, although the boundary movement will happen in the suburban parts of Oahu.


District Population Deviation
HI-01 658,672 (21,479)
HI-02 701,629 21,748
Total: 1,360,301

Missouri missed the cut, and needs to lose one of its nine seats. Based on eight seats, its new target is 748,616, up from 622K in 2000. Missouri redistricting isn’t going to go well for Dems (and for Russ Carnahan, in particular) because the three districts with the lowest population are the three districts with Democratic representatives. While MO-01 lost the most population, the VRA will probably keep this in place as a black-majority district for Lacy Clay: the city of St. Louis’s population has shrunk so much (now only 319K) that it only makes up about half a district anymore, and his district already includes the city’s black-majority northern suburbs, so it’s likely to have to move westward into the inner-ring suburbs of St. Louis County or else southward to encompass all of St. Louis city. Either way, that’s coming out of Russ Carnahan’s MO-03, which will also need to give some ground to MO-08 below it.


District Population Deviation
MO-01 587,069 (161,547)
MO-02 706,622 (41,994)
MO-03 625,251 (123,365)
MO-04 679,375 (69,241)
MO-05 633,887 (114,729)
MO-06 693,974 (54,642)
MO-07 721,754 (26,862)
MO-08 656,894 (91,722)
MO-09 684,101 (64,515)
Total: 5,988,927

I think we’ve found the most populous CD in the entire nation: NV-03, with more than a million people (its main rival for that honor, UT-03, didn’t break that mark; see below). Nevada, of course, is moving to four districts, with a target of 675,138 (up only slightly from 666K in 2000, but that was a three-district map). As you might expect, the state has become significantly more Hispanic, with the 1st going from 28% Hispanic in 2000 to 37%, the 2nd from 15% to 20%, and the 3rd from 16% to 23%.

While there had been discussion of Joe Heck’s district expanding outward to take in some of the rural counties, that will barely need to happen. Clark County (where Las Vegas is) has a population of 1,951,269, which is 72.3% of the state’s population (up from 68% in 2000). In other words, with 3/4s of the state’s population in Clark Co., NV-02 can pretty much continue being all of the state except Clark County (although it’ll need to lose its current small portions in Clark Co.), while Clark Co. will be divvied up among three districts instead of two. (Although, considering how empty the cow counties are, that stray 2.7% of the state may still wind up occupying a huge geographical footprint.)


District Population Deviation
NV-01 820,134 144,996
NV-02 836,562 161,424
NV-03 1,043,855 368,717
Total: 2,700,551

Utah, of course, is also set to gain a seat. Its new four-seat target is 690,971 (the target was 744K in 2000, when it had three seats). The biggest growth was in Salt Lake City’s southern suburbs and also in the Provo area further south, both of which are found in UT-03. Whether the GOP-controlled legislature creates a new seat confined to the SLC area or tries cracking it four ways instead of three will depend on whether they decide to target Jim Matheson (currently the Democrat with the reddest House seat) or concedes a seat to him.


District Population Deviation
UT-01 906,660 215,869
UT-02 890,993 200,022
UT-03 966,232 275,261
Total: 2,763,885

CO, OR, and WA: Population by CD

(Bumped – promoted by DavidNYC)

We’ve got three more states’ worth of Census data dump to look at today, and instead of a random collection today, it’s thematically consistent: the three medium-size light-blue states of the west. First off the bat is Colorado, which stays at seven seats; its target population is 718,457, up from an average of about 615K in 2000. (Remember, the “deviation” is how many seats the district will need to gain or shed in order to conform, not a raw number reflecting loss or gain. You can calculate raw gain/loss by working off the 2000 target, if you’re curious.)


District Population Deviation
CO-01 662,039 (56,418)
CO-02 733,805 15,348
CO-03 706,186 (12,271)
CO-04 725,041 6,584
CO-05 725,902 7,445
CO-06 797,813 79,356
CO-07 678,410 (40,047)
Total: 5,029,196

The redistricting solution here seems pretty simple: CO-01 (Denver proper) and CO-07 (Denver’s northern suburbs) will need to shift southward to accommodate the large growth in CO-06 (Denver’s southern suburbs), while the rest of the state stayed pretty stable. Interestingly, despite CO-07 lagging the state growth-wise, the state’s strongest Hispanic growth was in CO-07, which since 2000 went from 20% to 28% Hispanic.

Oregon stays at five seats, having just barely missed the cut for #6. Its target population is a beefy 766,215, up from about 684K in 2000.


District Population Deviation
OR-01 802,570 36,355
OR-02 769,987 3,772
OR-03 762,155 (4,060)
OR-04 739,234 (26,981)
OR-05 757,128 (9,087)
Total: 3,831,074

Several Oregon districts are going to have to shift north, where the state’s growth was centered in Portland’s western suburbs in OR-01. The smallest gains happened in OR-04, which is Eugene and the economically-hard-hit timber country to its south. OR-05, which is sandwiched between the 1st and 4th in the mid-Valley also needs to pick up population; the 5th is the state’s most Hispanic district, going from 10% to 15% Hispanic since 2000.

Finally, here’s Washington, which barely made the cut, and got its tenth seat. Its target is 672,454, up from 655K in 2010. (Interestingly, if you divided Washington by 9, you’d wind up with a lower target than Oregon, at 747,171. There’s a lot more to the reapportionment formula than that sort of purely mechanical calculation, of course, but that ought to raise a few eyebrows in Oregon.)


District Population Deviation
WA-01 739,455 67,001
WA-02 760,041 87,587
WA-03 779,348 106,894
WA-04 774,409 101,955
WA-05 723,609 51,155
WA-06 709,570 37,116
WA-07 704,225 31,771
WA-08 810,754 138,300
WA-09 723,129 50,675
Total: 6,724,540

The two main nodes of growth in Washington are WA-08 (Seattle’s eastern suburbs) and WA-03 (Vancouver, which is really Portland’s northern suburbs). However, there was almost as much growth in WA-04, east of the Cascades, which means that any new configuration is going to have two-and-a-half districts east of the Cascades, with (unlike now) one district traversing the mountains. The 4th is also by far the most Hispanic district in the state, growing from 27% to 34% Hispanic since 2000. One other interesting tidbit: in three of the state’s nine districts (1st, 7th, and 8th, all in the Seattle area) the largest non-white group isn’t African-Americans or Hispanics, but rather Asians.

More over the flip…

Finally, did you know that Census 2010 data, via American FactFinder, is available not only at the congressional district level, but also the legislative district level? Because a) I’m a Washingtonian, and b) I’m a nerd (and c), it’s not that big a project, since Washington doesn’t have separate Senate and House districts), I thought I’d also include Washington broken down by LD, in case you want a finer-grained sort on the state’s population gain. The number of districts will stay at 49, so the new target is 137,236.


District Population Deviation
LD-01 147,265 10,029
LD-02 163,707 26,471
LD-03 120,601 (16,635)
LD-04 141,254 4,018
LD-05 161,403 24,167
LD-06 141,123 3,887
LD-07 130,475 (6,761)
LD-08 149,474 12,238
LD-09 136,166 (1,070)
LD-10 134,117 (3,119)
LD-11 134,027 (3,209)
LD-12 132,531 (4,705)
LD-13 143,750 6,514
LD-14 130,478 (6,758)
LD-15 132,788 (4,448)
LD-16 154,830 17,594
LD-17 150,727 13,491
LD-18 160,083 22,847
LD-19 126,904 (10,332)
LD-20 141,029 3,793
LD-21 133,156 (4,080)
LD-22 141,695 4,459
LD-23 130,119 (7,117)
LD-24 132,679 (4,557)
LD-25 145,035 7,799
LD-26 133,755 (3,481)
LD-27 123,857 (13,379)
LD-28 119,494 (17,742)
LD-29 127,259 (9,977)
LD-30 129,998 (7,238)
LD-31 137,685 449
LD-32 122,038 (15,198)
LD-33 129,246 (7,990)
LD-34 125,055 (12,181)
LD-35 138,142 906
LD-36 133,901 (3,335)
LD-37 127,546 (9,690)
LD-38 129,624 (7,612)
LD-39 143,154 5,918
LD-40 138,925 1,689
LD-41 142,722 5,486
LD-42 146,619 9,383
LD-43 133,976 (3,260)
LD-44 156,499 19,263
LD-45 136,432 (804)
LD-46 127,849 (9,387)
LD-47 140,146 2,910
LD-48 130,423 (6,813)
LD-49 134,779 (2,457)
Total: 6,724,540

What’s that you say? You don’t have the Washington legislative district map committed to memory? And yet you call yourself a Swingnut? Well, here it is. The largest growth came in LDs 2 (eastern Pierce Co.) and 5 (eastern King Co.), which are the most exurban parts of WA-08, as well as 44 (eastern Snohomish Co.: exurban WA-02), and 18 (northern Clark Co.: exurban WA-03). The slowest growth was in LDs 3 (downtown Spokane), 28 (Lakewood and Fort Lewis, south of Tacoma), 32 (Shoreline and Edmonds, north of Seattle), 27 (downtown Tacoma), and 34 (West Seattle). (If you’re wondering what the lean of these districts is, we’ve got that, too.)

California Redistricting: The Democrats’ Proposal

Cross posted on my blog http://frogandturtle.blogspot…. which you should visit for more election analysis and redistricting maps.

Before November 2nd 2010, it appeared that Democrats would control the redistricting process because most polls suggested Jerry Brown (D) would become Governor. Brown did win and the Democrats retained their majorities in the state legislature. They, however, lost control of the redistricting process. The voters passed Proposition 20 which transferred the redistricting power from the state legislature to a 14 member commission compromised of 5 Democrats, 5 Republicans and 4 independents. The commission must draw districts according to communities of interest which are similar communities based on the residents’ ethnicities, location and income. Also, at least three members of each party must approve the map before it takes effect. Even if Democrats do not control redistricting the way they used to, they will certainly propose some maps to the committee that will protect Democratic incumbents and eliminate a few Republicans who are in gerrymandered districts. Although the Democrats crafted the 2002 map as a bipartisan plan, the lines resemble a Republican gerrymander. For example, San Bernardino and Riverside County both cast narrow majorities for Obama and have about 5 districts between them. A Democrat only holds one of those districts. The Democrat is Joe Baca (D) but his district does not even touch Riverside County. So Riverside County which voted for Obama and has enough people for nearly three districts does not even have a Democratic representative. Also, Orange County voted for McCain by three points and has around 3 million people, enough population for almost five districts. How many Democratic districts cover at least part of Orange County? The answer is only one: the 47th district represented by Loretta Sanchez (D) which covers Santa Ana and Anaheim. Although Democrats worry that the independent commission will carve up districts leaving Democratic incumbents with no familiar territory, Democrats should not be too worried. The commission likely will weaken many Republicans too.

This leads to why I am drawing this map and it is because I am predicting what the Democrats will propose to the commission. Although the commission makes the final decision, both parties will draw up proposals suggesting what the commission should do. For the Democrats, their proposal needs to protect their incumbents, create more opportunities in the Inland Empire and Central Valley while not drawing convoluted lines. Also, my proposal respects the VRA which requires a certain number of minority majority districts in order to ensure minorities are not underrepresented in the House. For example, I made the 15th and 32nd districts with Asian representatives more Asian. I also created three new districts designed to elect Hispanics because California’s Hispanic population is growing rapidly and will need representation. Also, California’s Hispanic population is 36% and there are only 8 Hispanic representatives in 53 congressional districts. The problem is that Hispanic turnout rates are low so districts with a Hispanic percentage of 51% will not have enough Hispanic voters to elect a Hispanic representative. If the district is Democratic but has Republican white voters though, there can be enough Hispanics in the Democratic primary to elect a Hispanic candidate. Some of my districts have low Hispanic populations but the population numbers are from 10 years ago so the Hispanic population should be larger. I also created 29 Safe Democratic seats, 5 Likely Democratic seats, 3 lean Democratic seats, 2 Toss Up seats, 2 Lean Republican seats, 2 Likely Republican seats (these could be competitive in a few years if demographic trends continue) and 10 Safe Republican seats. Safe represents a likely 20%+ win for the listed party, likely represents a likely 10%-19% win, lean represents a likely 5%-9% win and tossup represents a likely 0%-4% win. I wanted to create more seats for the Democrats but I did not want convoluted lines because the commission will reject those. Anyway, here are some helpful links and the maps:

Current maps of California’s congressional districts: http://www.nationalatlas.gov/p…

A few notes: if you want a better picture of the maps, click on them. Also, the demographics are from the 2000 census (2010 data is not available yet.) Old Demographics means the demographics of the old districts. “Change” represents how the partisan makeup of the district is compared to the old lines.  

Photobucket

Northern California

California’s 1st Congressional District Mike Thompson (D)

Obama 190,394 64%, McCain 101,225 34%

Change: McCain +4

Demographics: 19% Hispanic, 69% White

Old Demographics: 17% Hispanic, 71% White

Communities of Interest: Eureka, Clear Lake, Napa

Status: Safe Democratic

Mike Thompson’s district becomes a few points more Republican with the loss of some Sonoma County towns and the addition of Republican Colusa and Glenn Counties. Those changes are not significant population wise and the Democratic counties of Yolo, Napa, Sonoma, Mendocino and Humboldt keep this district safe for Thompson.

California’s 2nd Congressional District Wally Herger (R)

Obama 123,563 42%, McCain 164,567 56%

Change: McCain +3

Demographics: 12% Hispanic, 78% White

Old Demographics: 14% Hispanic, 76% White

Communities of Interest: Redding, Chico, Yuba City

Status: Safe Republican

The district undergoes some geographical changes but the politics and the demographics of the district do not change much. The district loses Trinity, Colusa and Glenn Counties to the 1st but picks up Modoc, Lassen, Plumas and Sierra Counties to the east. Those counties make the district a bit more Republican but it was already safe for its representative who called a right wing terrorist a “Great American.” It also remains compact.

Photobucket

Sacramento Area

California’s 3rd Congressional District Dan Lungren (R)

Obama 144,028 51%, McCain 135,025 47%

Change: Obama +4

Demographics: 6% African American, 7% Asian, 11% Hispanic, 71% White

Old Demographics: 4% African American, 6% Asian, 10% Hispanic, 74% White

Communities of Interest: Citrus Heights, Folsom

Status: Toss Up

In 2008 and 2010, Democrats believed they had the candidate to beat Lungren but he held onto his seat. He won by seven points in 2010 against Ami Bera (D), a strong candidate in a strong Republican year. 2012 should be a neutral year at best for Republicans so if Bera runs again, he would have a strong chance to win. The district is more Democratic now because the district is entirely in Sacramento. It used to contain some Republican leaning rural counties but by losing those, the district becomes more Democratic.

California’s 4th Congressional District Tom McClintock (R)

Obama 152,125 45%, McCain 181,443 53%

Change: Obama +2

Demographics: 10% Hispanic, 82% White

Old Demographics: 9% Hispanic, 83% White

Communities of Interest: Roseville, Auburn, Nevada City

Status: Safe Republican

The district appears to undergo major changes by losing some northern rural counties but it actually keeps most of its residents. It becomes more of a Sacramento suburban district than a northern rural district though. It picks up rural parts of Yuba County and retains suburban Placer and El Dorado Counties while losing heavily Republican counties in northeast California. McClintock had a tough race here in 2008 and although the district becomes two points more Democratic, McClintock should be safe.

California’s 5th Congressional District Doris Matsui (D)

Obama 170,519 68%, McCain 75,712 30%

Change: McCain +4

Demographics: 13% African American, 16% Asian, 20% Hispanic, 45% White

Old Demographics: 14% African American, 15% Asian, 21% Hispanic, 43% White

Communities of Interest: Sacramento, Elk Grove

Status: Safe Democratic

Matsui’s district remains similar to its current configuration. It retains heavily minority and Democratic parts of Sacramento County. The only significant difference is that I extended her district up to the northern Sacramento County border to pick up some Republican areas to weaken the 3rd. Matsui’s district is completely safe for her and she is too popular for a successful primary challenge.

Photobucket

Bay Area

California’s 6th Congressional District Lynn Woolsey (D)

Obama 272,880 76%, McCain 81,299 23%

Change: McCain +1

Demographics: 15% Hispanic, 76% White

Old Demographics: 15% Hispanic, 76% White

Communities of Interest: Novato, San Rafael, Santa Rosa

Status: Safe Democratic

Besides losing the Mendocino County border and picking up the Sonoma Valley, the 6th district does not  change much. It remains very white and heavily Democratic.

California’s 7th Congressional district George Miller (D)

Obama 213,820 64%, McCain 112,657 34%

Change: McCain +15

Demographics: 11% Asian, 12% Hispanic, 70% White

Old Demographics: 17% African American, 13% Asian, 21% Hispanic, 43% White

Communities of Interest: Pinole, Martinez, Danville

Status: Safe Democratic

Miller’s district becomes less Democratic by losing all of its territory except for Pinole, Concord and Martinez (his home.) I had to move Richmond out of his district to boost the African American population of the 9th district. I doubt Miller will like running under these new lines that now include Lafayette, Walnut Creek and Danville. Even though this is the Democrats’ proposal, they will have to make the lines compact for the commission to even consider the proposal. Anyway, this district is too Democratic for a Republican to win because Obama won 64% here which is higher than his statewide average of 61%. Also, no other representative lives in this district so Miller should not face a primary challenge.

Photobucket

San Francisco/Oakland

California’s 8th Congressional District Nancy Pelosi (D)

Obama 283,378 85%, McCain 41,932 13%

Change: McCain +1

Demographics: 8% African American, 28% Asian, 15% Hispanic, 44% White

Old Demographics: 9% African American, 29% Asian, 16% Hispanic, 43% White

Communities of Interest: San Francisco

Status: Safe Democratic

Pelosi’s district picks up a few precincts in the Sunset District but besides that, her district does not change at all.

California’s 9th District Barbara Lee (D)

Obama 275,448 90%, McCain 23,750 8%

Change: Obama +4

Demographics: 28% African American, 16% Asian, 20% Hispanic, 32% White

Old Demographics: 26% African American, 15% Asian, 19% Hispanic, 35% White

Communities of Interest: Richmond, Berkeley, Oakland

Status: Safe Democratic

Lee’s district does change a bit as it loses a few Hispanic neighborhoods in South Oakland. Her district’s population growth was minimal so it needed to pick up people. It moved north into Contra Costa County to pick up Richmond with a large African American population. Although Lee should be reelected, she will want a high African American population. Her district will get 2 points more African American and it will be even more Democratic.

California’s 10th Congressional District John Garamendi (D)

Obama 170,310 62%, McCain 99,929 36%

Change: McCain +6

Demographics: 12% African American, 11% Asian, 20% Hispanic, 52% White

Old Demographics: 6% African American, 9% Asian, 15% Hispanic, 65% White

Communities of Interest: Vallejo, Fairfield, Pittsburg

Status: Safe Democratic

Garamendi’s district picks up Vallejo in Solano County. It loses Livermore which voted for Bush in 2004, and the 10th district loses the Walnut Creek area. To compensate for the loss of those areas, the 10th district picks up all of Solano County including heavily Democratic Vallejo. The 10th district picks up heavily Democratic Pittsburg too in Contra Costa County. The 10th district also picks up more Central Valley territory because the population growth in the Bay Area is slower than the rest of the state and I needed to push the districts further east to make sure the districts had equal populations. Picking up Lodi to protect McNerney in the 11th district who won by only one point in 2010 does make the 10th district a couple points more Republican. A 62% Obama percentage is high enough to keep Garamendi safe though. Also, Obama did well in the Walnut Creek area formerly in the 10th district but many of the voters there can swing to Republicans. The Democrats in Vallejo and Pittsburg which I moved into the 10th district usually stick with the Democratic ticket though.

California’s 11th District Jerry McNerney (D)

Obama 117,796 56% McCain 90,747 43%

Change: Obama +3

Demographics: 7% African American, 12% Asian, 30% Hispanic, 47% White

Old Demographics: 3% African American, 9% Asian, 20% Hispanic, 64% White

Communities of Interest: Tracy, Stockton, Modesto

Status: Lean Democratic

At a first glance, it appears that McNerney’s district becomes more Republican because it loses all of its territory in Democratic Contra Costa, Alameda and Santa Clara Counties. McNerney’s district becomes three points more Democratic though with the addition of Democratic parts of Stockton, the removal of Lodi and the addition of Democratic parts of Modesto. I did not want to county split here but for population purposes, I had to do so. McNerney should still face challenges but if he could survive in a more Republican district in a very Republican year, he should win in this new district.

California’s 12th District Jackie Speier (D)

Obama 216,757 74%, McCain 70,939 24%

Change: McCain +0

Demographics: 28% Asian, 19% Hispanic, 46% White

Old Demographics: 29% Asian, 16% Hispanic, 48% White

Communities of Interest: South San Francisco, Redwood City, Half Moon Bay

Status: Safe Democratic

Speier’s district shifts a bit south. She loses a few neighborhoods in SF but picks up some Hispanic neighborhoods in Redwood City. She also picks up Half Moon Bay and all of rural San Mateo County. These changes do not significantly alter her Democratic district.

California’s 13th District Pete Stark (D)

Obama 196,889 73%, McCain 68,594 25%

Change: McCain +2

Demographics: 9% African American, 22% Asian, 22% Hispanic, 42% White

Old Demographics: 6% African American, 28% Asian, 21% Hispanic, 38% White

Communities of Interest: San Leandro, Fremont, Pleasanton

Status: Safe Democratic

Stark’s district gets a few points more Republican with the addition of Dublin and Pleasanton. I did not want to connect Stark’s district with those areas but I had to add them for population purposes. Anyway, the district still stays heavily Democratic and safe for Stark.

Photobucket

San Jose

California’s 14th District Anna Eshoo (D)

Obama 224,972 70% McCain 89,228 28%

Change: McCain +6

Demographics: 15% Asian, 14% Hispanic, 63% White

Old Demographics: 16% Asian, 17% Hispanic, 59% White

Communities of Interest: Mountain View, Saratoga, San Jose

Status: Safe Democratic

Eshoo’s district becomes a few points more Republican by losing northern Santa Cruz County and picking up western San Jose. Yes, I understand that Tom Campbell (R) held a district in the 1990’s similar to this one. The 14th district has trended Democratic rapidly though in the last ten years and Obama won 70% of the vote here. Eshoo should have absolutely no worries, even if Campbell decided to run.

California’s 15th District Mike Honda (D)

Obama 172,003 70% McCain 69,337 28%

Change: Obama +4

Demographics: 39% Asian, 15% Hispanic, 40% White

Old Demographics: 29% Asian, 17% Hispanic, 47% White

Communities of Interest: Fremont, Cupertino, San Jose

Status: Safe Democratic

This district becomes more Asian by losing white neighborhoods in San Jose while picking up Asian neighborhoods in Fremont and Sunnyvale. It also picks up a few Asian neighborhoods south of Milpitas. These changes bring the Asian population to 39%. The commission has 5 Asians so I expect they will create some districts that will elect Asians such as this one. Honda is Asian but the Asian population in this district ensures that his successor will be too. Although the district is plurality white, these are 2000 population numbers and the district should have a 43%-44% Asian population now, making it plurality Asian.

California’s 16th Congressional District Zoe Lofgren (D)

Obama 152,658 70%, McCain 62,467 29%

Change: McCain +0

Demographics: 23% Asian, 40% Hispanic, 30% White

Old Demographics: 23% Asian, 38% Hispanic, 31% White

Communities of Interest: San Jose, Gilroy, Morgan Hill

Status: Safe Democratic

Lofgren’s district does not become less Democratic or Republican but an issue arises. Her district gets a few points more Hispanic and with her district’s growing Hispanic population, she may face a primary challenge from a Hispanic. Lofgren should win though because she is familiar with most of the 16th district’s voters and the Hispanic population is still not high enough to unseat her. If she retires in a few years, Hispanics will have a big chance to elect a representative here. Anyway, she gets new territory in Hispanic Gilroy and Morgan Hill. Her district keeps communities of interest though by staying within the county boundaries.

Photobucket

Central California

California’s 17th District Sam Farr (D)

Obama 194,877 71%, McCain 75,094 27%

Change: McCain +2

Demographics: 5% Asian, 35% Hispanic, 54% White

Old Demographics: 5% Asian, 43% Hispanic, 46% White

Communities of Interest: Santa Cruz, Monterey, Paso Robles

Status: Safe Democratic

Farr’s district becomes a few points more Republican but remains very safe. It is still a compact district containing all of Monterey and Santa Cruz Counties while taking a small slice of San Luis Obispo County. The district loses all of agricultural San Benito County to the agricultural 18th district. The 17th picks up Republican leaning Paso Robles because it is in the Salinas Valley which is a community of interest in Monterey County. This also keeps Paso Robles out of the 23rd district.

California’s 18th District Dennis Cardoza (D)

Obama 101,440 55%, McCain 80,417 43%

Change: McCain +8

Demographics: 5% Asian, 45% Hispanic, 43% White

Old Demographics: 6% African American, 9% Asian, 42% Hispanic, 39% White

Communities of Interest: Hollister, Modesto, Merced

Status: Likely Democratic

Cardoza’s district becomes more Republican because the commission will want it to have compact lines. Thus, it will lose the finger into heavily Democratic Stockton. To compensate for the loss, the 18th district will go over the Diablo Range to pick up San Benito County which is mostly agricultural like the rest of the district and leans Democratic. The district splits Madera County with the 19th which  breaks county lines but western Madera is very similar to the rest of the district so it is a community of interest. As for Cardoza himself, his district is more Republican because he loses his stronghold of Stockton. The district is growing Democratic though, he won strongly in 2010, a very Republican year and the current Hispanic population should be close to 50% instead of 45%. He may face a tough challenge in a Republican year but he seems safe enough.

California’s 19th District Jeff Denham (R)

Obama 100,428 42%, McCain 136,148 56%

Change: McCain +8

Demographics: 28% Hispanic, 63% White

Old Demographics: 28% Hispanic, 59% White

Communities of Interest: Turlock, Mammoth Lakes, Barstow

Status: Safe Republican

The Sierras and the Mojave Desert used to be diced up between the Los Angeles centered 25th district and the formerly Central Valley centered 19th district so they were not united in one district. They are now part of the new 19th which is probably the most rural district in California now. The 19th loses all of Fresno and the parts of the Central Valley it has are mostly rural and white. Barstow may be far from the northern part of the district but these areas have similar residents. As for Denham, his district was already safe so he should be fine.

Photobucket

           Fresno Area

California’s 20th District Jim Costa (D)

Obama 89,084 59%, McCain 60,278 40%

Change: McCain +2

Demographics: 7% African American, 9% Asian, 55% Hispanic, 26% White

Old Demographics: 7% African American, 6% Asian, 63% Hispanic, 21% White

Communities of Interest: Fresno, Delano

Status: Likely Democratic

Costa faced a tough reelection bid and I would have strengthened his position but I wanted a district that the commission would approve due to compactness. His district gets a couple of points more Republican but he loses part of heavily Republican Kings County which has more in common with Tulare County which is partly in the 21st district. In his close 2010 reelection, he lost Kings County by more than 20 points. Costa gains more of his base in Fresno County. His district has a minority population of 74% as of 2000. It should be larger now. Nonetheless, since he won in 2010, he should be able to win in any year.

California’s 21st District Devin Nunes (R)

Obama 95,433 41%, McCain 132,702 57%

Change: McCain +2

Demographics: 5% Asian, 34% Hispanic, 54% White

Old Demographics: 5% Asian, 43% Hispanic, 46% White

Communities of Interest: Clovis, Visalia, Hanford

Status: Safe Republican

With the addition of half of Kings County, the 21st district becomes more Republican. While it loses some Republican parts of Tulare County, it also loses some Democratic parts of Fresno County. Although the district looks less compact than its original form, it still contains similar communities.

California’s 22nd District Kevin McCarthy (R)

Obama 81,294 40%, McCain 120,919 59%

Change: Obama +2

Demographics: 6% African American, 35% Hispanic, 53% White

Old Demographics: 6% African American, 21% Hispanic, 67% White

Communities of Interest: Shafter, Bakersfield, California City

Status: Safe Republican

The district loses portions of Los Angeles and San Luis Obispo Counties. It is now completely in Kern County and it picks up some Democratic neighborhoods in Bakersfield. This makes the 22nd more Democratic but it is still strongly Republican and more compact.

California’s 23rd District Lois Capps (D)

Obama 183,937 58%, McCain 127,332 40%

Change: McCain +16

Demographics: 27% Hispanic, 64% White

Old Demographics: 5% Asian, 41% Hispanic, 48% White

Communities of Interest: San Luis Obispo, Santa Barbara, Ventura

Status: Likely Democratic

Santa Barbara, a liberal university town with an economy based largely on tourism is not too similar to northern Santa Barbara County which is conservative and has an economy based on the Vanderburg Air Force Base and agriculture. Northern Santa Barbara County has tried to split from Santa Barbara County for those reasons. The 23rd district will unite them though because compactness is important. The 23rd also picks up all of San Luis Obispo County. The district loses heavily Democratic Oxnard which brings the McCain percentage up to 40%. In the 1990s, the district was competitive with similar lines but this area has trended Democratic since then so I expect Capps will retain her seat.

California’s 24th District Elton Gallegly (R)

Obama 158,267 55%, McCain 126,731 44%

Change: Obama +8

Demographics: 6% Asian, 34% Hispanic, 55% White

Old Demographics: 4% Asian, 22% Hispanic, 69% White

Communities of Interest: Oxnard, Moorpark, Simi Valley

Status: Tossup

This district loses the conservative parts of Santa Barbara County and picks up heavily Democratic Oxnard instead. This increases the Obama percentage in the district to 55%. Gallegly is an entrenched incumbent but he is not familiar with the voters in Oxnard. Gallegly could win by winning big margins in Simi Valley and Thousand Oaks. Gallegly keeps hinting he wants to retire so these new lines may convince him to do so. If he leaves, the seats will be hotly contested but I expect the Democrat to win by a few points.

Photobucket

West LA

California’s 25th District Buck McKeon (R)

Obama 139,488 50% McCain 132,660 48%

Change: McCain +0

Demographics: 9% African American, 5% Asian, 27% Hispanic, 55% White

Old Demographics: 8% African American, 4% Asian, 27% Hispanic, 57% White

Communities of Interest: Santa Clarita, Palmdale, Victorville

Status: Likely Republican

This district shrinks as it loses rural areas in the desert and eastern Sierras. It still resembles a tossup because Obama barely won it but this district is strongly Republican. Kerry won only 40% here and McKeon is highly popular. When he retires, a strong Democrat against a weak Republican can win here but although this area is trending Democratic, it is still Republican at a local level.

California’s 26th District Darrell Issa (R) Grey

Obama 143,487 49%, McCain 142,232 49%

Change: Obama +8 (the old 49th District.)

Demographics: 5% Asian, 26% Hispanic, 62% White

Old Demographics: 5% African American, 4% Asian, 30% Hispanic, 57% White

Communities of Interest: San Clemente, Oceanside, Carlsbad

Status: Lean Republican

Although Issa represents the 49th district currently, this district has most of the old 49th district including his home so I expect him to run here. The district has become more Democratic with the removal of conservative inland areas and the addition of some coastal towns such as Carlsbad which lean Democratic. He does pick up conservative San Clemente in Orange County though. Even though Obama won this district, Issa should have an advantage because he contains most of his old territory. A Democratic candidate such as Nick Leibham could run a strong race here though.

Photobucket

LA Area Zoom out

California’s 27th District Adam Schiff (D) (formerly represented the 29th)

Obama 185,229 68%, McCain 79,728 29%

Change: Obama +1

Demographics: 6% African American, 14% Asian, 32% Hispanic, 43% White

Old Demographics: 6% African American, 24% Asian, 26% Hispanic, 39% White

Communities of Interest: Burbank, Glendale, Pasadena

Status: Safe Democratic

Schiff’s district picks up some Hispanics in a few LA neighborhoods and loses a few Asian areas in the eastern part of the district to the 32nd. The district does not undergo major changes overall. Schiff should have no difficulties retaining his seat.

California’s 28th District Vacant

Obama 123,900 72%, McCain 43,547 25%

Change: McCain +8

Demographics: 5% African American, 7% Asian, 64% Hispanic, 21% White

Old Demographics: 4% African American, 6% Asian, 56% Hispanic, 31% White

Communities of Interest: San Fernando, Los Angeles

Status: Safe Democratic

No matter what the Democrats or Republicans propose, the commission will probably create a strong Hispanic majority district in the San Fernando Valley due to its high Hispanic population and the lack of a Hispanic representative. This district formerly belonged to Howard Berman (D) but he will probably run in the new 30th District or retire. Regardless, a 64% Hispanic population should be enough for a Hispanic to win. A possible candidate would be rising star Alex Padilla (D).

California’s 29th District Henry Waxman (D) (formerly represented the 30th)

Obama 271,019 76%, McCain 78,109 22%

Change: Obama +12

Demographics: 10% Asian, 13% Hispanic, 69% White

Old Demographics: 9% Asian, 8% Hispanic, 76% White

Communities of Interest: Malibu, Beverly Hills, Los Angeles

Status: Safe Democratic

This district was formerly the 30th District. It looks different though because it loses neighborhoods in the San Fernando Valley and towns such as Agoura Hills and Calabasas. The district picks up some of Venice Beach to compensate for the population loss. This helps make the district more Democratic even though this district full of Hollywood liberals was safe for Waxman already.

California’s 30th District Howard Berman (D) vs. Brad Sherman (D) (formerly the 27th)

Obama 193,870 65%, McCain 99,181 33%

Change: McCain +2

Demographics: 10% Asian, 21% Hispanic, 61% White

Old Demographics: 5% African American, 11% Asian, 37% Hispanic, 44% White

Communities of Interest: Agoura Hills, Chatsworth, Northridge

Status: Safe Democratic

This district changes as it picks up the Agoura Hills and Northridge areas. Although this district is too Democratic for a Republican, there might be a big primary fight here. I am not sure if the Democratic party will like combining the two incumbents but the commission will do it in order to create a Hispanic majority district in the San Fernando Valley. This district combines most of the white parts of the San Fernando Valley. Although this district contains more of Sherman’s territory, Berman is more entrenched and he has the backing of Waxman. His backing may translate into votes in the parts of Waxman’s old district such as Agoura Hills and Calabasas if Waxman campaigns strongly for Berman. Anyway, this will be an interesting race or Sherman may decide not to run here but run in the nearby 24th instead if Gallegly retires.

California’s 31st District Xavier Beccara (D)

Obama 111,611 81%, McCain 22,567 16%

Change: Obama +2

Demographics: 7% African American, 17% Asian, 64% Hispanic, 9% White

Old Demographics: 4% African American, 14% Asian, 70% Hispanic, 10% White

Communities of Interest: Downtown Los Angeles, Clement Junction, Silver Lake

Status: Safe Democratic

Beccara’s district becomes more compact as it picks up areas such as Boyle Heights from the 34th District. It loses a few Hispanics but still remains heavily Hispanic and Democratic.

Photobucket

Los Angeles Zoom in

California’s 32nd District Judy Chu (D)

Obama 134,143 59% McCain 86,631 38%

Change: McCain +17

Demographics: 31% Asian, 38% Hispanic, 25% White

Old Demographics: 18% Asian, 62% Hispanic, 15% White

Communities of Interest: Monterey Park, El Monte, Glendora

Status: Safe Democratic

The commission will probably create a district where an Asian candidate can win in this part of LA County. The district could be extended into Asian neighborhoods in Diamond Bar but I doubt they will do that because it will create convoluted lines if they want to connect Asian areas in Monterey Park and Diamond Bar. The 32nd district loses Hispanic Baldwin Park but picks up Asian areas near Arcadia. Although Asians are not the plurality in the district, they have higher voter turnout rates than Hispanics so Chu should survive a primary challenge from a Hispanic candidate. Chu’s current district is 62% Hispanic and 18% Asian so the possibility of a strong Hispanic candidate challenging her in the primary looms. The district becomes more Republican because the new Asian areas such as San Marino and Arcadia are not heavily Democratic. Obama’s 21 point win here should be high enough to protect Chu and she should perform higher than Obama among Asians too.

California’s 33rd District Karen Bass (D) Purple

Obama 208,574 90% McCain 20,884 9%

Change: Obama +6

Demographics: 39% African American, 6% Asian, 44% Hispanic, 9% White

Old Demographics: 30% African American, 12% Asian, 35% Hispanic, 20% White

Communities of Interest: Los Angeles, Culver City, Inglewood

Status: Safe Democratic

With the inclusion of Inglewood, this becomes the most Democratic district in California. The district becomes more Democatic. On this new map, it is the most Democratic district in California. Also, I had to eliminate one African American district in LA because it will be difficult for all three African Americans to hold their districts as the Hispanic population grows. Bass’s district’s African American population rises from 30% to 39%. While Hispanics are still a plurality here, African Americans make up the majority of Democratic primary voters so Bass should be safe.

California’s 34th District Lucille Roybal Allard (D) Green

Obama 129,907 73%, McCain 44,871 25%

Change: McCain +4

Demographics: 5% Asian, 78% Hispanic, 12% White

Old Demographics: 6% Asian, 77% Hispanic, 11% White

Communities of Interest: East Los Angeles, Downey, Norwalk

Status: Safe Democratic

Yes, I understand this district may be too narrow and too long so the commission may not think it is compact. A district like this is necessary though because if it were more compact around the East Los Angeles area, the Hispanic population would be considered too high and it would be considered packing under the VRA. Many of the Hispanic areas there are around 90% Hispanic. Other Hispanic majority districts would not have enough Hispanics to elect a Hispanic representative if they cannot pick up heavily Hispanic neighborhoods such as East Los Angeles, Pico Rivera and Lynwood. Anyway, Allard’s district is still 78% Hispanic even while picking up less Hispanic Whittier and Norwalk which makes the district a few points more Republican but still safe for Allard.

California’s 35th District Maxine Waters (D)

Obama 174,206 84%, McCain 29,312 14%

Change: McCain +0

Demographics: 35% African American, 10% Asian, 46% Hispanic, 7% White

Old Demographics: 34% African American, 6% Asian, 47% Hispanic, 10% White

Communities of Interest: Gardena, Compton, Carson

Status: Safe Democratic

The 35th District is now a combination of the current 35th and 37th districts but much of the 37th District is in the new 46th District so Waters has a bit more territory here. Although her district loses her base of Inglewood and picks up Compton and Carson from the 37th District, Waters should win.

California’s 36th District Vacant

Obama 183,287 60%, McCain 115,882 38%

Change: McCain +8

Demographics: 14% Asian, 29% Hispanic, 49% White

Old Demographics: 13% Asian, 30% Hispanic, 48% White

Communities of Interest: Manhattan Beach, Torrance, Rancho Palos Verdes

Status: Safe Democratic

The district becomes more Republican as it loses most of Venice Beach and picks up Republican leaning Rancho Palos Verdes. This district had similar territory in the 1990s and was very competitive. The territory has trended Democratic very quickly with Kerry performing better than Gore here while Gore performed better than Kerry statewide. Obama’s 60% of the vote here is very close to his statewide average of 61%. The current congresswoman Jane Harman (D) will resign soon. The Democrats though have strong candidates running to including former city councilwoman Janice Hahn (D) and popular Secretary of State Debra Bowen (D). They should keep this district in the Democratic column.

California’s 37th District David Dreier (R) (formerly the 26th District)

Obama 128,094 56%, McCain 95,077 42%

Change: Obama +10

Demographics: 7% African American, 9% Asian, 44% Hispanic, 37% White

Old Demographics: 4% African American, 15% Asian, 24% Hispanic, 52% White

Communities of Interest: Covina, Pomona, Chino Hills

Status: Likely Democratic

The 37th straddles the border between Los Angeles and San Bernardino Counties. As for the party strength in this district, Obama may have won with 56% of the vote here but if the Republican candidate is extremely popular and can make inroads with Hispanics, he or she could win. David Dreier (R)’s district was eliminated on this map. He could run here because it contains part of his old district with Upland but he is not familiar with the mostly Democratic Covina or Pomona voters so a Democrat could win here with large margins from those two cities. As for Hispanic representation, the district is probably close to 50% Hispanic now. They would not make up the majority of the votes but there may be enough Hispanics to elect a Hispanic in the Democratic primary because many of the white voters in this district are Republican.

California’s 38th District Grace Napolitano (D)

Obama 142,359 67%, McCain 67,249 31%

Change: McCain +8

Demographics: 21% Asian, 60% Hispanic, 14% White

Old Demographics: 10% Asian, 71% Hispanic, 14% White

Communities of Interest: Pico Rivera, Baldwin Park, Diamond Bar

Status: Safe Democratic

This district becomes more Republican by losing Norwalk and picking up Diamond Bar. Napolitano lives in Norwalk but she should run here since it contains most of her old district. Also, the district loses Hispanics but the 60% Hispanic population should protect Napolitano.

California’s 39th District Linda Sanchez (D)

Obama 126,006 72%, McCain 46,251 26%

Change: Obama +12

Demographics: 9% African American, 9% Asian, 67% Hispanic, 14% White

Old Demographics: 6% African American, 10% Asian, 61% Hispanic, 21% White

Communities of Interest: Huntington Park., Lynwood, Lakewood

Status: Safe Democratic

The district becomes more Democratic and Hispanic with the loss of swing areas such as La Mirada and the addition of heavily Hispanic Huntington Park. Sanchez should have no problems here.

Photobucket

Orange/Riverside Counties

California’s 40th District Ed Royce (R)

Obama 125,615 48%, McCain 131,448 50%

Change: Obama +2

Demographics: 14% Asian, 32% Hispanic, 48% White

Old Demographics: 16% Asian, 30% Hispanic, 49% White

Communities of Interest: La Mirada, Fullerton, Orange

Status: Likely Republican

Royce’s district keeps most of its old territory but expands a bit. It picks up the swing area La Mirada in Los Angeles County as well as Whittier. It loses marginal Los Alamitos. These changes make the district a bit more Democratic. Royce is popular here though so he should win. If Royce retires at the end of the decade though, a Democrat could make this competitive.

Photobucket

San Bernardino Area

California’s 41st District Jerry Lewis (R)

Obama 114,430 43%, McCain 145,829 55%

Change: McCain +2

Demographics: 5% African American, 23% Hispanic, 65% White

Old Demographics: 5% African American, 23% Hispanic, 64% White

Communities of Interest: Rancho Cucamonga, Redlands, Banning

Status: Safe Republican

The district grew so it will shed some territory. It lost most of rural San Bernardino County including Barstow and Needles. It also loses Republican leaning Hemet and San Jacinto. It does pick up Republican leaning Rancho Cucamonga though. Rancho Cucamonga is not next to the bulk of the district’s population which is east of San Bernardino and Riverside. Rancho Cucamonga can be considered a community of interest though because it has similar demographics and voting habits with the rest of the district. Also, connecting Rancho Cucamonga to the rest of the district does not create convoluted lines.

California’s 42nd District Gary Miller (R)

Obama 147,589 46%, McCain 170,780 53%

Change: Obama +1

Demographics: 15% Asian, 14% Hispanic, 66% White

Old Demographics: 16% Asian, 24% Hispanic, 54% White

Communities of Interest: Yorba Linda, Irvine, Lake Forest

Status: Safe Republican

Gary Miller’s home is now in the heavily Hispanic 38th district but I believe he will run here since this district contains much of his old territory. The district is now completely in Orange County and it picks up Democratic leaning Irvine. These changes do not change the political composition of the district much though. Miller should be safe.

California’s 43rd District Joe Baca (D)

Obama 106,880 64%, McCain 55,738 34%

Change: McCain +8

Demographics: 14% African American, 5% Asian, 50% Hispanic, 28% White

Old Demographics: 12% African American, 3% Asian, 58% Hispanic, 23% White

Communities of Interest: Fontana, Colton, San Bernardino

Status: Safe Democratic

The district becomes more Republican and less Hispanic by losing Democratic Ontario and picking up Republican leaning Highland. The district is 72% minority and the minority percentage should be higher now. The Hispanic population of the old district was 58% in 2000 but grew to 66% in 2010 so the Hispanic population of this district should currently be in the high 50’s. That should be enough to protect Baca.

California’s 44th District Vacant (R)

Obama 95,838 62% McCain 54,979 36%

Change: N/A

Demographics: 11% African American, 5% Asian, 48% Hispanic, 33% White

Old Demographics: N/A

Communities of Interest: Ontario, Riverside, Moreno Valley

Status: Likely Democratic

This is the new minority majority district in the Inland Empire which contains Hispanic neighborhoods in Ontario as well as Riverside and Moreno Valley. The district was not Hispanic majority in 2000 but should be in the low 50s now. Although Hispanics may not make up the majority of the voters, they should make up the majority of the Democratic primary voters because many of the whites in the 44th District vote Republican. Also, this district is too Democratic to elect a Republican so the Democrat who wins here should be safe.

California’s 45th District Ken Calvert (R) (formerly the 44th)

Obama 104,697 49% McCain 103,291 49%

Change: McCain +1

Demographics: 6% African American, 5% Asian, 33% Hispanic, 52% White

Old Demographics: 6% African American, 5% Asian, 35% Hispanic, 51% White

Communities of Interest: Corona, Riverside, San Jacinto

Status: Lean Republican

This district at first looks like a pure tossup when considering the vote totals but it leans Republican because Obama over performed in the Inland Empire. Democrats have a shot here though because Ken Calvert (R) is a weak incumbent and won in 2008 only because of margins in Orange County. His district loses Orange County while picking up Democratic Perris and marginal San Jacinto. Although the district gets a point more Republican, it is quickly trending Democratic. Also, Bill Hedrick (D) in 2008 received almost no support from national Democrats but lost by only 2 points against Calvert. If Hedrick runs in a good Democratic year and receives support from national Democrats, he should win.

California’s 46th District Dana Rohrabacher (R)

Obama 149,749 58% McCain 103,370 40%

Change: Obama +20

Demographics: 8% African American, 16% Asian, 30% Hispanic, 42% White

Old Demographics: 1% African American, 15% Asian, 17% Hispanic, 62% White

Communities of Interest: Long Beach, Seal Beach, Huntington Beach

Status: Lean Democratic

The district becomes more Democratic with the addition of Democratic areas in Long Beach. The removal of Costa Mesa and most of Huntington Beach helps too. Rohrabacher is popular but even he should not win in a 58% Obama district. Also, the new Democratic voters from Long Beach are not familiar with him so he will not be able to win by getting Democrats in Long Beach to ticket split. An issue with this district is that western Long Beach may not be considered a community of interest with the rest of the district. It should work because it is in the same city limits as eastern Long Beach which is currently in the 46th District and should be a community of interest with the Orange County part of the district. Also, the addition of most of Long Beach makes the district compact and it formerly had a thin line going to Rancho Palos Verdes.

California’s 47th District Loretta Sanchez (D)

Obama 85,661 59%, McCain 57,061 39%

Change: McCain +1

Demographics: 15% Asian, 62% Hispanic, 19% White

Old Demographics: 14% Asian, 65% Hispanic, 17% White

Communities of Interest: Anaheim, Santa Ana, Garden Grove

Status: Safe Democratic

Sanchez’s district does not change much because it is already a Hispanic majority district and it contains similar communities. She picks up more of Garden Grove which may not be the best idea because her 2010 challenger Van Tran (R) is popular there. She should be safe because she won by double digits in 2010, an extremely Republican year and if she were strong then, she is strong now.

California’s 48th District John Campbell (R)

Obama 150,612 46%, McCain 167,583 52%

Change: McCain +8

Demographics: 8% Asian, 16% Hispanic, 71% White

Old Demographics: 13% Asian, 15% Hispanic, 68% White

Communities of Interest: Huntington Beach, Newport Beach, Laguna Beach

Status: Safe Republican

Campbell’s district loses Irvine and becomes the coastal district. It picks up Huntington Beach and Costa Mesa. Although the district is narrow, it certainly picks up communities of interest by getting all the beach towns. The district becomes more Republican with the loss of Irvine but Campbell was pretty safe anyway. This district may be open to voting for a libertarian Democrat if they view Campbell as one of the big government Republicans but for now, this district remains Republican.

California’s 49th District Mary Bono (R) (formerly the 45th District)

Obama 116,668 44%, McCain 145,303 55%

Change: McCain +16

Demographics: 23% Hispanic, 68% White

Old Demographics: 6% African American, 38% Hispanic, 50% White

Communities of Interest: Lake Elsinore, Temecula, Palm Springs

Status: Safe Republican

Bono’s old district contained Moreno Valley and voted for Obama by 5 points. Her district is now more Republican with the removal of Moreno Valley and heavily Hispanic Coachella. Her district picks up Republican Murrieta and Temecula though. Although Palm Springs leans Democratic, Murrieta and Temecula more than cancel out the Democratic votes there.

Photobucket

San Diego Area

California’s 50th District Brian Bilbray (R)

Obama 201,068 59%, McCain 133,105 39%

Change: Obama +16

Demographics: 15% Asian, 11% Hispanic, 67% White

Old Demographics: 10% Asian, 19% Hispanic, 66% White

Communities of Interest: Del Mar, San Diego

Status: Lean Democratic

Bilbray has represented San Diego for a number of years and he is used to running in districts that lean Democratic. His old 50th District voted for Obama by a couple of points. He should lose in this district though because he picks up more of San Diego City including some white liberal areas from the 53rd. This increases the Obama percentage to 59% and that should be enough to beat him. This district also fits the guidelines for the commission by remaining compact and taking in similar neighborhoods. It is possible Susan Davis (D) from the 53rd will run here because her district’s white population may be too small for her and the 50th district contains part of her old district. She ran against Bilbray in 2000 and it will be an interesting rematch. She should win though.

California’s 51st District Bob Filner (D)

Obama 119,277 58%, McCain 82,165 40%

Change: McCain +9

Demographics: 6% Asian, 61% Hispanic, 26% White

Old Demographics: 9% African American, 12% Asian, 53% Hispanic, 21% White

Communities of Interest: Coachella, El Centro, Chula Vista

Status: Safe Democratic

Bob Filner is a popular representative but the commission will create a Hispanic majority district with parts of San Diego.  He has handily beaten back primary challenges from Hispanics though in a 53% Hispanic district. He won with support from African Americans and Asians and he loses many of those voters to the 53rd district. He retains most of his old territory so he may survive. Nonetheless, his district becomes more Hispanic by picking up Coachella and Indio. I have also heard of proposals to connect Imperial County to an eastern San Diego County district. Those areas do not have much in common though and Hispanics need a district in the San Diego area. The district becomes more Republican too though by losing National City and some Democratic neighborhoods in San Diego but remains safe for Filner.

California’s 52nd District Duncan Hunter Jr. (R)

Obama 128,894 44%, McCain 160,825 55%

Change: McCain +3

Demographics: 5% Asian, 18% Hispanic, 69% White

Old Demographics: 5% Asian, 14% Hispanic, 73% White

Communities of Interest: Poway, San Diego, El Cajon

Status: Safe Republican

The district was already Republican but it becomes even more Republican. It loses most of San Diego City except the northeastern area and picks up Republican leaning Escondido. Hunter should have no problems here.

California’s 53rd District Susan Davis (D)

Obama 116,327 70%, McCain 46,533 28%

Change: Obama +4

Demographics: 14% African American, 14% Asian, 42% Hispanic, 26% White

Old Demographics: 7% African American, 8% Asian, 29% Hispanic, 51% White

Communities of Interest: National City, San Diego

Status: Safe Democratic

Davis’s district gets less white as it loses more northern parts of San Diego and picks up National City. These changes make the district more Democratic but less safe for Davis. She faces the possibility of a primary challenge from a minority candidate. She should survive because many of the voters in the new 53rd are from her old district and whites probably outnumber Hispanics in the Democratic primary. Also, Davis should get support from African Americans and Asians. Filner may give her a primary challenge here though.

By what margin will Bob Shamansky win?

View Results

Loading ... Loading ...

Redistricting outlook: Mass.-Minn.

Now that it’s 2011, the redistricting games will soon begin in earnest, with more detailed Census data expected in the coming weeks and some states holding spring legislative sessions to deal with drawing new maps. Long ago I planned to do state-by-state rundowns of the redistricting process as soon as 2010 election results and Census reapportionment were clear. Now that time has arrived, and it’s time to look at Massachusetts, Michigan, and Minnesota.

Previous diary on Alabama, Arizona, and Arkansas

Previous diary on California, Colorado, and Connecticut

Previous diary on Florida, Georgia, and Hawaii

Previous diary on Idaho, Illinois, Indiana, and Iowa

Previous diary on Kansas, Kentucky, Louisiana, Maine, and Maryland

The rest below the fold…

Massachusetts

Photobucket

Districts: 9 (down from 10 in 2002)

Who’s in charge? Democrats

Is that important? Not from a partisan perspective, no

For a state with an all-Democratic delegation being remapped by Democratic lawmakers, there’s been a surprising amount of drama in the Bay State over whose district will be cut. It was hoped that an older member would announce his retirement, allowing a clean elimination without any messy incumbent vs. incumbent primaries. But Financial Services Committee ranking member Barney Frank, long speculated to be the next retiree, announced he will run again, and so far no member of the congressional delegation appears ready to challenge Sen. Scott Brown, though Mike Capuano’s name is still in the running. Should he go for it, his Boston seat will simply be split up between Frank and Stephen Lynch. In any case, all nine districts should remain strongly Democratic-leaning.

Michigan

Photobucket

Districts: 14 (down from 15 in 2002)

Who’s in charge? Republicans

Is that important? Yes

As was the case ten years ago, Republicans will draw the lines in Michigan, but unlike then, they really have no room to make gains, only to eliminate one more Democratic incumbent. In most estimations, that incumbent will be two-termer Gary Peters, the only Democrat (other than Hansen Clarke, whose district is VRA-protected) in the state’s delegation elected after 1982. A likely scenario is that his Oakland County swing district will be combined with Sander Levin’s heavily Democratic Macomb County territory in a safe blue seat. Levin’s liberal record and thirty years of seniority should make him a prohibitive favorite over Peters in the Democratic primary, but I suppose at 81 he will be prime congressional retirement age. Other than that, the GOP cannot afford to get too cute with boundaries — they already hold several marginal seats (the 1st, 7th, and 11th come to mind).

Minnesota

Photobucket

Districts: 8

Who’s in charge? Split (Dem Governor, GOP Legislature)

Is that important? Surely

Democrats are counting their lucky stars that Mark Dayton won the gubernatorial race, as the GOP has long aimed to combine Minneapolis and St. Paul into one heavily Democratic seat and now will presumably not have that opportunity. Ten years ago, a three-way deadlock between Independent Gov. Jesse Ventura, a Democratic Senate, and a Republican House forced the courts to step in, but many hope for compromise this time around. Since the state’s high Census participation rate saved it from losing a seat, status quo will probably win the day, with safer seats for Tim Walz, Chip Cravaack, and perhaps Collin Peterson. Ironically, Minnesota just held on to its eighth seat at the expense of fast-growing but lower-participating North Carolina, which was the controversial winner over Utah for the last seat allocated in the 2000 Census.

Maryland, My Maryland !

This is my version of Maryland using Daves Redistricting 2.1.  Looking at the 2010 Census data incorporated into the Application, I see no reason at all why Democrats should not create an 8-0 map.

Actually, I drew a couple versions of a map.  The main part of this diary deals with “Version 1”, an 8-0 map which I believe would have the best chance of being enacted in Maryland.  My alternative “Version 2” is discussed at the end of the diary.

VERSION 1

This map preserves both black majority seats, keeps the districts of all six Democratic incumbents safely Democratic and creates two additional Democratic seats — all without creating a “monstrous” looking map.

Another very important goal for me was to keep as much of each incumbent’s current territory (population-wise) in the new district.  The percentages of current constituents that each district gets to keep are below:

MD-1 – 64.8%

MD-2 – 65.1%

MD-3 – 58.2%

MD-4 – 57.9%

MD-5 – 64.6%

MD-6 – 60.1%

MD-7 – 51.8%

MD-8 – 58.0%

I feel that the set of numbers above is just as important as the partisan numbers for each district.  In many cases, if an incumbent loses too much of his or her existing constituents, they may not like the map even if their district becomes more favorable in terms of party identification.  Thus any map that has a realistic chance of being enacted in Maryland must pay close attention to how a proposed district resembles the existing district.

As you can see from the numbers above, each incumbent save one gets to keep at least 58% of their current constituents.  As for MD-7, Cummings keeps only 52%.  However, that number comes with a caveat — because an additional 13.9% of the proposed MD-7 here comes out of African-American areas in Baltimore City (Cherry Hill, for example) or Baltimore Co. (Randallstown) that are currently part of MD-2 or MD-3.  These added areas are 75% black, so even though Cummings currently doesn’t represent them, there’s no reason these new constituents would not be receptive to being represented by Cummings.

UPDATE: please note that per suggestion from one reader, I have adjusted the map to do a better job at keeping suburban Baltimore communities together; this change had the added benefit of making Cummings keep more of his current MD-7 constituents — now 55.1% (please see comments section for more info.)

The black percentage in the two black majority districts goes down slightly from the current percentages, but the proportion of African-Americans as a percentage of the Democratic primary vote in both districts is very high — by my estimate it’s at least 77% in MD-4 and at least 82% in MD-7 (sic) ! — so these districts should have no trouble in electing an African-American representative.

The districts of all six Democratic incumbents are kept at least 60% Obama and at least 60% Democratic Average 2006-2008.  The two new Democratic districts are made to be 53.7% Obama for MD-1 and 55.6% Obama for MD-6.  Both the new MD-1 and the new MD-6 are at exactly 52.9% Democratic Average 2006-2008.  I feel that is enough of a cushion in both cases.  For MD-1, Kratovil should easily win a 53-54% Democratic district.  Most of the area in the new MD-6 (Frederick area and northern Montgomery Co.) is becoming more and more Democratic every year, as evidenced by the Democrats take-over of State Senate District 3 (Frederick) this past November.  I could have made the new MD-6 a bit more Democratic, but I did not want to endanger Van Hollen or make the lines too convoluted (for example, you could add Carroll Co. to MD-4, like I did in a previous diary and here under “Version 2”, but it just seems like a bridge too far in any map that has a realistic chance of being enacted; in this respect, much of what constitutes drawing a map is quite subjective).  The new MD-6 here should turn blue, unless a very, very moderate Republican is the nominee — which isn’t going to happen these days !  

Partisan numbers for new districts are below:

MD-1 – 53.7 Obama; 52.9 Democratic Avg. 2006-2008

MD-2 – 60.9 Obama; 63.8 Democratic Avg. 2006-2008

MD-3 – 60.2 Obama; 60.7 Democratic Avg. 2006-2008

MD-4 – 82.5 Obama; 79.1 Democratic Avg. 2006-2008

MD-5 – 60.9 Obama; 60.9 Democratic Avg. 2006-2008

MD-6 – 55.6 Obama; 52.9 Democratic Avg. 2006-2008

MD-7 – 73.5 Obama; 69.7 Democratic Avg. 2006-2008

MD-8 – 64.7 Obama; 64.9 Democratic Avg. 2006-2008

Where possible, I tried to respect county and community lines while drawing this map (see the fourth map down where city lines and Census-designated community lines in central Maryland are mapped).  

The population deviation for this map is +/- 132 persons, with the caveat that Maryland has a new law now where the prison population may have to be “reassigned” to district of origin.  For demographics below, I noted ethnic/racial group if 5%+ of the population. Please note that all the data below for current and proposed districts is obtained from Daves Redistricting Application.  I drew in the existing districts into the Application to obtain demographic data as it currently stands for each district.  Please note that for partisan data, it appears that the percentages provided in the Application are percentages as a proportion of the two-party vote.

Photobucket

Photobucket

Photobucket

Photobucket

Photobucket

Photobucket

Photobucket

District 1:

Current District Population: 81.0 white, 11.4 black

Proposed District Population: 66.0 white, 24.7 black, 5.2 hispanic

Current District 18+ Population: 82.8 white, 11.1 black

Proposed District 18+ Population: 68.5 white, 23.8 black

Current District President: 41.5 Obama, 58.5 McCain

Proposed District President: 53.7 Obama, 46.3 McCain

Current District Partisan Avg. 2006-2008: 41.8 Democratic, 58.2 Republican

Proposed District Partisan Avg. 2006-2008: 52.9 Democratic, 47.1 Republican

District 2:  

Current District Population: 55.2 white, 33.1 black, 5.0 hispanic

Proposed District Population: 62.6 white, 24.9 black, 5.4 hispanic

Current District 18+ Population: 59.2 white, 30.8 black

Proposed District 18+ Population: 66.5 white, 22.4 black

Current District President: 60.8 Obama, 39.2 McCain

Proposed District President: 60.9 Obama, 39.1 McCain

Current District Partisan Avg. 2006-2008: 63.4 Democratic, 36.6 Republican

Proposed District Partisan Avg. 2006-2008: 63.8 Democratic, 36.2 Republican

District 3:  

Current District Population: 65.2 white, 20.0 black, 6.8 hispanic, 5.3 asian

Proposed District Population: 60.0 white, 21.9 black, 8.7 asian, 6.1 hispanic

Current District 18+ Population: 68.2 white, 18.7 black, 6.0 hispanic, 5.2 asian

Proposed District 18+ Population: 62.9 white, 21.0 black, 8.6 asian, 5.4 hispanic

Current District President: 60.5 Obama, 39.5 McCain

Proposed District President: 60.2 Obama, 39.8 McCain

Current District Partisan Avg. 2006-2008: 62.3 Democratic, 37.7 Republican

Proposed District Partisan Avg. 2006-2008: 60.7 Democratic, 39.3 Republican

District 4:

Current District Population: 55.7 black, 20.6 white, 14.2 hispanic, 6.9 asian

Proposed District Population: 53.2 black, 24.7 white, 13.0 hispanic, 6.5 asian

Current District 18+ Population: 55.5 black, 22.3 white, 12.9 hispanic, 7.2 asian

Proposed District 18+ Population: 53.0 black, 26.2 white, 11.9 hispanic, 6.7 asian

Current District President: 86.1 Obama, 13.9 McCain

Proposed District President: 82.5 Obama, 17.5 McCain

Current District Partisan Avg. 2006-2008: 82.6 Democratic, 17.4 Republican

Proposed District Partisan Avg. 2006-2008: 79.1 Democratic, 20.9 Republican

District 5:

Current District Population: 48.0 white, 36.7 black, 7.9 hispanic

Proposed District Population: 56.4 white, 27.9 black, 9.5 hispanic

Current District 18+ Population: 50.8 white, 35.6 black, 6.9 hispanic

Proposed District 18+ Population: 58.7 white, 27.2 black, 8.4 hispanic

Current District President: 67.0 Obama, 33.0 McCain

Proposed District President: 60.9 Obama, 39.1 McCain

Current District Partisan Avg. 2006-2008: 65.8 Democratic, 34.2 Republican

Proposed District Partisan Avg. 2006-2008: 60.9 Democratic, 39.1 Republican

District 6:

Current District Population: 85.0 white, 6.4 black

Proposed District Population: 66.4 white, 11.0 hispanic, 10.6 black, 9.2 asian

Current District 18+ Population: 86.8 white, 6.4 black

Proposed District 18+ Population: 69.0 white, 10.0 black, 9.9 hispanic, 9.3 asian

Current District President: 41.3 Obama, 58.7 McCain

Proposed District President: 55.6 Obama, 44.4 McCain

Current District Partisan Avg. 2006-2008: 40.0 Democratic, 60.0 Republican

Proposed District Partisan Avg. 2006-2008: 52.9 Democratic, 47.1 Republican

District 7:  

Current District Population: 55.7 black, 31.6 white, 6.7 asian

Proposed District Population: 55.0 black, 38.2 white

Current District 18+ Population: 54.6 black, 33.6 white, 6.7 asian

Proposed District 18+ Population: 54.1 black, 39.9 white

Current District President: 81.8 Obama, 18.2 McCain

Proposed District President: 73.5 Obama, 26.5 McCain

Current District Partisan Avg. 2006-2008: 76.6 Democratic, 23.4 Republican

Proposed District Partisan Avg. 2006-2008: 69.7 Democratic, 30.3 Republican

District 8:  

Current District Population: 47.5 white, 20.0 hispanic, 16.3 black, 13.3 asian

Proposed District Population: 63.3 white, 13.6 black, 12.6 hispanic, 7.9 asian

Current District 18+ Population: 49.6 white, 18.6 hispanic, 16.1 black, 13.5 asian

Proposed District 18+ Population: 65.0 white, 13.6 black, 11.5 hispanic, 8.1 asian

Current District President: 76.0 Obama, 24.0 McCain

Proposed District President: 64.7 Obama, 35.3 McCain

Current District Partisan Avg. 2006-2008: 75.1 Democratic, 24.9 Republican

Proposed District Partisan Avg. 2006-2008: 64.9 Democratic, 35.1 Republican

VERSION 2

The map below is my alternative version.  There’s only one difference from Version 1:  Carroll Co. is added to MD-4 while almost everything that’s in Montgomery Co. and part of MD-4 under Version 1 is now added to MD-6.  This exchange between MD-4 and MD-6 produces the following demographic and partisan numbers:

District 4:

Proposed District Population: 50.5 black, 33.1 white, 10.5 hispanic

Proposed District 18+ Population: 50.3 black, 34.5 white, 9.7 hispanic

Proposed District President: 75.7 Obama, 24.3 McCain

Proposed District Partisan Avg. 2006-2008: 72.6 Democratic, 27.4 Republican

District 6:

Proposed District Population: 58.0 white, 13.4 hispanic, 13.3 black, 12.1 asian

Proposed District 18+ Population: 60.9 white, 12.5 black, 12.3 asian, 12.2 hispanic

Proposed District President: 62.3 Obama, 37.7 McCain

Proposed District Partisan Avg. 2006-2008: 59.3 Democratic, 40.7 Republican

Photobucket

The “Version 2” map turns MD-6 into something that’s safely Democratic (instead of just a lean/likely Democratic seat under Version 1), but reduces the black percentage in MD-4 — though it remains above 50%.  The reduction in the African-American population in MD-4 may be retrogressive — however, it should be noted that the white population remains a relatively low percentage, and amazingly, according to my estimate, the proportion of African-Americans as a percentage of the Democratic primary vote in MD-4 now goes UP to 84%.  Another problem would be that Edwards would only get to keep 39% of her existing constituents under these revised lines.

Last, but not least, I must add that I absolutely love version 2.1 of Daves Redistricting Application !

By what margin will Bob Shamansky win?

View Results

Loading ... Loading ...

Redistricting Indiana (two maps)

I tried my hand at redistricting Indiana, since it’s census data was out. I have two maps I created, one is a fair map (at least what the Republican legislature would call fair) and the other is a gerrymander. It’s been said the Gov. Daniels doesn’t want to go too crazy with the map, so we can’t be too sure exactly how aggressive the GOP will get.

Photobucket

IN-2 is modified enough where a Republican can win it and it didn’t take much to achieve that. Joe Donnelly would have probably lost this district in 2010. IN-5 changes a bit and gets more compact, but it’s still solid Republican. IN-9 should be safer GOP by taking on Lawrence and Morgan Counties, while all other districts stay close to the same. Now, onto the gerrymander.

Photobucket

I mistakenly reversed the colors for the 4th and 5th districts, so I thought I’d point that out first. What I have done here is throw Visclosky and Carson together into a vote sink that sucks up the most strongly Democratic voting areas. To make this possible, I had to give Hammond to Rokita, but it wouldn’t pose much of a problem for him, as there is plenty of strong Republican territory still attached. Burton picks up portions of LaPorte and Porter Counties, but still remains safe. IN-7 should have a Republican PVI now, as it takes in out portions of the county and some surrounding counties. IN-6 had minimal changes, while IN-8 and IN-9 are slightly better for Republicans.

I have doubts the GOP will become so aggressive as far as IN-1 goes, but I would not be surprised if something like this were at least attempted by the legislature. I like coming up with egregious gerrymanders, so it was drawn mostly for fun, but it should be kept in mind.

California with 37 VRA seats

Here we go again! Another California map…

I dunno how much demand is actually left for California redistricting maps, but here’s my latest version anyhow. Since this’ll be the last map I post (of California or any other state) until actual Census data is available, I’ve decided to go all out.

When I posted my original California map that basically disregarded the VRA, and again when I posted my VRA maps of Southern states, I was strongly encouraged to create a new California map that takes the VRA as its starting point. While initially somewhat resistant, I was persuaded that I should do exactly that mainly when I looked over the new California redistricting guidelines and saw that they prioritize the VRA above all other criteria.

Moreover, whereas my initial map used the 2008 population estimates, I wanted to make a map using the more accurate American Community Survey projections. So, I’ve created the following maps and analysis by this methodology:

1) I first addressed Section 5 preclearance concerns to ensure that none of the four covered counties (Kings, Merced, Monterrey, Yuba) would be subject to a “retrogression” challenge.

2) I then addressed Section 2 requirements that majority-minority districts be drawn wherever compact minority communities permit the drawing of such districts without substantially ignoring traditional redistricting criteria.

3) I then filled in the rest of the map based on the non-partisan criteria specified by the California guidelines (contiguity, geographic integrity, communities of interest, compactness). As such, I altogether disregarded partisan data and incumbent residency as required by law (especially easy to do on the ACS version at Dave’s app which doesn’t feature partisan data).

4) However, I wanted to know what the partisan effects would be, so I then had to translate my ACS-VRA map into partisan figures – which was easily the most time-consuming part of this exercise.

5) Finally, I was curious to see how the maps I drew would match up with the current incumbents, so I pinpointed where each one lives and identified in which district on my map they would end up.

The resulting maps below feature 37 majority-minority seats of which 15 are majority-Latino and 1 is majority-Asian.

So, I’m finally ready to present all that after the jump. Needless to mention, analyzing California is a daunting task, so I’ve decided to organize my presentation as follows:

For the purposes of my discussion, I’ve divided the state into the following regions: (1) Northern California (including Sacramento); (2) the Bay Area; (3) the Central Valley & Central Coast; (4) Los Angeles; (5) Orange County & the Inland Empire; (6) the San Diego Area.

For each region, I’ve posted some general comments, then listed the 2008 Obama/McCain figures for each district including the incumbent of that currently numbered district, and then posted the relevant maps. I then have three sections of commentary: VRA Implications, Partisan Impact, and Incumbents.

A quick note on the latter: It goes without saying that where the incumbents end up in the new maps is highly speculative. The reason why I decided to look at this anyhow is twofold: (1) at the very least, it gives some sense of how the new maps are likely to scramble the incumbents, even if the actual final arrangement is very different; (2) the places where incumbents are likely to end up together in the same district or where districts are likely to initially end up without a resident incumbent obviously correlate with the most highly gerrymandered parts of the state, and so therefore it’s safe to say that the incumbents that are most affected on my map will be the ones at highest risk under the actual maps. Of course, residency within a district is not a requirement to run for Congress, but Congress critters do generally prefer to run where they live – or to move if they have to.

One last note before I get underway: I’ve played with the California maps enough at this point that I have a rather good sense of what decisions are likely to help Democrats or Republicans. All else being equal, I have generally made those decisions which are most helpful to the GOP. On one hand, I’ve done this to minimize unfounded accusations of partisan mapping bias on my part. On the other hand, I’ve done this because I think similar decisions will maximize the likelihood of a map being approved by the Redistricting Commission which requires three GOP votes to pass the maps. On the third hand (?!), I’ve done this because I would rather see a ‘worst-case scenario’ for Democrats, with the awareness that the actual maps are likely to be somewhat more favorable, than to promote a rose-colored glasses view inconsistent with the probable outcome. In short, if you are a Republican and you don’t like my maps, you probably need to reflect on how consistent your perception of California is with reality.

So, without further ado, here goes!

Northern California & Sacramento

Below I’ve started with two maps. The first is a broader view of NorCal while the second is a closer view of Sacramento so that it’s clear where I’ve drawn the lines and how the Sacramento districts intersect with the surrounding districts.

In my view, the NorCal mapping scheme is very likely to resemble this arrangement. (I guess that’s stating the obvious..) On one hand, there’s a certain symmetry: two districts anchored by Sacramento, two compact districts extending toward the northwest and the northeast respectively, and one district covering the sparsely populated northern end of the state.

I’ve seen several maps that further subdivide Sacramento County or that create more elongated districts stretching as far as the Oregon border. I personally don’t think the such maps are consistent with the current rules that call for minimizing county/city subdivisions and that generally prohibit bypassing centers of population to reach more distant populations.

In any case, here are the partisan figures for these five districts. I’ll post further comments after the maps.

CA-01 (D-Thompson): 61% Obama – 37% McCain

CA-02 (R-Herger): 47% Obama – 51% McCain

CA-03 (R-Lungren): 50% Obama – 48% McCain

CA-04 (R-McClintock): 44% Obama – 54% McCain

CA-05 (D-Matsui): 68% Obama – 30% McCain (61% Minority – 18% Asian; 25% Latino)


VRA Implications: There’s not much in the way of VRA implications with concern to mapping Northern California. Yuba County is a Section 5 preclearance county but it’s currently in a 76% white district. On my map, it goes from its present location in CA-02 represented by Herger to the CA-04 district represented by McClintock. The new CA-04 district has virtually identical racial/partisan stats as the current CA-02, so there’s no “retrogression” concern. The only other district of VRA interest is CA-05 and my map takes it from 56% minority to 61% minority. There’s no prospect of creating any other majority-minority districts, nor is there a prospect of creating a district with a majority from a single minority group.

Partisan Impact: Herger’s CA-02 district goes from 55% McCain to 51% McCain and Lungren’s CA-03 goes from an even 49%-49% split to 50% Obama/48% McCain. In the case of CA-02, the district should be safe enough for Herger, but he’d probably have to actually put a bit of effort into his reelection campaigns and there might be an opening for the right Democrat in a good year for Dems, particularly if the seat comes open.

Lungren’s CA-03 might be far more problematic from his standpoint. On paper, it’s a ‘tossup’ at worse, but Lungren’s been facing stiff challenges in recent elections, and he doesn’t strike me as a particularly good fit for this district that’s now fully contained in Sacramento County. While the district should be quite suitable for a Sacramento Republican, I’m not too sure that Lungren is that Republican, and the area is gradually trending leftward (which will be a problem for the GOP no matter how the ‘second’ Sacramento district gets drawn).

The other three districts are not meaningfully affected, though Thompson’s CA-01 does drop from 66% Obama to 61% Obama.

Incumbents: My map doesn’t displace any of the current incumbents in these five districts and it’s unlikely that any mapping scheme would. That includes Tom McClintock: A lot of sources still list his residence as Elk Grove in Sacramento County, but he’s officially moved to Roseville in Placer County.

The Bay Area

My latest map of the Bay Area is below.

The most consequential effect of using the ACS figures has been that CA-11 is clearly pushed out of the Bay Area and into the Central Valley (which is where I’ll deal with it below). Otherwise, my main concerns here were maximizing the number of majority-minority seats and carving out a majority-Asian seat in particular.

In my experimentation with mapping the Bay Area, it seems fairly clear to me that there are only two districts with significant ambiguity as to how the lines will end up: On my map below, they’re CA-10 and CA-16. What does seem clear enough, however, is that most of the districts will be arranged along the Bay coast, with a ‘hinterland’ district centered in Contra Costa/Alameda, and then leaving what I think of as a ‘mop-up’ district piecing together the ‘leftovers’ from the districts with more obvious placement (e.g., CA-10 on this map).

It’s also worth noting that the contours of this mapping scheme were partially determined by what has to happen in the Central Valley to maintain a VRA-compliant CA-18 district. To do that, you have to split off the heavily Latino parts of Stanislaus and San Joaquin counties, which means you have to situate a district on the remainder which still leaves a part left over on one end or the other. The most coherent mapping scheme I could identify involved attaching that leftover part to CA-10 rather than, say, CA-19. Either way, it doesn’t make much difference: CA-10 will still be heavily Dem and CA-19 will still be heavily GOP.

CA-06 (D-Woolsey): 76% Obama – 22% McCain

CA-07 (D-Miller): 73% Obama – 25% McCain (52% Minority – 15% Asian; 24% Latino)

CA-08 (D-Pelosi): 85% Obama – 13% McCain (52% Minority – 29% Asian)

CA-09 (D-Lee): 88% Obama – 10% McCain (64% Minority – 20% AA; 20% Asian; 21% Latino)

CA-10 (D-Garamendi): 61% Obama – 38% McCain (55% Minority – 24% Latino)

CA-12 (D-Speier): 74% Obama – 25% McCain(57% Minority – 32% Asian; 19% Latino)

CA-13 (D-Stark): 70% Obama – 28% McCain (74% Minority – 51% Asian)

CA-14 (D-Eshoo): 71% Obama – 27% McCain

CA-15 (D-Honda): 71% Obama – 27% McCain (71% Minority – 26% Asian; 39% Latino)

CA-16 (D-Lofgren): 65% Obama – 34% McCain (52% Minority – 17% Asian; 25% Latino)

VRA Implications: My map takes the Bay Area from seven majority-minority districts out of 11 to eight majority-minority districts out of 10. The CA-13 district is also majority-Asian. In some cases, I’ve swapped proportions (i.e., CA-08 goes from 58% to 52% minority while CA-12 goes from 52% to 57% minority; CA-16 goes from 69% to 52% minority while CA-15 goes from 53% to 71% minority). This is augmented by the fact that CA-11 goes from the current 63% white district to a 52% minority district in the Central Valley and CA-17 on the Central Coast becomes a majority-minority district.

For the record, you evidently cannot create a majority-Latino district in San Jose even if you ‘give up’ the majority-Asian district. The Latino population is too intermixed with the Asian population in much of the area.

Partisan Impact: The Bay Area seats will all be heavily Democratic seats no matter how they’re mapped out.

It’s been suggested elsewhere that ‘a foothills seat in Contra Costa / Alameda’ could be a tossup seat. This is obviously not true – mainly because you don’t have anywhere near enough people there as should be self-evident in these maps. The most Republican seat that I was able to create following that guideline was a 59% Obama seat. Once you take in all the most Republican areas in the eastern part of the Bay counties, you must necessarily go into heavily Democratic areas in order to fill out the necessary population.

There’s also been a suggestion that: “The outer areas of current CD14-CD15-CD16 could end up being a tossup seat.” That makes no sense whatsoever. The “outer areas” of those districts are basically Santa Cruz County, which was a 77% Obama county. To make the long story short, anyone who sees a “tossup” district in the Bay Area (much less a Republican district) is hallucinating.

Incumbents: My mapping scheme would inconvenience several Bay Area incumbents, with at least one of them being out of a job (unless he or she moves to the Central Valley). McNerney lives in Pleasanton (central Alameda County) which ends up in CA-16 on this map. Since this district is most similar to his current district, I think he’d be very likely to run there. Mike Honda lives in the Campbell area of San Jose, which ends up in CA-14 on this map. This is essentially Anna Eshoo’s district who lives in Atherton which is still in CA-14. Meanwhile, Zoe Lofgren lives in San Jose and would end up in CA-15.

As I see it, the most obvious place for Mike Honda to run would actually be CA-13 since it becomes majority-Asian and takes in substantial parts of his current district, but if Pete Stark doesn’t retire that’d mean a primary battle – aside from the residency issue. Ultimately, I don’t know how this would be sorted out. Perhaps some Californians could comment on it.

Whatever the case, tidying up the lines in the San Jose area makes it highly probable that at least two Democrats will end up in the same district – even leaving aside the fact that the Bay Area will lose a seat.

It’s also worth noting that Garamendi lives in Walnut Grove (Sacramento County) which just barely ends up in this CA-10 district. That said, I think Garamendi will end up running in whatever district most resembles his current district regardless, whether or not he has to move.

Central Coast & Central Valley

The Central Coast and the Central Valley are really two separate regions, but I’ve decided to cover them together for the sake of expedience. By and large, the mapping scheme that I settled on was dictated by Section 5 preclearance concerns, since three of these counties are covered: Kings, Merced, and Monterey. In short, I mapped the relevant districts first (CA-20, CA-18, and CA-17) to satisfy ‘retrogression’ concerns, and then mapped the rest accordingly.

A couple of general points are worth noting. San Benito County only has about 55,000 people and doesn’t really make a significant difference regardless how it’s mapped. I basically chose to add just enough of it to CA-17 so that the boundaries with CA-12 to the north and CA-23 to the south could be the coastal county lines. The remainder then obviously belonged with CA-20 (but again, it makes no meaningful difference to either the partisan or ethnic breakdown).

As for the Great Basin, it’s even more sparsely populated and even less consequential than San Benito. I’m sure there’s some Republican out there who imagines that if the Great Basin were instead divided and appended to the more central districts it’d somehow benefit the GOP. Any such Republicans are misguided. About 30,000 people live in the Great Basin and chopping it up does little besides create a less coherent map. But, hey, if it makes the Commission feel better for some reason, I say go for it.

Besides reiterating that CA-11 isn’t really ‘McNerney’s district’ on this map – having been displaced from the Bay Area to the Central Valley due to population shifts – I’ll save the rest of my commentary for below.

Here’s the Obama/McCain breakdown for these districts:

Central Coast

CA-17 (D-Farr): 73% Obama – 25% McCain (54% Minority – 44% Latino)

CA-23 (D-Capps): 57% Obama – 41% McCain

CA-24 (R-Gallegly): 56% Obama – 43% McCain (52% Minority – 41% Latino)

Central Valley

CA-11 (D-McNerney): 51% Obama – 47% McCain (52% Minority – 33% Latino)

CA-18 (D-Cardoza): 57% Obama – 41% McCain (69% Minority – 54% Latino)

CA-19 (R-Denham): 41% Obama – 56% McCain

CA-20 (D-Costa): 50% Obama – 48% McCain (75% Minority – 66% Latino)

CA-21 (R-Nunes): 51% Obama – 47% McCain (62% Minority – 42% Latino)

CA-22 (R-McCarthy): 39% Obama – 59% McCain (54% Minority – 42% Latino)


VRA Implications: The VRA implications are quite significant in that three of the four California counties that require Section 5 preclearance are in this central region. Here’s how I’ve handled each in turn:

Merced County goes from a 42% Latino plurality in the current CA-18 district to a 54% Latino majority on my map. Clearly this more than satisfies Section 5 requirements.

Monterey County goes from the current 50% white/39% Latino CA-17 district to a 46% white/44% Latino district on my map. This is about as Latino as this district will get absent extreme gerrymandering, and it certainly cannot be challenged on ‘retrogression’ grounds.

I’m far more ambivalent about the CA-20 district that I’ve drawn which includes Kings County. On the one hand, it goes from 63% Latino to 66% Latino according to the ACS figures. On the other hand, it drops from a 60% Obama district to a 50% Obama district. This is mainly because it trades heavily Democratic parts of Fresno and Bakersfield with settled Latino communities for rural areas where the Latino population is more comprised of often-transient agricultural workers. In short, the CA-20 district that I’ve drawn may not be deemed as providing Latinos with a true opportunity to elect a “candidate of choice” despite the high Latino percentage. Even more importantly, it may be the case that Latino registration figures are so out of sync with the Census count that this district would still be considered ‘retrogressive’ under Section 5.

To make the long story short, if this district fails to satisfy Section 5 requirements, then obviously the solution is to restore the current dip down to Bakersfield, and the district will obviously become much more Democratic. On the flip-side, I decided to roll with the district I mapped out because that may well be the kind of district that will satisfy the GOP enough to garner three Republican votes for passage by the Commission.

Aside from these Section 5 issues, my map features seven majority-minority districts where there are currently four, and two of these are majority-Latino versus just one on the current map.

Partisan Impact: For the Central Coast the partisan impact is virtually assured: CA-17 remains heavily Democratic, CA-23 becomes somewhat more competitve but still likely Democratic, and CA-24 gets a clear Democratic lean. I’ve seen it mentioned elsewhere that – in maps similar to mine – CA-30 somehow crosses over to take in the more Republican parts of Ventura County as a “political” move to favor Democrats, but this is total nonsense. The parts of Ventura County closer to the LA County border are more Democratic, not less Democratic, and if you instead map CA-24 starting at the LA County line northward you end up with a CA-24 district that’s between 58% to 60% Obama.

For the Central Valley, the partisan effect is even more consequential. My map creates a ‘toss-up’ CA-11 district in San Joaquin & Stanislaus, with perhaps a slight GOP lean, in place of a strongly Democratic seat in the Bay Area. Otherwise, CA-20 and CA-21 also become ‘toss-ups’ with a slight GOP lean. The consequences for 2012 are probably more contingent on where the incumbents decide to run, so I’ll comment further below.

Incumbents: None of the Central Coast incumbents are displaced, though Gallegly might as well be.

As for the Central Valley, we can safely say that McCarthy will end up in whatever district covers the bulk of Kern County. Since it strikes me as implausible that one of the Bay Area Democrats or one of the dispossesed SoCal Republicans would move to the Central Valley, that leaves four incumbents for five districts. The question then is where will they run.

In my mapping scheme above, Cardoza would obviously run in CA-18. Denham would also be in CA-18 (both Cardoza and Denham live in Atwater in Merced County), but that’s the case already and it obviously didn’t stop him from running in the current CA-19 district. That said, on my map Nunes (Visalia) is actually in CA-19 and he would represent more of the new district’s population than would Denham. So, I imagine Nunes would likely end up running there. As for Costa, he lives in Fresno and I think he’d almost surely run in CA-21 unless the new CA-20 district ends up being more like the current CA-20 district.

So, that leaves Denham to run in one of the slight-GOP ‘toss-ups’ (CA-11 or CA-20) leaving the other one vacant.

Los Angeles

My latest map of Los Angeles is below. There isn’t really that much to say about Los Angeles in general, other than to note that Dreier’s CA-26 district is effectively gone to the Inland Empire (and I’ll discuss it there). Besides that, my goal was, yet again, to create as many majority-minority seats as possible, and to make as many of them as reasonable majority-Latino.

It’s also worth explaining why I chose to have three districts cross over from neighboring counties.

Bringing the CA-42 district across from San Bernardino is the best way to maximize the Latino population of that district while also maintaining the Latino proportion of CA-43. If the goal is to maximize majority-Latino districts, then this is obviously the way to go.

As for CA-40 and CA-46, bringing them into LA County to take in the more white parts of Long Beach (CA-46) and the Whittier/Diamond Bar area (CA-40) is the most effective way to maximize the minority percentage of the neighboring LA County seats, while also maximizing the minority percentages of CA-47 and CA-48 in Orange County. So, from a VRA standpoint, this is again the obvious way to go. From a partisan standpoint it makes no difference of consequence.

Anyhow, here are the districts:

CA-25 (R-McKeon): 50% Obama – 48% McCain (53% Minority – 34% Latino)

CA-27 (D-Sherman): 69% Obama – 29% McCain (76% Minority – 60% Latino)

CA-28 (D-Berman): 71% Obama – 27% McCain (53% Minority – 38% Latino)

CA-29 (D-Schiff): 68% Obama – 30% McCain (69% Minority – 22% Asian; 39% Latino)

CA-30 (D-Waxman): 67% Obama – 32% McCain

CA-31 (D-Becerra): 81% Obama – 17% McCain (82% Minority – 62% Latino)

CA-32 (D-Chu): 63% Obama – 35% McCain (82% Minority – 28% Asian; 52% Latino)

CA-33 (D-Bass): 84% Obama – 14% McCain (79% Minority – 54% Latino)

CA-34 (D-Roybal-Allard): 70% Obama – 28% McCain (82% Minority – 67% Latino)

CA-35 (D-Waters): 88% Obama – 10% McCain (92% Minority – 40% AA; 45% Latino)

CA-36 (D-Harman): 63% Obama – 35% McCain

CA-37 (D-Richardson): 80% Obama – 19% McCain (89% Minority – 56% Latino)

CA-38 (D-Napolitano): 64% Obama – 34% McCain (71% Minority – 60% Latino)

CA-39 (D-Sanchez): 64% Obama – 34% McCain (84% Minority – 67% Latino)

VRA Implications: My map features 12 majority-minority seats in LA County which is the same as the current map. However, the Dreier seat which is currently majority-white has been pushed entirely out of LA County to become a majority-Latino Inland Empire seat. On the flip-side, CA-36 (Harmon) has dropped from 54% minority to 43% minority – which is an unavoidable consequence of eliminating the CA-46 coastal strip to take in Palos Verdes. Meanwhile, McKeon’s CA-25 seat has gone from 43% minority to 53% majority-minority. So, to make the long story short, this represents a net gain of one majority-minority seat.

The other significant VRA development is that my map features 8 majority-Latino seats versus 6 in the current map. The current majority-Latino seats have these Latino percentages: 77%, 70%, 69%, 62%, 61%, 55%. My Latino-majority seats have these percentages: 67%, 67%, 62%, 60%, 60%, 56%, 54%, 52%. In short, I’ve chosen the best balance I could come up with between maintaining the population of the current majority-Latino seats versus creating new ones. If the Commission would prefer one or two more seats above 65% then they’ll just create choppier lines. If so, more power to them; I don’t see the need to do so.

Partisan Impact: There’s really not much to say here. LA County will feature 13 heavily Dem seats and one McKeon seat. The Dreier seat, of which a majority lives outside LA County anyhow, will surely be displaced. The CA-25 McKeon seat that I’ve drawn here is basically the most Republican leaning seat that can be drawn in the less-populated northern half of LA County. If it dips south anywhere besides the places where I’ve chosen then the Obama percentage will rise.

Beyond that, there is of course no possibility of a second GOP seat in LA County. However, I do want to comment on what seems to be a widespread misconception that a more GOP leaning CA-36 might be drawn if it were oriented eastward (from Palos Verdes to Long Beach) rather than northward (from Palos Verdes to Santa Monica). In reality, this is simply not true and the only reason why I can figure this mistaken belief has seemingly become common on SSP is because it keeps getting repeated in every California thread despite having no support whatsoever. In actuality, the CA-36 district that I’ve drawn here is the most Republican seat that can viably be drawn in southwest LA, and everything around it is heavily Democratic. The more you shift it toward Long Beach, the more Democratic it becomes.

Incumbents: Perhaps the most interesting part of my LA map is in how it scrambles the incumbents, which I imagine is very likely to be the case with any LA mapping scheme that is less gerrymandered than the current one. Needless to mention, this is only representative of what might happen, but here’s the list of LA districts with who currently represents the district of that number and with where the incumbents end up on my map:

CA-25 (R-McKeon): McKeon (Santa Clarita)

CA-27 (D-Sherman): Vacant

CA-28 (D-Berman): Sherman (Sherman Oaks); Berman (Valley Village); Schiff (Burbank)

CA-29 (D-Schiff): Becerra (Eagle Rock)

CA-30 (D-Waxman): Waxman (Beverly Hills)

CA-31 (D-Becerra): Roybal-Allard (Boyle Heights)

CA-32 (D-Chu): Chu (Monterey Park)

CA-33 (D-Bass): Bass (Culver City); Waters (Hancock Park)

CA-34 (D-Roybal-Allard): Linda Sanchez (Lakewood)

CA-35 (D-Waters): Vacant

CA-36 (D-Harman): Harman (Venice)

CA-37 (D-Richardson): Richardson (Long Beach)

CA-38 (D-Napolitano): Dreier (San Dimas)

CA-39 (D-Sanchez): Napolitano (Norwalk)

How they’d sort it all out is obviously speculative at best, but I do want to make a few observations.

Waters does not live in the current CA-35 district anyhow, so I doubt this makes any difference in that regard. I don’t know if she maintains a property or whatever in Watts, but her current arrangement would obviously work just as well no matter how the new maps are drawn.

Berman and Sherman live very close together and it took some creative map-drawing to keep them in separate districts in 2001. The likelihood of them ending up in the same district is high, especially if the San Fernando Valley is consolidated into a 60%+ majority-Latino district, as seems quite likely.

It doesn’t really matter where Dreier ends up, since he won’t be able to win an LA County district regardless (unless he moves to CA-25), so I presume that if he does end up as the only resident incumbent of a district then one of the Democrats will move over to help sort things out.

Finally, Harman doesn’t actually matter anymore for these purposes. So, it’s worth noting that of the two contenders for the CA-36 seat, Debra Bowen lives in Marina del Rey and would still be in CA-36 on my map. Janice Hahn lives in San Pedro near the Port of Los Angeles which ends up in CA-37 on this map. Since the lower part of CA-36 will almost surely have to shift westward to take in Palos Verdes, it’ll be a very close call which side of the line San Pedro ends up on.

If you’re a Winograd supporter, get real. (She lives in Marina del Rey.)

Orange County & the Inland Empire

The next two maps cover Orange County and the Inland Empire. In my mapping scheme, this also includes CA-26, which is now a Riverside County seat. It’s worth noting that, although CA-26 is more commonly thought of as an LA County seat, a majority of the current CA-26 population actually lives outside LA County. Since the seat anchored by Riverside city is the least congruent with any of the current districts, it makes sense to label that CA-26 for comparative purposes.

My mapping scheme is very straightforward, so there’s not really much to add that I don’t cover below. Since the numbering ends up out of order, here’s how these seats break down by county:

San Bernardino

CA-41 (R-Lewis): 44% Obama – 54% McCain

CA-42 (R-Miller): 55% Obama – 43% McCain (71% Minority – 54% Latino)

CA-43 (D-Baca): 65% Obama – 33% McCain (79% Minority – 61% Latino)

Riverside

CA-26 (R-Dreier): 59% Obama – 39% McCain (70% Minority – 53% Latino)

CA-44 (R-Calvert): 41% Obama – 57% McCain

CA-45 (R-Bono Mack): 50% Obama – 48% McCain (52% Minority – 43% Latino)

Orange

CA-40 (R-Royce): 44% Obama – 54% McCain

CA-46 (R-Rohrabacher): 50% Obama – 48% McCain (52% Minority – 22% Asian; 25% Latino)

CA-47 (D-Sanchez): 56% Obama – 42% McCain (77% Minority – 61% Latino)

CA-48 (R-Campbell): 53% Obama – 45% McCain (59% Minority – 37% Latino)


VRA Implications: On the current map, these 10 seats include only 3 minority-majority seats (CA-40, CA-43, CA-47) two of which are also majority-Latino (CA-43 & CA-47). My map has 7 out of 10 seats as majority-minority and 4 of these are majority-Latino. It’s difficult to envision a more drastic improvement from a VRA standpoint.

Of the current majority-Latino seats, I’ve nudged Baca’s CA-43 up from 58% Latino to 61% Latino. Loretta Sanchez’s CA-47 has dipped from 65% Latino to 61% Latino. I should say that I was somewhat ambivalent about this latter move, but it’s a necessary tradeoff if CA-48 is to become a solid majority-minority seat in its own right. More importantly, I suspect that the actual Census figures will make it quite easy to turn CA-48 into a majority-minority Irvine-based seat alongside an Anaheim-based CA-47 district with a Latino percentage about where it’s at now.

Otherwise, there seems little doubt that three compact majority-Latino seats can be anchored in San Bernardino, Chino, and Riverside. Beyond that, pulling CA-46 out of Palos Verdes virtually assures that it becomes majority-minority – even if only slightly so – and CA-45 is probably even more Latino than the ACS figures project.

Finally, it’s also worth noting that CA-40 and CA-41 are each 51% white on this ACS map, so they may actually be majority-minority in the Census count.

Partisan Impact: The partisan impact for the Inland Empire is perhaps the most substantial aside from the Central Valley. The new Riverside seat is virtually assured to be strongly Dem – and basically replaces the current heavily-gerrymandered Dreier seat. Meanwhile, Gary Miller’s seat goes from a 53% McCain district to a 55% Obama district.

In Orange County, the most significant impact is on Campbell who goes from a 49%O-49%M district to a 53% Obama district. Rohrabacher’s seat becomes just slightly less secure on my map (going from 48%O/50%M to 50%O/48%M) but it’s worth noting that if CA-46 were to take in any more of Long Beach, or if it took in the part of LA County running more along the county border rather than along the Long Beach coastline, then it would become steadily more Democratic.

On the flip-side, CA-40 and CA-44 both become more solidly GOP as white voters get packed here to make way for the majority-minority seats. CA-44 in particular goes from a 50% Obama district to a 57% McCain district.

Incumbents: Several incumbents get displaced by this mapping scheme. Gary Miller lives in Diamond Bar which ends up in the CA-40 district. This would probably be just as well because if something like these maps were the case then it makes far more sense for Miller to challenge Royce (Fullerton) in a primary than to run in the CA-42 district. If CA-40 doesn’t enter LA County, then I think the most likely alternative is for Miller to end up in one of the ultra-Dem LA County districts, so my map is probably about the best-case scenario for him.

This map also draws Lewis (Redlands) and Baca (Rialto) into the same CA-43 district, but I’m sure Lewis could easily run in CA-41 regardless (and he’s reportedly considering retirement anyhow). Finally, Calvert lives in Corona which ends up in CA-42 here, but I’m sure he’d run in the CA-44 district (or its equivalent) no matter where he ends up.

San Diego

Below I’ve included two maps. The first is a broader view of SoCal while the second is a closer view of San Diego so that it’s clear exactly where I’ve drawn the lines.

In my view, this mapping scheme is the most likely arrangement for San Diego County. The city and suburbs of San Diego can clearly anchor two compact seats, and most people seem to agree that Imperial County is most ‘naturally’ attached to San Diego County versus Riverside County. Once those decisions are made, then the rest seems obvious: maximize Latino percentage in CA-51, turn CA-52 into a majority-minority district, and then place CA-50 & CA-49 northward along the coast.

That said, I realize that there’s a contingent that favors an Imperial to Riverside mapping scheme instead, so I’ve actually decided to create an alternative map on that basis. For the sake of keeping things clear, and since the main body of this diary is long enough as it is, I’ll post that separately in the comments.

For now, here are the partisan figures for the five San Diego County districts. Once again, I’ll post further comments after the maps.

CA-49 (R-Issa): 47% Obama – 51% McCain

CA-50 (R-Bilbray): 50% Obama – 49% McCain

CA-51 (D-Filner): 57% Obama – 42% McCain (76% Minority – 61% Latino)

CA-52 (R-Hunter): 54% Obama – 44% McCain (55% Minority – 32% Latino)

CA-53 (D-Davis): 63% Obama – 36% McCain


VRA Implications: The main VRA implications are that I’ve pushed the Latino percentage of CA-51 from 53% to above 60% and I’ve turned CA-52 into a majority-minority district. I chose CA-52 instead of CA-53 because, much to my surprise, when I looked at what remained after I pushed CA-51 to 60% Latino it was clear that CA-52 could much more easily become majority-minority than could CA-53. When I tried doing it with CA-53 instead, I ended up with far more weirdly shaped districts. That said, we can’t rule out the possibility that the actual Census figures will make CA-53 the more viable majority-minority district.

It’s also worth noting that CA-52 was already a 52% Obama district when I initially mapped it based on geographic cohesion without regard to minority percentage. The ‘VRA modification’ just bumped it up, obviously.

Partisan Impact: The main partisan consequence of this mapping scheme is to turn CA-52 from a 53% McCain district to a 54% Obama district.

This is what it comes down to for San Diego, as I see things: CA-51 and CA-53 will be safe Dem no matter what. (I’ve seen a fantasy floating around that pushing up the minority percentage of CA-51 might somehow endanger Susan Davis. This is clearly false. The heavily Dem western parts of San Diego city will anchor a Democratic district no matter what happens with CA-51.) Now, it might well turn out that Filner is subject to a strong Latino primary challenge (assuming he doesn’t run for mayor of San Diego), but that won’t matter in partisan terms.

On the flip-side, CA-49 and CA-50 are likely to remain GOP leaning much as they are now (they each become a bit less GOP on my map, but should still be expected to elect Republicans for the time-being, and certainly to re-elect the current incumbents).

The only real question is what happens with CA-52. In short, the more compact CA-52 becomes the more Democratic it becomes. Since the California guidelines mandate compactness except where VRA requirements suggest otherwise, and especially since a more compact CA-52 district in the eastern suburbs of San Diego city can be made majority-minority (which is not the case if a district similar to the current CA-52 in the San Diego County hinterland were maintained) then I think this is the more likely outcome.

Incumbents: Issa and Bilbray live just 8 miles away from each other, in Vista and Carlsbad respectively, so it’s quite likely they’ll end up mapped in the same district. My map happens to put them both in CA-49 (while my alternative Imperial-to-Riverside map happens to put them both in CA-50). The short of it is that one or the other will very likely have to move or else run in a district where he no longer resides. The other three incumbents are very unlikely to be displaced.