A Republican Hawaii

Given the condition of Hawaiian politics the title of the diary may seem laughably oxymoronic. Nevertheless there areas exist in Hawaii where Republican votes are more concentrated than others. Given Obama’s marked birth-state advantage in Hawaii I used Bush/Kerry numbers for calculations.  

CD1(Blue): 47.6% Kerry 16/9/53/20 W/H/A/O

Most of Oahu, particularly the more Republican parts.

CD2(Green): 58.4% Kerry 29/9/42/20 W/H/A/O

South-eastern Oahu and all of the other Hawaiian islands.

It is possible to make CD1 a point or two more republican if VRA requirements are ignored. However CD1 would now be a fair fight district giving the rare Hawaiian Republican a much better chance of winning without relying on no-primary vote splitting jungle elections.  

Michigan Redistricting: An Unexpected Problem

Maintaining two VRA majority-African-American districts in the metro Detroit area is going to be much more of pain than I originally thought. In the relevant population by CD thread, I breezily commented:

And, on an even more important “not-to-mention” note, the Detroit metro area still has more than enough African Americans for two VRA districts, so consolidating MI-13 and MI-14 isn’t in the cards quite yet.

This is not untrue, but the measures required to get those two districts were a lot more dramatic than I expected. The most recent Census estimates painted a very different picture from the actual Census’s report of massive population loss in Wayne County. And so the new districts are likely to be quite different from what I (and others) had previously imagined.

After the jump, I present two different scenarios for the Detroit area districts. Please feel free to post your own — this is very much more about getting a discussion going than presenting anything close to a polished proposal.

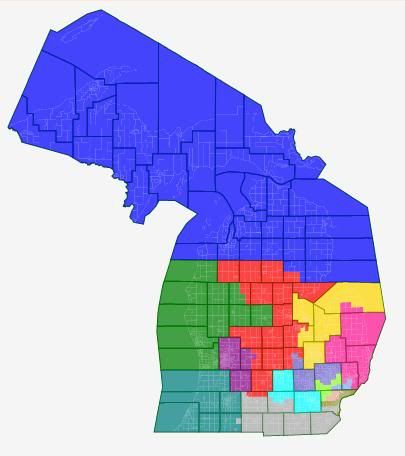
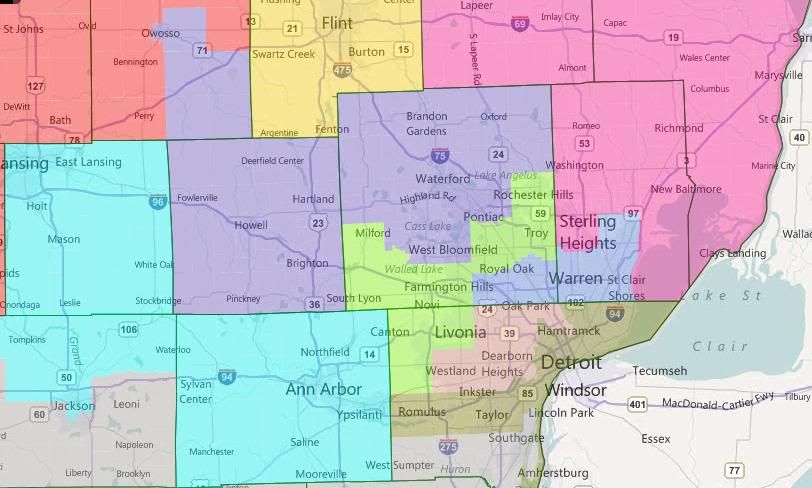
Map 1: Skirting the Line

So far as I can tell, this is the best you can do in terms of maximizing the African American percentages of the two Detroit districts while staying in Wayne County. However, the two Detroit districts are majority African American by total population, but not by VAP. So to the best of my understanding of current case law, this solution is VRA-suspect.

Which is unfortunate for the GOP, because this is reasonably successful map for them. Basically, this is an attempt to cut out both Dingell and Peters, while replacing one of their districts with a new safe Ann Arbor plus Lansing district.

District-by-district, briefly:

Benishek’s MI-01 (Blue) is shored up for the Republicans with the addition of Grand Traverse County. Likewise, Upton’s MI-06 (teal) gains Allegan County. Amash’s MI-03 (purple) holds more or less steady, as does Miller’s MI-10 (pink).

Huizenga’s MI-02 (green) – currently the most Republican district – absorbs a couple of problematic counties from Camp’s MI-04 (red). MI-04 is a little shaky for the Republicans, but I’m not sure how to fix that.

Walberg’s MI-07 (grey) loses Eaton and outer Washtenaw County and picks up Monroe County and the southern tier of Wayne County – I could be wrong, but my instincts tells me that’s a wash. Kildee’s MI-05 (yellow) stretches north to take in more of the Thumb and all of Bay County, which marginally weakens it for the Democrats. MI-09 (cyan) is a new heavily Democratic open seat stretching from Ann Arbor to Lansing.

Then, we move into the Detroit Metro area. Massive population loss in Detroit causes Conyer’s MI-14 (brown) and Clarke’s MI-13 (salmon) to chew up most of the Wayne County portions of Dingell’s dismantled MI-15. They’re 50.6% African American total pop, 49.6% VAP and 50.3% African American total pop, 49.5% VAP respectively. Levin’s MI-12 (cornflower blue) stays more or less the same, picking up the rest of Royal Oak from Peter’s dismantled version of MI-09.

Speaking of which, that’s been bisected between McCotter’s MI-11 (lime) and Rogers’s MI-08 (slate blue). McCotter picks up Peters himself and some of the more Republican parts of the dismantled Ninth. Rogers gets some of the most Democratic parts of the old ninth in West Bloomfield, Pontiac, and Auburn Hills — but he no longer has to worry about Lansing, so he should still be fine.

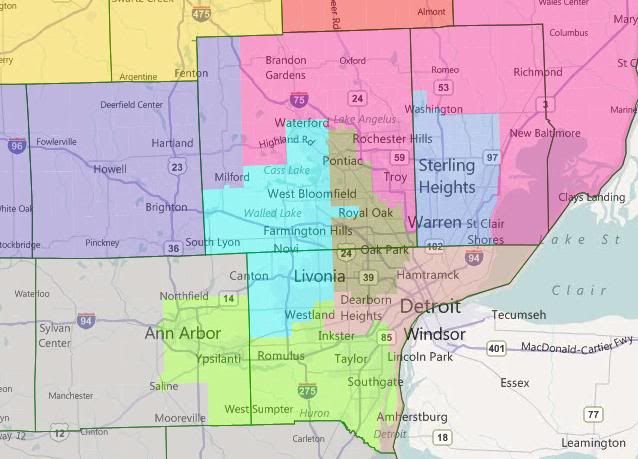
Map 2: The Problem of Pontiac


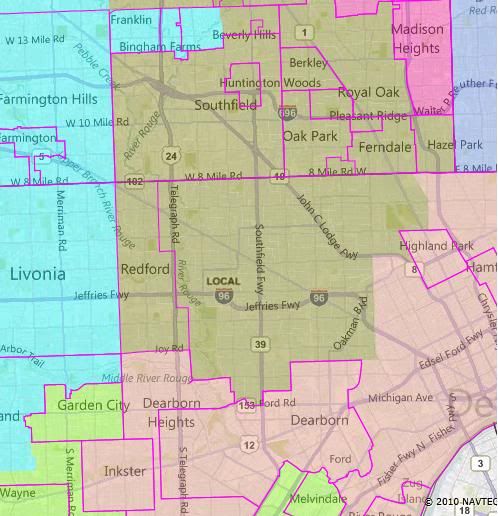
Same thing, just zoomed in with locality lines

This one really just focuses on the two Detroit districts. In contrast to the first map, you’re looking at two true majority African-American districts. MI-13 (salmon) is 53.0% African American on both measures. MI-14 (brown) is 56.5% African American by total population, 54.6% African American by VAP.

So far as I can tell, stretching Conyers’s district over into Oakland County like this to pick up Southfield and Oak Park is the only way to get the two Detroit districts to combine into majority-African-American status. Having done that, stretching up to majority-African-American Pontiac seems to make a lot of sense.

Having Clarke’s district stretch through Dingell’s Dearborn to get to majority-African-American Inkster isn’t strictly necessary to get to 50% African American by VAP, but it does help.

Now, if I’m right in my understanding of case law and this basic configuration is necessary to comply with the requirements of the VRA, then state GOP has a problem on its hands. They can’t draw a district for McCotter that (1) he can win and (2) conforms with state redistricting standards.

Michigan state redistricting standards frown on county and locality splitting and are generally understood to prohibit what user rdelbov generally calls a “double-cross” — that is, having Districts X and Y share both Counties A and B. If you look over the current map, you’ll see that interpretation seems to have been followed under the last GOP gerrymander. McCotter’s district is the one allocated Oakland-Wayne split district. If Conyers’s district becomes one, then McCotter’s district, under state redistricting standards, can’t do that any more. But McCotter lives in Wayne County, and he needs those Oakland County Republicans to have a winnnable district.

Now, the potential out here is that, so far as I understand it, the state Supreme Court basically declared the state redistricting standards non-justiciable the last time a suit was filed based on them after the 2000 round of redistricting. So if the GOP wants to ignore them, they probably can.

I drew in sample districts around the two Detroit districts. The Detroit metro area ones more of less work, from a GOP perspective, although some of the non-pictured outstate ones were pretty ugly. But without knowing how to resolve the “double-cross” conundrum, I wasn’t really sure how to proceed.

Wrap-Up

So, which is the better way for the GOP to push the limits of redistricing law? Two only-borderline majority African American districts in Detroit? Or violate (potentially unenforceable) state law and have two districts cross the Oakland-Wayne border? Or do you have a better solution altogether?

Daves Redistricting: 2010 data for all but 5 states

All but 5 states now have 2010 data.

Four of the five require Block Groups and will be done in a week-ish: KY, MT, OR, RI.

The last is Alaska, which I’m not planning to do. It presents a unique technical problem, which I don’t want to spend the time on unless there is a huge groundswell of interest.

So, the new states are ME, MA, MI, NH, NY, SC and WV.

Note on CA: some of the voting districts are indeed huge. Example: City of Fremont (pop. 84000+) is a single voting district. I went back and checked the raw files from the Census Bureau and this is indeed the case. When I get the other Block Group states done, I will add block groups for CA, too. I will also add block groups for some New England states. NH really seems to need it, but MA does not seem bad.

Daves Redistricting

Remember, you can support this project with a tax-deductible contribution through ProgressiveCongress.org.

Thanks.

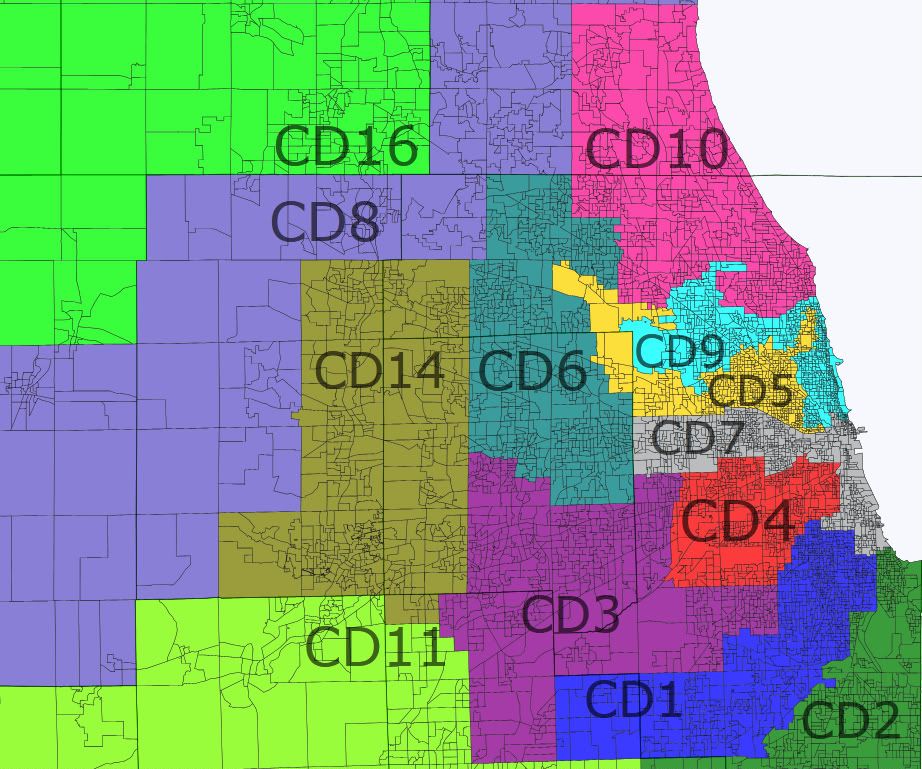
Illinois with 2 Hispanic* districts

This map is intended to favor Dems as they control both houses and the governor’s office. I tried to avoid any egregious gerrymanders, and I suspect that some of the suburban Chicago districts could be made more favorable. The only really ugly districts are IL5 (Quigley) and IL9 (Schakowsky). IL5 had to take a pretty strained shape to get a voting-age Hispanic plurality, although it still isn’t nearly as bad as the current Hispanic-majority IL4 (Gutierrez). IL9 had to pick up the vacated IL5 precincts that didn’t have enough Hispanics, as IL7 (Davis) has just a 50.1% voting-age black majority and could not pick anything up.  

State map:

Photobucket

Chicago area map:

Photobucket

Notes on districts, with voting-age populations. w = Anglo, b = black, h = Hispanic, a = Asian.

IL1 (blue, Rush): 38.2w-52.1b-7.4h-1.2a. Underpopulated and has to expand to the west. Safe D.

IL2 (green, Jackson): 36.0w-50.8b-11.2h-0.9a. Underpopulated and has to expand to the south to pick up most of Kankakee. The southernmost area is Pembroke, an 85% black semi-rural area which is unusual outside the south. Safe D.

IL3 (purple, Lipinski?): 77.2w-6.1b-8.9h-6.6a. This district has more of the current IL13 (Biggert) than the current IL3, as it really had nowhere else to go. It’s probably competitive. Tossup?

IL4 (red, Gutierrez): 31.3w-6.1b-58.3h-3.6a. One of the ugliest districts in the nation is now one of the cleanest. Safe D.

IL5 (yellow, Quigley): 43.2w-4.8b-44.4h-6.1a. I don’t think it’s possible to draw a second Hispanic-majority district without using really tortured lines. As is I think this proposed district as pushing it as far as “compact” goes, although obviously it isn’t nearly as screwy as the current IL4. Safe D

IL6 (teal, Roskam): 73.3w-3.1b-11.4h-11.1a. It picks up the Palatine and Schaumburg areas, and loses its heavily Hispanic area in the east and some of its western end. It may be slightly more red now, but I know very little about the political leanings of Chicago suburbs. Tilt R?

IL7 (gray, Davis): 31.0w-50.1b-9.8h-7.5a. There probably will not be 3 black-majority districts after 2020. Black plurality, maybe. Safe D.

IL8 (blue-gray, Walsh): 69.2w-6.4b-18.1h-5.1a. Dumps its piece of reddish McHenry county and some Cook suburbs, and picks up Waukegan, much of swingy Kane county, and bluish DeKalb county. This is intended for Melissa Bean to return to DC. Walsh doesn’t live here. Tilt D?

IL9 (toothpaste blue, Schakowsky): 73.1w-6.4b-10.0h-8.7a. Moves south and much more into Chicago proper. Safe D.

IL10 (pink, Dold!): 72.6w-4.1b-8.9h-12.9a. Moves south into IL9’s vacated areas, taking most of the college town of Evanston along with neighboring suburbs that are heavily Asian. This would probably be one of the most Asian districts outside California or Hawaii. The intent is to ensure that Dold! serves one term! Likely D?

IL11 (pea soup green, Kinzinger): 80.1w-5.8b-11.3h-2.0a. Loses some of its eastern end including Kinzinger’s house, picks up northwest Kendall county and some western rural areas. Lean R?

IL12 (light blue, Costello): 80.5w-14.7b-2.4h-1.2a. The St. Louis area district sheds most of its southern end but keeps the college town of Carbondale, and adds Macoupin county and the rest of Madison county. Obama got 57.3% of the two-party vote here. Lean D.

IL13 (pink-gray, Shimkus): 93.5w-3.6b-1.6h-0.5a. Renumbered from IL19. Downstate Republican sink. Safe R.

IL14 (brown-green, Hultgren): 61.4w-5.5b-24.1h-7.9a. Loses most of its western rural areas (which are actually swingy for the most part) and exurbs and picks up the Naperville and Hanover areas. Tossup?

IL15 (orange, Johnson):  80.5w-10.6b-3.0h-4.4a. This is my concept of the “midstate cities swing district” that jsramek mentioned on an earlier Illinois thread. It has Springfield, Decatur, Bloomington-Normal, Champaign, and Danville. Obama got 52.8% of the two-party vote in the 6 counties within the district, although it’s missing some (probably red) rural and exurban areas within these counties. Toss up, but it would likely take a very strong candidate to beat Johnson.

IL16 (garden hose green, Manzullo): 85.9w-2.7b-8.4h-2.0a. The north state Republican “sink”. It picks up the rest of McHenry and loses its western end and the bluest parts of Rockford. Walsh also lives here. Likely R?

IL17 (indigo, Schilling): 82.0w-9.6b-5.7h-1.5a. Moves north from its current fugly-mess configuration to take in purple or blue areas of the state’s northwest, including Peoria and the bluest parts of Rockford. Obama got 58.2% of the two-party vote here without any of Rockford, so his overall share here was probably closer to 60%. Lean D/likely D.

IL18 (yellow, Schock): 94.1w-2.6b-1.9h-0.5a. Mid-state Republican sink. Schock actually lives in IL17 but would probably run here. Likely R/safe R.

Under this map, the Dems would easily hold districts 1, 2, 4, 5, 7, and 9. They should (finally) take 10 and retake 8 and 17, and Costello shouldn’t have too much trouble in 12. Reeps will hold 13, 16, and 18. Then you have 3, 6, 11, 14, and 15 which appear to all be competitive and all of which could conceivably be held by Republicans. Given that 3, 6, 11, and 14 occupy a contiguous block of western and southwestern suburbs, I suspect it would be possible to draw them such that one of them is lean-R or even likely-R and the other 3 are tossup or tilt-D. (I would leave this for someone who knows more about Chicago-area politics.) As is, I would say this is a 10-3-5 map but probably 11-7 or 12-6.

Thoughts? In particular, thoughts about how the Dems might draw the lines in the western and southwestern Chicago suburbs?

By what margin will Bob Shamansky win?

View Results

Loading ... Loading ...

NY and ME: Population by CD

Today’s the last day of Census data releases, meaning we have the complete set of all 50 states now. The Census Bureau released some data summarizing the entire nation, including what you’d think was the single most important bit of all, considering the way they hyped the announcement: the new population center of the U.S., still in south-central Missouri, but moving 30 miles to the southwest, now near Plato, MO. Perhaps more interestingly, they summarized the country’s demographic change as a whole: that starts with the nation’s Hispanic population crossing the 50 million mark, now up to almost 17% of the nation’s population. Hispanics and Asians both grew at a 43% rate, and people checking “2 or more” races rose at a 32% rate. The non-Hispanic white share of the population fell from 69% to 64%. They also found a country that’s more urban than ever before, with 84% of the country living in metropolitan areas now.

I know you’re all champing at the bit to find out what happens in Maine, but there’s this other state called “New… Something” that we should probably get through first. New York is one of only two states to lose two seats, from 29 down to 27. (Ohio was the other one.) New York’s new target is 717,707, up from about 654K in 2000. Thanks to a few hundred votes in a couple of state Senate races that tipped that chamber’s balance, the GOP managed to hold on to one leg of the redistricting trifecta, meaning that instead of a shot at a 26-1 Dem map, there’s probably just going to be a shared-pain map instead with a GOP loss upstate and a Dem loss in the NYC metro area. That’s despite the fact that New York City itself actually grew a bit, to 8.175 million, still by far the nation’s largest city. (There are moves afoot toward an independent redistricting commission, but this doesn’t seem likely to happen.)

In general, the heaviest losses were in the western part of Upstate, with the state’s two biggest losers the Dem-held 27th (Buffalo) and 28th (Rochester). On the other hand, losses also popped up rather patchily in parts of the outer boroughs (especially the 11th in the black parts of Brooklyn… without much seniority, Yvette Clarke may wind up with the shortest straw among the NYC delegation) and Long Island (Peter King’s 3rd… which would be a prime target for the 2nd seat to evaporate, if only the Dems controlled the trifecta here). The big gainers were both urban (Jerry Nadler’s 8th, probably fueled not so much by growth in Manhattan as among Orthodox families in Borough Park in Brooklyn) and exurban (Nan Hayworth’s 19th, at the outermost reaches of the NYC metro area).

While none of the districts in New York seem to be undergoing the kind of rapid demographic transformation that threatens the red/blue balance in any place like we’ve seen in Texas or California, a few districts are worth looking at just as an indicator of what an interesting tapestry New York City is. Take the 5th for instance (another possibility for wipeout, given its strange position straddling Nassau County and Queens, and Gary Ackerman’s non-entity-ness): it’s moved from 44% non-Hispanic white, 5% non-Hispanic black, 24% non-Hispanic Asian, and 24% Hispanic, to 36% white, 4% black, 33% Asian, and 26% Hispanic, close to an Asian-plurality, thanks to growth in the Asian community in Flushing. A few districts in New York City are getting whiter, thanks to hipsters and gentrifiers: the 11th moved from 21% white and 58% black to 26% white and 53% black, while the 12th moved from 23% white and 49% Hispanic to 27% white and 45% Hispanic. The Harlem-based 15th went from 16% white, 30% black, and 48% Hispanic, to 21% white, 26% black, and 46% Hispanic, while the remarkably complex, Queens-based 7th went the other direction, from 28% white, 16% black, 13% Asian, and 40% Hispanic to 21% white, 16% black, 16% Asian, and 44% Hispanic.


District Rep. Population Deviation
NY-01 Bishop (D) 705,559 (12,148)
NY-02 Israel (D) 679,893 (37,814)
NY-03 King (R) 645,508 (72,199)
NY-04 McCarthy (D) 663,407 (54,300)
NY-05 Ackerman (D) 670,130 (47,577)
NY-06 Meeks (D) 651,764 (65,943)
NY-07 Crowley (D) 667,632 (50,075)
NY-08 Nadler (D) 713,512 (4,195)
NY-09 Weiner (D) 660,306 (57,401)
NY-10 Towns (D) 677,721 (39,986)
NY-11 Clarke (D) 632,408 (85,299)
NY-12 Velazquez (D) 672,358 (45,349)
NY-13 Grimm (R) 686,525 (31,182)
NY-14 Maloney (D) 652,681 (65,026)
NY-15 Rangel (D) 639,873 (77,834)
NY-16 Serrano (D) 693,819 (23,888)
NY-17 Engel (D) 678,558 (39,149)
NY-18 Lowey (D) 674,825 (42,882)
NY-19 Hayworth (R) 699,959 (17,748)
NY-20 Gibson (R) 683,198 (34,509)
NY-21 Tonko (D) 679,193 (38,514)
NY-22 Hinchey (D) 679,297 (38,410)
NY-23 Owens (D) 664,245 (53,462)
NY-24 Hanna (R) 657,222 (60,485)
NY-25 Buerkle (R) 668,869 (48,838)
NY-26 Vacant 674,804 (42,903)
NY-27 Higgins (D) 629,271 (88,436)
NY-28 Slaughter (D) 611,838 (105,869)
NY-29 Reed (R) 663,727 (53,980)
Total: 19,378,102

Now for the maine event! (Rim shot.) Maine’s a lot like Rhode Island and New Hampshire in that the long-standing boundary between its two districts rarely seems to budge much, and this year won’t be any different. Maine’s target is 664,181, up from 637K in 2000. The disparity of a little more than 4,000 people means things won’t change much; the Republicans control the redistricting process this year but there’s not a lot of fertile material here for them to try to make swingy ME-02 much redder.


District Rep. Population Deviation
ME-01 Pingree (D) 668,515 4,334
ME-02 Michaud (D) 659,846 (4,335)
Total: 1,328,361

RI, SC, and WV: Population by CD

Rhode Island doesn’t offer much for redistricting fans to sink their teeth into: it has two districts that are about equally blue, the Dems control the redistricting trifecta, and the disparity between the two districts, while not New Hampshire-close, requires only minimal boundary-shifting. Rhode Island’s target is a tiny 526,284 (only up from 524K in 2000… Rhode Island had the smallest growth, percentage-wise, of any state over the decade, putting it 2nd overall behind only Michigan, which actually lost population). If this continues, there’s the distinct possibility we could see Rhode Island reduced to one House seat come 2020. Also worth noting: Rhode Island had a lot of Hispanic growth over the decade, not quite on par with the Southwest but high for the Northeast; it went from 8.5% Hispanic to 12.4%, and Providence moved to a Hispanic plurality.


District Rep. Population Deviation
RI-01 Cicilline (D) 519,021 (7,263)
RI-02 Langevin (D) 533,546 7,263
Total: 1,052,567

South Carolina is gaining one seat to move from six to seven; its new target based on 7 seats is 660,766 (it was 668K in 2000, so every district gained significantly over the decade). With the GOP holding the trifecta and much of the growth seeming to come among white retirees, look for the creation of one more Republican-friendly seat… with one possible wild card, that the Obama DOJ might weigh in and push for a second African-American VRA seat (theoretically possible if terribly ugly, as SSP’s crack team of freelance mapmakers have shown here). The biggest growth has come in the coastal Low Country, rather than the fiercely evangelical uplands; I’d expect Charleston and Myrtle Beach, both part of SC-01 for now, to wind up each anchoring their own districts.


District Rep. Population Deviation
SC-01 Scott (R) 856,956 196,190
SC-02 Wilson (R) 825,324 164,558
SC-03 Duncan (R) 722,675 61,909
SC-04 Gowdy (R) 770,226 109,460
SC-05 Mulvaney (R) 767,773 107,007
SC-06 Clyburn (D) 682,410 21,644
Total: 4,625,364

West Virginia is staying at three seats for now, although it might be headed for two seats in 2020, given its slow growth and low targets; its target is 617,665, only up from 603K in 2000. The 3rd, in coal country in the southern part of the state, is losing population (though not as fast as one might suspect); the 2nd needs to shed an amount equivalent to what the 3rd needs to gain, leaving the 1st pretty stable. Much of the state’s growth is in the far east tip of the Panhandle (in the 2nd), especially Berkeley County, which serves as Washington DC’s furthest-out exurbs. Dave Wasserman, who seems to get all the good redistricting-related gossip, says that while the obvious solution (moving Mason County from the 2nd to the 3rd, and calling it a wrap) still seems likely, the Dems who control the redistricting trifecta might want to cobble together a slightly Dem-friendlier 1st along the state’s northern boundary that includes both Morgantown and the Panhandle exurbs (the only counties in the state that are getting bluer).


District Rep. Population Deviation
WV-01 McKinley (R) 615,991 (1,674)
WV-02 Capito (R) 648,186 30,521
WV-03 Rahall (D) 588,817 (28,848)
Total: 1,852,994

Kentucky Redistricting: Incumbent Protection Map

So, this is my first SSP diary! The 2010 Census data for my beloved Bluegrass State was released in one of the recent data dumps, but unfortunately it's not on Dave's App yet. Fortunately, there were absolutely no surprises in the final data, so for this map I am using the estimates, which produce results nearly identical to what the real ones would.

Kentucky, of course, has a 4R-2D delegation currently. Redistricting is up to the legislature (currently split; Dems have the House, GOP has the Senate) with the governor having veto power (Dems of course control this with Steve Beshear). There really hasn't been much redistricting talk that I've heard of yet, probably mostly due to the fact that not much will change. But one possibility is an incumbent protection map, especially considering some of the current Reps are starting to make their opinions known to the powers that be. 

Note that this is not necessarily the map I expect to see emerge. It's just one possiblity, and frankly it's about the most interesting Kentucky map to draw that has a realistic shot at happening. This is about as good as it gets for all six incumbents.


KY-01 Ed Whitfield (R- Hopkinsville) (Blue)

My home district lost some population and so it needs to expand a bit. Not much changes, though. It remains Western Kentucky-based, with a rather ugly arm extending into the hard right south-central part of the state. That arm does move west a bit to accomodate the fifth's move westward, but it's really just trading deep red territory for other deep red territory. I wish this would become a strictly western-based seat (it could be done by adding Owensboro), but I doubt it'll happen. Whitfield is, unfortunately, good to go.

Rating: Safe GOP


KY-02 Brett Guthrie (R- Bowling Green) (Green)

The second needs to shed some people, as the Louisville burbs have done some growing over the past decade. Ironically, though, this seat actually becomes much more suburban/exurban. by giving some southern counties to the first and now totally surrounding Jefferson County. In terms of the GOP primary (the only race that will really matter here), that does tip the balance more toward the eastern part of the district, but it shouldn't be a problem for the Bowling Green-based Guthrie (in case you were wondering, both Bowling Green and Owensboro are Republican-leaning despite being decent-sized towns). Guthrie probably has statewide ambitions at some point, but even if he goes, this seat's outcome is not in doubt.

Rating: Safe GOP


KY-03 John Yarmuth (D- Louisville) (Purple)

John Yarmuth remains confined in his little slice of Heaven, also known as Metro Louisville. Jefferson County has not grown much relative to the rest of the state, and it remains almost exactly the size of one CD, so hardly anything changes here. This area is trending blue, and the popular congressman should be fine if he survived 2010. It's hard to believe Anne Northup represented this just a few years ago.

Rating: Likely Dem


KY-04 Geoff Davis (R- Hebron) (Red)

Davis is a fellow you might not have heard of unless you're from Kentucky or you're a real junkie; he's a pretty unassuming backbencher. His base in the solid-red Cincinnati burbs has grown quite a bit, so this district needs to lose some people. It pulls further away from Louisville, notably dropping suburban and growing Oldham County, taking in a few more counties to the south and east. It remains safe for Davis and any other GOPer.

Rating: Safe GOP 


KY-05 Hal Rogers (R- Somerset) (Yellow)

Here's where things get a bit more interesting. As you can see, the fifth has lost some of its mountain flavor (but still keeps plenty of it) as it ceded some ancestrally Dem counties to help Ben Chandler's cause. Seeing as it was already losing population, it has to expand westward, now taking in parts of central Kentucky and even some Lexingon peripheral areas. It remains one of the poorest CD's in the country.

One notable feature of this map that may appeal to Republicans is that it pretty much takes this district off the table for any future Dems down the road. Of course old Hal is untouchable, but in its current configuration, it's not impossible, in an open seat situation, for a conservative Mongiardo-style Dem (maybe Mongiardo himself?) to win the fifth with a fantastic campaign in a good year. But with its Democratic heart cut out and given to the sixth, that possibility is probably gone. 

Rating: Safe GOP 


KY-06 Ben Chandler (D- Versailles) (Turquoise)

The big one, and the centerpiece of the whole map. As you SSPers know, Chandler eeked out a narrow win last year over the tea-flavored Andy Barr. It was actually quite impressive that he did it, but he's probably a bit spooked anyway and it wouldn't be shocking to see him ask for a better district. So here it is. The sixth gives away conservative territory in the north and south, freeing up room to expand east and take in the heart of Appalachia. While these counties mostly vote GOP on the national level now, they will still easily break for any competent statewide or local Kentucky Dem. The KDP tradition is very strong here; Bruce Lunsford (remember him?) won all but two of the counties here in '08 against McConnell, and one of those was Chandler's home of Woodford. Conway also did well here in 2010. 

Now, this is not without its drawbacks. I have expressed this concern before: Lexington/Frankfort and the coal counties are very different. They both vote for Dems, but their interests are worlds apart. That said, it's hard to imagine a Republican winning here, so it would really just be more of a personal concern for Chandler on a few issues. He should be fine, although don't expect him to move to the left much. 

Rating: Likely Dem 


So, there you have it. Not much action is likely to happen in the Bluegrass in redistricting, but this is one possibility, although if Beshear loses the governor's race this year this map probably becomes slightly less likely. Hope this sheds some light on the situation. 


Virginia State Senate Map

As has been mentioned repeatedly here on SSP, Virginia redistricting will apparently be done through a deal where in exchange for an incumbent protection map for an 8-3 in-favor-of-Republicans Congressional delegation and allowing the GOP-led House of Delegates (HoD) to draw its own map, the Democratic State Senate will get to draw its own map to protect its slight 22-18 advantage. While the circumstances of this deal may change if the Department of Justice does indeed force Virginia to have a second minority-majority district (read: African-American) in the southeast part of the state, for the time being this deal is the basis for redistricting.

Due to the off-year nature of elections in Virginia, it is more difficult to predict turnout and momentum, particularly with the 2011 election coming up in November affecting all 40 Senate seats and the 100 seats in the HoD. While the 2009 election had the governor’s race at the top of the ticket, it did not impact the State Senate because its seats are elected in non-gubernatorial years. Considering the disastrous performance of the Democratic candidates on top of the ticket which contributed to the loss of five Democratic seats in the HoD, we can be thankful that this is the case. Otherwise, the GOP would likely have taken control of the State Senate in addition to the governorship and thus controlled the entire redistricting process.

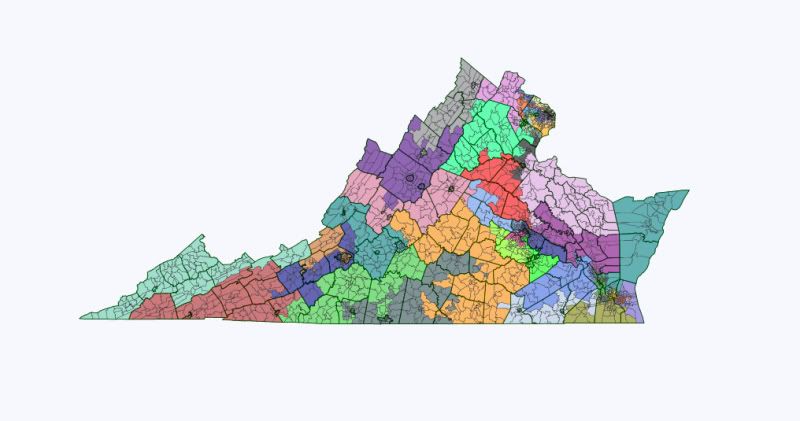
With all of this in mind, I have been formulating a State Senate map that both protects the Democratic majority and gives it a chance to increase its lead given the right circumstances. In doing so, I’ve attempted to not draw GOP incumbents out of their districts because of how this would likely engender resentment and could upset the redistricting deal. I’ve also tried to draw realistic districts though my map is certainly a gerrymander – however, based on the previous State Senate map, I don’t think it’s any worse in terms of compactness or ignoring communities of common interest. Additionally, I preserved all black majority-minority districts in the Tidewater and around Richmond, as well as the same number of white plurality districts in Northern Virginia (NoVA). In reviewing the new districts I drew, I will refer to their old Dem-GOP and Obama-McCain numbers based on an attempted sketch that I made of the current districts on Dave’s Redistricting App. I have also kept every district’s population total inside of 1,000 from the ideal number. The final result of my efforts is this map, which creates a good chance for a 24-16 Democratic edge after 2011 (if everything goes according to plan):
Photobucket

Unfortunately, I couldn’t manage to draw my home town of Harrisonburg into a Democratic district, but you can’t win them all. Anyway, details on my map are after the jump.

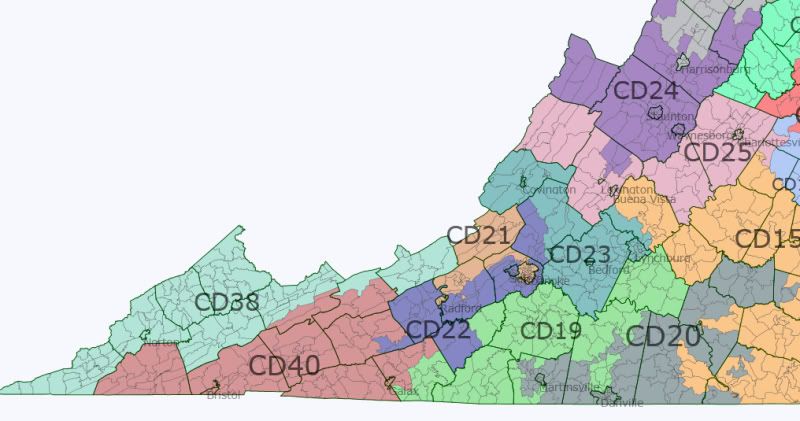
We’ll begin with the districts from the western side of Virginia. Here’s a map that stretches from  Southwest Virginia (SWVA) north into the Shenandoah Valley and east into what is known as Southside Virginia. I’ll discuss districts 40, 38, 22, 21, 19, and 23 here.
Photobucket

VA-40 (Brown) – GOP Incumbent, Safe GOP

In its current form, this district is one of the most Republican districts in Virginia. However, on my map it is now the most GOP-heavy based on 2008 numbers. This ought to please William Wampler, Jr., who represents this district.

Before – Dem average: 38.1%,  Obama: 33.2%

After – Dem average 37.1%, Obama 32.9%, Race: 94.2% W, 2.4% B, 2% H

VA-38 (Aquamarine or Light Blue) – DEM Incumbent, Likely DEM with Incumbent and Likely GOP otherwise

The Democratic representation in this district is a holdover from the days when coal unions still held more power and plenty of Southern and Appalachian Democrats were still consistent voters for the party. Phil Puckett, the incumbent here, took office in 198 and went unopposed in 2007. He ran unsuccessfully for the Lieutenant Governor’s nomination in 2005. As a conservative Democrat who Johnny Longtorso compared in his recent diary on the State Senate to Bobby Bright, Puckett is the only kind of Dem who can hold this district. Luckily, he’s only 63 and could probably hold this district for a while longer. I am confident that the day he retires, the district will fall into Republican hands. For that reason and the fact that there weren’t exactly many Democratic areas to extend the district into, I didn’t really alter the complexion of the district very much. We can see the 2008 shift in Appalachian voters in the numbers:

Before – Dem avg.: 46.5%, Obama: 39.8%

After – Dem avg.: 46.7%, Obama: 39.5%, Race: 93.7% W, 3.7% B, 1% H

VA-22 (Navy Blue) – GOP Incumbent, Safe GOP

This district was extended down into the southwest some while losing Radford, a town with college students in it and therefore more blue. However, everything else about this district is red except the color I gave it on the map. It incorporates the city of Salem which is famous for its appearance in the movie Borat where he’s at the rodeo and sings the national anthem incorrectly. Yeah, it’s a conservative area. Its northeastern edge contains half of Botetourt County, which is where the incumbent, Ralph K. Smith, lives. Hopefully, he lives in the western half of the county that’s still in this district.

Before – Dem avg.: 40.2%, Obama: 39.1%

After – Dem avg.: 39.7%, Obama: 37.9%, Race: 91.7%, 3.7% B, 1.7% H, 1.4% A

VA-21 (Chocolate) – DEM Incumbent, Lean/Likely DEM

Originally, I extended Phil Puckett’s district over to Radford to attempt to pick up more Dem voters. However, I realized that was something of a dummymander so instead I included Radford in the new VA-21 which joins the other college town of Blacksburg, where Virginia Tech is located, in the southern part of the district. The most important Dem source of votes is the city of Roanoke, which is entirely in this district, and is the largest city in western Virginia, and is where incumbent John Edwards lives.

Before – Dem avg.: 54.2%, Obama: 56.2%

After – Dem avg.: 54.7%, Obama: 57.4%, Race: 74% W, 15.9% B, 4.1% H, 3.7% A

VA-23 (Teal) – GOP Incumbent, Safe GOP

This district was mostly unaltered, though it became slightly more Democratic. However, it is still solidly red for incumbent Steve Newman. It’s home of Lynchburg, where Liberty University is, so I guess that’s appropriate.

Before – Dem avg.: 38.1%, Obama: 37%

After – Dem avg.: 40.9%, Obama: 39.3%, Race: 78.8% W, 15.7% B, 2.1% H, 1.4% A

VA-19 (Lime Green) – GOP Incumbent, Safe GOP

Fresh incumbent William Stanley took over this district after Robert Hurt defeated Congressman Tom Perriello in the 2010 election for the Virginia 5th Congressional District. However, the 19th has been greatly altered, losing all of Danville and part of Pittsylvania County while adding the rest of Campbell County and parts of Carroll, Floyd, Henry, and all of Patrick counties. What’s left is a redder district:

Before – Dem avg.: 41.3%, Obama: 41.6%

After – Dem avg.: 36.6%, Obama: 34.1%, Race: 85.2% W, 10.5% B, 2.2% H

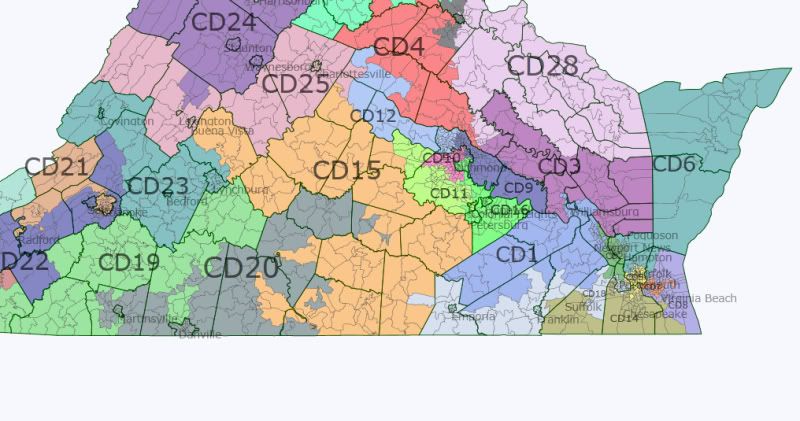
Sticking with the Southside area, we’ll move along the southern border of the state towards Richmond and the Tidewater. Here’s a picture of the area, and I will talk about districts 20 and 15:
Photobucket

VA-20 (Gray) – Dem Incumbent, Safe DEM with Incumbent, Lean DEM/Toss-up otherwise

Roscoe Reynolds has represented this district since winning a special election to replace then-Democrat and later everyone’s favorite “blame ‘Anchor babies’ for all of America’s problems” Congressman Virgil Goode. He’s a Blue Dog but not too far to the right. His district originally went over to the city of Galax and into SWVA. I have shifted it towards the center, grabbing many heavily African-American areas and the Dem-leaning city of Danville to join Reynold’s hometown Martinsville. Considering he won with over 60% of the vote in a district where Obama got 40%, I’m confident he can hold the bluer district I’ve built.

Before – Dem avg.: 42.5%, Obama: 40%

After – Dem avg.: 50.3%, Obama: 52.7%, 57.7% W, 37.2% B, 3% H

VA-15 (Gold) – GOP Incumbent, Safe GOP

VA-20 stole major blue areas from VA-15, and in the meantime, VA-15 became both redder and the largest district in the state. Incumbent Frank Ruff, who lives in Clarksville, right at both the border of Virginia and North Carolina and where the VA-15 meets VA-20, should be pleased with it.

Before – Dem avg.: 44.9%, Obama: 46.9%

After – Dem avg.: 43.2%, Obama: 45%, Race: 66.4% W, 29% B, 2.3% H

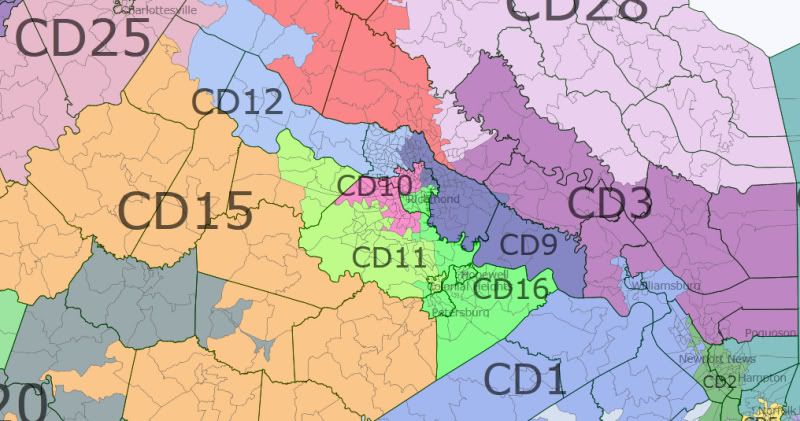
Continuing east, we will now discuss the Richmond area. We’ll discuss districts 12, 11, 10, 9, and 16. Here’s a map:
Photobucket

VA-12 (Light Blue) – GOP Incumbent, Safe GOP

This district used to contain a small part of Richmond but no more. The growth in Henrico County guaranteed that the district would have to shift boundaries and it has. Former GOP Majority Leader, Walter Stosch, represents this district, and while he’s getting up in years, I’m sure he’ll be fine with this district.

Before – Dem avg.: 41.4%, Obama: 45.2%

After – Dem avg.: 40.5%, Obama: 43.7%, Race: 72.8% W, 12.2% B, 4.3% H, 8.4% A

VA-11 (Chartreuse) – GOP Incumbent, Safe GOP

Outside of NoVA, few areas of the state had larger growth than Chesterfield County. This created an opportunity to shrink VA-10 to make it more Democratic while leaving VA-11 with most of the redder areas. VA-11 stretches into the GOP stronghold city of Colonial Heights and stretches into Powhatan County in the west to create one of the reddest districts on this new map.

Before – Dem avg.: 42.6%, Obama: 47.2%

After – Dem avg.: 35.8%, Obama: 38.5%, Race: 75% W, 15.5% B, 4.4% H, 2.8% A

VA-10 (Pink) – GOP Incumbent, Lean DEM, DEM PICK-UP +1

VA-10 was reduced in geographic scope more than any other district on the map from its original form as far as I can tell, becoming perhaps one-third of its previous size due to the large growth in Chesterfield County. By slightly increasing the parts of Richmond that are in the district and by putting all of the Dem-leaning areas of Chesterfield County in the district, I’ve created the first real Dem pick-up opportunity without drawing out the incumbent, John Watkins, who lives in Midlothian which remains in the district.

Before – Dem avg.: 41%, Obama: 43.2%

After – Dem avg.: 53.3%, Obama: 58.3%, Race: 63.4% W, 24.4% B, 6.7% H, 3.2% A

VA-9 (Navy Blue) – DEM Incumbent, Safe DEM

The first majority-minority district to discuss, VA-9 did not change much, holding onto a part of Richmond and all of Charles City County while only adding a small part of Henrico to leave the county in only two districts and a tiny part of New Kent County for population reasons. It remains a 50%+1 black district.

Before – Dem avg.: 73.3%, Obama: 78%

After – Dem avg.: 68.4%, Obama: 73.9%, 34% W, 56.4% B, 4.1% H, 2.6% A

VA-16 (Lime Green) – DEM Incumbent, Safe DEM

Another majority-minority district, the VA-16 incorporates parts of Richmond and Chesterfield County while having all of Prince George and African-American-heavy Petersburg and Hopewell.

Before – Dem avg.: 67.1%, Obama: 73.9%

After – Dem avg.: 62.4%, Obama: 70.5%, Race: 35.1% W, 51.7% B, 9.2% H, 1.6% A

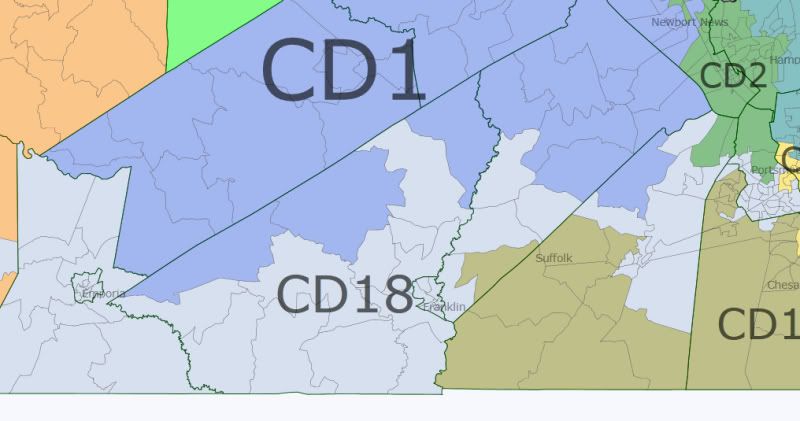
VA-18 (White, picture below) – DEM Incumbent, Safe DEM

Moving on to the Tidewater area, I’ll first give us a picture of the most gerrymandered district on this map, VA-18, which was drawn for VRA reasons originally. It has been slightly shifted east but remains an awkward construction whose sole purpose is to create a 50%+1 black district stretching from eastern Southside to Portsmouth in the Tidewater.
Photobucket

The statistics for VA-18:

Before – Dem avg.: 64.9%, Obama: 67.9%

After – Dem avg.: 61.6%, Obama: 65%, Race: 41.2% W, 52.4% B, 2.8% H, 1.2% A

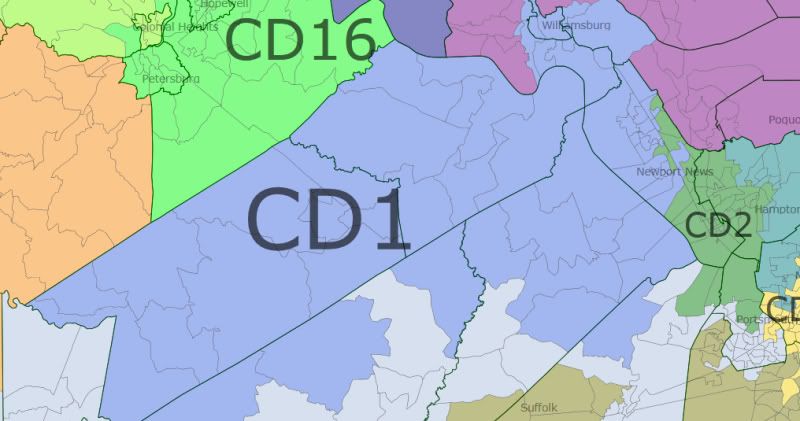
VA-1 (Royal Blue, picture below) – DEM Incumbent, Lean DEM

Right above VA-18 is VA-1, which used to include the city of Poqouson to the east along with Newport News and parts of Hampton. Now it runs down into where VA-13 used to be (I’ll get that to that momentarily), taking in sections of Southampton and Isle of Wight counties and all of Surry and Sussex. At the same time, it stretches up to take in the college town of Williamsburg and the Dem-leaning areas right around it in James City County and southern York County. As incumbent John Miller lives in Newport News, most of the city is located in VA-1 but the part of Hampton that was in it has been removed.
Photobucket

As I said a moment ago, VA-13 was once located in this area, running from Hopewell, through Suffolk and into part of Portsmouth. However, NoVA clearly needed another district somewhere and this seemed like an appropriate district to ax as its incumbent is 75-year old Fred Quayle, who while powerful, could easily be close to retirement. He apparently teaches at Old Dominion University and could be coaxed into spending his time doing that for his remaining years. Remember, the Dems get to draw this map, and doing it this way certainly helps Miller, whose district had a GOP-majority average.

Before – Dem avg.: 43.8%, Obama: 47.1%

After – Dem avg.: 50.7%, Obama 55.7%, Race: 57.1% W, 30.4% B, 6.3% H, 2.8% A

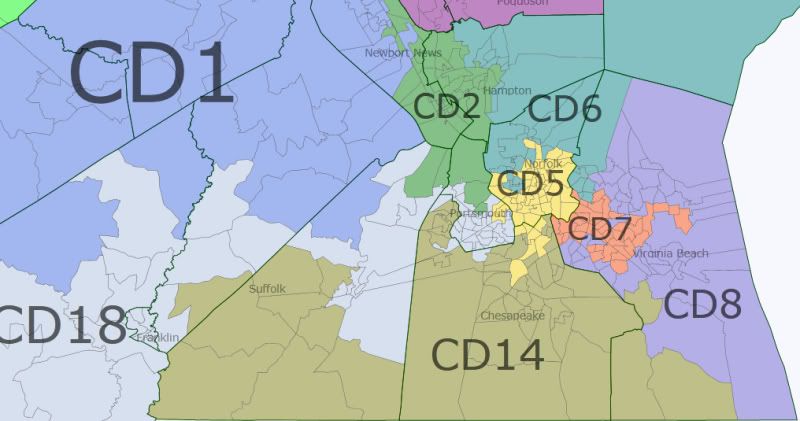
Now, for the rest of the Tidewater districts. We’ll cover districts 2, 5, 6, 7, 8, and 14 here:
Photobucket

And a further zoom in:

Photobucket

VA-2 (Green) – DEM Incumbent, Safe DEM

VA-2 is home to incumbent Mamie Locke, who lives in Hampton, and the district is another majority-minority one. This district was not greatly altered from its original form, just picking up some GOP and less-blue parts of Newport News to help out VA-1.

Before – Dem avg.: 68.3%, Obama: 73.7%

After – Dem avg.: 64.6%, Obama: 69.8%, Race: 38.2% W, 51.2% B, 4.9% H, 2.2% A

VA-5 (Yellow) – DEM Incumbent, Safe DEM

Another majority-minority district, VA-5 is represented by Yvonne Miller of Norfolk, who ranks 4th overall in seniority in the Senate, and chairs the Transportation committee. Needless to say, her district is very safe. While it originally included a small part of Virginia Beach, it instead has part of Portsmouth now to accompany its sections in Norfolk and Chesapeake, where it dips down to take in the heavily African-American areas of that city.

Before – Dem avg.: 72.3%, Obama: 77.4%

After – Dem avg.: 70.7%, Obama: 75.5, Race: 37.1% W, 51.1% B, 5.7% H, 2.9% A

VA-6 (Teal) – DEM Incumbent, Lean DEM

Another swing district that needed to be aided. Originally, VA-6, which includes the entire Eastern Shore, crossed the Chesapeake Bay and included Mathews County (now in VA-3) while also jutting down into Norfolk, where incumbent Ralph Northam lives, and Virginia Beach. However, the district has been shifted to remove the very red Mathews Co., and now incorporates the eastern half of Hampton city while removing some redder areas of Norfolk from it. Hopefully, Northam lives in the part of Norfolk in the district. If not, it could be altered slightly without affecting its numbers much to do so.

Before – Dem avg.: 50.5%, Obama: 53.5%

After – Dem avg.: 53.8%, Obama: 57.7%, Race: 55.7% W, 30.6% B, 7.4% H, 2.8% A

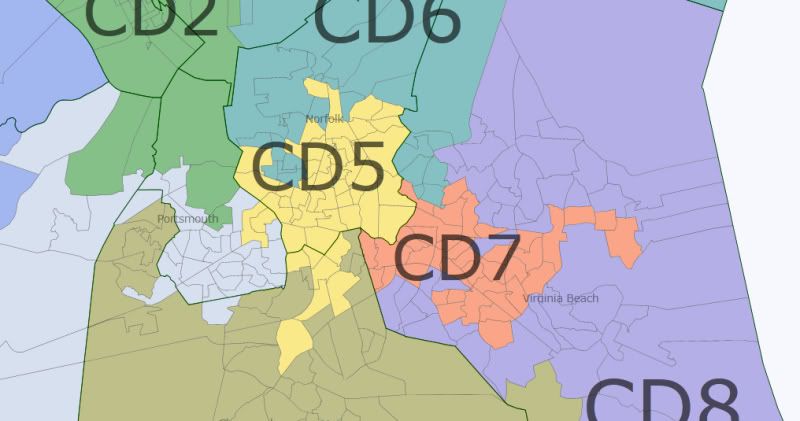
VA-7 (Orange) – GOP Incumbent, Lean DEM/Toss-up, DEM PICK-UP +1

Drawn to include only Virginia Beach still, this district has been designed to take in all the Dem-leaning and Dem-heavy parts of the biggest city in Virginia. In doing this, the diverse district has become a toss-up or possible Democratic pick-up, and given the shifting demographics here, it should continue moving in a blue direction. It’s not clear if the incumbent, Frank Wagner, lives in this part of Virginia Beach, but I’m going to guess he does.

Before – Dem avg.: 46.3%, Obama: 49.6%

After – Dem avg.: 51.4%, Obama: 56.4%, Race: 55.5% W, 24.6% B, 7.9% H, 7.7% A

VA-8 (Slate Blue) – GOP Incumbent, Safe GOP

VA-8 takes up most of the rest of Virginia Beach, particularly the wealthiest areas and the areas to the east, south, and southwest of the Naval Air Station Oceana with a large military presence.

Before – Dem avg.: 42.7%, Obama: 44.5%

After – Dem avg.: 41%, Obama: 40.7%, Race: 76.5% W, 10.3% B, 5.1% H, 5% A

VA-14 (Olive Green) – GOP Incumbent, Safe GOP

This district stretches into the edge of Virginia Beach, contains almost all of Chesapeake as well as the southern half of Suffolk, and a little part of Isle of Wight County. It is possible that if the aforementioned Fred Quayle wants to run again, he could move a little south from where (I’m assuming based on the old VA-13 and Wikipedia) he lives in upper Suffolk down into VA-14 and challenge incumbent Harry Blevins. It’s possible that VA-14 could be drawn to include both, forcing a primary.

Before – Dem avg.: 40.7%, Obama: 41.9%

After – Dem avg.: 40.1%, Obama: 39.7%, Race: 69.9% W, 20.2% B, 4.1% H, 2.9% A

Moving north in the direction of the Northern Neck region, we have VA-3 and 28.

Photobucket

VA-3 (Purple) – GOP Incumbent, Safe GOP

Home to Minority Leader Tommy Norment, this district clearly had to protected in a sense, and definitely needed to include his home in James City County. Most of the county is still in this district so hopefully he doesn’t live right next to Williamsburg. By stealing Williamsburg and the rest of Newport News for VA-1, the district had to move north. At the same time, by way of water contiguity I was able to include the incredibly red city of Poqouson in the district as well, helping out VA-1 as well.

Before – Dem avg.: 44.6%, Obama: 46.4%

After – Dem avg.: 36.5%, Obama: 35.6%, Race: 81.9% W, 10% B, 3% H, 2.4% A

VA-28 (White) – GOP Incumbent, Safe GOP

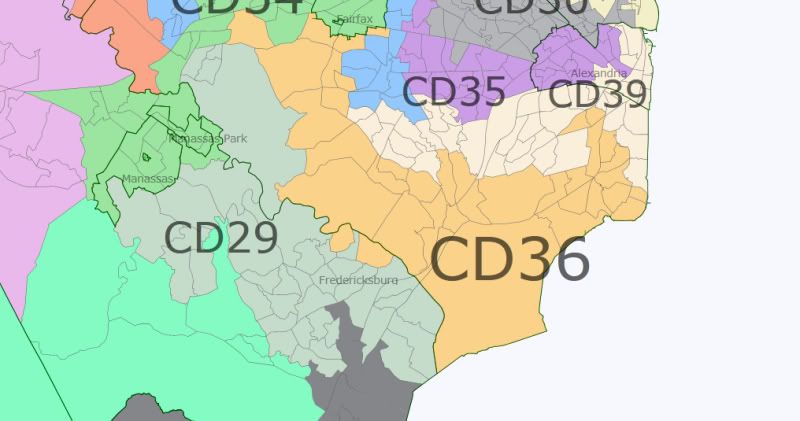
You can see on other maps on here that VA-28 stretches up around Fredericksburg into Stafford and Spotsylvania Counties. However, most of the district covers the rest of the Northern Neck area. While not unbelievably red, it would take a conservative Democrat to have a chance here.

Before – Dem avg.: 43.2%, Obama: 46.1%

After – Dem avg.: 42.3%, Obama: 44.3%, Race: 71.2% W, 21.2% B, 4% H, 1.2% A

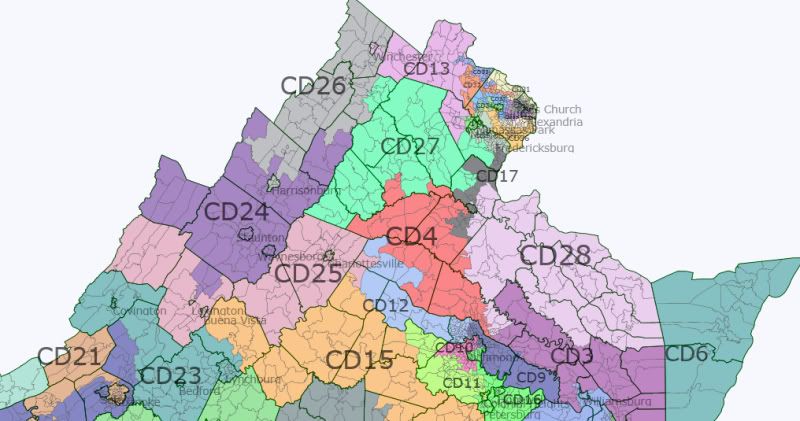
The rest of the area above Southside and moving towards NoVA needs to be covered – districts 24, 25, 26, 27, 4, and 13-so here’s a picture:
Photobucket

VA-24 (Purple) – GOP Incumbent, Safe GOP

Bland, conservative district where part of my family is from, represented by Emmett Hanger. He’s a staunch conservative but willing enough to talk to the other side that he faced a major primary challenge in 2007, holding on in a close one.

Before – Dem avg.: 36.4%, Obama: 37.7%

After – Dem avg.: 33.6%, Obama: 35.1%, Race: 89.9% W, 4.7% B, 3.3% H

VA-25 (Pink) – DEM Incumbent, Likely DEM

The district of failed 2009 gubernatorial candidate Creigh Deeds, the district has been altered slightly to keep Deeds’ home of Bath County in the western part but loses trending-red Alleghany and Covington city within it. Lexington has been added from VA-24 with its college population, and the district now fully encompasses Albemarle County, which is generally trending blue, and of course the best little city on Earth, Charlottesville (UVA graduate so I’m biased).

Before – Dem avg.: 56.9%, Obama: 59.3%

After – Dem avg.: 56.7%, Obama: 59.5%, Race: 77.8% W, 11.4% B, 4.5% H, 3.9% A

VA-26 (Gray) – GOP Incumbent, Safe GOP

The only notable thing about this district is that it had to keep Harrisonburg to appease incumbent Mark Obenshain. I’m from Harrisonburg originally and it is painful to be have my hometown represented by one of the probably two most conservative members of the Senate. If you’re a Republican and you want a crazy bill to be sponsored, call up Mr. Obenshain. He’s a nice guy but definitely not politically desirable in any way.

Before – Dem avg.: 37.6%, Obama: 41.5%

After – Dem avg.: 36.8%, Obama: 40.7%, Race: 85% W, 3.6% B, 8.1% H, 1.5% A

VA-27 (Spring Green) – GOP Incumbent, Safe GOP

Another fairly solid GOP district that dips into part of Prince William County to take in some of the red areas still on the outer part of that county in NoVA.

Before – Dem avg.: 41.1%, Obama: 43.3%

After – Dem avg.: 39.9%, Obama: 42.2%, Race: 81.1% W, 9% B, 5.6% H, 1.7% A

VA-4 (Red) – GOP Incumbent, Safe GOP

And yet another solid GOP district.

Before – Dem avg.: 38.3%, Obama: 39.8%

After – Dem avg.: 38.7%, Obama: 40.7%, Race: 78.3% W, 12.9% B, 4.9% H, 1.4% A

VA-13 (Purplish Pink) – Open Seat, Likely GOP (for now)

Having more or less seen a doubling of its total population in the last ten years, Loudon County presents a great challenge to redistricting. The eastern half of the county is more liberal and more urban, and is where most of the growth has occurred. However, growth has happened everywhere in the county to some degree, with the western and northern parts of the county still more GOP-flavored. Interestingly, the southwest and middle of the southern part of the county are bluer. Anyway, by getting rid of VA-13 in the Tidewater, I was able to create a new district in NoVA that stretches from Loudon and Prince William Counties over to Winchester at the top of the Shenandoah Valley. While this district is currently more Republican, it is possible that continued growth in Loudon could make the district more and more competitive. It is my hope that the district will eventually become a swing district where the Dems can make a play; in a sense, it is something of an anti-dummymander.

Before – old district in the Tidewater

After – Dem avg.: 43.5%, Obama: 46.5%, Race: 73.2% W, 7.9% B, 9.1% H, 6.7% A

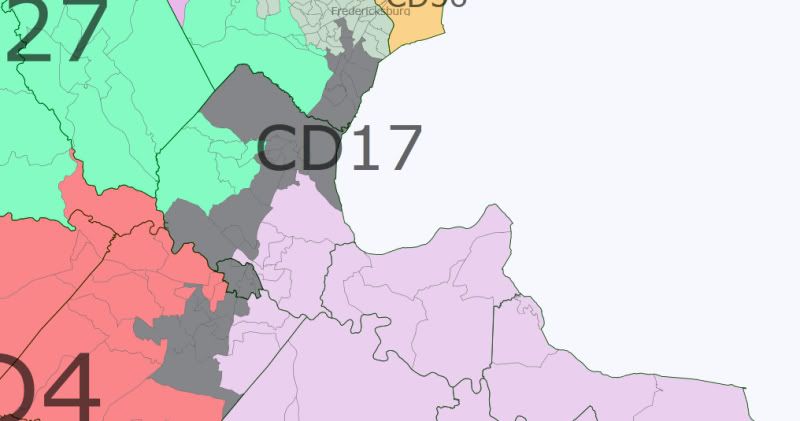
Before moving into NoVA directly, we need to cover VA-17:
Photobucket

VA-17 (Black) – DEM Incumbent, Safe DEM (considering he has been in office awhile)

This district may not be realistic because of its narrowness. However, the current VA-17 has a Democratic incumbent, Edd Houck, in a fairly red district who needs to have much better numbers. Thus, the new district includes all of Fredericksburg now, and stretches from its bottom in Spotsylvania, VA (where Houck lives), to its top in Prince William County. This drastically alters the old district Houck was in, which President Obama lost by 10 points and was 75% white or so, to a new one that is not far away from being simply white-plurality and Obama won by 13 points.

Before – Dem avg.: 42.5%, Obama: 45.5%

After – Dem avg.: 51%, Obama: 56.5%, Race: 55.1% W, 24.2% B, 12.5% H, 4.2% A

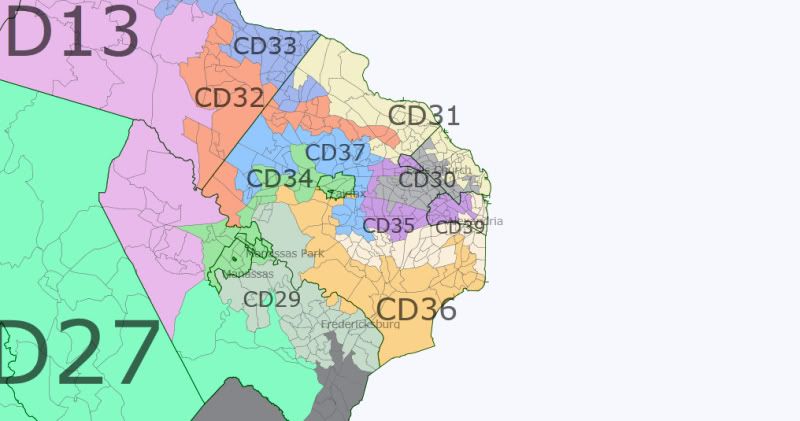
Northern Virginia is the last task at hand. Currently, every district in this region is held by a Democrat, so the project is very much to shore up some districts.
Photobucket

The southern half of NoVA:

Photobucket

The northern half of NoVA:

Photobucket

VA-29 (Sea Green) – DEM Incumbent/Possibly Open, Lean/Likely DEM

Chuck Colgan, the incumbent, is the Senate Pro Tempore, and is 84 years old. He wanted to retire before the 2007 election but Governor Tim Kaine coaxed him to hang around. It seems likely that he is waiting to see what his district looks like before announcing his retirement. Via Johnny Longtorso, the former mayor of Manassas, a popular Republican, is probably waiting for him to retire. Given this information, I have redrawn VA-29, which had way too many people due to the explosive growth in Prince William County, to avoid keeping Manassas and Manassas Park. It may be a stretch (mainly because of what VA-34 looks like) but I thought I would give it a shot. By the way, this district becomes a majority-minority district with a white plurality.

Before – Dem avg.: 46.7%, Obama: 52.4%

After – Dem avg.: 51.2%, Obama: 58%, Race: 47% W, 19.4% B, 21.7% H, 8% A

VA-30 (Gray) – Open, Safe DEM

Given that incumbent Patsy Ticer has announced that she will not run for another term, this district ought to see heavy competition for the Democratic nod considering it is essentially a sure-thing for Democrats. So really, you could draw this district in a variety of ways because she’s out. I drew it to not include Alexandria, which it had before, and to only include Arlington and Fairfax Counties. It also remains a slightly minority-majority district with a white plurality.

Before – Dem avg.: 67.7%, Obama: 69.5%

After – Dem avg.: 65.8%, Obama: 66.9%, Race: 49.7% W, 9.5% B, 24.6% H, 13.2% A

VA-31 (Khaki) – DEM Incumbent, Safe DEM

Another relative given for the Democrats, I drew Falls Church out of this district, which makes it less Democratic but still pretty solidly blue.

Before – Dem avg.: 68.4%, Obama: 68.8%

After – Dem avg.: 61.2%, Obama: 62.1%, Race: 70.2% W, 4.6% B, 9% H, 13% A

VA-32 (Orange Red) – DEM Incumbent, Likely DEM

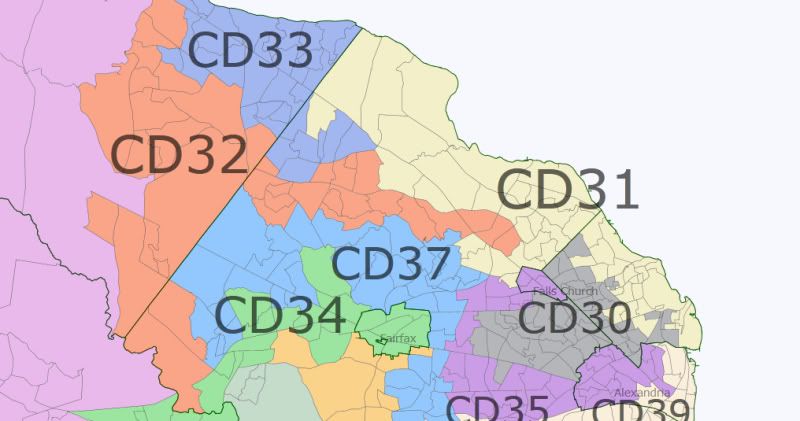
This district snakes into Fairfax to pick up some bluer areas closer to Arlington while taking up part of Loudon County. It’s possible that this district would need to be redrawn because I have no clue where in Fairfax incumbent Janet Howell lives. Then again, a couple could probably switch districts.

Before – Dem avg.: 57.1%, Obama: 60.2%

After – Dem avg.: 54.3%, Obama: 58.7%, Race: 55.4% W, 7.8% B, 10.2% H, 22.8% A

VA-33 (Royal Blue) – DEM Incumbent, Likely DEM

With its new shape, this district becomes more solidly blue, shoring up incumbent Mark Herring’s position.

Before – Dem avg.: 49.6%, Obama: 55.4%

After – Dem avg.: 51.3%, Obama: 57.2%, Race: 57.2% W, 7.8% B, 18.6% H, 13% A

VA-34 (Green) – DEM Incumbent, Likely DEM

Chap Petersen, who represents this district, is probably one of the most well-known State Senators in Virginia and is probably bound for higher office some day. He lives in Fairfax City, and this district has been drawn to take that in and snake out to pick up the cities of Manassas and Manassas City. In the process, it becomes a majority-minority district with a white plurality.

Before – Dem avg.: 54.4%, Obama: 57.4%

After – Dem avg.: 51.6%, Obama: 58.5%, Race: 47.9% W, 10.5% B, 22.6% H, 15.5% A

VA-35 (Purple) – DEM Incumbent, Safe DEM

Senate Majority Leader Dick Saslaw occupies this seat, meaning that it will probably stay very blue. It stretches from the western part of Alexandria around the VA-30 to take in Falls Church, remaining a majority-minority district with a white plurality.

Before – Dem avg.: 61.8%, Obama: 65.3%

After – Dem avg.: 63.6%, Obama: 66.9%, Race: 46.8% W, 15.4% B, 20.1% H, 14.5% A

VA-36 (Gold) – DEM Incumbent, Likely DEM

This district loses Dem-heavy areas to VA-17 and VA-39, but is still pretty solidly blue.

Before – Dem avg.: 57.8%, Obama: 63.9%

After – Dem avg.: 53.9%, Obama: 58.5%, Race: 51.6% W, 16.4% B, 16.5% H, 11.8% A

VA-37 (Dodger Blue) – DEM Incumbent, Leans/Likely DEM

This district winds around Fairfax, from Burke (where just-elected-in-a-special-election incumbent Dave Marsden lives), to part of Centreville, making it bluer.

Before – Dem avg.: 51.3%, Obama: 56.2%

After – Dem avg.: 53.6%, Obama: 57.1%, Race: 60.3% W, 5% B, 12.1% H, 19.2% A

VA-39 (White) – DEM Incumbent, Safe DEM

Incumbent George Barker only won in 2007 in his first race by 151 votes so making his district bluer was very important. In the process, given its original position, it became much bluer, mainly due to taking parts of VA-36.

Before – Dem avg.: 51.8%, Obama: 55.9%

After – Dem avg.: 58.9%, Obama: 61.5%, Race: 59.8% W, 11.9% B, 13.9% H, 11.2% A

And there it is, folks. Hopefully the Democrats can pick up VA-7 and VA-10 to take two extra seats in this set up to increase their majority to 24-16. And in the long run, knowing that eventually VA-38 will be lost to the GOP, it’s nice that VA-13 is hopefully going to continue trending towards being very much a toss-up district.

Democratic Indiana Redistricting

Since the GOP controls redistricting in Indiana, it seems likely that Democrats will be forced down to two congressional districts in the new plan for the state (fortunately, Mitch Daniels seems like he won’t do anything too crazy with redistricting, so we’re unlikely to see any Indy-to-Gary Democratic vote dumps). This is what a hypothetical Democratic map of Indiana would look like.


1st District (blue): Safe D

Basically the same as it is now.

2nd District (green): Safe D

Takes in the Democratic parts of Fort Wayne and loses some of the more conservative parts of the current district. I believe it should be safely democratic now.

3rd District (purple): Safe R

All the Republican parts of Northern Indiana.

4th District (red): Safe R

Indy suburbs. These areas showed some of the strongest swings towards Obama in 2008 of anywhere in the state, meaning that they might becoming competitive in the future, but for now this is deep red country.

5th District (yellow): Safe R

6th District (teal): Safe R

This was once Democratic territory, but it has trended Republican to the point where I don’t see it being competitive for any Democrat.

7th District (gray): Safe D

Gets a couple points more Republican in order to help the 8th, but still safe for Andre Carson.

8th District (slate blue): Likely D

This district includes liberal Bloomington, Democratic leaning Delaware and Madison counties, and some African-American parts of eastern Marion county. The non-Marion parts of the district voted 57% for Obama, and the precincts in Marion county (about 100K people) are 70-80% Democratic, so overall it should have a pretty strong Democratic lean. Still, it might be competitive in a great Republican year (Dan Coats narrowly won here, I believe).

9th District (light blue): Tossup/Lean D?

This district voted 52% for Obama, which would normally make it a tossup district. However, this is an area where conservative Democrats do very well, which is why this may be a Lean D district in practice. If Brad Ellsworth were to run here again I suspect he would win pretty easily.

Illinois Democratic Gerrymander 12-6 – Updated

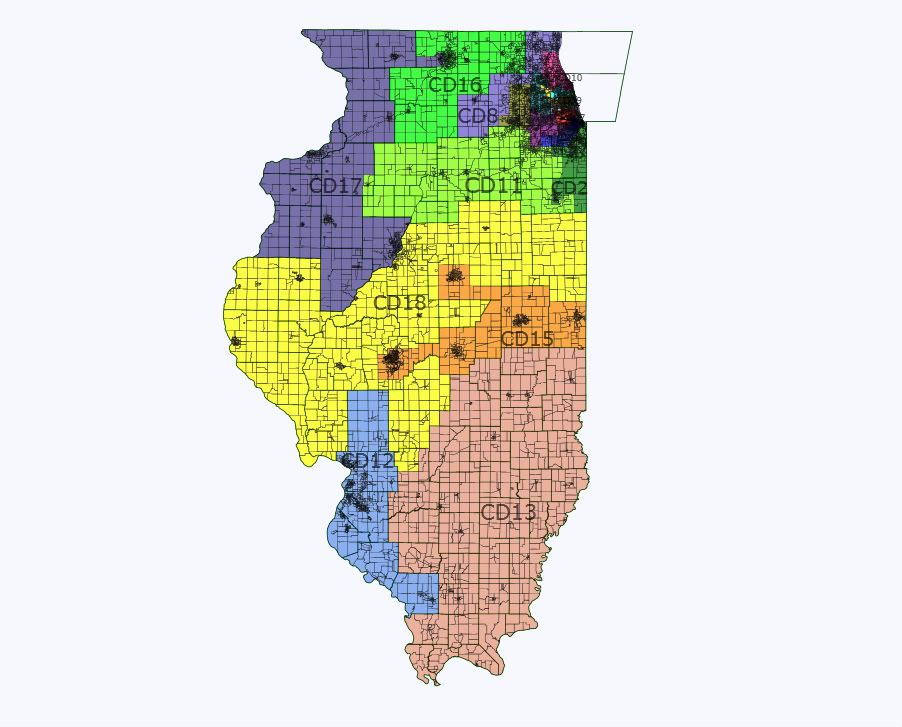
Illinois is losing one congressional district this year – going from 19 to 18.  I have created a map that takes the current map with a delegation of 11 Republicans and 8 Democrats to one with 12 Democratic seats and 6 Republican ones.  I consider this an ambitious gerrymander favoring the Democrats, but one that is realistic and keeps a few things in mind:

1.) Michael Madigan is in charge and he will look out for his interests first.  He also will never do a dummymander.

2.) The Democratic incumbents also have input and their interests will be considered.  None of them will want their district lines to change much and all want their Democratic primary bases to be kept intact.  They also don’t want to be thrown from safe seats to possibly competitive ones.

3.) African Americans will insist on maintaining their three black majority districts, no matter how much population they have lost in the city.  The Hispanics will want at least one – two may be forced by the courts – but Madigan and his allies will likely push for one Hispanic district to maintain Lipinski’s seat.  Also, we have seen in the City of Chicago that Hispanic majority seats often go to white incumbents who control the Democratic machine.  Alderman Ed Burke’s 14th ward is 88% Hispanic, Madigan’s 13th ward is 72% Hispanic and just elected somebody named “Marty Quinn” to be Alderman.  

4.) Madigan will go after Freshman GOP before those with more seniority.  Not only are they easier targets, but having seniority on both sides of the aisle is good for Illinois.

Below is each new district with data and analysis.  I have calculated the results from the 2010 Senate race (Kirk v. Giannoulias) and from the 2004 Presidential race (Bush v. Kerry – I know, old).  I used the 2010 Senate race rather than the Governor’s race because it is on the Federal level, and to use data against moderate Republican.  I did not calculate data from the 2008 election, because Obama’s landslide was far too big  and unevenly distributed in Illinois (I feel Chicagoland was much more skewed than Downstate).  The 2010 numbers are exact (to the precinct) except for Tazewell, Marion, Moultrie, and Menard Counties, which I allocated votes by ratio of population in each district.  The same goes for 2004 numbers, except I had to extrapolate the precinct data for Lake and Will counties from 2010 data.

For now, here are three tables with election data, racial population data, and VAP data.  I will add more analysis in the next few days.


District  Kirk   Alexi    Bush   Kerry    PVI

1        24.80% 75.20% 23.00% 77.00% D+30

2        25.26% 74.74% 26.39% 73.61% D+28

3        48.14% 51.86% 44.25% 55.75% D+8

4        26.57% 73.43% 26.90% 73.10% D+28

5        47.72% 52.28% 41.53% 58.47% D+10

6        63.33% 36.67% 57.66% 42.34% R+6

7        18.61% 81.39% 15.81% 84.19% D+37

8        53.71% 46.29% 46.66% 53.34% D+4

9        47.77% 52.23% 39.12% 60.88% D+11

10       47.75% 52.25% 39.70% 60.30% D+11

11       68.75% 31.25% 60.55% 39.45% R+10

12       53.24% 46.76% 47.02% 52.98% D+4

13       49.12% 50.88% 45.12% 54.88% D+7

14       64.94% 35.06% 59.55% 40.45% R+8

15       68.33% 31.67% 59.68% 40.32% R+10

16       67.03% 32.97% 57.86% 42.14% R+8

17       56.61% 43.39% 46.84% 53.16% D+3

18       68.31% 31.69% 60.39% 39.61% R+10

ALL

District  White  Black  Hispanic  Asian

1        35.5%   52.7%   8.2%   2.0%

2        31.4%   52.8%   13.4%   0.8%

3        59.5%   6.1%   27.7%   5.4%

4        18.7%   4.1%   73.3%   2.9%

5        65.1%   2.2%   24.4%   6.7%

6        75.4%   3.7%   8.8%   10.3%

7        27.6%   54.5%   12.2%   4.1%

8        48.6%   8.7%   31.5%   9.1%

9        67.4%   7.8%   10.6%   12.0%

10       72.2%   3.4%   10.9%   11.5%

11       92.7%   3.2%   2.0%   0.8%

12       77.5%   16.6%   2.8%   1.1%

13       53.0%   12.7%   27.3%   5.0%

14       82.5%   1.6%   11.4%   3.2%

15       85.4%   6.8%   3.1%   2.9%

16       88.6%   2.6%   6.3%   1.1%

17       77.9%   12.4%   5.8%   1.5%

18       86.7%   5.4%   4.8%   1.6%

VAP

District  White  Black  Hispanic  Asian

1        38.0%   51.7%   6.9%   2.2%

2        34.5%   51.8%   11.7%   0.8%

3        64.0%   5.9%   23.5%   5.7%

4        23.2%   4.1%   68.3%   3.4%

5        69.1%   2.0%   20.9%   6.8%

6        77.7%   3.5%   7.5%   10.2%

7        31.1%   51.8%   11.0%   4.8%

8        54.1%   8.1%   26.9%   9.4%

9        69.2%   7.8%   9.3%   12.1%

10       74.7%   3.3%   9.3%   11.2%

11       93.5%   3.2%   1.7%   0.8%

12       80.0%   15.3%   2.4%   1.1%

13       58.3%   12.1%   23.4%   5.0%

14       85.3%   1.4%   9.4%   3.1%

15       86.7%   6.2%   2.7%   3.2%

16       90.8%   2.4%   4.9%   1.1%

17       81.7%   10.8%   4.6%   1.5%

18       88.7%   5.1%   3.8%   1.5%

Illinois Statewide

Illinois Statewide 2

Northeast Illinois

Northeast Illinois

Northern Chicagoland

Southern Chicagoland

Central Chicago

Central Illinois

Springfield and Decatur

Southern Illinois