Arkansas Redistricting: Can It Be Done?

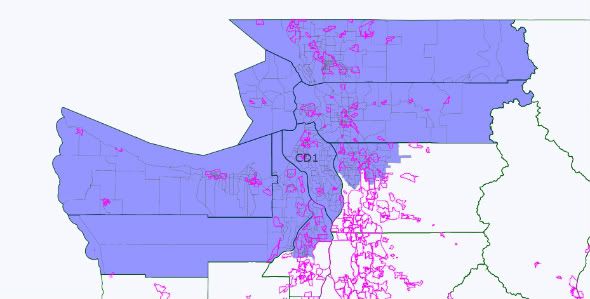
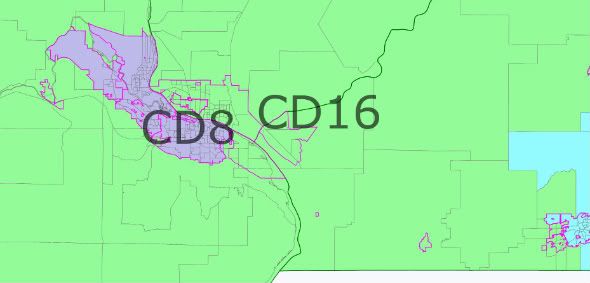
There has evidently been some discussion of drawing a minority-majority district in Arkansas to give the Democrats a buffer against an 0-4 Republican sweep.

My criteria for making this map was:

1. There must be a minority-majority district, no matter how hideous.

2. Rep. Ross must have a district he could potentially retain.

3. Rep. Griffin cannot be allowed to have a safe district to himself.

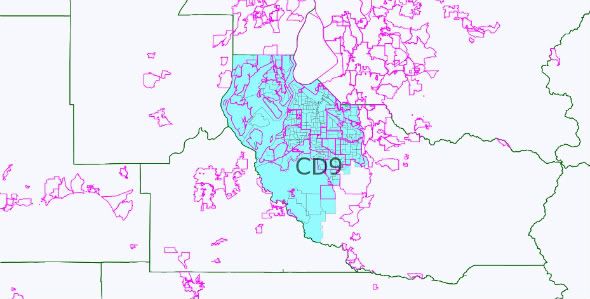
I’m not going to go district-by-district, mostly because I’m already up past my bedtime. But we have an open seat here, and it’s something new and blue. It’s also 49% white, 44% black, and although it goes up to majority-white when you VAP it, most Democratic primary voters will probably be black, and it’s diverse enough to be a solid Democratic district.

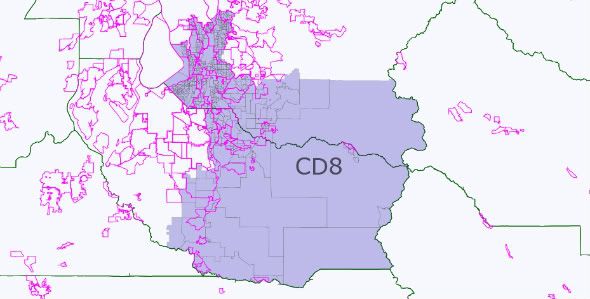
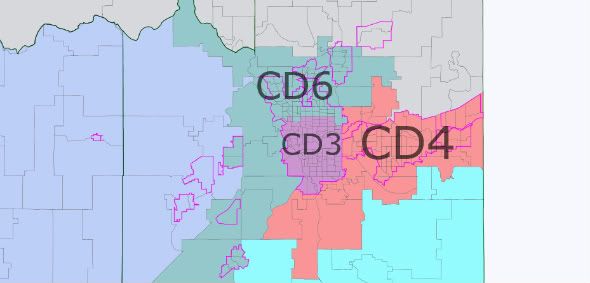
As for Ross and Griffin, they get to square off over my hideous reincarnation of AR-04, which includes a hefty portion of Pulaski County and has a PVI probably not too far off the current R+7 version. But I’m just eyeballing it, and I’ve never even been to Arkansas, so someone should correct me if I’m wrong.

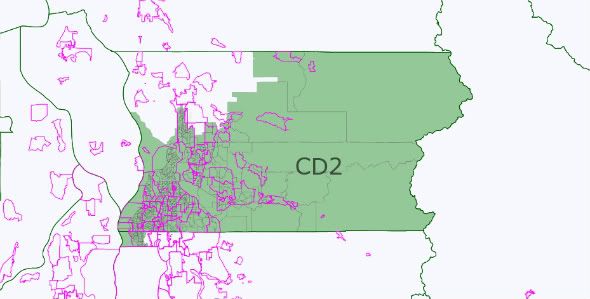
Rep. Womack gets to sit pretty in AR-03, and Rep. Crawford should be quite comfortable in AR-02, a.k.a. the Jolly Green Giant.

CT, OH, and PA: Population by CD

Today is the flipside of yesterday’s California release: states with stagnant populations and a bunch of old white people. We’ll start with Connecticut, which is certainly characterized by stability: it easily retained five seats, not being particularly near either the cusp of gaining or losing, and even its five districts are pretty close to in balance with each other. Its target is 714,819, up from 681K in 2000.


District Population Deviation
CT-01 710,951 (3,868)
CT-02 729,771 14,952
CT-03 712,339 (2,480)
CT-04 706,740 (8,079)
CT-05 714,296 (523)
Total: 3,574,097

Ohio is one of only a couple states to lose two seats, taking it from 18 down to 16. Its new target is 721,032, up from about 631K in 2000. The state as a whole didn’t lose population (gaining 183,364), but seven of its districts did (the 1st, 5th, 6th, 9th, 10th, 11th, and 17th). The Columbus area was the only part of the state that seemed to experience robust growth; in fact, despite the state losing two seats, the 12th (a swing district held by GOPer Pat Tiberi) will actually need to shed population… much of the state’s growth is accounted for in the growth in the 12th.

The numbers today don’t really change the overall redistricting equation: one of the northeastern Ohio Democrats is clearly going to have to go, and while the Akron-area 13th (held by Betty Sutton) actually gained some population unlike its neighbors, it may be the one that gets dissected simply by virtue of being in the very middle (with the 9th pressuring it from the west, the 10th and 11th from the north, and the 17th from the east). As for which GOPer gets cut, I’d expected it to be one of Bill Johnson (in the 6th) or Bob Gibbs (in the 18th), but the 18th, despite its mostly rural, Appalachian flavor, seemed to hang in there better than expected, population-wise. Now I’m wondering if Bob Latta’s 5th in the rural northwest, which is going to be pressured by the 9th to its north and the 4th to its east, may be a more natural target. Or here’s another possibility (made likelier by the possibility that the local GOP might like rid themselves of a liability in the form of Jean Schmidt): the 2nd might be targeted, despite its decent numbers, as both the 1st to its west and the 6th to its east need to gain a ton of people (and extending the 1st east into red, suburban Clermont County would make GOPer Steve Chabot’s life easier).


District Population Deviation
OH-01 598,699 (122,333)
OH-02 673,873 (47,159)
OH-03 640,899 (80,133)
OH-04 632,771 (88,261)
OH-05 627,799 (93,233)
OH-06 623,742 (97,290)
OH-07 683,371 (37,661)
OH-08 663,644 (57,388)
OH-09 619,010 (102,022)
OH-10 599,205 (121,827)
OH-11 540,432 (180,600)
OH-12 756,303 35,271
OH-13 649,102 (71,930)
OH-14 648,128 (72,904)
OH-15 681,557 (39,475)
OH-16 644,691 (76,341)
OH-17 600,111 (120,921)
OH-18 653,167 (67,865)
Total: 11,536,504

Pennsylvania’s target is 705,688 based on the drop from 19 to 18 seats, up from about 646K in 2000. The 2nd, 3rd, 12th, and 14th all lost population. I’d really recommend looking at the Census Bureau’s interactive map of Pennsylvania, as it shows exactly what’s going on: the eastern half of the state gained a bit, while nearly every county in the state’s western half outright lost population. In fact, there were enough gains in the east that four districts wind up needing to shed population: the 6th and 15th in the Philadelphia suburbs/exurbs, and the more rural, Pennsylvania Dutch-flavored 16th and 19th. These are all Republican-held districts, but these are all districts that moved sharply in the Dem direction from 2004 to 2008, while on the other hand, the shrinking western districts are Democratic areas but ones where the overall trend has been away from the Dems. (Interestingly, two cities that over recent decades came to symbolize dead northeastern industrial centers, Allentown and Reading, are actually rebounding, gaining around 10,000 people each and helping to grow the 15th and 16th respectively. Much of the growth in those two cities, though, as well as the small growth experienced in Philadelphia, is Hispanic.)

With the GOP in control of the redistricting process in Pennsylvania and the population losses heavily concentrated in the Pittsburgh area, it looks like the axe is going to fall heavily on fairly-new Dem Mark Critz in the odd-shaped 12th, which was designed to be a friendly district for John Murtha cobbling together Cambria County with the Dem-friendly parts of Pittsburgh’s collar counties but is barely holding onto its Dem roots these days. Mike Doyle’s 14th (in Pittsburgh proper), despite being the biggest population loser, is probably going to stay intact, as Republicans will need to concede at least one blue vote sink in the southwest (and probably get bluer, as it’ll need to expand into the dead steel towns of the Mon Valley to its south, currently the bluest part of the 12th).

If Critz wants to stick around, he’s likely to find himself either fighting Jason Altmire in a primary in the 4th or Tim Murphy in a general in the 18th (although Critz has enough of a Johnstown-area base that he might be able to pull out an upset in whatever district Johnstown winds up in, unless the GOP decides that the 9th, in the central part of the state, is red enough to safely absorb Johnstown).


District Population Deviation
PA-01 655,146 (50,542)
PA-02 630,277 (75,411)
PA-03 640,356 (65,332)
PA-04 647,418 (58,270)
PA-05 651,762 (53,926)
PA-06 726,465 20,777
PA-07 673,623 (32,065)
PA-08 672,685 (33,003)
PA-09 666,810 (38,878)
PA-10 669,257 (36,431)
PA-11 687,860 (17,828)
PA-12 612,384 (93,304)
PA-13 674,188 (31,500)
PA-14 584,493 (121,195)
PA-15 721,828 16,140
PA-16 723,977 18,289
PA-17 681,835 (23,853)
PA-18 653,385 (52,303)
PA-19 728,630 22,942
Total: 12,702,379

CA: Population by CD

The crown jewel of the 2010 Census is out: California. The nation’s largest state is, well, even larger than before, at 37,253,956, up from 33,871,648. Divide that out among 53 districts (it was the first time in ages that California didn’t gain a House seat, despite gaining more than 3 million residents… it gained at a rate close to the country as a whole), and you have a target of 702,905, which is up from about 639K in 2000.

It may not come as a surprise, but much of the state’s growth is Hispanic. Since 2000, the state’s Hispanic population grew 27.8%, while the state’s non-Hispanic population was almost stagnant, growing only 1.5%. (The Asian population grew 31.5%, but that’s a fairly small subset of the overall population.) In 2000, California was 46.7% non-Hispanic white and 32.4% Hispanic, but in 2010, it had drawn much closer: 40.1% non-Hispanic white and 37.6% Hispanic.

Looking at the table, you’ll notice that a large number of districts have moved from white pluralities to Hispanic pluralities over the last ten years: the Democratic-controlled 17th, 23rd, and 27th, and the Republican-controlled 21st, 44th, and 45th. (The latter two were also the state’s two fastest growing districts, both in Riverside County to the east of Los Angeles.) Two more GOP-held seats in the greater Los Angeles area are also dancing close to the edge of a Hispanic plurality: the 25th, and the Orange County-based 40th. Of course, that doesn’t presage an immediate change in voting patterns; given lower Hispanic voter participation rates and the fact that much of the Hispanic population is under 18, changes will be slow to happen. Case in point: the 20th, where incumbent Jim Costa had a close call in 2010 despite it being a 70% Hispanic district! (One other bit of trivia: Pete Stark’s 13th moved from a white plurality to an Asian plurality, the only Asian-plurality district outside of Hawaii.)

One other thing you’ll notice: despite the fact that California didn’t lose a seat, there is going to be substantial reconfiguration of districts, with boundaries moving from west to east. The Bay Area gained little population, and will need to give most of a seat to the Central Valley; likewise, Los Angeles County proper gained little, and will need to give most of a seat to the Inland Empire (San Bernardino and Riverside Counties). Although the Central Valley and Inland Empire tend to be Republican areas in general, most of the growth in those places has been Hispanic, to the extent that “new” seats are probably going to wind up being Hispanic VRA seats carved out of the general overlay of red; on the other hand, the Bay Area and LA proper are already Dem strongholds and have nothing but Dems to lose, so the overall effect is likely to be a wash. Of course, given that this is the first year that California switches to an ostensibly impartial commission, which has no compunction to preserve the incumbent protection intent of the 2000 map and may actually place a premium on compactness, we could see all manner of scrambling that goes well beyond what I’m describing.

While we aren’t going into as much detail as we did with Texas, we’re adding a few details to California that most states haven’t received: each district’s representative (as it’s well nigh impossible to keep track of which district number is what when there are 53 of them), and the district’s racial composition in both 2010 and 2000. The four categories expressed as overall percentages, left to right, are non-Hispanic white, non-Hispanic African-American, non-Hispanic Asian, and Hispanic.


District Rep. Population Deviation 2010 Race 2000 Race
CA-01 Thompson (D) 704,012 1,107 63/2/6/24 71/1/4/18
CA-02 Herger (R) 708,596 5,691 70/1/4/19 76/1/4/14
CA-03 Lungren (R) 783,317 80,412 62/6/11/16 74/4/6/11
CA-04 McClintock (R) 774,261 71,356 78/1/4/12 84/1/2/9
CA-05 Matsui (D) 700,443 (2,462) 36/14/16/27 43/14/15/21
CA-06 Woolsey (D) 664,468 (38,437) 69/2/4/21 76/2/4/15
CA-07 Miller (D) 655,708 (47,197) 35/15/15/30 43/16/13/21
CA-08 Pelosi (D) 666,827 (36,078) 42/6/31/16 43/8/29/16
CA-09 Lee (D) 648,766 (54,139) 35/20/18/22 35/26/15/19
CA-10 Garamendi (D) 714,750 11,845 53/7/13/21 65/6/9/15
CA-11 McNerney (D) 796,753 93,848 50/5/14/26 64/3/9/20
CA-12 Speier (D) 651,322 (51,583) 41/2/33/18 48/2/29/16
CA-13 Stark (D) 665,318 (37,587) 26/7/36/25 38/6/28/21
CA-14 Eshoo (D) 653,935 (48,970) 51/2/22/21 60/3/16/17
CA-15 Honda (D) 677,605 (25,300) 37/2/36/21 47/2/29/17
CA-16 Lofgren (D) 676,880 (26,025) 26/3/28/40 32/3/23/38
CA-17 Farr (D) 664,240 (38,665) 39/2/5/50 46/3/5/43
CA-18 Cardoza (D) 723,607 20,702 29/6/9/53 39/5/9/42
CA-19 Denham (R) 757,337 54,432 50/4/5/37 60/3/4/28
CA-20 Costa (D) 744,350 41,445 16/6/5/70 21/7/6/63
CA-21 Nunes (R) 784,176 81,271 37/2/7/51 46/2/5/43
CA-22 McCarthy (R) 797,084 94,179 54/6/4/32 67/5/3/21
CA-23 Capps (D) 695,404 (7,501) 41/2/5/49 49/2/5/42
CA-24 Gallegly (R) 681,622 (21,283) 60/2/6/29 68/2/4/22
CA-25 McKeon (R) 844,320 141,415 42/10/6/39 57/8/4/27
CA-26 Dreier (R) 691,452 (11,453) 43/5/19/31 52/4/15/24
CA-27 Sherman (D) 684,496 (18,409) 38/4/12/42 45/4/11/36
CA-28 Berman (D) 660,194 (42,711) 30/3/7/58 31/4/6/56
CA-29 Schiff (D) 642,138 (60,767) 40/5/28/25 39/6/24/26
CA-30 Waxman (D) 662,319 (40,586) 72/3/11/10 76/2/9/8
CA-31 Becerra (D) 611,336 (91,569) 11/4/15/68 10/4/14/70
CA-32 Chu (D) 642,236 (60,669) 10/2/22/64 15/3/18/62
CA-33 Bass (D) 637,122 (65,783) 22/25/13/37 20/30/12/35
CA-34 Roybal-Allard (D) 654,303 (48,602) 9/5/6/79 11/4/5/77
CA-35 Waters (D) 662,413 (40,492) 9/28/6/54 10/34/6/47
CA-36 Vacant 659,385 (43,520) 44/4/16/32 48/4/13/30
CA-37 Richardson (D) 648,847 (54,058) 14/21/12/49 17/25/11/43
CA-38 Napolitano (D) 641,410 (61,495) 9/3/11/75 13/4/10/71
CA-39 Sanchez, Li. (D) 643,115 (59,790) 16/5/10/66 21/6/9/63
CA-40 Royce (R) 665,653 (37,252) 39/2/20/35 49/2/16/30
CA-41 Lewis (R) 797,133 94,228 51/6/5/35 63/5/4/23
CA-42 Miller (R) 667,638 (35,267) 45/2/20/29 54/3/16/24
CA-43 Baca (D) 735,581 32,676 15/10/4/69 23/12/3/58
CA-44 Calvert (R) 844,756 141,851 41/5/8/43 51/5/5/35
CA-45 Bono Mack (R) 914,209 211,304 41/6/4/45 50/6/3/38
CA-46 Rohrabacher (R) 648,663 (54,242) 56/2/19/20 63/1/15/17
CA-47 Sanchez, Lo. (D) 631,422 (71,483) 12/1/17/68 17/1/14/65
CA-48 Campbell (R) 727,833 24,928 58/1/19/18 68/1/13/15
CA-49 Issa (R) 797,428 94,523 48/4/5/39 58/5/3/29
CA-50 Bilbray (R) 753,135 50,230 59/2/14/22 66/2/10/19
CA-51 Filner (D) 757,891 54,986 15/7/12/62 21/9/12/53
CA-52 Hunter (R) 673,893 (29,012) 64/4/7/19 72/4/5/14
CA-53 Davis (D) 662,854 (40,051) 48/6/10/32 51/7/8/29
Total: 37,253,956 40/6/13/38 47/6/11/32

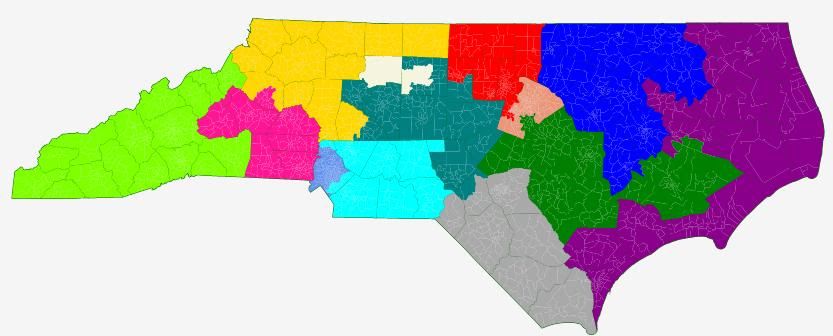
North Carolina without an I-85 NC-12

I just wish I could see ten different ways of dealing with the Democrats in the Triad, rather than ten different variations that all deal with them the same way: using NC-12.

roguemapper

Two of the most recent NC redistricting diaries have featured roguemapper’s cri de couer against I-85-based NC-12s in their comments. Here, I’m only delivering two different ways of dealing with the Triad Dems instead of ten. I hope the comment section will make up for the missing eight.

The argument against an I-85-based NC-12 is threefold: (1) it was upheld in the courts as a partisan-based and not minority-based gerrymander; (2) creating a minority-majority NC-12 barely requires leaving Charlotte, let alone Mecklenburg County; and (3) state Republicans have said they don’t want one. I’m currently too lazy to source any of those statements and I’m not interested in arguing them. My purpose is to discuss North Carolina maps that treat that argument as true. Think about it like a move trailer, if it helps:

(booming movie announcer voice) In a world where North Carolina Republicans are committed to a compact, Charlotte-based, minority-majority NC-12… (/booming movie announcer voice)

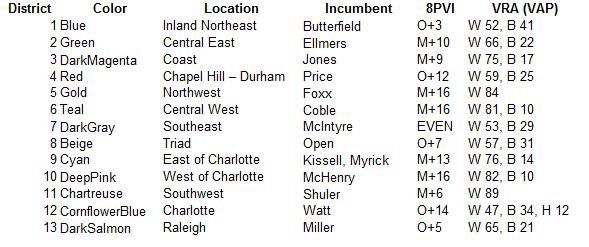
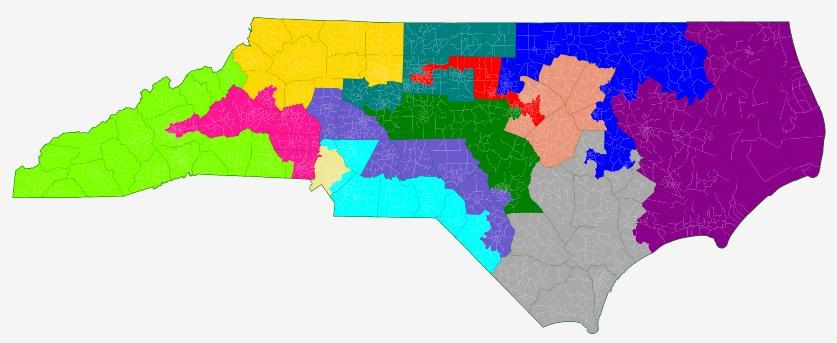
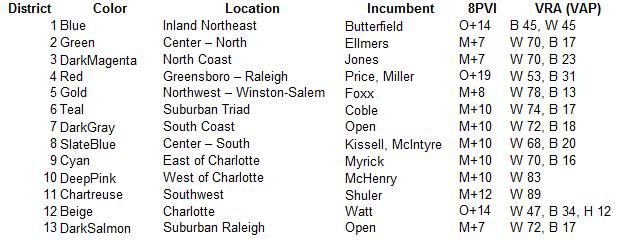
I’m presenting two maps here. One is an  unaggressive and therefore unlikely map that cuts out Kissell but gives the Democrats a new district in the Triad. (It’s also got retrogression issues.) I’m posting it because I think it’s an interesting baseline for what a minimally gerrymandered map could look like. There’s a grand total of ten counties statewide that are split between two or more districts. The other is an extremely aggressive map which creates 10 McCain districts.

Pictures and discussion are after the jump.

(Note: I don’t generally like changing colors, because I’m used to the defaults and I assume others are too. But there are too many blues in the first 13 colors for a NC map. On the first map, NC-08 is Beige. On the second map, NC-12 is Beige.)

Map One


Not much to say about this one. It’s my best attempt to use county integrity as my first priority, with partisan effects as my second. All six Republicans should be fine in districts that McCain carried by at least 9 points by at least 5 pts. Correction: The preceding sentence was incorrect. My 8PVI rating means that McCain did at least 9 pts better than he did nationally in all six Republican districts, but that only means that he won them by at least 5 points, not 9. The seven Democrats have a more varied range of impacts. Shuler and Miller are in districts that are about one point more McCain-friendly. McIntyre’s district gets a seven point boost in Obama-friendliness. Kissell’s district is axed and relocated to the Triad. Miller and Watt hold steady.

NC-01, obviously, would be contentious. There are retrogression concerns in having it become majority-white in terms of VAP (total population it’s merely plurality white). It’s also lost about six points worth of Obama-friendliness. Something like this would require a Republican legislature that’s willing to test the bounds what the courts will let them get away with. If they were willing to adopt the rest of the map (not likely), some playing around with borders of NC-01 and NC-03 should be able to result in better districts for both Jones and Butterfield and satisify retrogression concerns.  (Note that this map has Jones drawn out of his district.)

I don’t actually endorse this version of NC-01 — again, this particular map is meant to be a baseline for county-integrity. This is important primarily because the Republicans in charge of redistricting have been talking a big game about a clean map. I wanted something to be able to compare to their eventual map.

Map Two

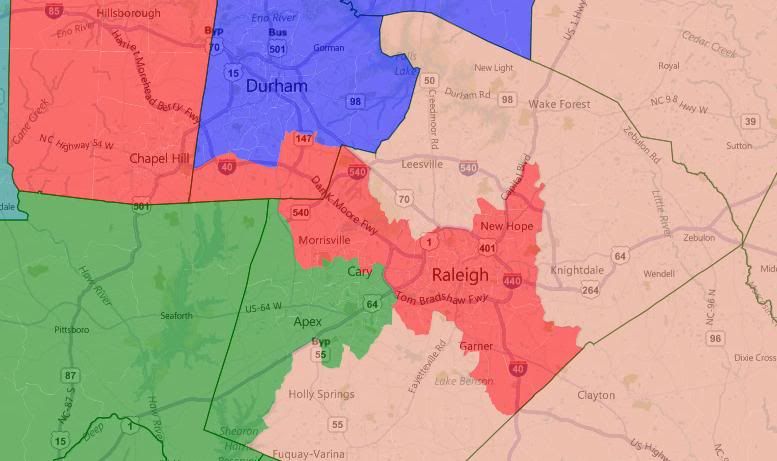
There should be more to say about this one, since it is an actual proposal. But I’m tired, so I’m going to let the pictures tell most of the story. This is, ostensibly, a 10-3 map. Note that is a fairly clean map as well, with a total of 19 counties split between two or more districts.


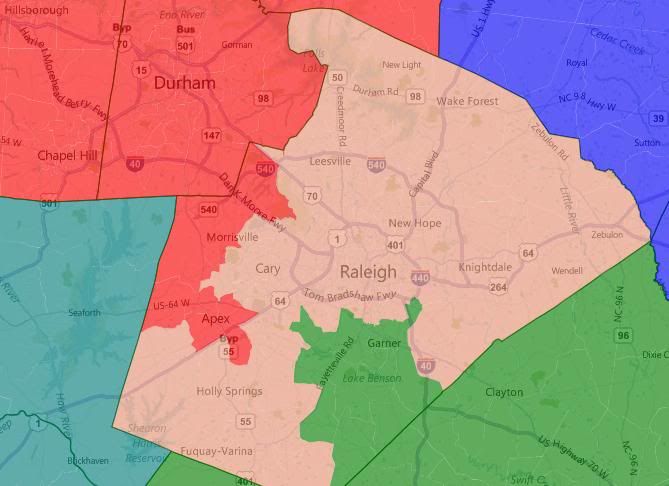
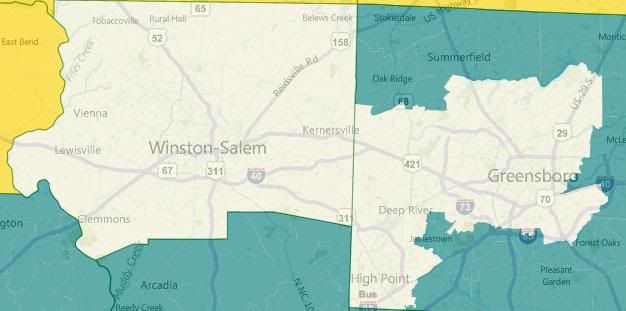
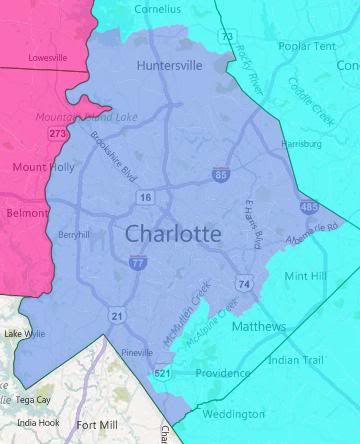
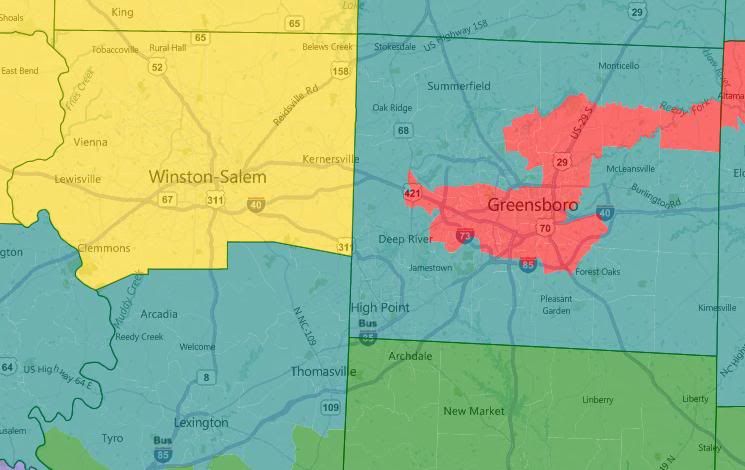
The three Democratic districts are Durham + the core of the old First, Greensboro + Chapel Hill + downtown Raleigh, and Charlotte. Foxx’s district is red enough to absorb all of Winston-Salem easily. McHenry’s is likewise red enough to absorb Asheville.

I’ve lumped two incumbent Democrats into one uber-Democratic seat in the north and two incumbent Democrats into one fairly-Republican seat in the south. I’m curious how the primary process would play out in this NC-04.

There are two new Republican open seats. Note how evenly spread Republican strength is — all in the McCain +7 to +12 range.


Update: Re-reading my diary, I realized that I incorrectly described the meaning of my 8PVI rating. I’ve struck through and corrected a sentence up in the Map One section. 8PVI is based on Cook PVI but only uses 2008 voting data. It’s a measure of how much better Obama or McCain did in a jurisdiction than they did nationwide. The nationwide balance was 53.5 Obama to 46.5 McCain. So O+10 means Obama won a jurisdiction 63.5 to 36.5. M+5 means McCain won a jurisdiction 51.5 to 48.5.

By what margin will Bob Shamansky win?

View Results

Loading ... Loading ...

A Democratic Nebraska

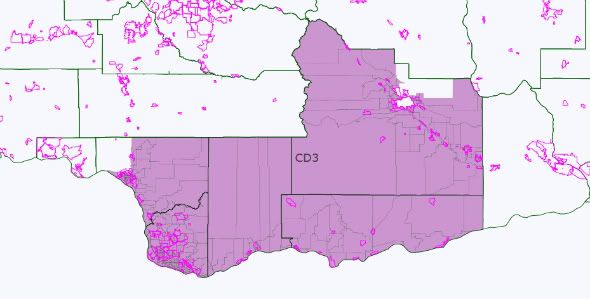
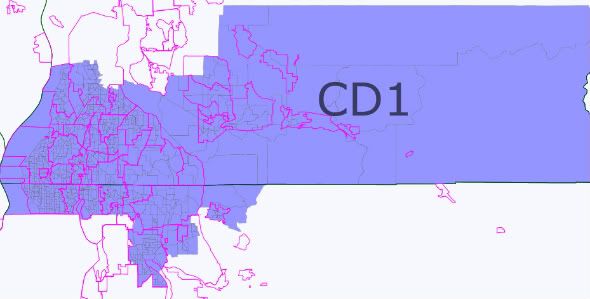
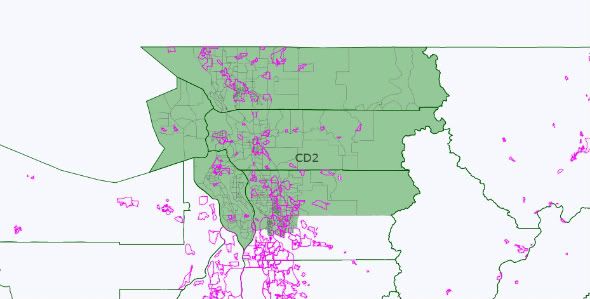
Since Obama managed to win Nebraska’s second congressional district 3 years ago I’ve been wondering just how Democratic a district it is possible to make in Nebraska. With the new census data becoming available, now seemed as good a time as any to find out! As Dave’s Redistricting App doesn’t include partisan data for Nebraska I tabulated each precinct by hand.


CD1 Blue

57% Obama 43% McCain, 71/11/12 W/B/H

The Democratic district stretches predictably enough from Omaha to Lincoln and on into Saline county. While it certainly isn’t the most Democratic congressional district going around it is pretty darn blue for Nebraska and the right kind of Democrat could do very well here.  

CD2 Green

39% Obama 61% McCain, 90/2/5 W/B/H

The non-CD1 parts of south-east Nebraska.

CD3 Dark magenta

30% Obama 70% McCain, 85/1/11 W/B/H

The rest of Nebraska.

North Carolina (Updated!): The Map That Gets Uglier Each Time You Draw It

The lack of political data is a bit of a drawback in coming up with these North Carolina maps, but I’ve drawn North Carolina a few times now. In my experience, it’s hard to draw a pretty map, and in fact, I think it keeps getting grosser and grosser the more I try.

The idea here was to draw a rather unfriendly 4-9 gerrymander for the Republicans. I think it came out largely successfully, though at least two of those GOP districts (and perhaps one Democratic district) may be prone to a bit of wobble. I’d call it a 4-8-1 overall.

NC-01 (blue)

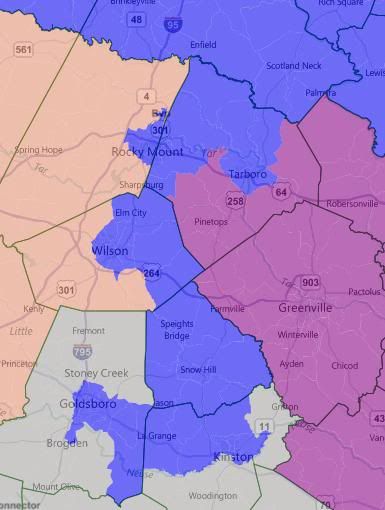
Rep. G.K. Butterfield, the Democrat who represents this VRA district, has little to complain about. It’s not pretty, but it is 44.4% white, 46.7% black, and no Republicans will be interested in seriously challenging Butterfield out here. Safe Democratic.

NC-02 (green)

Hey, it’s an open seat. Well, maybe. This district gobbles up a lot of ruby-red central North Carolina, much of which is currently held by Republican Rep. Howard Coble in modern-day NC-06, one of the most Republican districts in the country. I’m not exactly sure where Coble resides in Greensboro, but most of Greensboro is in another district, so I think this is open. Rep. Renee Ellmers, the freshman Republican who claims this district today, is certainly drawn out. No matter who runs here, the Republican will win unless he or she is caught with a live boy or a dead girl, as the saying goes. Safe Republican.

NC-03 (purple)

Republican Rep. Walter B. Jones, Jr., gets more respect here than most Republican congressmen. He’s an ally of Rep. Ron Paul, the iconoclastic Texas Republican who kick-started the nascent libertarian uprising within the Republican Party back in 2007 and 2008 when he ran for president, then flatly refused to endorse the party’s nominee, Sen. John McCain, in favor of holding a rival event to the Republican National Convention across town. The quirky Jones should be happy with this district, which looks rather similar to his current turf. He benefits heavily from water continuity here, of course. Safe Republican.

NC-04 (red)

Yes. Here is where things get a bit twisted. Democratic Rep. David Price gets thrown into the blender together with current NC-13 Rep. Brad Miller, another Democrat, in this urban vote sink. A primary fight between Price and Miller, both of whom claim a very Democratic voting record and both of whom are members of the extremely endangered club of white Democratic congressmen from the South, could be the source of some yucky schadenfreude for delighted Republican spectators. Whoever is the Democratic nominee will hold this seat, guaranteed. Safe Democratic.

NC-05 (yellow)

This is where Coble goes out of his NC-06. It’s a combination of the northern parts of that district and the current NC-05. Republican Rep. Virginia Foxx, otherwise known as the Mean Granny, has been redistricted elsewhere, paying the price of living at the absolute extremity of her district. If the district absorbed swingy Winston-Salem, it might be more competitive, but in this configuration, Republicans won’t sweat it. Safe Republican.

NC-06 (teal)

Mean Granny actually ends up here, in the district that soaks up Winston-Salem. She has little reason to complain, though, as outside of some parts of the city, the district is eye-blisteringly red. Foxx is such a piece of work that it’d be nice to think a strong Democrat could take her out, but in this configuration, she or any other Republican who runs is basically secure starts out with a solid edge. Safe Likely Republican.

NC-07 (grey)

Somehow, Ellmers lands in this district, while current Democratic Rep. Mike McIntyre goes elsewhere. With all the grace of a drunken giraffe, this district lurches from Ellmers’s home of Dunn down to the South Carolina border, scooping up lots of ancestrally Democratic territory. McIntyre likely would have gotten the boot last year were he not matched up against accused murderer and former Goldman Sachs stooge Ilario Pantano, as demographic trends in this area have not smiled on the Democratic Party. I’d rate Ellmers the favorite, but she’s not exactly Albert Einstein herself, and a good Democratic recruit could give the party a chance at keeping this seat blue post-McIntyre. Lean Likely Republican.

NC-08 (slate blue)

McIntyre, of course, wound up here, in the district now represented in Congress by his fellow Blue Dog Democrat, Rep. Larry Kissell. There’s been some talk of McIntyre running against near-toxic Gov. Perdue for the Democratic nomination in next year’s gubernatorial election, and if he gets deathmatched against his buddy Kissell (as appears likely), the odds probably go up. This district is probably going to stay in the Democratic column thanks to Fayetteville and the potent incumbency of Kissell, but the PVI is going to be pretty close to EVEN and Republicans will probably still want to take a crack at flipping it. Likely Democratic.

NC-09 (cyan)

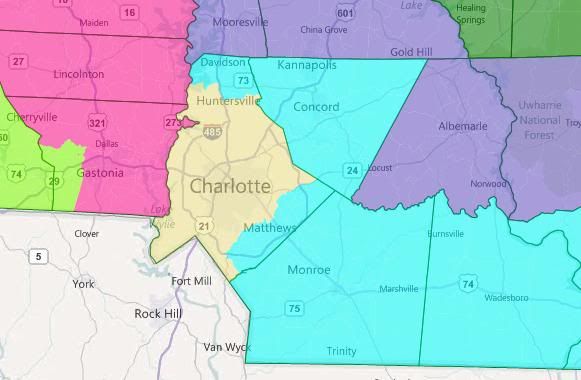
Rep. Sue Myrick, the longtime Republican congresswoman here, has kept a low profile on the national stage, but she’s well-connected and well-loved in suburban Charlotte. Her district has not changed too much at all, and she’s a lock for reelection if she runs. Safe Likely Republican.

NC-10 (magenta)

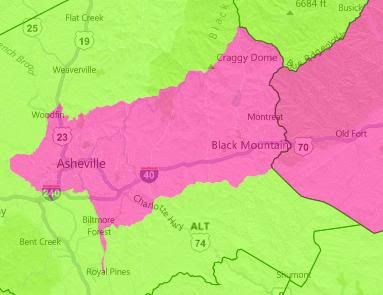
This district is the unlucky one charged with cracking the Democratic stronghold of Asheville, credited by some with keeping Rep. Heath Shuler, the Blue Dog Democrat representing NC-11, in Congress last year. Republican Rep. Patrick McHenry should be able to handle it, seeing as that most of the rest of his district remains the same (though it no longer stretches to the Tennessee border) and the modern-day incarnation is a dramatic R+17. Safe Republican.

NC-11 (chartreuse)

The man with the biggest target on his back in North Carolina redistricting this year, Shuler has been an irritant to the North Carolina Republican Party (as well as the national Democratic Party, but that’s another story) due to his apparent inability to lose despite occupying an intensely Republican district. But with about two-thirds of Asheville locked away in NC-10, this could be the end for Shuler. The thing is, I wouldn’t count the man out. Tossup/Tilt Republican.

NC-12 (cornflower blue)

I haven’t exactly made my loathing of Democratic Rep. Mel Watt, the congressman for Bank of America NC-12, a secret on this site. But he’s got a VRA district, albeit perhaps the most atrocious one in the country, and he’s not going anywhere. Republicans said they’d like to kill this grotesque district, which snakes from Charlotte up to Greensboro, but they also don’t want to get nerfed with a retrogression suit, because a court-drawn map of North Carolina would look a hell of a lot different than a Republican gerrymander. This district is 31.4% white, 47.6% black, and 14.2% Latino, which is about as strong a minority-majority district as can be drawn here. Safe Democratic.

NC-13 (salmon)

Despite its color, this district is not intended for every SSPer’s favorite authentic self-utilizing power along the lines of excellence, last seen launching a committee to explore just how many points he would lose by to independent Sen. Bernie Sanders of Vermont. With two pairs of Democratic congressmen deathmatched, this district must be North Carolina’s second open seat, and it’s a doozy. It’s basically an incomplete ring around the Research Triangle, joining together a bunch of white-collar suburbs and exurbs. It doesn’t exactly scream “recipe for Democratic strength”, but it’s an open seat, so it could be surprising. I’d bet strongly on a competent Republican candidate, though. Likely Republican Tossup.

UPDATE: roguemapper kindly calculated some political data (based on the 2008 election results) for the above map. This inspired me to get slightly more diabolical. If Republicans wanted to get very, very aggressive (and maybe a little bit spiteful), they could try a map like this:

I’d call this a 4-9, but I haven’t crunched the numbers yet. One of those Republican districts will belong to Rep. Heath “Captain Jack Harkness” Shuler, cursed with apparent political invulnerability, but there’s only so much you can do in redistricting.

NC-01 (blue)

No change from previous map. Safe Democratic.

NC-02 (green)

This district takes up a lot of swingy territory (helping to push a few marginal Republican seats deeper into the red) and tries to smother it with rural territory. It’s still an open seat, I believe. Democrats’ biggest foe here is its lack of geographic compactness; I don’t see a Durham-area Democrat running strongly in northern Cumberland County, for example, which would find a Blue Dog more palatable than Democrats from the Research Triangle would. Likely Republican.

NC-03 (purple)

No change here. Safe Republican.

NC-04 (red)

No change here. Safe Democratic.

NC-05 (yellow)

Scooping up more of Greensboro in exchange for some rural counties on the Virginia border will push the PVI of this district a point or two more Democratic, but it should remain a solid Republican district, especially with veteran Coble entrenched in the Greensboro area. Safe Republican.

NC-06 (teal)

No change here. Likely Republican.

NC-07 (grey)

No change here. Likely Republican.

NC-08 (slate blue)

One of the cruelest districts I’ve ever drawn, this minority-majority district basically screws both Kissell and McIntyre (who are both drawn into it) in the primary. That’s probably no benefit to Republicans, as Kissell and McIntyre are among the least loyal members of the Democratic caucus, but it fulfills the vendettas of the North Carolina Republican Party. Plus, if a black Democrat from Greensboro sneaks through in a primary, the consternation of ancestral Democrats happy enough to vote for Kissell and willing to begrudgingly pull the lever for President Obama in 2008 could give a moderate “good ol’ boy” Republican (including Kissell, if he switched parties) an opening. 45% white, 34.1% black, 8.2% Latino, 8.1% American Indian. Likely Democratic.

NC-09 (cyan)

Myrick gets a safer seat, with a lot of blueing Charlotte gobbled up by Watt and a lot of reddish territory incorporated into this district. Safe Republican.

NC-10 (magenta)

No change here. Safe Republican.

NC-11 (chartreuse)

No change here. Note that as before, the rating is only because Shuler is Shuler; in an unlikely open-seat scenario, it’s almost certain to flip. Tossup/Tilt Republican.

NC-12 (orange)

Yes, I changed the color. And the shape. Watt’s ugly snake-shaped district has been made more compact, and in turn, it has become much whiter. It remains minority-majority, but by a smaller margin, and it is white-plurality. 44.4% white, 35.6% black, 13.8% Latino. Safe Democratic.

NC-13 (salmon)

This district loses suburban Durham and Orange counties in exchange for exurban Chatham and Lee counties. This should be the district I meant to draw last time. Still an open seat. Likely Republican.

North Carolina: 9-4 GOP edge

As with Texas, it’s possible that I’m using circa-2008 estimates rather than real 2010 Census figures, but given the accuracy of past approximations I doubt the district lines would look terribly different if I drew them using real Census data. I did this so election stats could be included.

Basically, the Republicans can draw up to a 9-4 map in North Carolina, should everything go right and as long as they don’t mind drawing lines even uglier than the Democrats drew ten years ago.

Read below the fold…

This map would protect Renee Ellmers and target Larry Kissell, Brad Miller, and Heath Shuler for defeat. Patrick McHenry would have to accept some new Democrats in Asheville, as would Sue Myrick in Charlotte and Howard Coble in Greensboro.

Here it is in all its revolting glory:

Photobucket

District 1 (brown) – G.K. Butterfield (D)

Demographics: 48% black, 45% white

2008 Vote: Obama 62-37

Geography: western coastal plain

Unfortunately, I did not see an easy way to get the black % over 50, though I might have missed something obvious. In any case, it is still VRA-protected and still heavily Democratic.

District 2 (green) – Renee Ellmers (R)

Demographics: 66% white, 21% black

2008 Vote: McCain 54-45

Geography: clockwise from Danville to Raleigh to Fayetteville

In most states this would be an unusually ugly district, but to create a 9-4 GOP map in 50-50 North Carolina took some seriously unaesthetic boundaries. Compared to the 6th, 12th, and 13th, this one isn’t even so bad, and it should be effective at reelecting Ellmers even against a reasonably strong Democrat (remember, 54-45 McCain is equivalent to roughly 60-39 Bush in 2004).

District 3 (purple) – Walter Jones (R)

Demographics: 76% white, 16% black

2008 Vote: McCain 61-38

Geography: eastern coastal plain, barrier islands

Not much changed, and still a strong GOP seat. I thought about diluting this one to hurt Mike McIntyre, but there are enough Democrats in Fayetteville and Wilmington that it was not practical to crack his seat along with Kissell’s in the southern part of the state.

District 4 (red) – David Price (D)

Demographics: 51% white, 30% black

2008 Vote: Obama 74-25

Geography: Raleigh-Durham-Chapel Hill

A compact Democratic vote-sink, meant to help Renee Ellmers and hurt Brad Miller. Likely one of the most liberal seats in the South under this map.

District 5 (yellow) – Virginia Foxx (R)

Demographics: 81% white, 10% black

2008 Vote: McCain 59-40

Geography: Appalachians and Piedmont Triad

This remains the most Republican of the western seats, and Foxx should have no trouble getting reelected for the rest of the decade.

District 6 (turquoise) – Howard Coble (R)

Demographics: 73% white, 15% black

2008 Vote: McCain 54-45

Geography: Kannapolis, Greensboro, Durham

Talk about a meandering district! This one is “gerrymandered” to be GOP-leaning but not the GOP vote sink that it has been in the 2000s. It sheds strong GOP areas near Greensboro to the 13th and those in the south to the 8th.

District 7 (grey) – Mike McIntyre (D)

Demographics: 57% white, 27% black

2008 Vote: Obama 54-45

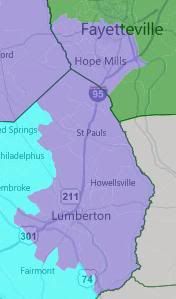
Geography: Fayetteville, Lumberton, Wilmington

Not quite a Democratic vote-sink, but a reasonably Dem-leaning seat in the south, ceding its Republican areas to the 8th. I figure that if GOP mapmakers see that they must choose between saving Kissell or McIntyre, they will pick McIntyre due to his 8-term seniority and the loose cannon tendencies of likely candidate Ilario Pantano. In a particularly Republican year they might pick this one up anyway, and especially aggressive party folk have not yet conceded that they can’t unhinge both Kissell and McIntyre.

District 8 (lavender) – Larry Kissell (D)

Demographics: 66% white, 21% black

2008 Vote: McCain 54-46

Geography: Charlotte, High Point, Fayetteville

I wanted to make sure Kissell would lose, and thus did just about everything possible to add Republican areas to a district that, flanked by Charlotte and Fayetteville, really shouldn’t be Republican. Now his district is every bit as conservative as Myrick’s to the west.

District 9 (cyan) – Sue Myrick (R)

Demographics: 78% white, 12% black

2008 Vote: McCain 54-46

Geography: Charlotte, Gastonia

Myrick hopefully won’t mind giving up some conservative turf in her fast-growing district to help her party defeat Kissell.

District 10 (fuchsia) – Patrick McHenry (R)

Demographics: 82% white, 10% black

2008 Vote: McCain 58-41

Geography: Asheville, Hickory, Gastonia

McHenry splits liberal Asheville with Shuler to hurt the latter’s reelection prospects. He should still be plenty safe, however.

District 11 (light green) – Heath Shuler (D)

Demographics: 89% white, 4% black

2008 Vote: McCain 55-44

Geography: Appalachians and Asheville

Cracking Asheville moved this district several points in the Republican direction, perhaps enough so to derail Shuler; though he’s proven resilient until now, remember that 55-44 McCain is equivalent to a Bush ’04 % in the low 60s.

District 12 (white) – Mel Watt (D)

Demographics: 47% black, 36% white

2008 Vote: Obama 72-28

Geography: meanders from Winston-Salem and Greensboro down to Charlotte

It seems impossible to draw a black-majority seat in North Carolina anymore, but this one is decidedly VRA-protected and now arguably not even the ugliest district in the state (the 6th is worse, I think).

District 13 (peach) – Brad Miller (D)

Demographics: 76% white, 14% black

2008 Vote: McCain 53-46

Geography: Greensboro, Raleigh, northern border

Turnabout is fair play, and Miller’s gerrymander will now be turned against him as his most reliable Democratic voters are soaked up by Price’s 4th and Coble’s 6th. Again, 53-46 is not a huge spread but Obama ’08 may have been a relative high watermark. Miller’s liberal reputation will not serve him well either.

In sum, Kissell and Miller should be toast, and I doubt Shuler could make it with a divided Asheville. While a lawsuit is inevitable, I doubt the courts would intervene; precedent says that lines can be ugly as long as they are not racial gerrymanders.  

Daves Redistricting — More data and fixes

Hi Everyone,

Last night I upload 2.1.2 and this morning I added 2010 data for more states.

New States: DE, KS, NE, NC, WY.

Key fixes:

— 2010 VT shapefiles are WAY SMALLER, like almost 1/10!!!

— 2008 Block Group population numbers fixed. It was most noticable in Wyoming, where the app claimed a population of 193,000.

Note: if you use Firefox, you will have to clear the cache to correctly load some states, incl. WA, MO, KS. It seems to cache the app XAP file, even when the website has a new one. IE and Safari don’t have this issue.

More below the fold.

Shapefiles: As you know from previous posts, the 2010 census VT shapes were way bigger. I was searching around on the web for help/advice/code and found MapShaper, a web app that allows one to upload a shapefile and then change it. Thank you Matthew Bloch and Mark Harrower. It appears that Matthew Bloch is now with the NY Times and responsible for some (all?) of the cool online maps they’ve been doing. I used the Douglas-Peucker simplification to simplify by 10% and whoa! the files are nearly 1/10 of the size and I bet you can’t notice the difference! I am so jazzed about this I’ve been telling anyone who will listen!

Thank you Tyler for pointing out the population of Wyoming (2008 block groups) was a bit off. This bug has been there for a while, but only shows up if the population data some block groups are split into parts. What happens is there’s only 1 shape for the block group but multiple parts in the data. I was only using population from 1 part. For most states, not that many block groups were split, but in Wyoming (and Montana) a lot of them are, making it more obvious. That’s fixed and so the 2008 BG numbers should be a lot better.

Note on Oregon. There are no VT shapes for Oregon, just like in 2000. So, I’ll have to use block groups for the 2010 data. That will take more work (some tools work, some change in the code). Not sure when I’ll get to that.

There are updates to VA and MD for election data to include some average turnouts. I will get to these next week.

Thanks.

Home Means Nevada: Redistricting Congress (Part I)

(Also at Nevada Progressive)

It is here. After hours of careful line drawing and days of poring over precinct results, the map has arrived. This is Nevada redistricted, baby!

So will the actual final map look something like this? Honestly, I don’t know for sure. Perhaps legislators on both sides of the aisle will want even safer seats and are willing to configure some gruesome looking districts to get them… Or perhaps last minute talks of redistricting collapse as a casualty in an ongoing state budget brawl, leaving the courts to ultimately draw the lines. But most likely, as is usual tradition, The Nevada Legislature will agree on some sort of last minute budget deal, and on a bipartisan redistricting gerrymander.

Still, this year is different. As population continues to swell in Clark County (Greater Las Vegas), political power is slowly-but-surely shifting southward as well. Clark is destined to pick up as many as three legislative seats from the north, as well as a brand new Congressional District. For the first time ever, three Las Vegas area politicians will likely be sent to The House of Representatives.

And for the first time ever, Nevada will likely have three open House seats! It’s looking increasingly likely that both Rep. Dean Heller (R-Carson City) and Rep. Shelley Berkley (D-Las Vegas) will run for the US Senate seat currently held by John Ensign (R-Sleaze), so legislators may very well be drawing the new district map with this in mind. And more importantly, they will likely be keeping in mind that some of their own, as well as a few powerful friends outside, will want to run in each of these open seats.

Share photos on twitter with Twitpic

In drawing this map, I had several objectives in mind. First, I didn’t want to grossly “over-gerrymander” DeLay style, especially since law suits are already being filed here. But while I didn’t want to go overboard, I did clearly have campaign politics in mind while drawing these districts. There are two minority-majority seats, one having a Latino plurality, designed to elect Democrats, and two seats engineered to be as Republican leaning as possible.

So did I succeed? We’ll have to wait and see. Nevada Democrats may very well see unprecedented primary action in NV-01 and NV-04. And while NV-02 and NV-03 are currently held by Republicans, they will have to continue to fight an increasingly tough battle against changing Reno and Las Vegas demographics in the decade to come.

So enough of me blathering on and on… Let’s check out the new districts!

Share photos on twitter with Twitpic

NV-02

(The Green District)

Population: 675,162

69.4% White (73.8% voting age)

The State of Play

First up, the second district. (We’re starting north, and heading south.) Dean Heller currently represents this seat. And even though he’s only done so since 2007, it seems pretty natural for him. He’s a long time Carson City person (both in residence and in Nevada political experience), and he has a conservative-but-not-too-fire-breathing persona that allows him to win comfortably a district that only barely voted for John McCain (by fewer than 100 votes!) in 2008.

However, this will likely change. Again, Heller may very well soon announce his campaign for US Senate, leaving this seat open for the first time since Jim Gibbons left this seat to run for Governor in 2006. And due to Reno area growth, NV-02 has to shed some rural territory to meet the new Census Bureau population guideline. So what happens?

Long story short, NV-02 is now a district that narrowly voted for Barack Obama and Sharron Angle. It’s a closely divided district that will provide a challenge for the typically mighty Washoe Republicans, in that they will need to settle on a candidate who can please GOP primary voters while being able to win enough moderate voters in the general election to keep this seat in GOP hands.

Who’s All In?

Again, Dean Heller looks to be out, but a final decision hasn’t yet be made, so he might still surprise us by staying put. Of course, there has also been plenty of talk of Sharron Angle running (again) for this seat. Even though she carried this district by 5.8% in her Senate run against Harry Reid last year, 2012 will be a Presidential year with higher Reno area turnout. And as we saw on the campaign trail last year, Angle couldn’t even make peace with her fellow Washoe Republicans, so she will have a much harder time holding onto this seat than someone like Heller (who narrowly beat Angle in the 2006 NV-02 GOP primary).

The Wild Cards

Funny enough, I haven’t heard much gossip (yet) over who may be angling for this seat… Other than the obvious. And even though they were just recently sworn into The State Senate (one elected, the other appointed), Reno Republicans Ben Kieckhefer and Greg Brower may be attractive to GOP leaders as they likely search for electable mainstream conservatives to stop Sharron Angle. On the Democratic side, the options aren’t quite as wide. Nevada State Treasurer Kate Marshall does live in Reno, but she hasn’t expressed interest in running for Congress… Can Sharron Angle change that?

2010 US Senate Results

49.6% Angle (R)

43.8% Reid (D)

Estimated 2008 Presidential Results

49% Obama (D)

48% McCain (R)

Estimated Cook PVI: R+4

Early Race Rating: Likely Republican if Dean Heller runs here again, but upgraded to Leans Republican if Heller runs for Senate, and upgraded further to Tossup should Sharron Angle run to replace him!

NV-03

(The Purple District)

Population: 674,792

66.5% White (69.7% voting age)

The State of Play

In the “Republican Wave” year of 2010, Joe Heck barely won with less than 50% of the vote and by fewer than 2,000 votes. That worries Nevada Republicans, and that’s why GOP legislators (especially those in Clark) will likely go to the mat to make NV-03 safer for Heck.

Mr. “War Hero” Heck could barely beat supposedly reviled “Las Vegas LIB’RUL!!!” Dina Titus by fewer than 2,000 votes, and for Heck’s campaign to succeed in a likely more Democratic friendly environment in 2012, this must change. So it has… At least here on my map.

Dina’s political base is widely acknowledged to be the progressive minded, ethnically diverse, labor union heavy, and LGBT friendly confines of The East Side, also known as “Paradise Township“, which consists the older neighborhoods just east of The Las Vegas Strip. So to shore up Heck, I removed The East Side from NV-03 and placed it instead in the newly created NV-04 seat (more on that later!).

Now in addition to that, Heck also had a problem much closer to home. Even though Heck lives in Henderson, both he and Sharron Angle lost a number of Henderson precincts just down the hill from him in uber-exclusive Roma Hills, in the slightly older (meaning built in the 1980s and 90s) and increasingly Democratic friendly neighborhoods of Green Valley and Green Valley Ranch. So to further shore up Heck, I also placed these areas in NV-04 (again, more on that later, including who this also helps!).

Instead, I gave Heck only the most Republican friendly parts of NV-03, and supplemented them with mostly GOP heavy areas previously in NV-01 and NV-02. The perennially stylish and upscale Summerlin development (including “retiree heaven” Sun City Summerlin) is almost entirely reunited here, and joined by a number of previously fast growing Northwest and Southwest valley exurbs. From there, NV-03 almost exclusively picks up the most conservative neighborhoods of Henderson, including wealthy Seven Hills and Anthem (including “retirement resort community” Sun City Anthem), as well as Old Henderson. In addition, NV-03 takes in all the rural Clark County communities (such as Mesquite, Primm, and Laughlin) outside The Las Vegas Valley.

Oh, and of course, all those rural areas previously in NV-02, from Ely to Hawthorne to Pahrump, have to go somewhere. They end up here… But they could end up being a double-edged sword for Joe Heck.

Who’s All In?

From all indications, Joe Heck wants to run for reelection, and this map will surely entice him to do so again. However, he’s not completely out of the woods yet. In fact, like the situation in NV-02, he will have to balance appealing to moderate suburban voters who may very well vote for President Obama again (who STILL won this district in 2008) with keeping “tea party” GOP primary voters happy. It’s no easy task.

The Wild Cards

Should “Tea Party, Inc.” ever fall out of favor with Heck, or Heck just decides to run for yet another higher office later this decade, they have a number of local GOPers to choose from. State Senator Elizabeth Halseth (R-Las Vegas) is seen by many as a rising “tea party” superstar, and State Senator Barbara Cegavske (R-Summerlin) is a long time right-wing stalwart. They’re basically Vegas’ answer to Sharron Angle, and Cegavske has already dropped hints of a future Congressional run. And of course, it’s not like “Chicken Lady” Sue Lowden is ever really leaving the political stage any time soon.

However, they can easily be stopped cold in their tracks. Why? Look at the partisan numbers. Angle only barely won this district last year, and Obama may very well win this district again next year. Joe Heck may have a hard enough time locking down this seat, but the task becomes even more difficult should he ever leave (or be primaried out).

Even though the rural areas (save for Mineral County) may be incredibly difficult for any Democrat to win, a Democrat may once again win this district if he or she can run up the margin enough in Vegas. In the future, the incredibly smart and talented State Senator Allison Copening (D-Summerlin) may have a once-in-a-lifetime opening to go from Carson’s Capitol to Capitol Hill… Or perhaps it will be Henderson Mayor Andy Hafen, someone from a long-time “Nevada royal family” who lives in the slice of Henderson staying in NV-03… Or maybe wonky “deficit hawk”, Clark County Commissioner, and current Las Vegas Mayoral Candidate Larry Brown (D-Summerlin)?

2010 US Senate Results

Angle (R) 48.5%

Reid (D) 46.3%

Estimated 2008 Presidential Results

Obama (D) 51%

McCain (R) 47%

Estimated Cook PVI: R+2

Early Race Rating: Leans Republican

Share photos on twitter with Twitpic

NV-01

(The Blue District)

Population: 675,212

44.4% Latino (38.7% voting age)

31.7% White (37.3% voting age)

14.7% African American (14.7% voting age)

Share photos on twitter with Twitpic

The State of Play

“Your Favorite Congresswoman”, Shelley Berkley, may soon be looking to move to greener pastures. And who can blame her? She’s back in the minority in The House. She doesn’t have the best relationship with Nancy Pelosi. In many ways, she’s boxed in… Unless she stomps outside that box in her signature bedazzled pumps and forges new ground with a Senate run.

So that may very well happen, and if it does we have yet another open seat battle here in Nevada! But unlike NV-02, all the drama will be in the Democratic primary.

Assuming Shelley runs for Senate, her Summerlin area stomping grounds are moved aside to NV-03 and NV-04, so NV-01 can become more of a minority-majority district and help the state’s Congressional Delegation better reflect the diversity of our fine state.

So instead, some heavily Latino Northeast precincts previously in NV-03 are moved here, even as other heavily Latino East Side precincts are shifted from NV-01 to the new NV-04 seat. Now, Latino and African American heavy North Las Vegas becomes the centerpiece of the district, complemented by the Democratic dominant inner city neighborhoods of Las Vegas.

See the recurring theme here? Notice how this affects the 2012 field below.

Who’s All In?

State Senate Majority Leader Steven Horsford (D-North Las Vegas) had been seen as a rising star for years, but now he’s made it to the top. He’s among the most powerful pols in Carson City today, as well as the highest ranked African American in state government alongside Supreme Court Chief Justice Michael Douglas. His career has been illustrious, but it hasn’t always been easy.

He’s now locked in a tough budget battle with Governor Brian Sandoval (R) and GOP legislators, and he is one of the very people overseeing this entire redistricting process. If he truly wants to run for Congress, he has to make miracles happen in Carson City this year, otherwise…

The Wild Cards

“Conventional Wisdom” here in Vegas may again be turned on its head. After all, this is now a Latino plurality seat. State Senator Ruben Kihuen (D-North Las Vegas) knows this first hand as one of the youngest Senators, as someone raised in an immigrant Mexican American family who climbed his way all the way up here, and as someone who’s succeeded despite earning the ire of the once omnipotent Culinary 226. While Kihuen himself hasn’t expressed interest in running, especially after just being elected as State Senator, his name has been floated around.

State Senator John Lee (D-North Las Vegas) actually has signaled interest in running, but he’s probably too moderate to win the Democratic primary in this district.

And sorry, Republicans, but there are virtually no GOP candidates who even want to try here.

2010 US Senate Results

62.9% Reid (D)

32.3% Angle (R)

Estimated 2008 Presidential Results

67% Obama (D)

31% McCain (R)

Estimated Cook PVI: D+14

Early Race Rating: Safe Democratic

NV-04

(The Red District)

Population: 675,294

49.0% White (53.4% voting age)

27.0% Latino (23.2% voting age)

11.5% Asian American (12.0% voting age)

Share photos on twitter with Twitpic

The State of Play

This is the story of “The Comeback Kid”. After being beat up and beat down, it’s time to rise again and shine in the glorious Mojave Desert Sun. But wait, whose comeback are we talking about?

Can it be Dina Titus‘? After all, she’s no stranger to comebacks. After her surprisingly-but-still-painfully close loss to Jim Gibbons in the 2006 Gubernatorial Election, she was written off for (politically) “dead”. But when Democrats wanted to contest NV-03 in 2008 (and Harry Reid’s political team wanted to do away with Jon Porter as a possible 2010 candidate against him) and their originally preferred candidate turned out to be a dud, they had nowhere else to go. Dina obliged, and she then found her redemption… Only to lose it again last year, and by less than 2,000 votes! But is Dina’s story really over?

Or can Rory Reid‘s find a new beginning? He was heralded for ending a painful period of local political corruption culminating in the saucy, racy “G Sting” FBI probe that took down a voting majority of Clark County Commissioners for taking bribes from stripper clubs out to put rival clubs out of business. He was commended for thinking ahead and pushing Clark County to take seriously matters of sustainable growth. He was seen as a real contender, then the 2010 Gubernatorial race happened and he was lost in translation as the Reno powers that be championed Brian Sandoval as their “anointed one”. It was so strange to see Rory’s political career cut short so abruptly last year, but can it be regrown?

UPDATE: Apparently the answer to my earlier question is a resounding Hell to the No! Sorry, but Rory did this to himself… Even if he broke no laws. Score one for Teams Titus and Buckley in Round 1.

Or can Barbara Buckley‘s be reborn? After all, she was seen as the most powerful Assembly Speaker seen in ages. She was the once dismissed “bleeding heart liberal” who then rocked the political establishment with legislative accomplishments on everything from patients’ rights to child welfare to home foreclosure mediation and prevention. And at one point, she looked to be quite the formidable candidate for Governor… Until she stepped aside for Rory Reid… But will she be so willing to step aside again?

Funny enough, all three of these big name Clark Democrats live in this newly created Congressional District. It starts in the more Democratic friendly Summerlin area neighborhoods, then leaps down to Buckley’s home base of Spring Valley, then crosses The 15 and Las Vegas Boulevard to jump into Dina’s East Side turf, then turns south to take in Rory’s ‘hood in the Green Valley part of Henderson. Either there will be some heated back room negotiations among party leaders on who gets this seat, or there will be a primary so exciting it may even eclipse the drama of the 2006 Democratic Gubernatorial Primary that Dina wasn’t “supposed to win”.

The Wild Cards

But wait, the list of candidates isn’t even over yet! There’s another potential suitor possibly waiting in the wings. After Barbara Buckley was termed out of The Assembly last year, John Oceguera became the new Speaker. However, this gig won’t last long. He will be termed out himself next year. And even though he himself hasn’t suggested it, his name has also been rumored for a run here. If he wins, he will be Nevada’s first Native American member of Congress. His challenge will probably be succeeding in this legislative session (a shared goal with Horsford) and not letting the recent drama over Las Vegas/Clark County firefighter pay take him down (even though he’s actually a North Las Vegas firefighter, and they’ve had no labor trouble there).

On the Republican side, however, it’s slim pickings. Perhaps Assembly Member Mark Sherwood (R-Henderson) or State Senator Michael Roberson (R-Henderson) can try, but both are far too conservative to even get close. After all, both only barely defeated their Democratic opponents last year.

2010 US Senate Results

55.9% Reid (D)

39.3% Angle (R)

Estimated 2008 Presidential Results

60% Obama (D)

37% McCain (R)

Estimated Cook PVI: D+7

Early Race Rating: Likely Democratic for now… And probably eventually becoming Safe Democratic barring any major scandal or unusually strong GOP candidate.

So this is my first Nevada map, a map I had with state legislators and certain big name pols in mind. In the future, I may draw more maps under different scenarios, such as Dean Heller and Shelley Berkley staying put in The House, or what might happen should The Legislature come crashing down over the state budget, forcing the courts to draw the final lines.

Let me know what you think and/or if you have your own maps to share. 🙂

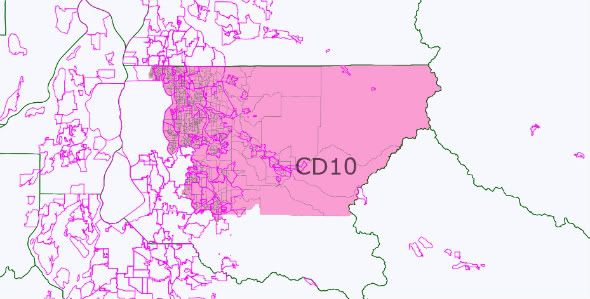
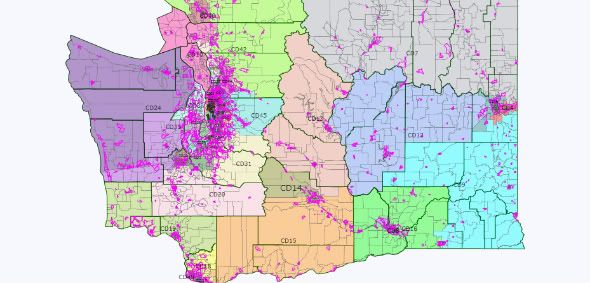
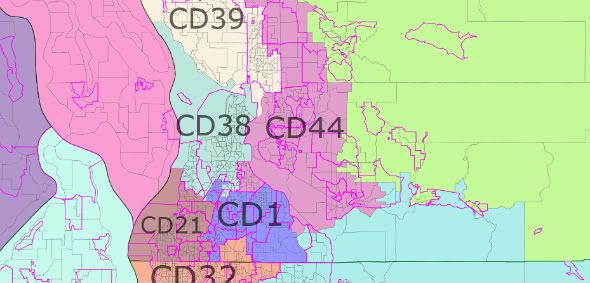
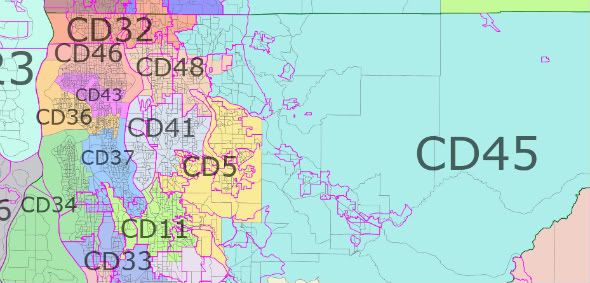
Choices in Washington Redistricting

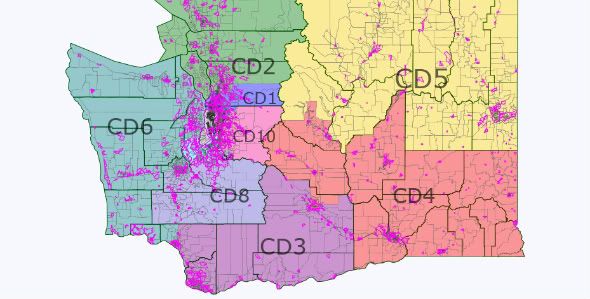
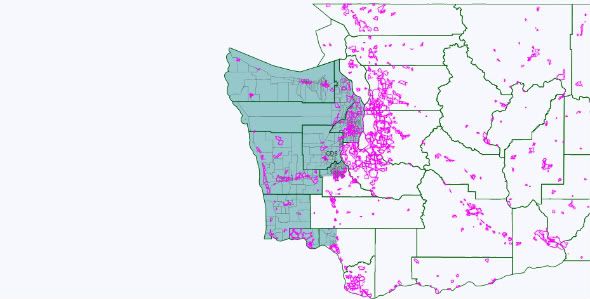
At the Washington State Democratic Central Committee meeting this past January, over lunch the delegates discussed the ramifications of the addition of a 10th Congressional District in the State. The goals discussed in the meeting was to ensure that a Democrat would be elected in the new 10th. There was general recognition that the 3rd would go from Vancouver to the outskirts of Yakama (along the Columbia River).

With three districts generally accounted for (the 3rd, 4th and 5th), the main question becomes how the Puget Sound area is divided. In Washington, the redistricting law states that plans should consider electoral competition and not purposefully favor or discriminate against any political party (among all of the normal provisions).

In practice, this means that the bipartisan redistricting commission gets the sign-off by the elected representatives (encouraging little change in the composition in the district, both geographic and partisan). For 2011, this means that Representative Dicks will want a more Democratic district (especially if he loses parts of Tacoma), and Representative Reichart wants a more rural, and Republican district.

With the addition of a 10th District in Washington, the choice facing the redistricting commission is to create 6-8 safe districts (3 safe Democratic 3 safe Republican) or to create a map with 4 safe districts (2 D – 2 R) and another 4 districts that are likely Democratic. (The difference really is should Democrats want to lock in a third safe Republican district in eastern King, Pierce, and Thurston counties or draw a map that is 7-3 in most years [including 2010]).

Photobucket

If the goal is to create 7 Democratic (or competitive) districts west of the Cascades (creating a 7-3 [or in the worst years a 6-4] split), then the existing Representatives should be willing to trade a bit of comfort and security for the potential for more Democratic representatives from Washington.

Some basic rules for redistricting in Washington:

1) While it may be the dream of many Democrats to split Seattle, it is not going to happen. The commission respects geographic cohesiveness, and sending a spur from Seattle to a) the Olympic Peninsula, or b) to Kirkland or Bellevue is not going to happen.

2) The redistricting commission likes to create competitive districts.

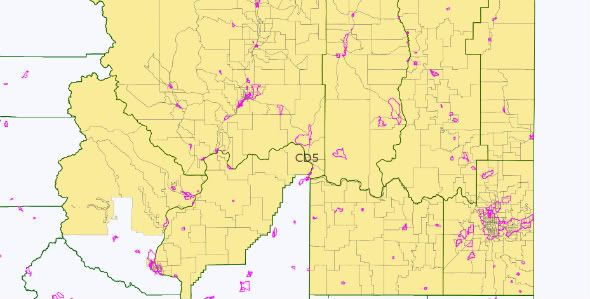
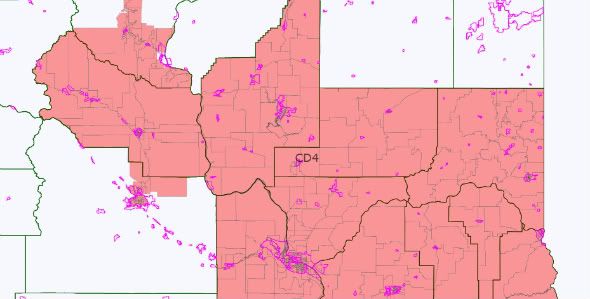
3) Two and a half districts will be in Eastern Washington.

Photobucket

Photobucket

Photobucket

Redistricting Washington

So, 6 districts left to draw. Two districts will have their roots in Whatcom, Skagit and Snohomish County. Representative Larson lives in Lake Stevens, west east of Everett. However, if Representative Inslee runs for Governor, then Larson could either run in the 1st or 2nd (and could be happy either way, since he would want more of Everett anyway).

For me, the key to redistricting Washington lies with not where the new 10th District goes, but what will the 6th District go? And, what does Representative Norm Dicks want from this round of redistricting?

The current 6th District includes Bremerton, Representative Dicks' residence, most of the Olympic Peninsula, and extends into Pierce County and has to shed 37,000 people.

If Representative Dicks gets anxious and wants a district that a) resembles his current district and b) becomes more Democratic, then the Democrats lose the redistricting game (and likely all decade). Either the 10th or the 8th District will be a Solid Republican district. If he is a team player, and accepts a Democratic leaning district that has lots of new constituents, Democrats win (or have a better chance of winning). Then, the 8th and 10th will be lean Democratic seats (or better).

The following maps present two options for a 10th CD and the competitiveness of each district (again, the 3rd, 4th, and 5th stay the same).

Option 1: Dicks remains concerned about his reelection

In this scenario, the 6th CD is the entire Olympic Peninsula, the Washington Coast, and most of Cowlitz County and the cities of Olympia, Tumwater and Lacey. While losing his portion of Tacoma, Dicks gains the remainder of Democratic-leaning Kitsap County, and Democratic leaning Olympia. While Dicks is secure about his reelection, the population of the state mean that a Republican-leaning district must be created.

Photobucket

With the Olympic Peninsula off the map, the 1st and 2nd become located entirely in Whatcom, Skagit, and Snohomish County. The 2nd adds Everett, making Larson happy. The 1st (open) becomes southwestern Snohomish counties and several King county cities – Shoreline, Lake Forest Park, Kenmore, Redmond, Bothell and Woodinville.

Photobucket

Photobucket

Up to this point – good for the Democrats – 3 stronger seats.

South of Seattle, Representative Smith's (Tacoma) district can also be strengthened – include all of Tacoma and western Pierce County, and include the cities of Kent, Renton, Federal Way, and the other cities immediately South of Seattle not part of the 7th.

Photobucket

So, 4 stronger seats for the Democrats (and all geographically compact).

Now the rub. there are few Democratic areas left in the State to draw two more competitive districts (or better). The 10th ends up in Eastern King County centered around Bellevue. This is the area where Democrats have done well in 2006, 2008, and 2010.

Photobucket

The elusive 8th district becomes the remainder of the State – Auburn, Eastern Pierce County, Lewis County, and rural portions of Thurston County.

Photobucket

So, the end result of Western Washington is 1 SR seat and 4 safer Democratic seats. In essence, this is the status quo and Washington's delegation would be 6-4 for the majority of the decade (with the slim possibility of winning back the 3rd).

But Democrats could do better.

Option 2: Dicks accepts a district with more new constituents

The 6th CD includes Bremerton and other Democratic portions of Kitsap county (Bainbridge Island), Olympia and all of Thurston County, and Pacific, Wahkiakum counties (as well as Lewis County). Every county (or portion of) the county is Lean D (or better) except for Lewis County. While the District would be lean D, and potentially competitive, it would still likely be a Democratic seat the entire decade.

Photobucket

With 2 counties and portions of Kitsap on the Olympic Peninsula not part of the 6th, you then draw a district across the Sound to Whatcom County (via Island and San Juan Counties). The 2nd CD can be all of Snohomish (with a portion of Democratic Shoreline).

Photobucket

Photobucket

So, here we have 2 likely Democratic district and 1 safe Democratic districts.

The 8th CD becomes a Democratic leaning district by adding the King County cities of Federal Way, Kent, Renton, Tukwila, Newcastle and SeaTac. While Representative Reichert still lives in the district, he has lots of new Democratic cities to deal with.

Photobucket

The 9th is a Pierce County district centered around Tacoma.

Photobucket

Again, this is two additional lean/likely Democratic districts.

The new 10th is now exclusively an Eastern King County district.

Photobucket

In this scenario, each district would be competitive (at worse for the Democrats), but likely, year in and year out, sending 7 Democrats to DC.

And, did I say from the outset that the commission likes competitive districts?

To summarize:

Option 1 (max deviation 174):

3 safe Democratic seats, 3 lean/likely Democratic seats, 3 safe Republican seats, 1 likely/lean Republican seat.

Option 2 (max deviation 140):

2 safe Democratic seats, 2 safe Republican seats, 4 lean/likely Democratic seats, 1 likely/lean Republican seat.

Bonus – State Legislature Map (max deviation 590):

Photobucket

Snohomish County

Photobucket

King County

Photobucket

Pierce County

Photobucket

Thurston County

Photobucket

Kitsap County

Photobucket

Clark County

Photobucket

Benton County

Photobucket

Spokane County

Photobucket


By what margin will Bob Shamansky win?

View Results

Loading ... Loading ...