Mini Redistricting Contest: Virginia

(I’m bumping this one up. Not a single map as yet? Come on, people! – promoted by DavidNYC)

So Politico has some details about an incumbent protection map that’s supposedly been agreed to in Virginia:

Members of Virginia’s House delegation unanimously agreed to a redistricting plan that will protect all of their seats and strengthen the three GOP freshmen who ousted Democratic incumbents last November, POLITICO has learned.

The new map, according to multiple sources in both parties who are familiar with the plan, was crafted in the past month chiefly by Virginia’s eight GOP members. But it has received crucial private support from the state’s three House Democrats – notably Rep. Gerry Connolly, who barely survived reelection last November and whose Capitol Beltway-area district would get a Democratic bump.

The delegation is hoping for legislative approval in three weeks when the politically divided General Assembly convenes a special session.

So here’s the contest: Though the details are sketchy, draw what you think this map might look like using Dave’s Redistricting App. Make sure to read the entire Politico piece – most of the details are on the second page. Dave Wasserman has some ideas (here and here), but what are yours?

UPDATE: Looks like we have three entries so far: sawolf, okiedem, and drobertson. Whaddya think?

Daves Redistricting & Progressive Congress [Update]

Dave’s Redistricting Application is now a project of ProgressiveCongress.org. Woohoo!

[Update: CA is ready!]

This means that more members and visitors of Progressive Congress will get to know about DRA and that more users of DRA will get to know about Progressive Congress. This means that the Progressive Congress team will be providing advice and guidance for DRA. (Some of Darcy’s suggestions have already been included in the app, in fact.) This means that Progressive Congress and DRA will be teaming up to help you better understand what’s going on with redistricting and what you can do about it. And this means working together to make government better for the people!

This also means that you can now make tax-deductible contributions to support the Dave’s Redistricting Project. Your support, whether it’s $10 or $500 will help keep the project going with the rest of the 2010 data, election data and more features. It will also help support the awesome work done by ProgressiveCongress.org

Cross-posted at DailyKos. Latest DRA info below the fold.

Here’s the latest on the application:

— 29 states now have 2010 data. The new ones are AZ, CT, ID, OH, PA, WI. (CA soon!)

— VA and MD have election data, now including actual vote counts (except absentees are not places in any precinct and so are left out). More election data expected soon.

— Bug workaround: if you have trouble with the Pan control, you should be able to Save your work now.

Thanks to all of you users. Keep the feedback coming. Thank you SwingStateProject! Special thanks to Darcy Burner for making this partnership a reality.

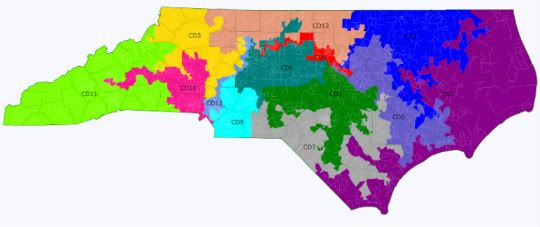
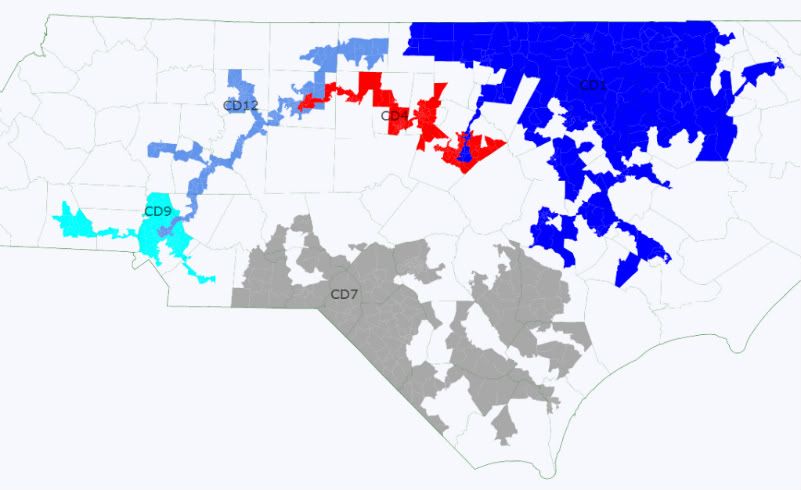
NC gop 9-4 with 4 Majority-Minority Districts

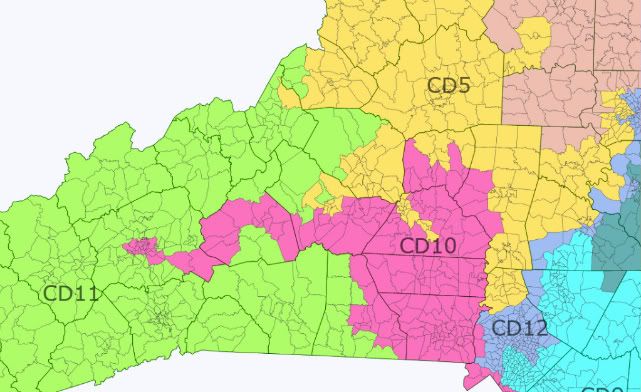
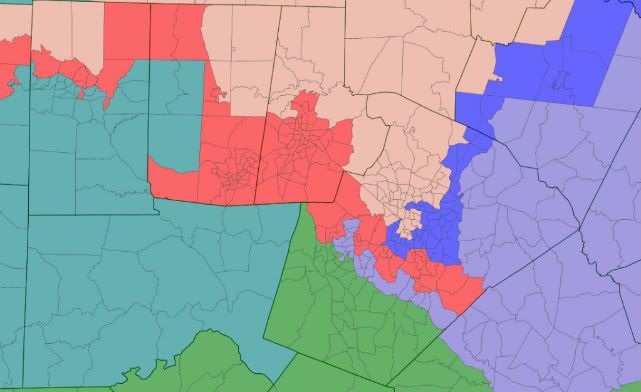
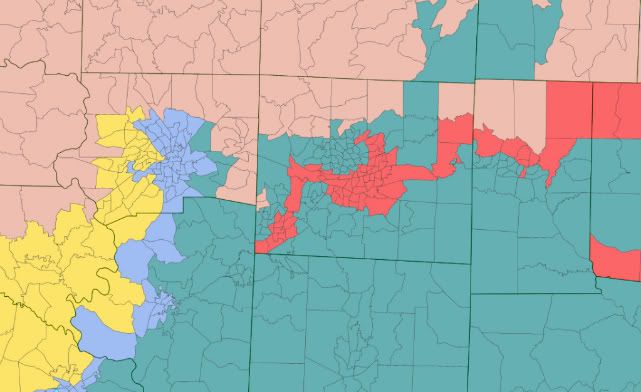
So I finally registered on SSP and this map is my first posting of North Carolina. It’s intended to result in 9 safe GOP districts, all of which are 57% McCain or above, and 4 safe majority-minority Dem districts, two of which are plurality VAP black.

Overview:

Photobucket

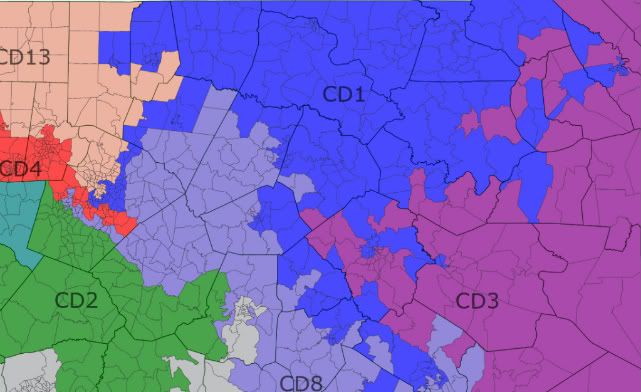
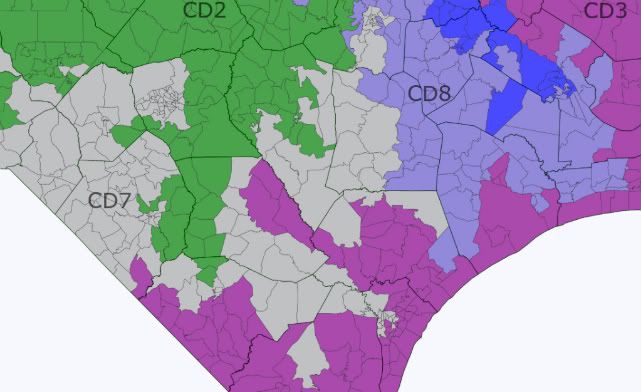
From East to West:

Photobucket

Photobucket

Photobucket

Photobucket

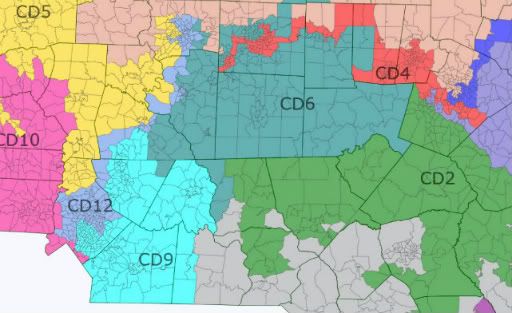
Finally, a close up of the Triangle and the Triad:

Photobucket

Photobucket

All districts are within 500 of ideal population as follows:

Obama/McCain       White/Black/Hispanic/Asian/Native/other

NC-1 (Blue)        G.K. Butterfield (D)

67.5-32.0        40.9/47.8/7.4/1.7/0.7/1.5

The 1st loses a bit of the coastal region but the only major change is a snaking addition into Raleigh to pick up heavily Democratic and minority voters so as to have enough population.

Safe Democratic

NC-2 (Green)        Renee Ellmers (R), Larry Kissell (D)/Mike McIntyre (D)

40.7-58.4        69.3/15.2/9.5/2.5/1.6/2.0

The 2nd undergoes significant changes as it loses area in Raleigh proper and the counties to the northeast and gains heavily Republican territory to the south and west from the current 7th and 8th districts.  Ellmers should be safe here barring a primary challenge from another Republican, but seeing as how she’s very conservative this shouldn’t be a huge problem for her. Incidentally, Kissell’s home in Biscoe and possibly McIntyre’s in Lumberton have both been placed into the 2nd.

Safe Republican

NC-3 (Purple)        Walter Jones (R)

40.8-58.3        76.5/14.6/5.5/1.1/0.4/1.8

The 3rd loses its appendage towards Wilson and Rocky Mount and gains one snaking down the rest of the coast to include Republican friendly territory from the current 7th. Jones’ district becomes slightly more Democratic but that shouldn’t be much of a problem for him.

Safe Republican

NC-4 (Red)        David Price (D)

77.4-21.8        41.6/37.9/11.9/5.9/0.4/2.2

The 4th loses all of the southern 3rd and northwestern section of Wake County and instead bisects it to pick up heavily Democratic and minority voters.  The most radical change to the 4th, and what makes this configuration so devastating, is that it extends an arm across Alamance and Guilford counties, picking up very heavily minority and Democratic territory from Greensboro and High Point and in the process screwing over Brad Miller. The 4th is one of the most Democratic districts in the South and would be one of the most Democratic MMD to elect a white Democrat.

Safe Democratic

NC-5 (Yellow)        Virginia Foxx (R)

41.2-57.6        80.7/9.0/7.0/1.6/0.2/1.5

The 5th loses territory around Winston Salem and the counties to the north and west while trading territory with the 11th around Marion, Lenoir, and Hickory.  The district also adds territory in northern Mecklenburg.  Virginia Foxx might have some difficulty here since the 5th has become a moderate amount more Democratic and undergoes a moderate to large change in territory, however this is due to her weakness as a candidate.  Even Foxx should be all right here, and a generic R will have little to no trouble.

Safe Republican

NC-6 (Teal)        Howard Coble (R)

41.0-57.9        75.6/12.8/7.8/1.9/0.4/1.5

The 6th keeps most of its base in Greensboro and suburban Guilford county while the only substantial changes include trading Moore for Chatham county and taking in some outer heavily Democratic precincts in Guilford so that the surrounding Republicans can be shored up. I accidentally drew Coble out of the 6th since he actually lives in Summerfield, but that shouldn’t really be a problem since he’s represented much of the district for decades and probably won’t serve that many more terms anyway. It will probably trend a little Democratic over the decade but should be safe for Coble or any other country club Republican.

Safe Republican

NC-7 (Gray)        Open/Mike McIntyre (D)

63.3-36.0        41.0/37.2/9.5/1.5/8.2/2.6

And here is where the fun begins. I could have just done an 8-3-2 map leaving Shuler and McIntyre in competitive districts, or another configuration of 9-4, but after playing around with DRA a little, I realized it was possible to draw a 4th (heavily gerrymandered) majority-minority district in southeastern NC. So here goes:

The 7th loses most of the whiter parts of its current configuration and adds minority heavy areas to the north in Goldsboro and to the west in territory from the current 8th. Fayetteville is now almost entirely within the 7th. All but one voting block within Mike McIntyre’s hometown of Lumberton is included in the 7th, but that is pretty much irrelevant because McIntyre wouldn’t last two seconds in a primary here seeing as how the district is significantly more Democratic than the current 7th.

Overall, the only reason the GOP would consider allowing for this configuration is that it unambiguously removes Kissell and protects Ellmers and Myrick, but at the cost of securing a seat for a significantly more liberal Democrat than McIntyre.

Safe Democratic

NC-8 (Steel Blue)        Open

40.7-58.4        68.3/18.2/9.5/1.6/0.4/1.9

The 8th here bears no resemblance to the current district and reflects just how screwed Larry Kissell would be since the surrounding districts have gobbled up the entirety of his district.  The new 8th stretches from Wake to Onslow county and is composed mostly of territory from the current 2nd and 3rd. Before 2010 there would have been the chance for a Mike McIntyre clone the right type of Democrat to win here, but Dems got absolutely slaughtered here in 2010 and have a bit of a weak bench.

Safe Republican

NC-9 (Cyan)        Sue Myrick (R)

40.4-58.7        75.8/11.3/8.6/2.4/0.3/1.6

Due to population gains the 9th had to shed a lot of territory and does so by losing all of its area in Gaston and northern Mecklenburg counties.  Since the 9th showed quite a large shift in voting patterns between 04 and 08 I added more conservative territory from the dead carcass of Larry Kissell’s 8th district with the 9th now containing blood red territory to the east of Charlotte.  This district should be safe for Myrick, but it would be interesting to see how it trends over the whole decade due to large gains in population.

Safe Republican

NC-10 (Magenta)        Patrick McHenry (R)

41.9-57.1        78.1/11.4/6.2/2.3/0.3/1.6

The 11th changes significantly in order to allow Republicans to remove Shuler in the neighboring 11th. The district picks up the remnants of the old 9th in Gaston County and reaches an arm into Ashville to annex the majority of its Democratic base.  To compensate for this lunge towards the left, the 10th district trades Democratic leaning Hickory, Lenoir, and Morganton to the 5th in exchange for more dyed-in-the-wool Republicans.  The district becomes significantly more Democratic from extremely safe Republican to just pretty safe Republican, but McHenry now represents a lot of new territory and could be vulnerable to a primary challenge.

Safe Republican

NC-11 (Chartreuse)        Heath Shuler (D)

41.7-57.0        87.6/3.9/5.0/0.7/1.4/1.6

Ah, the other beauty of this map. Since the 9th is able to shift east unhindered by Larry Kissell’s 8th, the 10th is able to also shift east, which provides ultra conservative territory for the 11th to pick up. Ashville and Marion are almost entirely removed from the 11th which deprives Shuler of Democratic base voters, however it is plausible that his appeal to conservative-leaning Dems and Indies could provide a path to victory. Generic R would be heavily favored against Shuler and all but guaranteed against a Generic D.

Likely Republican vs. Shuler

Safe Republican vs. Generic D

NC-12 (Medium Blue)        Mel Watt (D)

73.2-26.1        35.3/43.1/15.3/3.9/0.3/2.1

The 12th loses all of Greensboro, High Point, and Thomasville, but picks up large parts of eastern Charlotte from the old 8th.  There’s nothing else but some minor changes, such as not hugging the county line between Charlotte and Winston-Salem to free up extra Republican voters. There’s no point in crying about not splitting towns and counties when it doesn’t constitute a back door veto on a Democratic gerrymander. Republicans have stated that they won’t draw anything like the current 8th, but it still remains an effective vote sink when drawn from Charlotte to Winston-Salem.

Safe Democratic

NC-13 (Salmon)        Open/Brad Miller (D)

42.0-57.0        77.8/13.0/5.9/1.6/0.3/1.4

Karma has it out for Brad Miller with this map, although pretty much any GOP effort guarantees he’s finished, which is quite a shame.  The 13th loses all of its heavily democratic territory in Greensboro, Burlington, and Cary, and most of it in Raleigh in exchange for the most GOP-friendly parts of northern Wake County. Additionally, the 13th moves westward to pick up large amounts of territory from the 5th by extending across to Yadkin County. Since I didn’t know exactly where Brad Miller lives in central Raleigh, it’s possible he lives in either the 1st or the 13th, but that’s utterly irrelevant since the 13th no longer contains his urban bases in Wake and Guilford counties.

Safe Republican

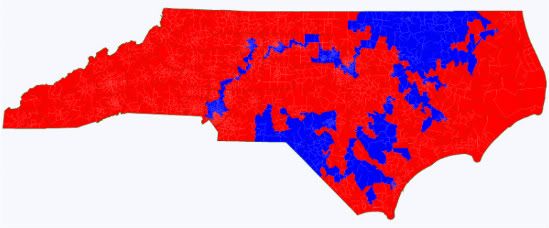
Intended result:

Photobucket

Summary:

Republicans shore up all of their incumbents, most importantly Ellmers and Myrick, while dividing up fast growing Wake and Mecklenburg counties among various buffered districts. Brad Miller, Larry Kissell, and Mike McIntyre are dead men walking. Miller gets replaced by a conservative Republican, Kissell has no district and a conservative Republican wins the new 8th to the east. McIntyre is defeated in the primary by a much more liberal, minority Democrat if he runs in the new 7th. Heath Shuler likely loses to a Republican without the Democratic base in Ashville. Furthermore, by removing Shuler, Kissell, and McIntyre in 2012 the GOP prevents a statewide challenge from a moderate-to-conservative Democratic sitting congressman in 2016.

This configuration is made entirely possible by its four majority minority Dem vote sinks which lock in the 9-4 split, assuming that Shuler loses, for most, if not all of the decade. Additionally, the 4th is a 77%!!!1!1! Obama district yet only 54.2% VAP minority, and is an ambitious radical, socialist, atheist Marxist’s Democrat’s wet dream.

Now… obviously this map would draw myriad lawsuits after all of two seconds, and state Republicans have claimed they won’t attempt anything like the current 12th, but they were also clamoring for independent redistricting until they found themselves in the majority. It’s not sleek and pretty, and it could only care a little less about city and county lines, but if this map has any chance of surviving in court then having 9 safe seats is much smarter for the Republicans than having 8 or 10 shaky seats with the added bonus that anyone who won the 4 Dem districts would likely be too liberal to win statewide.

And as an added bonus, North Carolina with 5 majority minority districts:

Photobucket

All are majority minority voting age population, and the first remains majority black, but barely so.

What do you all think?

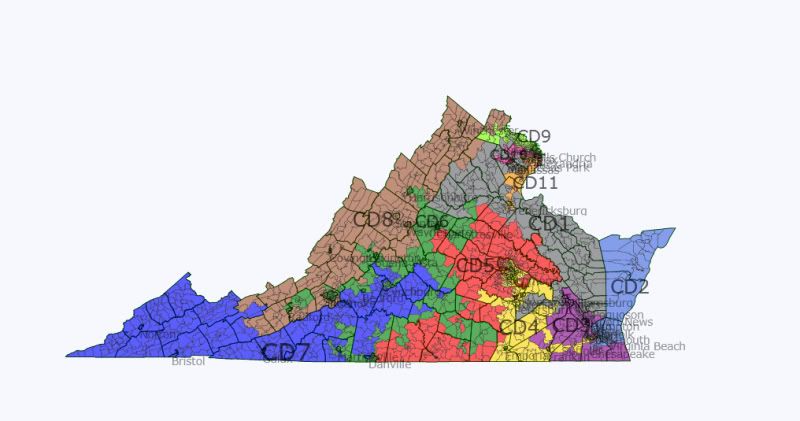
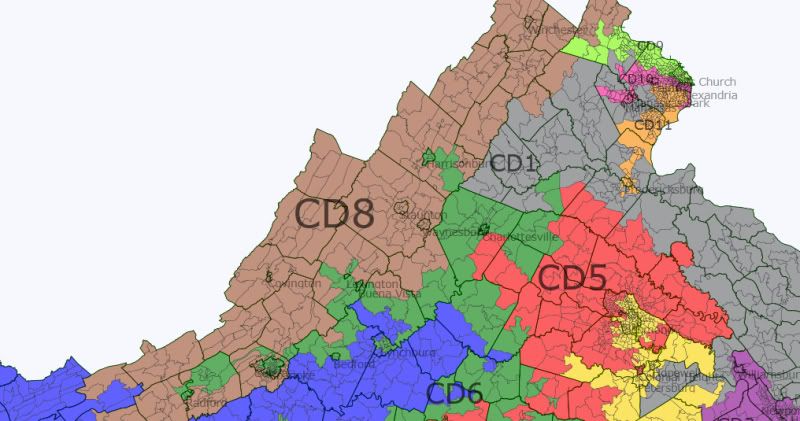
Virginia: A Democratic gerrymander of the Old Dominion

As a native Virginian and Democrat, I was very excited when Dave was able to add voting data for Virginia to his redistricting app because of how it would ease tinkering with Virginia.

Naturally, the map I produced here is entirely unrealistic, if not because of the shape and scope of some of the districts I drew but because of the fact that the GOP controls the Virginia House of Delegates and the governor’s mansion. With the Democrats controlling the State Senate, it seems likely that a incumbent-protection map will be drawn this time around.

However, I set this map up to create the opportunity for Democrats to control seven of the state’s eleven House seats. The result was more or less a 6-1-4 map (7-4), with a D+3 seat in the Tidewater as the swing-iest district.

Without further adieu, here is the final product:

Photobucket

VA-01 (Gray)

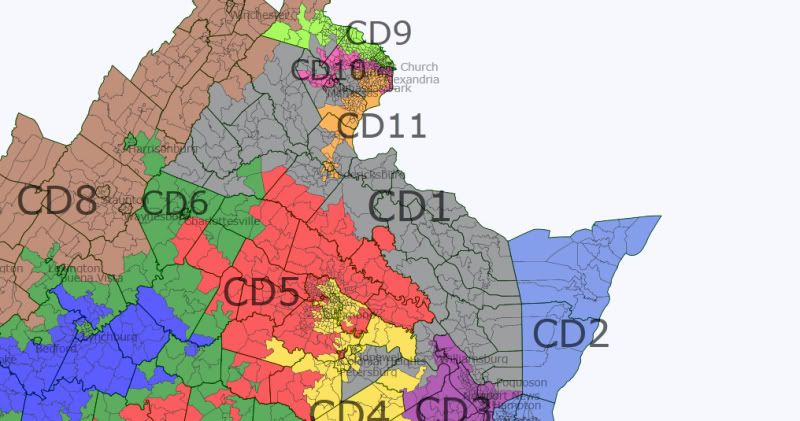
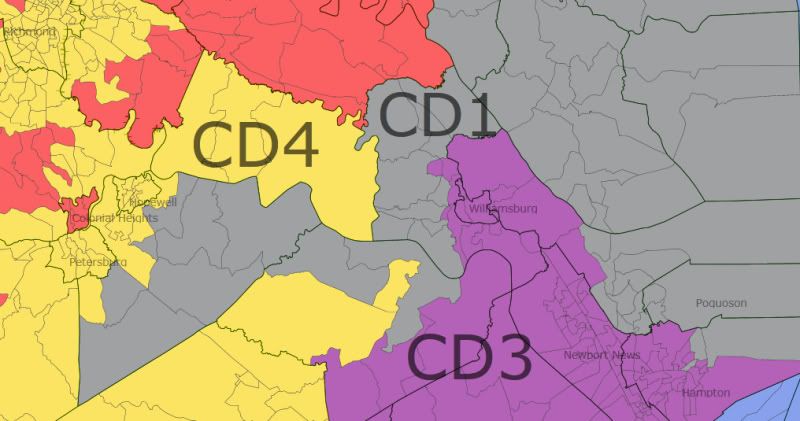
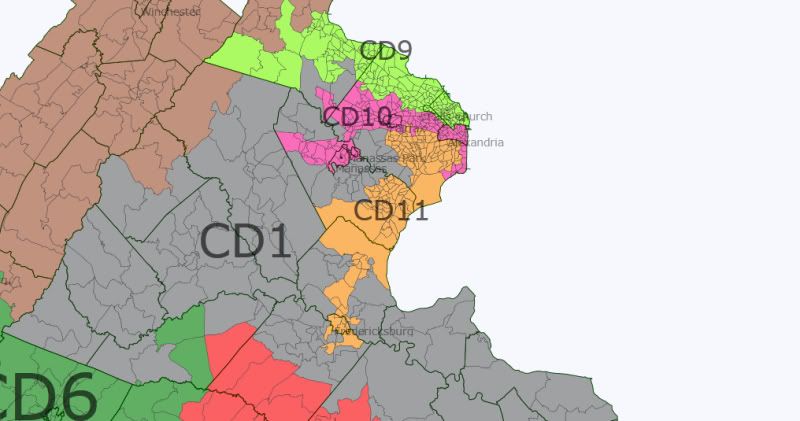
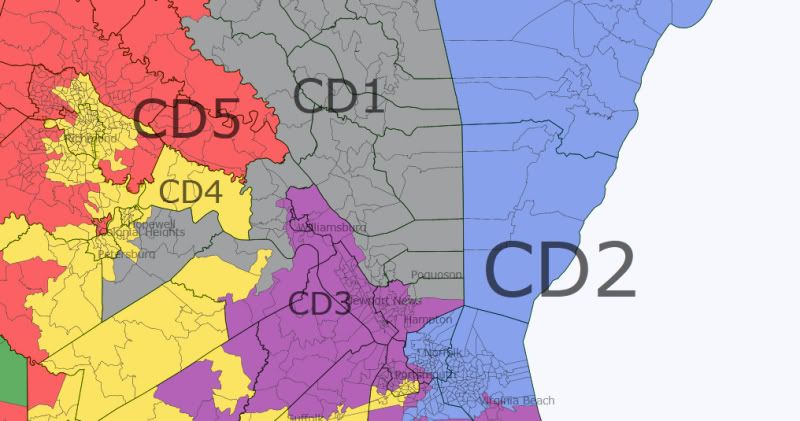
Appropriately, we’ll start with CD-1, which stretches northwest from its most southern point in eastern Hampton in the Tidewater (as well as below Richmond) to the edge of the Blue Ridge Mountains in Greene and Madison Counties, as well as all the way into the outer D.C. suburbs. Clearly, communities of interest did not come into play with this map.

Photobucket

Here’s the part that goes south of Richmond and Petersburg and down into eastern Hampton:

Photobucket

And the northern part of the district:

Photobucket

The statistics for this district as follows (NOTE: Dev. stands for deviation from the ideal population total):

Photobucket

VA-02 (Blue)

The Virginia 2nd is the most contestable district on this map with only a slight Democratic edge. Encompassing the Eastern Shore, part of Virginia Beach, and part of Norfolk, it could be best held by an ex-military moderate Dem, given the large military community in the area. Just don’t bring back Glenn Nye, please.

Photobucket

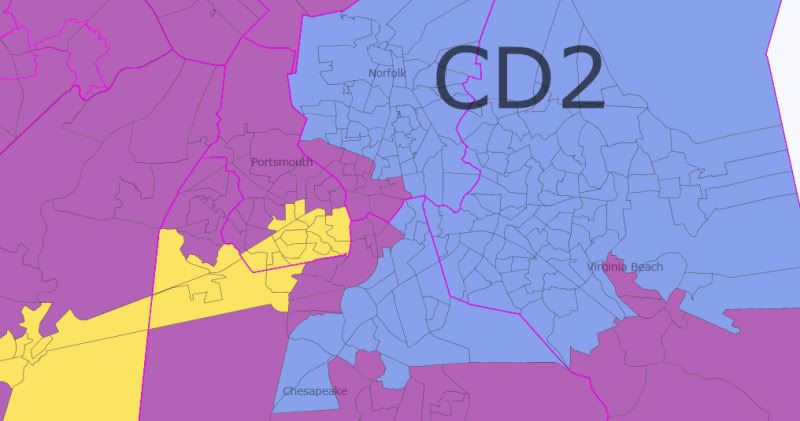
Here is the Virginia Beach/Norfolk part of the district, with the city outlines highlighted in pink:

Photobucket

The most Republican parts of Virginia Beach and Chesapeake are taken by VA-03 to give this district its slight Dem lean.

And the statistics for this district:

Photobucket

VA-03 (Purple)

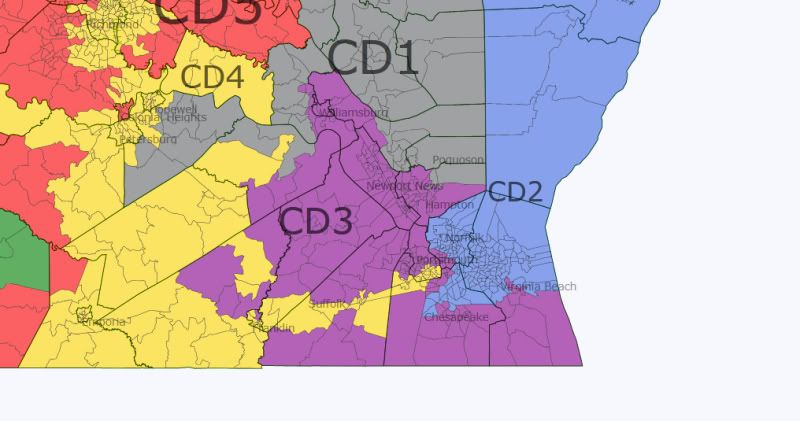
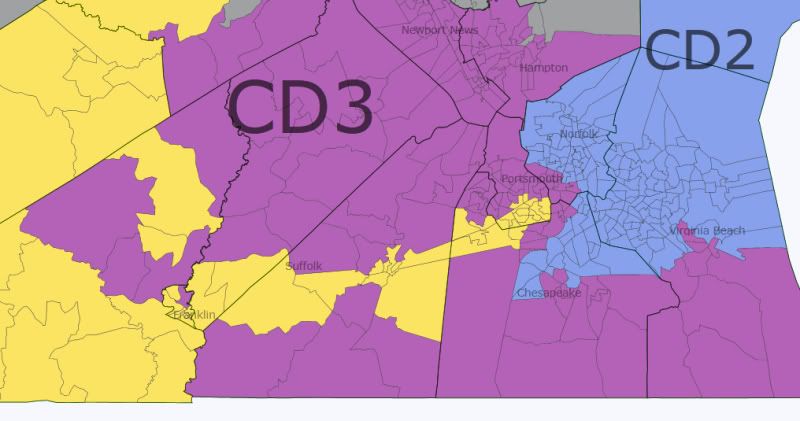
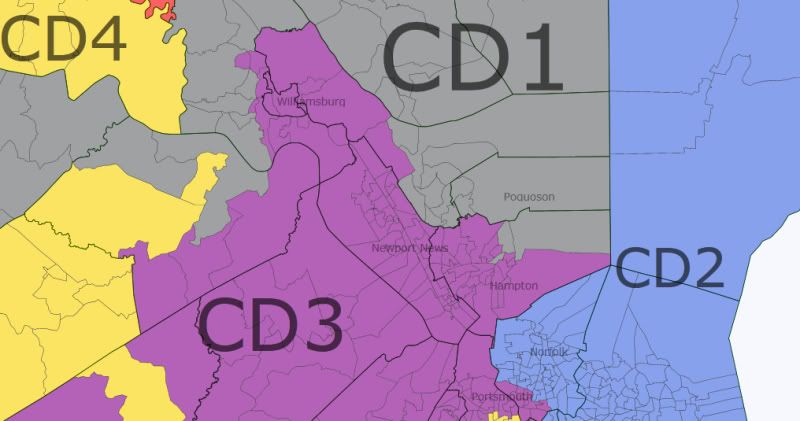
The third Congressional District takes up parts of the current VA-03 represented by Bobby Scott but is not a minority-majority district.

Photobucket

It is not a strong Dem district but it has a very solid Democratic base in its portions of Hampton, Newport News, and its small parts of Norfolk and Portsmouth. If I had left the parts of Chesapeake and Virginia Beach that are in this district in VA-02, I could have made that district about 50-50 and this one more than 60-40 but again, I was trying to make a map with a good shot at seven Democratic representatives.

Here is the part of the district that winds around central Suffolk. One side goes into the southwest corner of Suffolk, which is one of the fastest-growing cities in the state, growing more than 25% between 2000 and 2010. The other juts into Southampton County above Franklin, taking one precinct from that small independent city (a 52-48 McCain precinct).

Photobucket

Here’s the Newport News/Hampton section of VA-03, also encompassing the city of Williamsburg with its university population from the College of William & Mary.

Photobucket

Lastly, the statistics for this district:

Photobucket

VA-04 (Yellow)

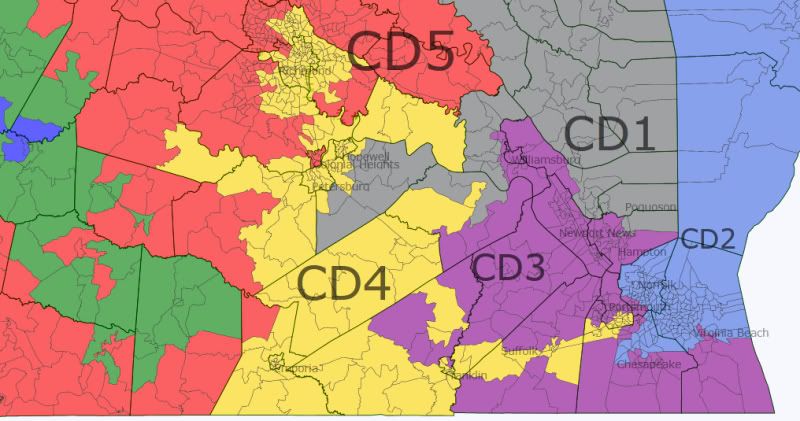
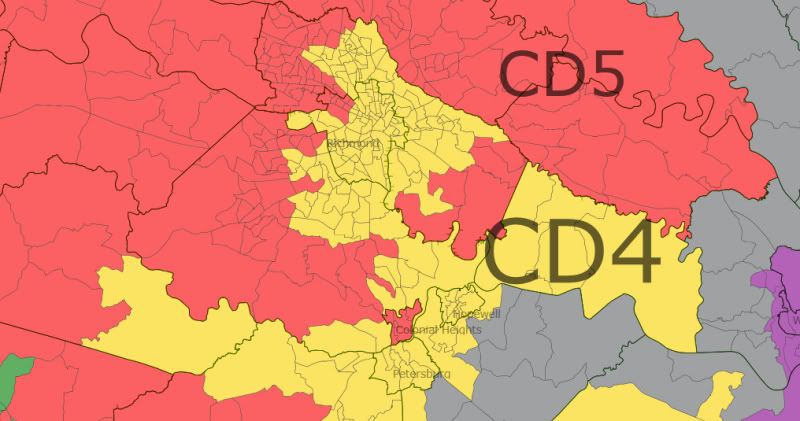
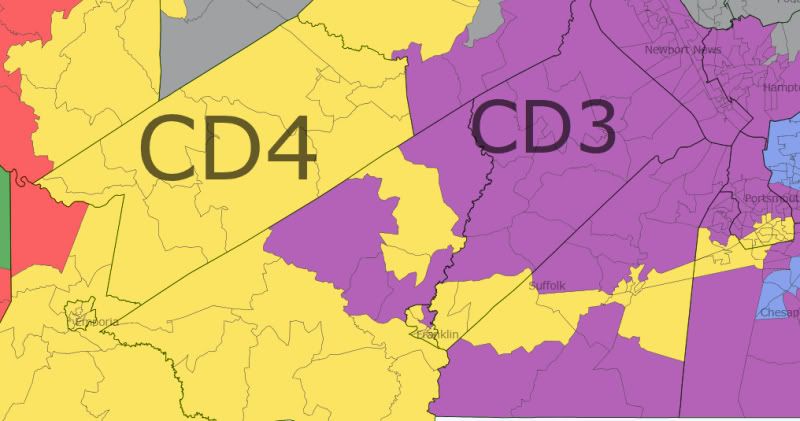
Here we have the VRA required minority-majority district. Fifty percent of the population is black; it is also about 6.5 percent Hispanic. It is chiefly made up of the state capital, Richmond, as well as probably the most African-American city in the state, Petersburg. It stretches down into Emporia and all the way east through Suffolk, Chesapeake, and into Portsmouth to also pick up more minority-heavy precincts. I would have preferred to leave the district at 46 or 47 percent, with blacks + Hispanics equaling over 50 percent but I’m under the impression that the law and the nature of Virginia politics would necessitate the minority-majority district having at least a 50 percent African-American population.

Photobucket

Here is the Richmond, Petersburg, and Hopewell section:

Photobucket

And the Suffolk and Portsmouth part:

Photobucket

The statistics for this district:

Photobucket

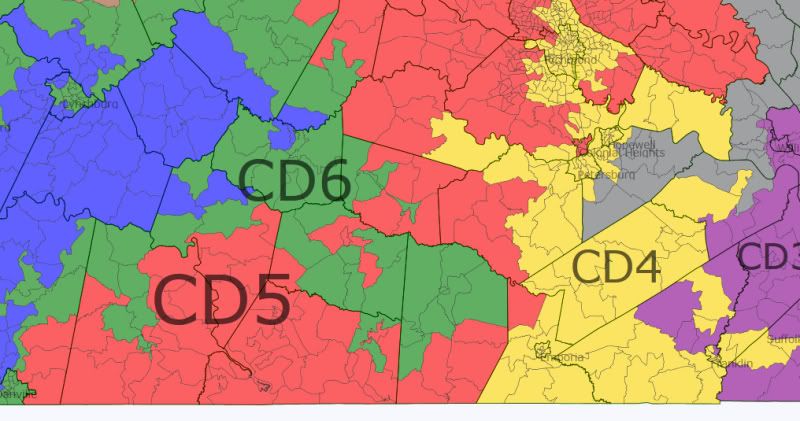
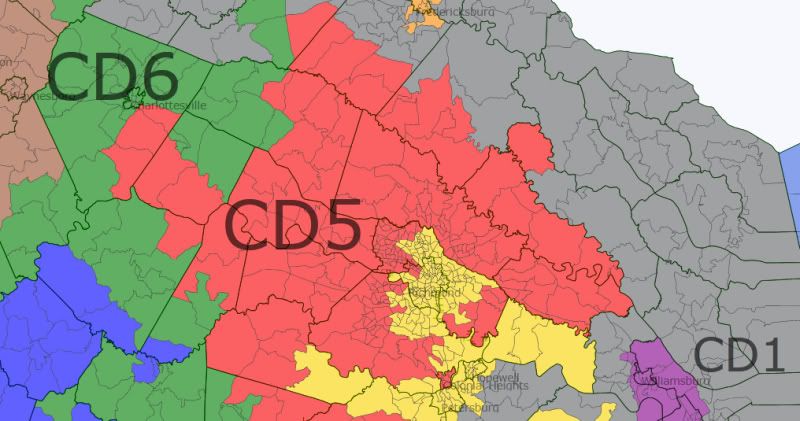
VA-05 (Red)

Despite what it may look like, this district is contiguous. Barely.

Photobucket

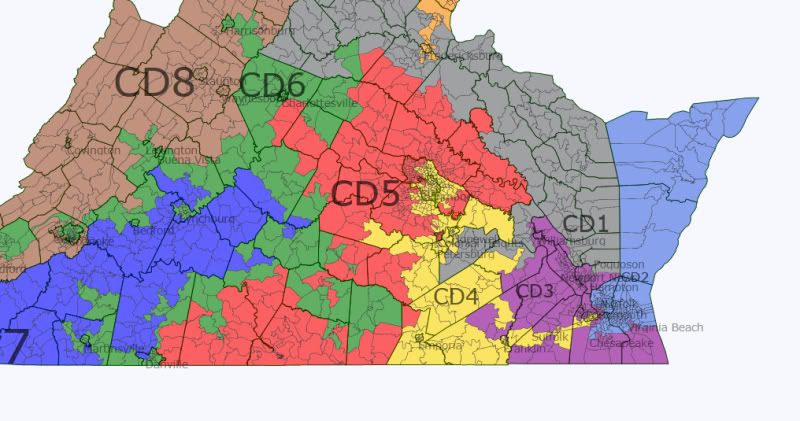
The district is made up of suburban Richmond and snakes all the way down to and along the North Carolina border for quite some distance. Just north of Emporia, at the top of Greensville County, the district barely connects west to part of Brunswick County to remain contiguous.

Photobucket

The district also makes its way up north to part of Spotsylvania County, not far away from what Virginians typically refer to as Northern Virginia.

Photobucket

The statistics for VA-05:

Photobucket

VA-06 (Green)

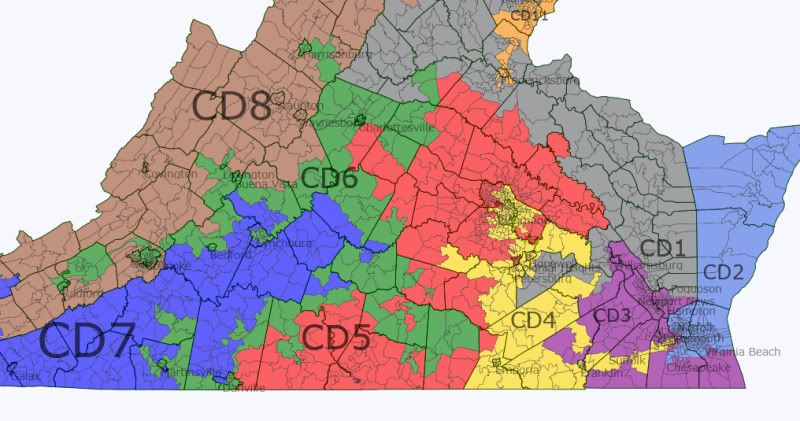
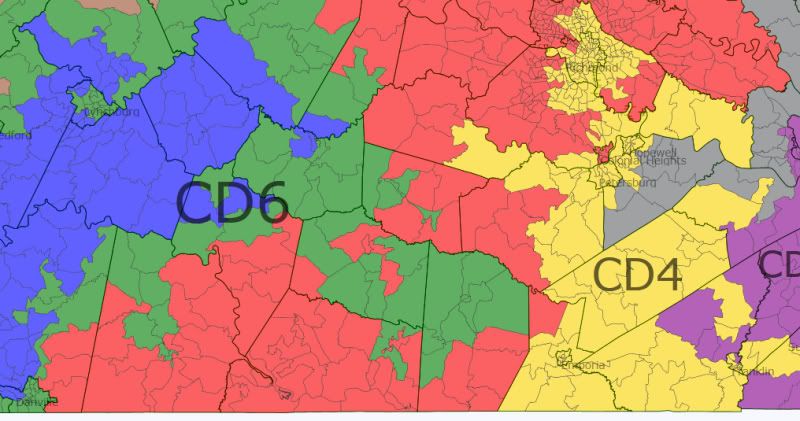
The most convoluted and gerrymandered district on this map is most certainly the sixth district. A friend of mine looked at what I had created and called it the “Virginia Python,” which seems an apt name for it. It essentially connects a series of college towns and strong minority areas to form a fairly Democratic district.

Photobucket

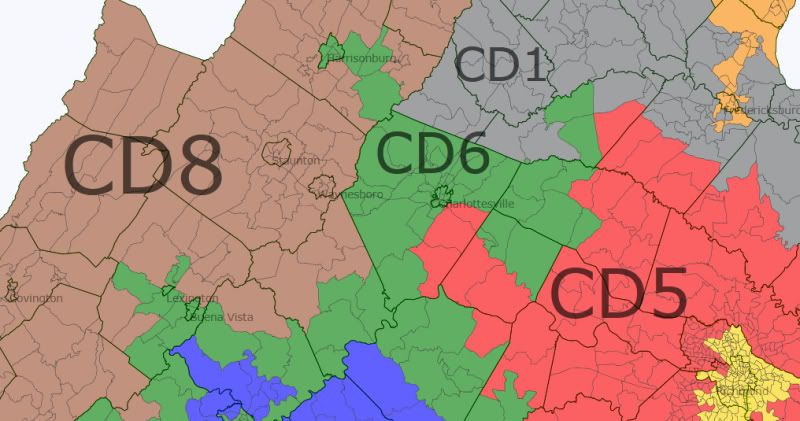
In the northern part of the district we have the liberal bastion of Charlottesville, where my alma mater, the University of Virginia, is located. Surrounding the city is Albemarle County, an increasingly blue part of the state. The most northern part of this district, however, is my home city of Harrisonburg, which is a university town as well (James Madison University and a small Mennonite college). The demographic trends of that city are the kind you want to see in a Democratic district. It has gotten bluer and bluer with each Presidential election as both the student population and the Hispanic population have grown steadily. In fact, the city of Harrisonburg is, per capita, one of the most diverse cities in the state. Each of its five precincts is over 8 percent Hispanic, with two having 16 and 18 percent, and one with 28 percent.

You’ll notice that the district also extends to Lexington in the west, the home of Washington & Lee University (and the Virginia Military Institute, though I expect it is not the major source of the town’s 61 percent Obama vote).

Photobucket

Moving southeast, the district meanders through parts of southern Virginia that have heavy black populations, as well as another university town, Farmville, where Longwood University is located.

Photobucket

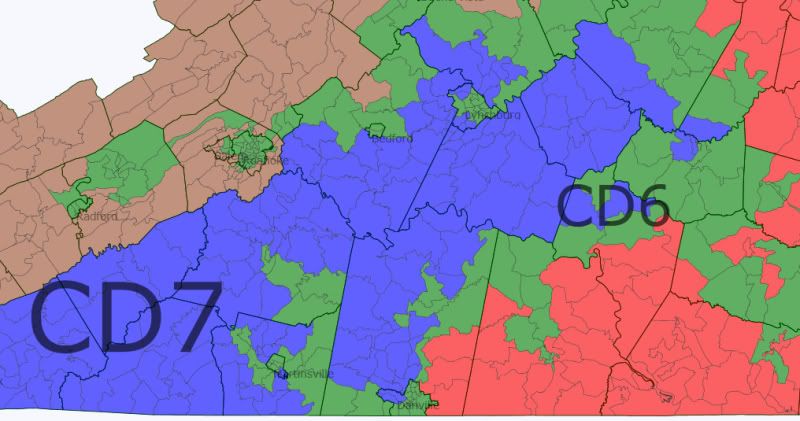
Lastly, as we move southwest, the district passes through the most Democratic parts of Lynchburg but more importantly this part of the district makes its way down to Roanoke, Blacksburg, and Radford. Roanoke is the largest city in the western part of the state, with about 97,000 people as of the 2010 census. Blacksburg, the home of Virginia Tech (the state’s biggest university) and Radford (home of Radford University) are also blue areas this district takes in.

To the very far south, the district adds in the fairly African-American cities of Danville and Martinsville, as well as the areas of Halifax, Pittsyvlania, Henry, and Franklin Counties that are more Democratic.

Photobucket

The statistics for the “Virginia Python”:

Photobucket

VA-07 (Navy Blue)

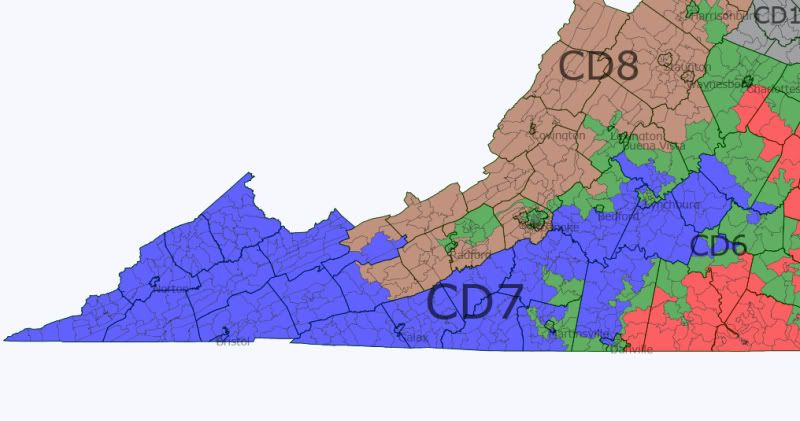
This is the most conservative district on the map, stretching from the far west corner of what is really Southwest Virginia (SWVA) into the more central southern part. SWVA has a strong union tradition in some of its counties due to the coal industry; however, the strength of unions and Democrats in general is clearly on the wane, illustrated by the surprising (to some) loss by Blue Dog Rick Boucher in the current VA-09 that makes up much of this area in 2010.

Photobucket

The statistics for VA-07:

Photobucket

VA-08 (Brown)

This conservative district makes up much of what is currently the VA-06 represented by Republican Bob Goodlatte. It stretches from Wytheville in SWVA to Winchester around the Maryland border.

Photobucket

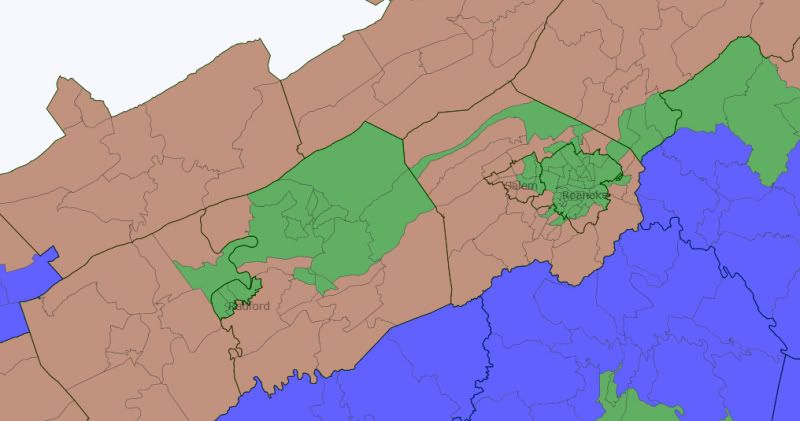
I drew VA-08 to curl around Radford, Blacksburg, and Roanoke while taking much of Salem (a much more conservative independent city than most any part of Roanoke right next door). Here’s a close up of that:

Photobucket

The statistics for this district:

Photobucket

VA-09 (Neon Green)

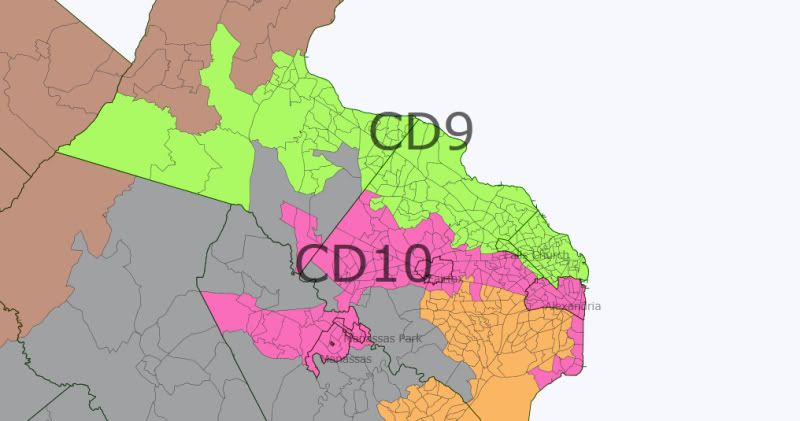
Finally, we have reached Northern Virginia (NoVA), the strategic lynch-pin in all Virginia Democratic strategies from here on out. This is the area of the state that is key to the transformation of Virginia from a sure-thing in the Republican column to its new status as a swing state. In drawing three NoVa districts, I wanted to create a fairly well-balanced trio that would all be strongly Democratic. VA-09 is the “Arlington” district in NoVA, encompassing the very blue county that abuts Washington, D.C. The district also makes it way through Falls Church and out all the way into the more developed and liberal parts of Loudon County, the fastest growing county in the state, which saw a more than 30 percent increase in population from 2000 to 2010.

Photobucket

The statistics for this district:

Photobucket

VA-10 (Pink)

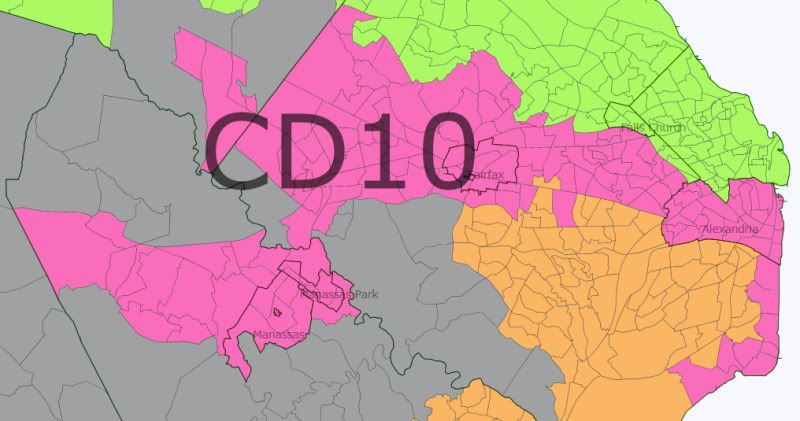
VA-10 contains all of Alexandria, one of the bluest cities or counties in Virginia, but also meanders out through Fairfax City, and all the way west to Manassas, taking in large chunks of Fairfax County, the state’s most populous entity (over 1 million people) in the process. The demographic and political trends of this area are generally favorable for Democrats, and having Alexandria in it almost guarantees that the district would remain blue even in the worst year for Democrats.

Photobucket

The statistics for this district:

Photobucket

VA-11 (Orange)

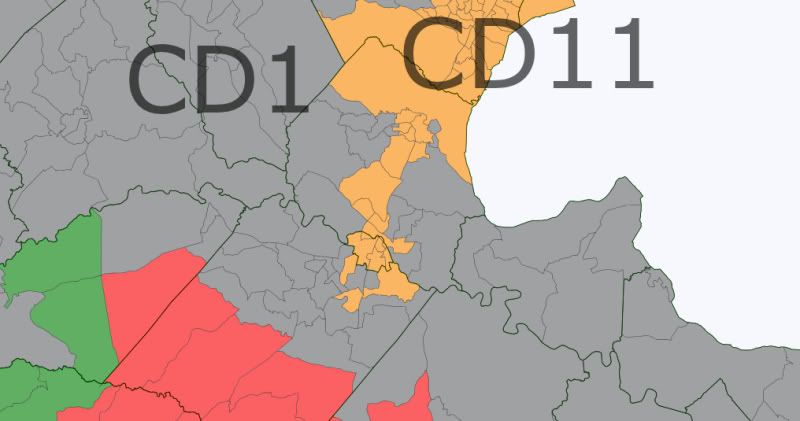
Lastly, VA-11 is made up of most of the most Democratic sections of Fairfax County (those directly next to Arlington and Alexandria) but runs through the Democratic-trending Prince William County and all the way to Fredericksburg, a growing city that is also a university town (Mary Washington University) and whose suburbs in Stafford County are increasingly Democratic.

Photobucket

The statistics for VA-11:

Photobucket

The overall statistics for the districts on this map:

Photobucket

Clearly, the four GOP districts are all vote sinks that would be sure-things in every election. Perhaps from the state party level this is not a great situation for Democrats because the VA GOP could focus all its resources on VA-02, as well as VA-06 and VA-03, without risking its hold on VA-01, VA-05, VA-07, and VA-08. At the same time, this map gives Democrats a good shot of holding seven seats a fair amount of the time, or at least six (a majority). Anyway, thanks for reading, Comments are definitely appreciated.

Virginia I hardly knew ye (6R-5D w/o Wolf)

You know, I've got to say, I find it interesting that so many people think that Virginia must be destined to have a shored up 8-3 map (with Gerry Connolly's 11th district being only marginally Democratic!) With Democrats still in control of the senate, I find it hard to believe that they're just going to just allow the Republicans to hold so many seats (and just shore them up). This map is probably not the one that gets made (I don't know where incumbents live and as such I probably drew a few out of where they live), but I think it's a lot closer to what Democrats are going to try for rather than just allowing Republicans to strengthen all of their seats. So my goal here was to keep 5 Republican incumbents, shore up Gerry Connolly, weaken Scott Rigell, and make Frank Wolf's district more Democratic (thus giving us the seat when he retires).

With that said, my vision for Virginia below the fold:

(Parentheses denote previous district numbers)

VA-05 (Yellow, Robert Hurt – R)

Dem 46.7% Rep 53.3% (Dem 47.3% Rep 52.7%)
Obama 48.2% McCain 51.8% (Obama 48.5% McCain 51.5%)
Black 22%, White 71.4%
Population 727,824

Notes: Not very much has changed here, though what changes happened favor the Republicans (the change might be slight, but Tom Perriello would have lost against Virgil Goode in 2008, small changes can make big differences). Robert Hurt probably won't complain too much about this district. (Likely R)

VA-06 (Blue-Green,  Bob Goodlatte – R)

Dem 40.9% Rep 59.1% (Dem 42.1% Rep 57.9%)
Obama 42.3% McCain 57.7% (Obama 43.2% McCain 56.8%)
Population 727,426

Notes:  In order to make VA-10 more Democratic, I needed to have this district absorb the more Republican parts of NoVA, but given that either way VA-10 needed to shrink, it's a good bet that something like this would have happened anyways. The district is heavily Republican and still retains Roanoke so Goodlatte can continue being re-elected indefinitely). (Safe R)

VA-07 (Grey, Eric Cantor – R)

Dem 42.2% Rep 57.8% (Dem 43.3% Rep 56.7%)
Obama 45.2% McCain 54.8% (Obama 46.6% McCain 53.4%)
Black 15%, White 74.5%
Population 726,655

Notes: Assuming Cantor still lives in the district (which is likely given that I didn't change the district much) he's going to be very happy with its configuration, he becomes safer now. (Safe R)

VA-09 (Bright blue, Morgan Griffith – R)

District profile (old numbers)

Dem 44.2% Rep 55.8% (Dem 43.7% Rep 56.3%)
Obama 41% McCain 59% (Obama 40.3% McCain 59.7%)
Population 727,973

Notes: So VA-09 doesn't really change too much, the district becomes somewhat more Democratic, although I doubt it matters much, as it's still going to be pretty safe for Morgan Griffith, unless Rick Boucher decides to run again. Safe R (Leans R if Boucher runs).


VA-01 (Blue, Rob Wittman – R)

Dem  42.5% Rep 57.5% (Dem 44.8% Rep 55.2%)
Obama 45.7% McCain 54.3% (Obama 48.4% McCain 51.6%)
Black 15.7% White 73.1%
Population 727,330

Notes: This map shores up Wittman, and ensures that even in an open seat situation it'll stay with Republicans (Safe R)


VA-02 (Green, Robert Hurt – R)

Dem  52.4% Rep 47.6% (Dem 49.1% Rep 50.9%)
Obama 56.5% McCain 43.5% (Obama 52.4% McCain 47.6%)
Black 27.4%, White 57.2%
Population 727,531

Notes: I'm not going to lie, this district is meant to make life difficult for Scott Rigell, and I think I succeeded. To be honest, I doubt that Glenn Nye would have beaten Rigell in 2010, but then again, another Democrat could probably do it, particularly with Obama on the ballot. (Toss-up against Rigell/Likely D Open)


VA-04 (Red, Randy Forbes – R)

Dem 46% Rep 54% (Dem 48.2% Rep 51.8%)
Obama 48.3% McCain 51.7% (Obama 51% McCain 49%)
Black 29.5% White 61.6%
Population 726,491

Notes: This district shores up Forbes somewhat, it goes from a district that Obama won by two to won he lost by two and a half. In an open seat in the right year this district could be trouble for the Republicans, but even then they'd be favored. (Likely R)


VA-03 (Purple, Robert Scott – D)

Dem 70.1% Rep 29.9% (Dem 71.3% Rep 28.7%)
Obama 74.8% McCain 25.2% (Obama 75.7% McCain 24.3%)
Black 52.5%, White 36.6%
Population 727,748

Notes: Well this monstrosity is a carry-over from the last map, to be honest, I'm not sure if the VRA requires this district to be majority-black or simply majority-minority but I kept it like this just to be safe. If I hadn't there's a good possibility I could have made the fourth more Democratic (probably not enough to give Forbes any problems, but enough to make it competitive in an open seat).


Virginia Bipartisan Map: 7-4 (Updated with Vote Totals)

Cross posted on my blog http://frogandturtle.blogspot…. which you should visit for more redistricting maps.

I was reading the recent diary on Virginia redistricting and saw people calling for a 7-4 Republican map. I decided to post this one to see how it works.

Both parties have a voice in Virginia’s redistricting process this year so expect either a quick compromise or a long battle that ends in a court drawn map. The Republicans control the Governorship and the State House but the Democrats control the State Senate. The Republicans hold an 8-3 majority of Virginia’s House seats, 3 of them were won in 2010. The Republicans will want to protect their freshman Robert Hurt (R) and Scott Rigell (R) who won in swing districts as well as Frank Wolf (R) whose district is trending Democratic. Trying to protect them all will be difficult because the Republicans will not want to create a dummymander. Therefore, I drew a 7-4 Republican map that the Republicans will like because although they lose one district, the 2nd and 5th districts are now more Republican. The Democrats should like this plan too because it strengthens the 11th district and creates a new Democratic district. I also ensured that the 3rd district’s African American population exceeded 50%. As for the districts on the map, there are 3 Safe Democratic, 1 Likely Democratic, 1 Lean Republican, 2 Likely Republican and 4 Safe Republican.

Here is a link with a map of Virginia’s current congressional districts (after clicking the link, scroll down to the bottom of the page:) http://www.nationalatlas.gov/p…

A few notes: The “Average 2000-2009” refers to the average performance of Democrats and Republicans in that district from 2000 to 2009. Change does not refer to the average performance; change refers to how well Obama performed in the new district compared to the old one. “Old Demographics” refers to the demographics of the old district in 2000.

Photobucket

Virginia

Virginia’s 1st Congressional District Rob Whitman (R) Blue

President 2008: Obama 143,841 47%, McCain 165,688 53%

Average 2000-2009: Democrats 101,210 44%, Republicans 128,630 56%

Change: McCain +3

Demographics: 6.1% Hispanic, 19.7% African American, 68.8% White

Old Demographics: 18.4% African American, 74.7% White

Status: Safe Republican

This district becomes more Republican as it loses parts of Newport News and Hampton in the south and losing Democratic Prince William County in the north. To keep population equal with other districts, the 1st district gains Republican leaning rural counties such as New Kent. The 1st district also picks up the Delmarva Peninsula which leans Democratic but the removal of most of Newport News makes this district more Republican.

Photobucket

Hampton Roads

Virginia’s 2nd Congressional District Scott Rigell (R) vs. Randy Forbes (R) ? Green

President 2008: Obama 139,807 48%, McCain 152,608 52%

Average 2000-2009: Democrats 101,215 46%, McCain 121,240 54%

Change: McCain +6

Demographics: 5.0% Asian, 5.9% Hispanic, 21.3% African American, 64.2% White

Old Demographics: 21.4% African American, 67.0% White

Status: Lean Republican

I could not do much to strengthen Rigell because I had to keep the 3rd district majority African American so it could not pick up many precincts that voted for Obama and had a low African American population. Anyway, I strengthened Rigell a bit by removing Hampton and most of Norfolk. I also added Republican parts of Chesapeake where Rep. Randy Forbes (R) of the 4th district lives. If he chooses to run in the 2nd, he will have the seniority advantage but more of Rigell’s current district is in the 2nd. Also, Forbes is popular because although Obama won his district, Forbes has won easily in the past few elections.

Virginia’s 3rd Congressional District Bobby Scott (D) Dark Magenta

President 2008: Obama 194,505 69%, McCain 85,991 31%

Average 2000-2009: Democrats 123,854 64%, McCain 69,604 36%

Change: McCain +14

Demographics: 51.3% African American, 39.0% White

Old Demographics: 56.0% African American, 37.7% White

Status: Safe Democratic

Scott’s district gets more Republican as it loses all of Richmond and picks up less Democratic precincts from the 1st in Newport News. I kept the district majority African American by picking up African American areas in Suffolk, Petersburg, and Sussex County. Although Scott’s district becomes more Republican, it is still extremely safe for him and majority African American. He should have no problems winning reelection.

Photobucket

Richmond Area

Virginia’s 4th Congressional District Robert Hurt (R) vs. Randy Forbes (R) ? Red

President 2008: Obama 133,903 42%, McCain 187,735 58%

Average 2000-2009: Democrats 97,669 41%, Republicans 142,126 59%

Change: McCain +17

Demographics: 23.3% African American, 71.1% White

Old Demographics: 33.1% African American, 62.0% White

Status: Safe Republican

Forbes may run here because this district contains some of his current territory in Chesterfield County and some southeastern rural counties. Hurt will run too because his home Chatham is in this district. If Forbes ran, As for Hurt’s district, I strengthened it because the Republicans will try to protect him from a tough race. I removed heavily Democratic Charlottesville from Charlottesville while adding parts of the current 4th district such as Republican Amelia County near Richmond. Hurt should have no trouble winning reelection here.

Virginia’s 5th Congressional District Vacant Eric Cantor (R) ? Yellow

President 2008: Obama 129,143 43%, McCain 175,646 57%

Average 2000-2009: Democrats 92,922 40%, McCain 137,356 60%

Change: N/A

Demographics: 5.4% Hispanic, 10.8% African American, 79.9% White

Old Demographics: N/A

Status: Safe Republican

Cantor’s 7th district is now Democratic so I expect him to run here, although his home is in the 7th district. The 5th district contains much of his current territory by including some conservative rural counties near Richmond such as Goochland, Hanover County in the Richmond exurbs, Spotsylvania County in the D.C exurbs and the string of rural counties in Central Virginia in Cantor’s current district. The 5th district also picks up some far D.C exurbs though because it represents Winchester and western Loudon County. Cantor used to represent a 53% McCain district that was trending Democratic but his district is now 55% McCain and the rural areas are not trending Democratic. Cantor should be safe here.

Virginia’s 6th Congressional District Bob Goodlatte (R) Teal

President 2008: Obama 137,543 46%, McCain 162,585 54%

Average 2000-2009: Democrats 102,396 44%, Republicans 130,058 56%

Change: Obama + 7

Demographics: 9.1% African American, 82.2% White

Old Demographics: 10.9% African American, 84.8% White

Status: Safe Republican

Goodlatte’s district becomes more Democratic as it loses heavily Republican Amherst County and picks up Charlottesville. The Republicans will probably want Charlottesville in Goodlatte’s district because it provided Tom Perrellio with his winning margin and more in 2008 and Goodlatte has enough Republicans in his district to offset Democratic votes in Charlottesville. Goodlatte should be safe here.

Virginia’s 7th Congressional District Vacant Gray

President 2008: Obama 186,082 61%, 121,294 McCain 39%

Average 2000-2009: Democrats 124,386 54%, Republicans 105,495 46%

Change: N/A

Demographics: 6.7% Hispanic, 34.5% African American, 52.0% White

Old Demographics: N/A

Status: Safe Democratic

Republicans may decide to sacrifice one district in order to protect Robert Hurt and Eric Cantor. The 7th district also helps Scott Rigell (R) in the 2nd district because by losing Richmond, the 3rd district has to pick up African American areas currently in the 2nd district so the 3rd can remain majority African American. Anyway, the 7th district is a combination of the current 3rd, 4th and 7th districts. The 7th contains all of Richmond, all of Henrico County, Chesterfield County’s close in suburbs and Hopewell. In the current map, the Richmond area is split between three districts but the Richmond area now has its own district so Richmond area legislators should like this district. Possible candidates for this seat could be State Senator Donald McEachin (D) who represents part of Henrico County or Henry Marsh (D) who represents some heavily African American parts of the district.

Photobucket

Northern Virginia

Virginia’s 8th Congressional District Jim Moran (D) Slate Blue

President 2008: Obama 178,372 66%, McCain 92,487 34%

Average 2000-2009: Democrats 146,592 64%, Republicans 82,791 36%

Change: McCain +7

Demographics: 12.5% Asian, 16.5% Hispanic, 9.9% African American, 57.9% White

Old Demographics: 9.5% Asian, 16.4% Hispanic, 13.4% African American, 57.1% White

Status: Safe Democratic

Moran’s district does not undergo major changes as Moran retains his base in Arlington and Alexandria. His district becomes a few points more Republican in order to protect Gerry Connelly (D) of the 11th district. Moran loses the close in suburbs near Alexandria such as Fort Washington to the 11th District. To compensate for the loss of the close in suburbs near Alexandria, the 8th district gains Democratic parts of McLean, Oakton, Herndon and Tysons Corner. Although Moran’s district is not as Democratic as its current form, Moran should have no problems winning reelection in the general or the primary.

Virginia’s 9th Congressional District Morgan Griffith (R) Periwinkle

President 2008: Obama 111,232 40%, McCain 166,719 60%

Average 2000-2009: Democrats 94,587 43%, Republicans 123,531 57%

Change: McCain +1

Demographics: 3.7% African American, 92.1% White

Old Demographics: 3.8% African American, 93.3% White

Status: Likely Republican

Griffith’s district does not undergo major changes as he loses Alleghany County which usually votes Democratic at a local level. The 9th district had slow population growth so the 9th gained Franklin and Bedford Counties which are both strongly Republican. It is possible Rick Boucher (D) who previously held this district will run again but it will be more difficult for him because of the new Republican counties in the district. Anyway, it was difficult to strength Griffith without creating convoluted lines or making the 6th district Democratic enough for a competitive race.

Virginia’s 10th Congressional District Frank Wolf (R) Deep Pink

President 2008: Obama 149,174 53%, McCain 132,937 47%

Average 2000-2009: Democrats 107,560 49%, Republicans 113,791 51%

Change: McCain +1

Demographics: 17.9% Asian, 11.0% Hispanic, 6.9% African American, 60.7% White

Old Demographics: 6.6% Asian, 7.1% Hispanic, 6.7% African American, 77.2% White

Status: Likely Republican

Northern Virginia is trending Democratic so drawing Wolf a district that will be safe Republican in the long term is impossible but I drew a district that should protect him for the next few years. I removed the western part of the district around Winchester which leans Republican but I also removed the Democratic parts of Herndon, McLean and Manassas. Although the 10th district is growing quickly, it had to gain a few more areas so it gained some moderate areas near Fairfax City and some conservative parts of Prince William County. Wolf is popular so he should hold this seat. If he retires though, Democrats will have a shot here.

Virginia’s 11th Congressional District Gerry Connelly (D) chartreuse

President 2008: Obama 149,097 60%, McCain 99,321 40%

Average 2000-2009: Democrats 105,702 55%, Republicans 88,099 45%

Change: Obama +5

Demographics: 10.6% Asian, 21.4% Hispanic, 17.4% African American, 46.9% White

Old Demographics: 10.9% Asian, 9.1% Hispanic, 10.1% African American, 66.8% White

Status: Likely Democratic

Connelly faced a tough race last year from Keith Fimian (R) in 2010 which is a high water mark for Republicans. If Connelly could survive in 2010, he can survive any year barring a major scandal. Anyway, I strengthened Connelly so he would not have another tough race. I removed the moderate areas near Fairfax City, Fimian’s home Oakton, and conservative parts of Prince William County. I added Democratic areas near Alexandria and Democratic Manassas. These changes should protect Connelly

By what margin will Bob Shamansky win?

View Results

Loading ... Loading ...
WI-State Senate: Population by District

With the release of census data for Wisconsin, we can also crunch population numbers by State Senate district – and to see potentially how redistricting could affect the various senators with recall campaigns mounted against them.

Without further ado, here’s the table – the eight rows highlighted in green are the eight recallable Republican senators.

As also shown in the data by Congressional district, there’s a shift from Milwaukee to Madison, population wise.  The Milwaukee County based districts (3rd – 8th) are all quite underpopulated, while the Madison-based 16th, 26th, and 27th are now overpopulated.  The MSP exurbs – now expanding into St. Croix County – have also grown, as shown in the overpopulation in the 10th (Harsdorf, R).

Will this affect the Recallable 8?  I’m skeptical – it’s unlikely, IMO, that we’ll get anything friendly from an unfriendly trifecta. Likely, the relative stability means that not too much will have to change – most of the recallable eight have districts that were stable population wise.  Harsdorf’s 10th will have to lose some – but that could be easily some Dem-leaning territory given to Robert Jauch’s 25th (D).

The Milwaukee County districts will need to expand outward…which could conveniently remove the Dem-leaning North Shore from Alberta “anything but” Darling’s 8th.  Additionally, given that Milwaukee County is surrounded on three sides by heavily Republican suburbs, it’s pretty easy to slice that pizza.  On the flip side, the growth in Dane County hasn’t reached a point yet where that would have to be sliced four ways.

So, unless we actually manage to recall Hopper, Darling, Kapanke, et al., the census numbers don’t necessarily indicate any help to come from Senate redistricting…especially not with an unfriendly legislature drawing the maps.

Another Attempt at Arizona Redistricting

I decided to attempt redistricting Arizona, with its requirements for districts based around communities of interest. Arizona will pick up a 9th Congressional seat in 2012, though it’s tough to say which is the ‘new’ seat in my map as I moved a lot of things around in the Phoenix metro area. Changes elsewhere were less radical.

Caveats: While the district populations are all roughly equal in DRA, they have the potential to be out of whack in reality, particularly in Pinal County, I’m told. Also, I have little first hand knowledge of Arizona and am going mostly off of what I’ve read in other diaries, so cue Nico picking this apart in 3…2…1

So, here goes:

Statewide

Phoenix Metro

Tucson Metro

Arizona’s 1st Congressional District

Demos: 59% White, 1% Black, 20% Native American, 18% Hispanic, 1% Asian, 1% Otther

Description: Similar to the current 1st, though it sheds most of the non-rural Pinal stuff and picks up rural parts of Cochise and the rural portions of Maricopa instead. The district, as drawn is designed to keep as many rural interests in the state together as possible. The swaps have made this a more Republican district than the current 1st, but I’m guessing that it’s definitely winnable for the right kind of Democrat.

Arizona’s 2nd Congressional District

Demos: 74% White, 3% Black, 2% Native American, 2% Asian, 17% Hispanic, 1% Other

The 2nd stays similar to its current configuration. It does pick up all of La Paz County from the current 8th, but the western Phoenix suburbs, including most of Glendale, dominate here. So, what you have are two communities of interest: the smaller cities on the Western half of the state and the bulk of the West Valley of Phoenix. Should send a GOPer to Congress.

Arizona’s 3rd Congressional District

Demos: 79% White, 2% Black, 1% Native American, 3% Asian, 13% Hispanic, 1% Other

The 3rd remains a North Phoenix dominated district. However, it sheds Central Phoenix to the new 6th and picks up North Scottsdale and Paradise Valley from the old 5th. What I’m aiming for here is to combine the wealthier suburbs into a single district. I’m guessing that even Ben Quayle is probably safe here, and any other GOPer would have a job for life.

Arizona’s 4th Congressional District

Demos: 72% White, 3% Black, 1% Native American, 2% Asian, 20% Hispanic, 1% Other

The new 4th contains the whiter, farther out 2nd ring suburbs of Phoenix (East Mesa and Gilbert) along with the bulk of Pinal County. I’m not going to lie-this configuration is largely because aside from the Indian reservations and the rural parts, I wasn’t quite sure how to carve up Pinal, so I figured that keeping it mostly together (minus the Indian Reservations in the 8th and the rural east in the 1st) as a community of interest wasn’t the worst idea in the world. I’m guessing this is a GOP slam dunk.

Arizona’s 5th Congressional District

Demos: 22% White, 9% Black, 2% Native American, 2% Asian, 65% Hispanic, 1% Other

This is basically the current 4th CD, except that it loses the whiter portions of Central Phoenix to the new 6th and gains a little more population in the West Valley. Best Dem district in the state from a PVI perspective.

Arizona’s 6th Congressional District

Demos: 50% White, 5% Black, 3% Native American, 4% Asian, 37% Hispanic, 2% Other

Tempe plus Central Phoenix in a district that, to me anyways, makes a huge amount of sense as it brings together two ASU campuses plus the seat of government. I think of this as the Texas 25th of Arizona, a white, liberalish seat; say hello to some sort of Democrat here.

Arizona’s 7th Congressional District

Demos: 65% White, 3% Black, 4% Native American, 2% Asian, 24% Hispanic, 2% Other

The aim here was to bring together a bunch of first and second tier suburbs located to the east of downtown Phoenix together in a district. The district is comprised of West Mesa, Ahwatukee, Chandler, and Southern Scottsdale. I know that Chandler is swingy, and West Mesa is D friendly, but know nothing about Ahwatukee and the portion of Scottsdale in the district.

Arizona’s 8th Congressional District

Demos: 32% White, 3% Black, 5% Native American, 1% Asian, 58% Hispanic, 1% Other

This is a lot like the old 7th, though it sheds La Paz to the 7th, parts of central Tucson (including the University of Arizona) into the 9th. In exchange, it picks up some Hispanic heavy turf in Maricopa in the West Valley and the rest of Sierra Vista, and is in the end, several points more Hispanic than the old district (though what this translates to in VAP is unknown); should send some flavor of Dem back to Congress.

Arizona’s 9th Congressional District

Demos: 73% White, 3% Black, 1% Native American, 3% Asian, 18% Hispanic, 2% Other

Picks up white liberals in Tucson and sheds eastern Cochise and the Sierra Vista portions. The two big military installations are here as a community of interest, along with Eastern Tucson. Gabby would do very well here, but as an open seat I’d guess that it’s still definitely winnable for either party.

AZ, ID, and WI: Population by CD

Arizona is gaining one seat, from eight up to nine, and that means that its new target is 710,224, up from 641K in 2000. Interestingly, despite the fact that it’s gaining a new seat, there are still three currently-composed districts that are in a deficit and need to pick up people from elsewhere: the 3rd, 4th, and 5th. These are the three central districts in the Phoenix area that are essentially built out and can’t expand in any direction (except up); meanwhile, the 2nd, 6th, and 7th can continue to expand every which way into the desert, which is precisely what they did over the decade, so look for one additional GOP-friendly seat to be carved out of Phoenix’s endless suburbia (although whether it’s centered in Phoenix’s west or east suburbs remains to be seen… between the commission’s role in deciding, and possible multiple incumbents opening up seats to run for the Senate, there really aren’t any clues what will happen).

Like the other border states, Arizona has become signficantly more Hispanic over the decade, up to 29.6% Hispanic now compared with 25.3% in 2000. The Hispanic growth wasn’t concentrated any one particular place: that 4% increase was closely mirrored in all the districts. The 2nd had the biggest Hispanic shift, at 7% (from 14% to 21%), while the 1st had the smallest shift, at 3% (from 16% to 19%). That dissipation of the Hispanic vote means that it’s not terribly likely that a third VRA seat will be carved out, despite the fact that Hispanics are close to 1/3 of the state’s population.


District Population Deviation
AZ-01 774,310 64,086
AZ-02 972,839 262,615
AZ-03 707,919 (2,305)
AZ-04 698,314 (11,910)
AZ-05 656,833 (53,391)
AZ-06 971,733 261,509
AZ-07 855,769 145,545
AZ-08 754,300 44,076
Total: 6,392,017

I’m not the first one to observe that Idaho redistricting is pretty much drama-free. Nevertheless, there’s at least something interesting going on here in this small but fast-growing state: growth is very heavily concentrated in suburbs and exurbs west of Boise. For instance, the state’s 2nd and 3rd biggest cities used to be Pocatello and Idaho Falls; now they’re Meridian (a large suburb west of Boise) and Nampa (in Canyon County, the next county to the west). That means that the districts are kind of lopsided, and it looks like much of Boise proper, currently split down the middle, will wind up being given to ID-02. While Boise is certainly the most urbane part of the state, and it should tip the balance a bit in the blue direction (as for the past decade, the two districts have had almost identical PVIs), the 2nd should still be a long way away from somewhere the Dems can compete. (Idaho’s target is 783,791, up from 646K in 2000. Look for it to get a 3rd seat in 2020.)


District Population Deviation
ID-01 841,930 58,139
ID-02 725,652 (58,139)
Total: 1,567,582

Wisconsin held steady at eight seats this year, and even its districts held pretty steady, too. Its target is 710,873, up from 670K in 2000. That means the only district that lost population is the Milwaukee-based 4th and even it only lost a few thousand since 2000. The main area of growth is the state’s other blue stronghold, the Madison-area 2nd (must have something to do with THE BLOATED STATE GOVERNMENT AND THOSE GREEDY PUBLIC EMPLOYEES MULTIPLYING LIKE LOCUSTS!!!!1!!), which needs to give about 40,000 people to the 4th (although they’ll have to pass through the suburban 5th, which sits smack dab between them). Also, it looks like Dairyland is gaining a little at the expense of the North Woods, as the 3rd will need to pick up 20K from GOP freshman Sean Duffy’s 7th. Although the GOP controls the redistricting process here, thanks to their House gains in 2010 and the overall uniform swinginess of the rural counties, they’re probably just going to be playing defense with their map.


District Population Deviation
WI-01 728,042 17,169
WI-02 751,169 40,296
WI-03 729,957 19,084
WI-04 669,015 (41,858)
WI-05 707,580 (3,293)
WI-06 705,102 (5,771)
WI-07 689,279 (21,594)
WI-08 706,840 (4,033)
Total: 5,686,986

Virginia 9-2-1

Virginia was really bad for democrats in 2010 (what state wasn’t?). The republicans picked up the 2nd, 5th, and 9th. As I am a democrat I usually make maps leaning that way so I decided to make a republican map. This is an 8-2-1 map and preserves the VRA district while weakening only Morgan Griffith and Cantor a bit.  It’s not perfect but I think it pretty good. For those who don’t know, in the individual district pictures, light green is new district only, pink is old only, and the darkish green is areas in both.


District 1


Incumbent: Rob Wittman

New Stats:

Deviation from Target: 176

Obama: 47.8%

McCain: 52.2%

Dem: 44.6%

GOP:  55.6%

White: 67.2 %

Black: 20.6 %

Hispanic: 6.3%

Old Stats:

Deviation from Target: 45,520

Obama: 48.4%

McCain: 51.6%

Dem: 44.8%

GOP:  55.2%

White: 67.7 %

Black: 19.6 %

Hispanic: 6.8%

The 1st had to lose some population and so it moved a bit, but it is largely unchanged with the exception of taking up a little more of the suburbs in SE Virginia.  Likely R

District 2:


Incumbent: Scot Rigell

New Stats:

Deviation from Target: -26

Obama: 49.2%

McCain: 50.8%

Dem:  46.4%

GOP:  53.6%

White: 65.7%

Black: 20.4%

Hispanic: 6.0%

Old Stats:

Deviation from Target:  -70,482

Obama:  52.4%

McCain: 47.6%

Dem: 49.1%

GOP:  50.9%

White: 62.6%

Black: 21.7%

Hispanic: 6.9%

Nye was elected on the backs of two very poor republican congressmen. While he is young, attractive, and from Philadelphia (awww yeah), with this new district he would not have won in 08. Rigell’s biggest worry is the primary with his donations to Obama and all that jazz. This seat mainly took what district one gave up.  Likely R

District 3:


Incumbent: Robert Scott

New Stats:

Deviation from Target:  -267

Obama: 82.2%

McCain: 17.8%

Dem:  76.9%

GOP:  23.1%

White: 28.9%

Black: 61.0%

Hispanic: 5.3%

Old Stats:

Deviation from Target: -53,960

Obama: 75.7%

McCain: 24.3%

Dem:  28.7%

GOP:  71.3%

White: 36.2%

Black: 53.7%

Hispanic: 5.0%

Mr. Scott would probably be happy with this district as it gets more black and democratic. The district did have to pick up people, and it did this by snaking to as many areas of strength as possible.  I have to say it is horrendous looking. The VRA  mapping standards I have mixed feelings about… Yes they are good for protecting the rights of minorities. This though? Ugh. Safe D

District 4:


Incumbent: Randy Forbes

New Stats:

Deviation from Target:  -255

Obama: 48.8%

McCain:  51.2%

Dem: 46.4%

GOP:  53.6%

White: 61.7%

Black: 28%

Hispanic: 5.3%

Old Stats:

Deviation from Target:

Obama: 51.0%

McCain: 49.0%

Dem:  48.2%

GOP:   51.8%

White: 57.8%

Black: 33.2%

Hispanic: 4.5%

Randy Forbes is unfortunately a skilled politician.  While he wins in a current Obama district easily, I don’t think anyone in the GOP would mind his district getting a bit safer. The only serious challenge he had was his first against Louise Lucas in the 2001 special election. Likely R.

District 5:


Incumbent: Robert Hurt

New Stats:

Deviation from Target: 122

Obama:  43.3%

McCain:  56.7%

Dem: 42.7%

GOP:  57.3%

White: 75.1%

Black: 19.5%

Hispanic: 2.7%

Old Stats:

Deviation from Target: -39,711

Obama:  48.5%

McCain:  51.5%

Dem: 47.3%

GOP:  52.7%

White: 71.7%

Black: 21.9%

Hispanic: 3.1%

5 is the most important district. Perriello is not in this district, and half of his base in Charlottesville is gone. Included, however is Rick Boucher.  Neither Boucher or Perriello has much to run, as they both have a lot of new constitutions AND the district is 5 points more republican than it was before.  Safe R unless Perriello or Boucher run, than Likely R.

District 6:


Incumbent: Bob Goodlatte

New Stats:

Deviation from Target: -43

Obama:  43.9%

McCain: 56.1%

Dem: 42.8%

GOP:  57.2%

White: 81.5%

Black: 10.9%

Hispanic: 4.2%

Old Stats:

Deviation from Target: -23,285  

Obama:  43.2%

McCain: 56.8%

Dem: 42.1%

GOP:  57.9%

White: 81.2%

Black: 11.1%

Hispanic: 4.3%

This close save district remains close to safe. Little changes, mostly just to fill in where other districts no longer are because it was lacking population. Likely R.

District 7:


Incumbent: Eric Cantor

New Stats:

Deviation from Target: -601

Obama: 48.1%

McCain:  51.9%

Dem:  43.4%

GOP:  56.6%

White: 68.9%

Black: 14.5%

Hispanic: 8.6%

Old Stats:

Deviation from Target: 25,081

Obama: 46.6%

McCain: 53.4%

Dem: 43.3%

GOP:  56.7%

White: 72.3%

Black: 16.7%

Hispanic:  4.8%

Snaking into Prince William to shore in place of 1 and 11, the partisan numbers actually don’t change all that much as the district loses parts of Richmond. I kept in the most conservative precincts because I figure that’s where Cantor lives. Cantor should be fine. Likely R

District 8:


Incumbent:  Jim Moran

New Stats:

Deviation from Target: 531

Obama: 68.2%

McCain: 31.8%

Dem:  67.7%

GOP:  33.3%

White:  53.9%

Black: 13.2%

Hispanic: 18.4%

Asian: 11.4%

Old Stats:

Deviation from Target: -27,688

Obama:  68.2%

McCain: 31.8%

Dem: 67.7%

GOP:  33.3%

White: 54.4%

Black: 13.3%

Hispanic: 18.4%

Asian: 10.7%

Almost unchanged, just look at demographics. Safe D

District 9:


Incumbent: Morgan Griffiths

New Stats:

Deviation from Target: -196

Obama: 43.4%

McCain: 56.6%

Dem: 45.7%

GOP:  54.3%

White: 88.8%

Old Stats:

Deviation from Target:  -72,764

Obama: 40.3%

McCain: 59.7%

Dem: 43.7%

GOP:  56.3%

White: 92%

The district had to gain people and Griffith’s home of Salem. The district got more democratic by taking in parts of Charlottesville and some of its suburbs to weaken cut Periello’s base in two. Periello resides in this district but might still choose to run in the 5th.   Likely R, will move to Safe fairly soon as Griffith’s gains name recognition throughout the district.

District 10:


Incumbent: Frank Wolf

New Stats:

Deviation from Target: -98

Obama: 49.4%

McCain: 50.6%

Dem: 48.1%

GOP:  51.9%

White: 66.9%

Hispanic: 10.7%

Asian: 13.5%

Old Stats:

Deviation from Target: 144,282

Obama: 50.2%

McCain: 49.8%

Dem: 47.2%

GOP:  52.8%

White: 63.8%

Hispanic: 13.5%

Asian: 12.4%

Wolf has won for 30 years straight, usually with ease. His district is now a McCain district but it only moved by about .8%. Lean/Likely R

District 11:


Incumbent: Gerry Connolly

New Stats:

Deviation from Target: 645

Obama: 55.6%

McCain: 44.4%

Dem: 50.5%

GOP:  49.5%

White: 54.4%

Black:  10.2%

Hispanic: 16.9%

Asian: 14.9%

Old Stats:

Deviation from Target: 62,964

Obama: 56.6%

McCain: 43.4%

Dem: 52.3%

GOP:  47.7%

White: 55.0%

Black: 11.1%

Hispanic: 15.4%

Asian: 14.9%

This district becomes more swingy by taking away some liberal territory like Dale City and giving to Eric Cantor. Leans slightly D but I’d call it a toss-up. Connolly would have lost in 2010 with this district.