Electoral Polarization

By: Inoljt, http://mypolitikal.com/

In my previous post, I noted that almost all the counties President Barack Obama won have become more Democratic since 1992, while almost all the counties Senator John McCain won have become more Republican since 1992.

In fact, comparing maps of the 2008 presidential election and the county changes from 1992 indicates a striking correlation.

Here is the 2008 presidential election:

Photobucket

Here are the changes from the 1992 presidential election:

Photobucket

This hints at a disturbing picture of electoral polarization. More analysis below.

On the one hand, all this is somewhat intuitive. If a Democratic candidate does well in a specific place, he or she probably improved on a previous Democrat’s performance there – and vice versa. Moreover, these maps do not imply that all blue regions became more Democratic (nor the opposite); rural Appalachia, in the most famous instance, has trended sharply Republican, while much of suburban American has gone in the opposite direction.

On the other hand, this phenomenon does not constitute a mathematical rule. If a Democratic candidate wins a county, that doesn’t necessarily imply that he or she improved upon a previous Democrat’s performance. He or she could have done worse but still won; the previous Democrat might have overperformed, or the Republican might have encouraged cross-over voting.

Yet by and large, this has not been the case. Obama practically always outperformed former President Bill Clinton in today’s Democratic counties. Mr. McCain practically always overperformed former President George H. W. Bush in today’s Republican counties.

Taking a look at selected states provides a powerful illustration of this fact.

Here is California:

Photobucket

Here is Colorado:

Photobucket

All this implies something rather disturbing: electoral polarization has been steadily increasing. Obama only improved on Mr. Clinton’s performance in the counties Obama won. McCain only improved on Mr. Bush’s performance in the counties McCain won. The almost total lack of cross-over gain suggests that each party has come to depend on deepening their base, rather than widening the electorate and appealing to moderates.

That America is getting more divided has, of course, been known for a fairly long time. In some ways the maps exaggerate the polarization: 1992 Clinton appealed to many Republicans, while Obama’s strength lay amongst the Democratic base. Then there is the Ross Perot effect, which lowered margins in both party strongholds (e.g. New England, the Plains states).

But perhaps a bit of exaggeration is needed. Polarization has rarely been good for any country, and its increasing prevalence bodes poorly for the future of the United States. A map like this provides a potent illustration of polarization in action; indeed, I have never encountered a more striking image of its increase. Such a picture might do us some good.

(Note: Credit for all maps is given to the NYT; some images have been modified.)

Democratic Debauchery in Colorado (Redistricting)

After a careful look at the state after coming up with a redistricting plan the first time around, I decided to be more aggressive, bringing the delegation to a possible 6-1 breakdown.  In another scenario I tried to create a majority Hispanic district, but while doable it makes a 6-1 breakdown impossible and would depose one of our current Democratic Reps.

I’m going off the assumption that Democrats retain both houses of the legislature and the Governor’s mansion, a tough fight but I think that’s how it’ll end up.  

This time the goals were to: A) Make Markey safe, B) shore up Salazar at least a little, C) Keep Perlmutter, Polis and DeGette in reasonably solid Districts, and D) transform one of the other 2 districts into a swing district.

Here’s a map of the result:

2010 Colorado Congressional Districts

And a look at the metro area…

Photobucket

1st CD: Diana DeGette v. Mike Coffman

Population: 706,016

58% White, 13% Black, 20% Hispanic

This district still retains a substantial Denver county presence, keeping DeGette’s home in east Denver, the Denver portion runs roughly from Elyria Swansea in the north, keeping Capitol Hill, Wash Park and all the neighborhoods north of I-25 up to Virginia Village, then everything east and south of that neighborhood is in the 7th.  Denver now makes up 38% of the district.

The 1st now includes all of Aurora, including the far-flung areas and Foxfield before going south into Douglas County, picking up most of Lone Tree and a good chunk of Parker.  It also manages to pick up Mike Coffman’s home, removing him from any Republican district.

Despite extending into Douglas county, only about 26% of the 1st is Republican leaning, with another 18% of the district in southern Aurora that could be considered swingy.  with a majority still solidly Democratic and such a large minority population DeGette should have no problem holding the seat.

Having the 1st go south all the way into Douglas allows the 6th to also move south, picking up the blood-red areas in northern El Paso County.

2nd CD: Jared Polis

Population: 705,761

77% White, 16% Hispanic

As much as I wanted to draw Polis out of this district, I didn’t want to put any of Boulder County in any other district, so Polis can stay to grandstand another day.  

This district remains anchored in Boulder County, extending into Broomfield, Thornton, Northglenn, Federal Heights and Westminster in Adams County, and Grand County as it did before.  From there, however it becomes radically different.  

The 2nd extends into Jackson County, northern Routt County (excluding Steamboat), Moffat, Rio Blanco, Garfield (west of Rifle), and several precincts in Mesa County, including Fruita and parts of Grand Junction.  It also goes south into Jefferson, picking up the foothills area of Evergreen and Conifer.

This move was meant to draw as many Republican votes out of the 3rd as possible without turning the 2nd into a swing district.  It does have the nice effect of diluting the People’s Republic of Boulder more than it has been in the past, however, a side-effect I’m happy to see.

Once again, despite the move into more Republican territory, only 13% of the district leans Republican now, with another 41% even considered less than solidly Democratic.  (I included Broomfield, Northglenn, Westminister, Thornton and Federal Heights in that number, definitely pessimistic to call it swingy).

3rd CD: John Salazar

Population: 705,635

70% White, 24% Hispanic

Making Salazar too much safer would be pointless, he has a proven ability to hold this district by wide margins, despite Obama only getting 47% here in the old district.  There is room for improvement, however, just to be safe and keep the “Penry scenario” out of relevance.  

The biggest changes were to add  Eagle, most of Summit, Lake, Crowley, the rest of Otero, and Bent.  The latter counties are all small enough and friendly enough to Democrats to not make much difference, the ski counties, however, help a great deal in making this district less Republican, along with the territory taken by the 2nd.

The only other change was the loss of a handful of precincts in Pueblo County.  So overall still more of a swing district, with 37.5% of the district leaning Republican and another 7% more swingy, the rest at least leans Democratic.  Obama would have definitely won this district, but not overwhelmingly.

4th CD: Betsy Markey

Population: 705,422

68% White, 26% Hispanic

In terms of voting percentage, the 4th is pretty drastically changed.  Going from a narrow Obama loss to a solid Obama win.  By losing all the rural plains counties as well as eastern Weld county, there is only the increasingly blue Larimer county and the bluing southwest Weld county, including Greeley.  What is added here is all of Adams county except for Northglenn, Westminster, Federal Heights, and Thornton, making this district much more Hispanic as well.  So even if Cory Gardner were to win in 2010, he would be drawn out of the district and put into the 6th.  The result is a district where Obama received more than 54% of the vote.  

5th CD:

Population: 705,420

70% White, 24% Hispanic

This is the district I call “The Crab”, its the most severe gerrymander I could come up with given my limited data.  (Any other suggestions as to what this district looks like would be great!)  It goes from an El Paso County based district to going from most of Colorado Springs south into Fremont, through Park and Chaffee, back into Jefferson and Arapahoe, drawing out Lamborn.  The idea came from someone else on here, who wanted a springs-based district which Obama had won, but there’s not enough people in that area to make an entire district, so I had to get creative.

Put more specifically, this district takes in all the precincts Obama won in Colorado Springs and Fountain, as well as a few others that needed to be added to make the district contiguous, as well as Manitou Springs and Fort Carson, which Obama won.  Fremont and Park were both pretty solid for McCain, but their populations are negligible and there needed to be a link from this to the increasingly blue southern Denver suburbs to the north without going through Douglas.  To the south, the 5th takes in a few precincts in Pueblo County.

North of Park it includes Gilpin and Clear Creek and part of Summit, all of which went for Obama.  Once in Jefferson, the 5th avoids the wealthy Ken Caryl, and extends into Littleton in Jeffco for lack of a better name, once again leaving out the worst performing precincts, but still much of that area voted for McCain.  It then extends into southern Lakewood, going as far north as Mississippi Ave. and also part of Morrison.  Once in Arapahoe County the district includes Littleton, Sheridan, Englewood, Columbine Valley, Greenwood Village Cherry Hills Village and Centennial, leaving out Bowmar.  All of these except for Cherry Hills, with a population of just over 6,000 voted for Obama.  

So overall the 5th becomes extremely swingy, with 23% of the district leaning Republican and 41% of the district being made up of areas that are traditional swing areas.  There are definitely more Democratic voters now in the 5th than there have ever been, the 5th has never before been represented by a Democrat, but it should now be competitive enough to make that possible.  

6th CD: Doug Lamborn

Total Population: 705,583

81% White, 11% Hispanic

The 6th becomes a Democrats worst nightmare, taking in virtually all the most Republican areas.  The district takes in the rest of Douglas County and the rest of El Paso County, where Obama only one 2 precincts.  From there it extends into the heavily Republican Teller County, eastern Weld and Arapahoe Counties, and all the eastern plains counties not in the 3rd.  

With no Democratic areas to speak of and only 1% even remotely  swingy, this district isn’t even worth having a Democrat run in.  If Coffman were smart he would move into this district and fast!

7th CD: Ed Perlmutter

Total Population: 705,613

64% White, 28% Hispanic

The 7th retains its base in Jefferson County, keeping Perlmutter’s home.  It then also takes in all of west Denver includig the Civic Center, Lincoln Park, and most of Baker and east Denver south of I-25 and the Virginia Village neighborhood.    Its only Republican additions are part of south-east Jefferson near Sheridan & Bowles and Ken Caryl.  

Overall this district become more Democratic than before with only 5% of the district leaning Republican and 22% of the district being swingy.  (Golden, Arvada, and Westminster were considered swingy in this analysis.)  Obama would have won this district solidly.

Colorado Redistricting – Shoring Up the 5-2

The most likely redistricting scenario for 2010 is one in which Democrats control the House, Senate and Governor’s office in Colorado. The Governor’s office is the only one where there seems like there might be a problem. Mostly because Bill Ritter is no lock for re-election.

But the Democrats are in pretty solid (though not impregnable) control of the legislative branch at this point. They’re up 38-27 in the CO House and up 21-14 in the Senate. Thanks to partisan battlin’, redistricting last time around was, as the kids say, a hot mess.

Presumably, this time should be smoother and as long as the Democrats don’t do any overly-obvious gerrymandering that risks a political backlash, they’ll be fine. I would think that no hugely obvious changes in the composition of the delegation, currently 5-2 in favor of Dems, would do the trick on that front, even if they subtly manipulate the districts to their advantage. A gentle gerrymander, if you will….follow along for that!

CD-1 Diana DeGette (D) – Dark Blue

Her district shifts very slightly around the periphery, but largely remains the same–Denver-centric and safely Democratic, as one would expect for the dean of the delegation. For the record, Colorado has quite a young delegation…DeGette was elected in 1996, but John Salazar, the next most experienced, was only elected in 2004.

CD-2 Jared Polis (D) – Green

His district loses its last bits of Weld County and its liberal ski towns as it shifts south and grabs Golden, Wheat Ridge and the rest of Arvada. It’s slightly more conservative, perhaps, but not by too much–its liberal Boulder center pushes left on the suburban areas, which aren’t exactly the most conservative parts of the Denver suburbs anyway. The moderately liberal Polis should be fine, and it’s a safely Democratic seat regardless.

CD-3 John Salazar (D) – purple

Adds: Eagle, Summit, Clear Creek, Lake, Chafee

Loses: Jackson, Routt, Moffat, Rio Blanco, Garfield, Custer, Otero, a bit of Mesa County

How to shore up a district that’s basically totally rural without dipping into the votes of the major cities on the Front Range? Two words: ski towns. The new district drops some ranching counties on the periphery while adding overwhelmingly liberal ski-centric counties.

DATA FREAKOUT ALERT!

3rd District adds these counties:

Pitkin: 74-25 Obama (15,000)

Summit: 66-33 Obama (23,500)

Lake: 62-36 Obama (8,000)

Eagle: 61-38 Obama (42,500)

Gilpin: 59-38 Obama  (5,150)

Clear Creek: 58-40 Obama (10,000)

Chaffee: tie  (16,000)

3rd District loses these counties:

Moffat 70-27 McCain (13,000)

Rio Blanco 77-21 McCain (6,000)

Jackson 68-30 McCain (1,500)

Custer 63-35 McCain (3,500)

Otero 55-44 McCain (20,000)

Garfield tie (44,000)

It’s over 100,000 people that will be magically transformed from rather Republican voters into heavily Democratic ones in this district. That should be enough to swing the PVI a good 5 points toward the blue, no? Still not hugely Democratic, but significantly more so.

CD-4 Betsy Markey (D) – Red

Adds: Grand, Jackson, Routt, Moffat, Rio Blanco, Garfield, the rest of Weld County, and a bit more of Boulder County.

Loses: Everything east of Weld County (all of eastern CO, basically)

Markey smashed Marilyn Musgrave by racking up votes in Larimer and Weld counties which overwhelmed the heavily-Republican rural vote (which was about 10%-ish of the district). It’s the same principle in her new district, but with fewer to overwhelm. Plus, the addition of a few more competitive suburban Denver & Boulder voters should anchor it even more firmly. Finally, one of her rural counties is Routt County (Steamboat Springs–awesome ski town!), which went 63-36 for Obama and would be one of her most populous rural counties. So her new district is still swing-ish, but should be somewhat safer.

CD-5 Doug Lamborn (R) – Yellow

Adds Custer, Crowley, Otero counties

Loses Chaffee, Lake and Park

Doug will be fine with this–trading three centrist counties for three conservative ones, plus keeping his Colorado Springs base? What’s not to like for him…and Republicans?

CD-6 Mike Coffman (R) – Turquoise

Gains: Some more of Jefferson County, most of rural eastern Colorado that was formerly Markey’s

Loses: most of Arapahoe

Assuming Mike can survive primary challenges, he should be fine in this safely Republican seat. His seat will change a lot in 2012 under this map, but Republicans should be fans of its new configuration, which makes it well-nigh impossible for Democrats to overcome their registration advantages.

CD-7 Ed Perlmutter (D) – Gray

It’s a similar district in terms of demographics, but it shifts east. Perlmutter should be fine here, and picks up all the remaining fast-growing suburban areas east of Denver. Now about two-thirds white (with 6% Af-Am., 3% Asian, 18% Latin), it’s the second most diverse district after the central-Denver-centric 1st.

—-

There you have it. Three fairly liberal Dem seats (1, 2, 7), two fairly Dem seats (3, 4) districts and two safely Republican ones (5, 6). A gentle gerrymander, if you will.

Johnny Longtorso’s map has similar ideas to this one, and for the record I think he’s an ace redistricter, but I think mine fixes a crucial problem–shoring up Salazar’s district so that a less conservative Democrat could win it. He makes Markey safer than I do, though. So if you want more Colorado redistricting 2010 action, check it out:

http://www.swingstateproject.c…

By what margin will Bob Shamansky win?

View Results

Loading ... Loading ...

Colorado Redistricting

I am worried about the Colorado Governorship but the Democrats should still control one part of the State Legislature. They have large majorities in both houses. This calls for an incumbent protection plan even though I already expect one because the Democrats want to protect Betsy Markey and John Salazar. Salazar seems pretty safe but I decided to protect him anyway because eventually, the Republicans will find a strong challenger. The two other Republicans should have no problems under this plan. Here are the maps:

Northwest Colorado

Northeast Colorado

Southeast Colorado

Southwest Colorado

District 1 Diana De Gette (D) Blue

This district resembles Betsy Markey’s current district a bit because I extended it out into the heavily Republican prairie. Even though these counties are heavily Republican, they have barely any people. Since Denver is so Democratic, Republicans have no chance at this district. To satisfy minority politicians, this district is also minority majority. Obama probably won 69% of the vote here. Demographics are 8% Black, 38% Hispanic and 48% White. Status is Safe Democrat.

District 2 Jared Polis (D) Green

Okay, I did not make everyone stronger. I sent Polis’s district out to the Utah border to include Mesa County (Grand Junction) which McCain won by 20,000 votes. Polis should not worry because Boulder County (Boulder) went for Obama by 80,000 votes. Excluding the slice of Jefferson and Adams Counties, the vote results for the new 2nd district were Obama 174,567 and McCain 116,890. I estimate Obama won about 56% of the vote in the Jefferson and Adams County portions so Obama probably won 59% of the vote in the district.  Polis is a Boulder Liberal and the district should be Democratic enough to protect him. Demographics are 13% Hispanic and 81% White. Status is Safe Democrat.

District 3 John Salazar (D) Purple

I removed Grand Junction and nearby Republican counties in return for more ski resort counties in the Rocky Mountains like Eagle County. The Jefferson County part I added should not interrupt the district because it only has about 14% of the district’s population. Overall, Obama probably won 55% of the vote here. Salazar won here easily but now, I am sure he will win reelection here until he retires. Demographics are 22% Hispanic and 72% White. Status is Safe Democrat.

District 4 Betsy Markey (D) Red

Obama barely lost the old district because it had most of the heavily Republican counties to the east. I took those out and exchanged them with some Democratic territory in Adams County. The 4th district still has Republican Weld County but its votes should be offset by Adams County. Obama probably won 53-54% of the vote here, enough to protect Freshman Betsy Markey. Demographics are 19% Hispanic and 75% White. Status is Safe/Likely Democrat.

District 5 Doug Lamborn (R) Yellow

This district was already heavily Republican, even though Obama did much better here than Kerry. Those eastern counties needed to get into a district so I chose this one. Since it retains its base at Colorado Springs, Lamborn should be here indefinitely. McCain probably won 61% of the vote here. Demographics are 5% Black and 14% Hispanic. Status is Safe Republican.

District 6 Mike Coffman (R) Teal

Coffman gets a boost too under the new map. He loses small portions of Arapahoe and Jefferson Counties which lean Democratic. Since Douglas County is the fastest growing county in Colorado, the 6th district does not need much new territory to balance population. I also added heavily Republican Teller County. Overall, the district becomes more Republican. In the later part of the 2010’s, the district might become shaky as more Democrats move into the suburbs. For now, Coffman is safe unless he faces an extremely hard challenge. McCain probably won 55% of the vote. Status is Safe/Likely Republican.

District 7 Ed Perlmutter (D) Gray

I kept the district mostly the way it was. The changes I made were taking out Republican parts of Adams County, a bit of Jefferson and I added a touch of Denver. These changes should make the district even more Democratic, ensuring Perlmutter’s safety. I decided it was too risky to try to swap some territory with the 6th district to weaken Coffman. It would not be worth it because there will be Republican years. The Democratic incumbents need to be as safe as possible. Obama probably won 62% of the vote here. Demographics are 7% Black, 23% Hispanic and 62% White. Status is Safe Democrat.  

By what margin will Bob Shamansky win?

View Results

Loading ... Loading ...

PBI (Party Brand Index) Part 2: Colorado & Virginia (updated)

I have been working on (with some much appreciated help from pl515) a concept I’m calling PBI or Party Brand Index, as a replacement for PVI.  PVI (Partisan Voting Index), which is measured by averaging voting percentage from the last two presidential elections in each house district, and comparing it to how the nation as a whole voted, is a useful shorthand for understanding the liberal v. conservative dynamics of a district. But in my opinion it falls short in a number of areas. First it doesn’t explain states like Arkansas or West Virginia. These states have districts who’s PVI indicates a Democrat shouldn’t win, yet Democrats (outside of the presidency) win quite handily. Secondly why is this the case in Arkansas but not Oklahoma with similar PVI rated districts?

Secondly PVI can miss trends as it takes 4 years to readjust. The main purpose of Party Brand Index is to give a better idea of how a candidate does not relative to how the presidential candidate did, but compared to how their generic PARTY would be expected to perform. Last week I calculated PBI for Indiana, this week I tackled Colorado and Virginia.

My best case for arguing against PVI is Indiana.  Bush won Indiana quite easily in 2000 and 2004. The PVI of a number of it’s districts showed them to be quite Red. Yet in 2006 democrats won several districts despite their PVI’s. Also Obama won Indiana in 2008 a state, which based on the make up of the districts PVIs, made little sense. I therefore chose Indiana as my first test case for PBI:

Donnelly in the Indiana 2nd is a perfect example of my issues with PVI. Under PVI Donnelly is in a Republican district with a PVI of -2. But look at how Democrats have recently performed in this district. In 2008 Donnelly won reelection by 37%! Obama won this district by 9 points, and Bayh won it by 22%! Does this sound like a lean GOP district? Under PVI it is, under PBI it’s not it’s a +11 democratic district.

This week I tackled Colorado and Virginia. My general strategy is to work my way “out” from swing states. Both these states have undergone noticable ideological shift. Yet the PVI of their districts haven’t moved as much. This made them ideal candidates.

COLORADO

The big difference in Colorado is that Salazar’s district goes from being a lean Republican one under PVI (-5 Republican), to a lean Democratic one (+4 Democrat), considering that a Salazar has held this same seat for some time this makes more sense. Remember I measuring total party preference not just the presidential preference of a district like PVI measures.

VIRGINIA

Virginia was the first time I had doubts on my ability to compute rough Senate numbers for House districts based on county totals. My estimates from Mark Warner Senate run yielded results of 3540% in Tom Perriello’s (VA-5th) district. This seemed way to high, even though now Senator Warner won the state with 65% of the vote.  At the time Virgil Goode was the representative from the VA-5th, and he lost by only a few hundred votes.- This lead me to do some additional research to try and discover if these numbers were published anywhere. Boy was I wrong Warner actually won the VA-5th by 65%!. Also several of the large victory margins were the results of representatives who ran unopposed. Fixed Party ID, and election results

________________________________________________________________________________

As a reminder I will review how I calculate Party Brand Index.

To compute PBI I basically did the following. I weighed the last 3 presidential elections by a factor of 0.45. Presidential preference is the most indicative vote since it’s the one politician people follow the most. The POTUS is the elected official people identify with or despise the most, thus illuminating their own ideological identification. I then weighed each house seat by 0.35. House seats are gerrymandered and the local leader can most closely match their districts make up in a way the POTUS can’t. So even though they have a lower profile I still gave them a heavy weight. Lastly I gave the last two Senate elections a weight of 0.2. Senatorial preference can make a difference, although I think it’s less than that of the President or the House members. Also (more practically) because I have to back calculate (estimate) Senate result totals from county results, a smaller number helps lessen the “noise” caused by any errors I may make. Under my system Democratic leaning have a positive number, the GOP has a negative number.

I then developed a way to weight for incumbents.  The reelection numbers for incumbents is so high it would be a mistake to weight a district solely on the fact that an incumbent continues to get elected. There is a long list of districts that have PVI that deviate from their incumbent members, whom none the less keep getting elected. These districts then change parties as soon as the incumbent member retires. This is evidence that incumbency can disguise the ideology of voters in a district.

Next I added a weighting of about 7% for House members. I remember reading that incumbency is worth about 5-10%. Nate wrote in a 538.com article that a VP pick from a small state was worth about a 7% swing, a house seat could in fact be thought of as a small state, that seems as good a number as any to start from. Conversely I will deduct 7% from an incumbents win. I think this will score them closer to the natural weight of a district. By the way I’m weighting the win 7% less, not actually subtracting 7% from the number.  Open seat races will be considered “pure” events and will remain neutral as far as weighting goes.  A seat switching parties will also be considered a neutral event. The 1st defense of a seat by a freshman house member will be given a weighting of 2%. The toughest race for any incumbent is their 1st defense. I decided to adjust for this fact. Note: Indiana’s bloddy 9th was a tough call a case could be made that when a seat keeps flipping, and the same two guys run 4 straight times in a row each election should be a neutral event.

Senate weighting is as follows. In state with a single House seat the Senate seat will be weighted the same as a house. In states with multiple seats, the Senate will get a weighting of 2%. Nate Silva stated that a VP pick in a large state is worth this amount. An argument could be made for a sliding scale of Senate weighting from 2-7%, this added complexity may be added at a later date. I will give incumbent presidents a 2% weighting, until I get better data on how powerful a “pull” being the sitting POTUS is, I will give them the same weighting as a senator.

______________________________________

Still to come:

The last major issue is how to deal with the “wingnut” factor. Sometimes a politician like Bill Sali (R-Idaho) or Marylin Musgrove (R-CO)lose because their voting record is outside of the mainstream of their district. I decided to try and factor this in.  

First I had to take a brief refresher on statistics. I developed a formula based on standard deviations. Basically I can figure out how much the average rep deviates from their district.  If I then compare where a reps voting pattern falls (in what percentile) and compare it to their district’s PVI, I can develop a “standard deviation factor”. Inside the standard deviation will get a bonus, outside a negative.

For example, if Rep X is the 42 most conservative rep, that would place her in the 90th percentile. But if her district’s PVI was “only” the in the 60th, their is a good chance her margins would be effected. Using a few random samples I found most reps lie within 12% of their district’s PVI.

Using these dummy numbers I then came up with this.  


   SQRT[(30-12)^2 /2] = about 13%

    Her factor would then be 100 – 13 = 0.87.

So her victory margin would be weighted by 0.87 because she is more than 12% beyond her acceptable percentile range it making the victories in her district approximate 13% less “representative”.

    My theory yields the following formula:

        If rep’s voting record is > PVI then

            100 – SQRT[({Record percentile – PVI} – Standard PVI Sigma)^2 /2] = factor

        else if rep’s voting record < PVI

             100 + SQRT[({Record percentile – PVI} – Standard PVI Sigma)^2 /2] = factor

To really do this I need to compute the standard deviation for all 435 reps, which is a pretty large undertaking. Instead  I will do a google search  to see if anyone has already done this. If not well it will take some time. But this would deal with the wingnut factor. Since politician tend to vote relatively close to their districts interest (even changing voting patterns over time) this may not be a major issue. But developing this factor may eventually allow the creation of a “reelection predictor”, so I am still going to work on it.

One last note, the corruption factor (for example Rep. Cao (R-LA) beating former Rep. Jefferson) is outside of any formula I can think of. The only saving grace here is that because my formula uses several elections, the “noise” from a single event will eventually be reduced.

NEXT UP: NC and MO

GE 2008, the Democratic pick up states: an exhaustive summary analysis

Now that all 9 Democratic pick-up states plus NE-02 have been analysed, I have also provided an exhaustive and most unique non-partisan summary of the pick-up states. I can guarantee you that there is information in this summary that you will not find anywhere else in this quality, clarity or combination.

There are a number of side-documents that go with the summary, plus links to all of the nine analyses and the GE 2008 final analysis for the entire Union.

I want to explain again that I have farmed this kind of thing out to Google Docs as it makes it easier for me to publish charts, tables and graphics. It is my hope that you will read the summary in it’s entirety. There are surprises all over the place that only become apparent when one scratches under the surface and researches the GE 2008 at the county level, county for county. In the case of the 9.25 pick-ups, we are talking about 696 counties.

The summary is divided into 2 parts and all of this information is after the jump.

Part I of the summary contains:

– links for the individual analyses for all the pick-up states plus the links for the GE 2008 analysis for the entire Union are given again. They will be reproduced at the bottom of this diary entry.

– an overview of the raw vote and percentage totals for the pick-ups states, first for 2008 only and then a comparison to 2004.

– three maps. One shows the geographic position of the pick-ups within the USA. The second shows the geographical relationship between the pick-ups and the Democratic retentions from 2004. The third shows the Democratic states from 2008 plus the 5 leanest GOP wins from 2008.

– a question: “How does this compare on a historical level?”

The question is referring to the number of electoral votes that changed parties in 2008, namely, 113 EV. I then provide a table showing each general election back to 1948 and how many electors changed parties, and in which direction. The answer to the question is that Obama’s EC shift is on par with the last election cycle, but less than in the 1980s.

Afterward, there is an introduction to the county-level analysis, including an exact numeric count of counties per state: Democratic retentions, Democratic pick-ups, Republican retentions and Republican pick-ups.

Quote:

“In the pick-up states, the Democratic party retained 146 of 148 Democratic counties from 2004 and then picked-up an additional 89 counties, for a total of 235 counties (33.76%). The Republican party lost 89 counties from 2004, retaining 459 counties and then picked-up 2 counties, for a total of 461 (66.24%). 235 + 461 = 696 counties.”

“Nationally, all 9 states trended Democratic as Obama won them and their electors according to the WTA (winner-takes-all) system, but when we look at the inner details, the picture is much clearer: 642 of 696 counties in the pick-up states (92.24%) swung Democratic. The remaining 54 counties (7.76%) swing Republican. This indicates a statistical grand sweep for the Democratic party in the pick-up states.

In 4 states, the ENTIRE state trended Democratic: Colorado, New Mexico, Nevada (all three western pick-ups) and Indiana.The pick-up in Indiana is historic not only because this is the first time since 1964 that a Democrat has won the state, but it also had the largest partisan shift of all 50 states in the GE 2008: +21.71%

The state with the largest contra-trend (Republican) against the national trend: Florida.”

Part I ends with maps of Ohio, Virginia and North Carolina, showing the geographic position of the 28 counties that swung Republican, showing their proximity to Appalachia.

You can link to Part I via Google Docs.

Part II starts with an extensive study of the 39 largest counties out of the 9.25 pick-ups states, plus Durham County (NC) as honorable mention.

Quote:

“I have done a statistical analysis of the 39 largest counties of the 9.25 pick-ups. These are all counties that had a total vote of more than 170,000 and at least one candidate should have also gotten at least 100,000 of those votes or very,very close to it. All of those counties meet both criteria. Two counties (Stark County / OH, Washoe County / NV) had no candidate with 100,000 votes or more, but in both cases one candidate was very close to 100,000 and the countwide total vote was well over 170,000.  Those 39 counties accounted for 44.49% of the total popular vote of the pick-up states, which is actually slightly LESS than it was in 2004 for the same states: 44.91%. Nonetheless, when only 39 of 696 analysed counties (5.60%, numerically) have almost half the electoral firepower of the region, then it is statistically very clear that the large urban areas have the real electoral firepower in presidential elections. The candidate who sweeps the urban areas has a far better chance of winning the presidency.

Of these 39 counties, there were 21 Democratic retentions, 8 Democratic pick-ups and 10 Republican retentions. This means that of the same 39 counties in 2004, the picture was much more even: in 2004, there were 21 Democratic counties of these 39 and 18 Republican counties.

The Democratic party picked up Hillsborough (Tampa) and Pinellas (Clearwater) counties in Florida, Wake (Raleigh) county in North Carolina, Washoe (Reno) County in Nevada, Hamilton (Cincinnati) County in Ohio, Jefferson (Golden) and Arahapoe (Littleton) counties in Colorado and Douglas (Omaha) County in Nebraska.”

The important thing about this study is it’s depth and breadth: each of the 39 (40) counties are analysed comparing 2008 to 2004, measuring raw vote and margin differences, also the counties’ percentual take of their respective states’ popular vote and also their take of the pick-up states combined. But the counties are also each given a spreadsheet to trace their voting history back to 1960 and the results are nothing less than amazing!

Next, from the analysis in Part II:

Superlatives:

– the largest raw vote total of all 39 counties: Miami-Dade County, FL: 864,636 votes

– the largest Democratic winning raw vote total: Miami-Dade County, FL: 499,831 votes

– the largest Democratic raw-vote margin of the pick-ups: Cuyahoga County, OH (Cleveland): +258,542 vote margin

– the three highest Democratic winning percentages: Denver- CO,  Boulder, CO and Cuyahoga- OH: 75.45%, 72.29% and 68.70%, respectively.

– the three largest Democratic winning margins (by percent): Denver- CO,  Boulder- CO and Cuyahoga- OH: +52.41%, +46.14% and +38.74%, respectively

– the highest democratic margin-shift (swing): Marion County, IN: +26.40% margin shift. This is especially impressive, as this shift was not from a pick-up, but rather, a Democratic retention county.

– the largest Republican winning raw vote total: Duval County, FL: 210,537 votes

– the largest Republican raw-vote margin of the pick-ups: El Paso County, CO: +51,419 vote margin

– the three highest Republican winning percentages: Butler – OH, El Paso- Co and Lee- FL:  60.52%, 58.69% and 54.67%, respectively

– the three largest Republican winning margins (by percent): Butler – OH, El Paso- CO and Brevard- FL: +22.58%, +18.82% and +10.37%, respectively

– the lowest negative Republican margin-shift (swing): Brevard County, FL: -5.73% margin shift

All of the Democratic retentions and pick-ups showed raw vote, percentual and margin GAINS.

All of the Republican retentions showed percentual and margin LOSSES.

4 of the Republican retentions showed raw-vote gains: Brevard, Lee, Polk and Pasco counties, all in Florida. The other 6 Republican retentions showed raw-vote losses.

9 Republican or Democratic tipping-point (margin = less than 4%) counties from 2004 became solid Democratic wins in 2008: Pinellas, Volusia and Orange Counties-FL, Wake, Guilford and Mecklenburg Counties- NC, Montgomery and Stark Counties – OH, Arapahoe County- CO

5 Republican retentions have become tipping point counties for 2012: Sarasota (+0.10%), Virginia Beach (+0.71%), Duval (+1.90), Seminole (+2.70%) and Pasco (+3.75%) . Statistically this means that 1/2 of the Republican retentions studied here are endangered territory for 2012 and (this has been proven historically many times over) in the case of a sucessful re-election campaign for the Democratic party in 2012, these five counties are the most likely candidates to become Democratic pick-ups in 2012.

O Democratic retentions or pick-ups are tipping-point counties for 2012.

Here is the EXCEL SPREADSHEET that has all of the raw calculations for the 39 (40) largest counties.

In order to simplify the look of the table and make the information easier to see, I created a table to show the chronological progression of each county from 1960 to 2008. For each county and year, I have assigned either a D, R or an I, depending on which party won the county in that year. And then I have shaded each cell according to winning party. I then organized the table in order from CORE GOP counties to CORE DEM counties. Take a good, hard look at the table when you read Part II, it is most enlightening.

You can link to Part II via Google Docs.

Quotes:

“In the case of some counties that visually look as if they should be core GOP counties there is instead the marking steady; these are GOP counties that should be core counties, but which almost flipped in 2008, so their status is now uncertain. And some Democratic counties are marked as steady as the margins are very lean.

But the table makes it very easy to see which years are landslide years: 1972 and 1984, to a smaller extent 1992 and 2008. In 1972, we see a sea of red go through all counties except Lucas County, OH. In 1984, we see a sea of red go through all counties except the bottom 5. At the top we see 3 core GOP counties that also resisted the Johnson landslide of 1964. Notice that all three counties are in Florida.

Starting in 1988, the Democratic party started re-building in the urban areas:

3 counties were added to the Democratic column in 1988, resisting the GOP pull in that year: Boulder, Summit and Lucas counties. And those counties have become core DEM counties since then.

8 counties joined the Democratic column in 1992 and have stayed there since then: Palm Beach, Broward, Volusia, Bernalillo, Franklin, Montgomery, Clark, Miami-Dade. They are mostly strong DEM counties, save for Montgomery and Volusia, which tend to go with leans margins. There are 4 more counties that joined the Democratic column in 1992, but were reclaimed by the GOP in either 1996 or 2000: Pasco, Wake, Stark, Guilford. Pasco returned to the GOP in 2004 and has stayed there. It is therefore the only county to complete buck the blue trend, in spite of reduced margins in 2008.

Mecklenburg and Pinellas counties joined the Democratic column in 1996, were reclaimed by the GOP in 2000 or 2004 and were reclaimed by the Democratic party in 2004 or 2008.

Fairfax joined the Democratic column in 2000 and has stayed there since, with ever increasing margins.

Orange and Marion counties joined in 2004 and were retained in 2008. Both of these retentions had massive margin shifts toward the Democratic party in 2008: +18.41 and +26.40%, respectively.

The 8 counties that Obama picked-up are clear to see in the middle of the table. Six of those counties have one thing in common: this is the first time they have gone Democratic since 1964, statistical evidence of a sweep similar to but not as extreme as Johnson in 1964: Hamilton, Douglas, Jefferson, Wake, Hillsborough and Pinellas counties were slightly smaller wins for the Democratic party than in 1964. However, Washoe and Arapahoe counties were larger wins for the Democratic party than in 1964, thus breaking a 44 year record. Notice that both of those counties are in the west.

We can see clearly from the table that the last time a party had flipped 8 counties or more was in 1992, when Bill Clinton picked-up 12 counties. George W. Bush, Jr. picked up 3 counties in 2000 and 1 more in 2004. Those counties returned to the Democratic party in 2000 or 2004.

In 1988- just analyzing these 40 counties- there were 8 Democratic counties and 32 Republican counties. In 1992, out of the same mix of 40 counties, there were 20 Republican counties and 20 Democratic counties, an even split. In 2000, there were 21 Republican counties and 19 Democratic counties. But in 2004, in spite of a republican re-election, the Democrats had 22 counties, the Republicans 18. And now in 2008, it’s 30 Democratic, 10 Republican. There can be no doubt about it: statistically, the urban areas in the Union have moved decisively to the Democratic party in 47 of 50 states (the evidence for which I will present before the end of 2009). This example from the 9.25 Democratic pick-ups is mild in comparison to the statistical data that came out of cities in core Democratic territory: Philadelphia (83% for Obama), Detroit (74% for Obama), New York (86% for Obama), Los Angeles (69% for Obama), Seattle (70% for Obama), Portland (77% for Obama) Chicago (76% for Obama), Boston (64% for Obama), Honolulu (70% for Obama), Milwaukee (67% for Obama), Madison (73% for Obama), New Orleans (79%), Baton Rouge, Dallas (deep in GOP territory: 57% for Obama), St. Louis (60% for Obama) etc, etc, etc.”

Conclusion:

“The Democratic wins in the pick-up states, as in the retentions, was not the example of the Democratic party barely holding on the to so-called “blue” states plus one “red” state or getting to one vote over 50%. The sweep through the pick-ups is statistically clear. The last time a sweep like this happened in the Republican party, it held the white house for 12 years. On the other hand, Johnson and Nixon had massive sweeps in 1964 and 1972 and in spite of this,the White House switched hands in the following cycles. So, though such a sweep is no forecast for the future, the data tells us quite clearly where the new battle lines will form in these nine states for the 2012 General Election. And both parties will be targeting key counties in key districts in 2010 in order to sway the affected area to their side before 2012 even gets off the ground.”

————————————————————–

Here the links to the individual analyses, with a detailed description afterwards:

Mid-west:

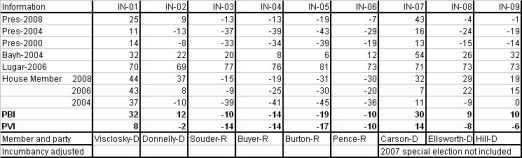
OHIO – Part I, Part II, Part III , raw data / INDIANA – Part I, Part II and Part III, raw data

IOWA – Part I, Part II, Part III, raw data / NEBRASKA CD-02 – raw data

South:

VIRGINIA – Part I, Part II, Part III, raw data / NORTH CAROLINA – Part I, Part II, Part III, raw data  

FLORIDA – Part I, Part II, Part III, raw data

West:  

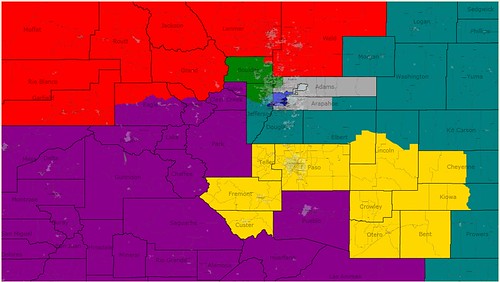
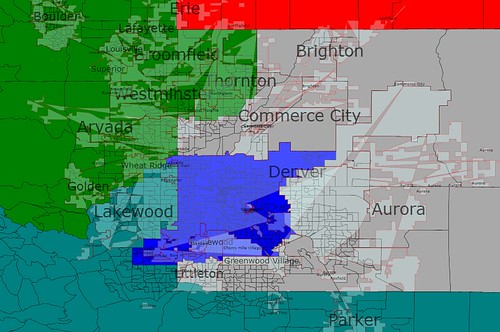
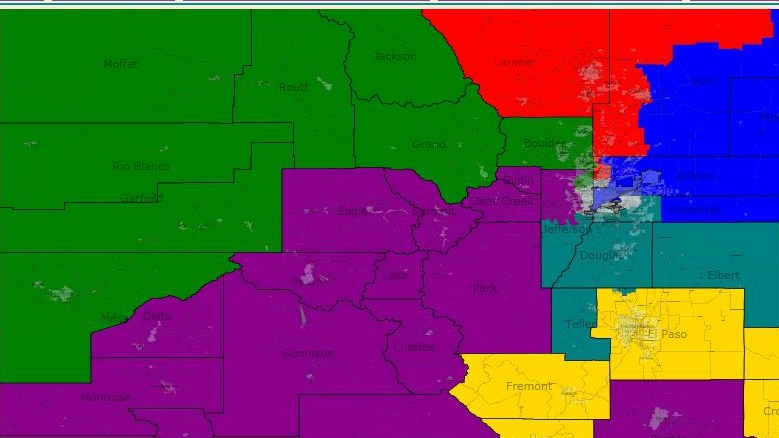
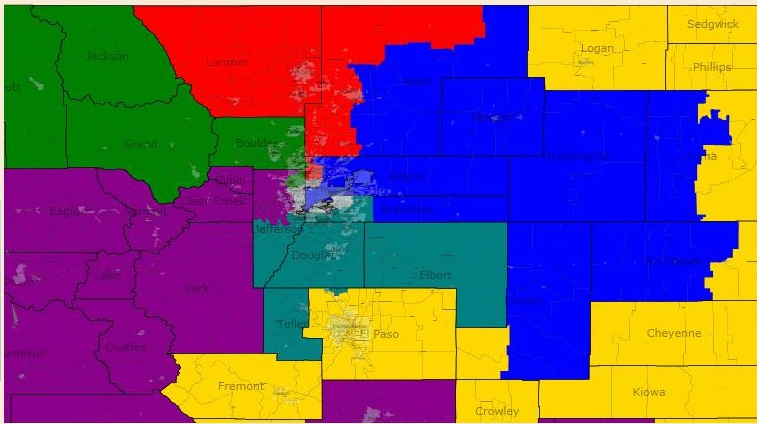
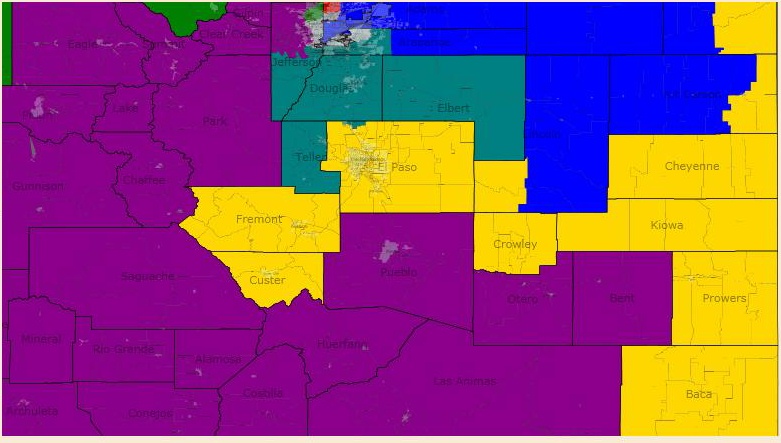
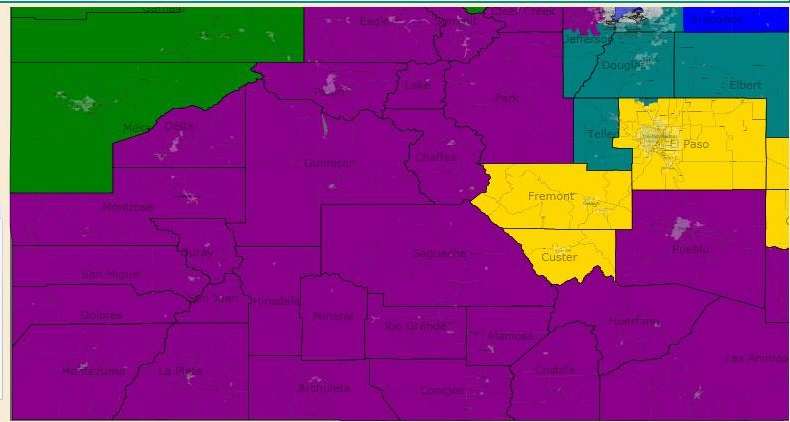
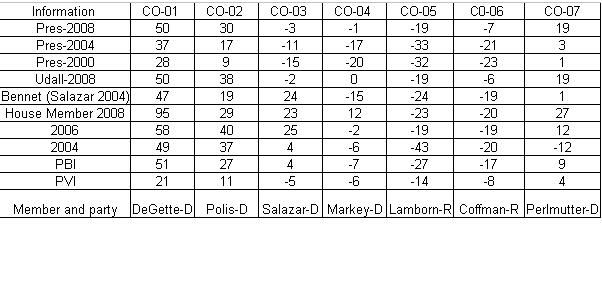
COLORADO – Part I , Part II , Part III , raw data, special 9-county 48-year voting history study

Supplemental to Colorado: DEMOGRAPHIC and ECONOMIC profile of Colorado (p.4, hispanic population)

NEW MEXICO – Part I, Part II, Part III, raw data, special 12 county 48-year voting history study   Supplemental to Nevada: DEMOGRAPHIC and ECONOMIC profile of New Mexico (p.4, hispanic population)  

NEVADA – Part I, Part II , Part III, raw data, special 6 county 48-year voting history study  

Supplemental to Nevada: DEMOGRAPHIC and ECONOMIC profile of Nevada (p.4, hispanic population)   Quick Census facts on Nevada  

An analysis for NE-02 (which is the „.25″ part of „9.25″) will be published when I have received the complete precinct data for Douglas and (part of) Sarpy counties from election officials who are willing to dig up the data over 48 years for me. But a comparison 2008 to 2004 is already possible and here is the raw-data.

Links to the large analysis for the entire Union

Full analysis Part I

Full analysis Part II  

Full analysis Part III

Full analysis Part IV  

Full analysis Part V

raw-vote total data  

Obama’s standing in the national rankings since 1824  

Obama’s standing in the rankings, per state

Redistricting 2011: Colo. & Minnesota

I am now on Episode 10 of my redistricting series, if you can believe it! Tonight we cover Colorado and Minnesota. I drew two maps for Minnesota — one if the Republicans hold Tim Pawlenty’s governorship in 2010, and the other if Democrats manage a gerrymandering monopoly. (The Dems have solid state legislative majorities, so that element seems set in stone.)

Previous efforts:

Diary 1: Massachusetts and Texas

Diary 2: Michigan and Nevada

Diary 3: Iowa and Ohio

Diary 4: Georgia and New Jersey

Diary 5: Florida and Louisiana

Diary 6: Pennsylvania and Utah

Diary 7: Illinois and South Carolina

Diary 8: Indiana, Missouri, and Oregon

Diary 9: Alabama, Arizona, and Kentucky

Jump below, if and only if you dare!

Colorado

The process here is fairly straightforward. Whether Democrats hold their current monopoly in 2010 or lose the governor’s mansion (the state legislature seems locked-in), incumbent protection will be the name of the game, aimed especially at solidifying Democratic Reps. Betsy Markey and John Salazar (most pointedly the former). Democrats would be foolish to try for a 6-1 majority and no one seems to think they’ll try it.

My map definitely solidified Markey without hurting DeGette, Polis, or Perlmutter, but it didn’t go as far as I hoped in protecting Salazar (my 3rd remains quite rural and is more of a swing district, but far from strongly Dem-leaning). Given the need to dole out favorable Denver suburbs to Polis, Perlmutter, and Markey, there’s little Denver-area turf left to give Salazar. What to do?

Colorado

District 1 – Diana DeGette (D-Denver) — all of Denver and 19% of Arapahoe preserves a solidly liberal district.

District 2 – Jared Polis (D-Boulder) — it may look rural and Rocky-heavy on the map, but the population anchors are Boulder County, which is kept whole, and Adams County, of which 35% is included. Less strongly Dem than before, but still plenty safe, with a moderate-liberal bent.

District 3 – John Salazar (D-Manassa) — my disappointment is that I only moved the needle a couple points in Obama’s direction here. It’s still very rural, and competitive in an open seat situation. There are big pockets of population in Grand Junction, Pueblo, and Jefferson County.

District 4 – Betsy Markey (D-Fort Collins) — New and improved for enhanced Democratic performance! 100% of Larimer, 65% of Adams, and 53% of Weld make for a safe district.

District 5 – Doug Lamborn (R-Colorado Springs) — meant to pack Republicans tightly.

District 6 – Mike Coffman (R-Littleton) — ditto in that this low-elevation “Colokansas” district packs GOP votes efficiently. I did cause some mischief by putting Coffman’s home in the 7th.

District 7 – Ed Perlmutter (D-Golden) — decidedly Democratic suburban Denver seat comprising half of Arapahoe and 80% of Jefferson.

Minnesota

This is the first state for which I drew two maps, one a Dem gerrymander and the other a bipartisan compromise map. Since Minnesota is expected to lose a seat for a new total of seven, there were some key differences in how I handled the dropped district (as well as how I drew the urban/suburban Twin Cities seats). Collin Peterson’s new 6th and Jim Oberstar’s new 7th are configured similarly in both maps, with Oberstar’s diluted a bit and Peterson’s shored up a tad to create two mildly Dem-friendly rural districts (though Peterson’s is still tough, especially with its geographical identity changing as population loss forces it to leech toward the Iowa border!).

I will run through the bipartisan map first since Republicans currently hold the gov’s mansion:

Minnesota Split

District 1 – Tim Walz (D-Mankato) vs. John Kline (R-Lakeville) — honestly, Walz vs. Kline was the only logical, not-too-awkward bipartisan incumbent showdown I could seem to configure. This district would be more or less evenly divided in partisan performance and evenly weighted in population between Walz’s southern base and Kline’s exurban territory.

District 2 – Erik Paulsen (R-Eden Prairie) — this map being the bipartisan variation, Paulsen gets a clearly more Republican district comprising Anoka County, 35% of Hennepin, and 26% of Carver.

District 3 – Betty McCollum (D-St. Paul) — anchored in Ramsey County, safely Democratic.

District 4 – Keith Ellison (D-Minneapolis) — 65% of Hennepin County, and that’s it, for a mostly urban Minneapolis district.

District 5 – Michele Bachmann (R-Stillwater) — I wanted to soak up all the Republicans I could find (and Bachmann will need them if she keeps up this way).

District 6 – Collin Peterson (D-Detroit Lakes) — how to protect Peterson without giving Oberstar an untenable district? Knowing the district would have to extend south, I tried to improve the PVI a bit by taking some rural Dem counties from his neighbor, but not move the needle too dramatically as that would jeopardize the esteemed Transportation & Infrastructure Committee Chairman.

District 7 – Jim Oberstar (D-Chisholm) — more of a swing district than before; Oberstar would be safe but Dems would have to fight for this as an open seat. Is it worth shoring up Peterson’s seat at the cost of making this one equally swingy? I’m no longer convinced.

Overall summary: two safe Dem seats (McCollum and Ellison), two relatively safe GOP seats (Paulsen and Bachmann), two swing seats that would remain safe for their current Dem incumbents (Peterson and Oberstar), one battleground (Walz v. Kline in the 1st).

And now, the hypothetical Democratic gerrymander should luck break our way in the governor’s race (and that certainly didn’t happen in 1990, 1994, 1998, 2002, or 2006, but I suppose the DFL is overdue for some good fortune in this given area):

Minnesota Dem

The two North Country districts certainly don’t look much different, but the other five, I think, would be quite altered under a Democratic plan.

District 1 – Tim Walz (D-Mankato) — this version mostly steers clear of the Twin Cities area and is heavier in small towns and southern counties that know and like Walz. I can’t knowledgeably estimate the presidential numbers here, but assume Obama would have still won, as I pointedly tried to avoid weakening Walz for other Democrats’ benefit.

District 2 – John Kline (R-Lakeville) vs. Michele Bachmann (R-Stillwater) — yay, a chance to eliminate Bachmann! Except that, based purely on factors of geography, media coverage, and name recognition, Bachmann would have a good fighting chance in a Republican primary here. Oh well, at least it’s an eliminated GOP seat.

District 3 – Erik Paulsen (R-Eden Prairie) — given how hard it will be to shore up Collin Peterson land without undermining Oberstar’s Iron Range seat, you can bet the Democrats would milk the Twin Cities for every vote they’re worth, and that means messing with Paulsen. Here his district comprises 58% of Anoka, 20% of Dakota, and 42% of Hennepin, for a moderately Dem-leaning/Obama-friendly suburban seat.

District 4 – Betty McCollum (D-St. Paul) — Give and take, give and take. So the 4th gets diluted a bit as it suburbanizes; it’s still plenty solid, but doesn’t waste votes as before.

District 5 – Keith Ellison (D-Minneapolis) — extends into Anoka County to hurt Paulsen but remains liberal and overwhelmingly Democratic.

District 6 – Collin Peterson (D-Detroit Lakes) — not a heck of a lot different than in the bipartisan map.

District 7 – Jim Oberstar (D-Chisholm) — ditto.

This map only includes one super-safe GOP seat, two very safe Dem seats, three swing seats that would be strong for their Dem incumbents (Walz, Peterson, Oberstar), and one swing seat that would be vulnerable to ousting its GOP incumbent (Paulsen).

Thoughts on either state are much appreciated!

Redistricting Colorado (2nd)

I decided to try redistricting in my home state of Colorado a while back, and after many many tries, I was able to put this together.  I know its been done, but mine is a little different.  

I used the 2007 estimates to put it together, since the 1st, 7th, 3rd, and 2nd won’t have enough people as they are to remain intact anyway.  

This map is assuming democrats continue to control both houses and the governor’s mansion, luckily its not likely that we lose any of the three.

My first goal was also making Markey safe, she’s a great representative, especially for such a traditionally red district, so wanted to pull her district out of the swingiest territory.  Second was changing the 3rd enough so that Obama would have won it, just shoring up Salazar some and keeping it really swingy, preventing most Colorado Republicans from winning there because they have moved so far to the right.  

With the 7th and 1st I wanted to make them more compact and make the 7th just safe no matter what, and wanted to dillute the blueness of the 2nd for the benefit of the 3rd.  

And then I tried to pack as many Republicans into the 5th and 6th as possible.

First the new 2nd would consist of all of Boulder county, retaining its center, Gilpin county, Broomfield county, the city of Thornton in Adams county, and the northern and western parts of Jefferson county that are not in the 7th.  On the western slope it would pull in Grand, Jackson, Routt, Moffat, Rio Blanco, and Garfield counties.  All of those except for Routt are generally red, and this would take those voters out of the 3rd, but the new 2nd would still be very blue with Obama getting about 63.6% of the vote.  

The new 3rd would retain its traditional base in Pueblo and the San Luis valley, and unfortunately I could not take out Mesa county, (the best suggestion I’ve gotten is to just let Utah have it) so I just tried bringing in other blue areas instead.  The counties added to the 3rd are: Clear Creek, Eagle, Summit, Lake, Baca, Crowley, the rest of Otero and most of Bent county.  Some of these are the eastern plains red areas but small enough or they vote for Democrats often enough to not make much difference.  In the new 3rd, Obama would have barely beaten mcCain with just 50.3% of the vote.

The new 4th is probably the most drastic change, and goes from a narrow Obama loss to a solid Obama win.  By losing all the rural plains counties as well as eastern Weld county, there is only the increasingly blue Larimer county and the bluing southwest Weld county, including Greeley.  What is added here is all of Adams county except for Commerce City, Westminster, and Thornton.  The result is a district where Obama received 54.4% of the vote.  

The new 1st and the new 7th are interesting, I had heard of an idea back in 2000 of splitting the city and coutny of Denver, so in this map I did that (to the best of my ability).  So the new 7th would contain all parts of Jefferson county that were in the old 7th with the addition of Westminster, the west side of Denver (including downtown), and the Adams county portion of Westminster.  The new 1st would contain the east side of Denver (including DeGette’s neighborhood), Commerce City, Aurora in Arapahoe coutny, Englewood, Cherry Hills Village, Glendale, and Littleton in Arapahoe county.  So the new 1st looks a little funky, but no more so than the city and county of Denver does anyway, and the new 7th is much more compact.  In the new 1st Obama received 68% of the vote and in the new 7th he received 64% of the vote.

The new 6th is much more republican and so out of our reach for the time being, but a 5-2 split was easier to protect than an attempt at a 6-1 split.  So the new 6th contains the rest of Arapahoe county, the rest of Jefferson county, and then Douglas county, Elbert county, and all the rest of the eastern plains counties, including eastern Weld county, and northeast Bent county.  In the new 6th Obama managed to get only 41.9% of the vote.

And the new 5th is almost identical to the old 5th, containing the counties of El Paso, Teller, Park, Chaffee, Fremont, and Custer.  Obama recieved 40.1% of the vote here.

So that’s what I came up with, with 3 solid blue districts, one leaning blue, one swing, and 2 solid red.

By what margin will Bob Shamansky win?

View Results

Loading ... Loading ...

Redistricting Colorado

I found this site a few months ago and have really enjoyed the content, so I decided I would try and contribute something. If you have any questions, comments, constructive criticism, feel free to let me know.

Background: I decided to start with Colorado, since it’s my home state. Colorado has both a Democratic governor and a Democratic legislature, allowing the Democrats to do as they please when it comes to redistricting. My first priority was to protect Markey, and my second priority was to put Salazar into a more favorable district that we’ll have a good chance of holding if he ever decides to retire.

redistricting colorado

District 1 – Diana DeGette – I didn’t change this district too much. This district includes Denver and Arvada, in Jefferson county. It is still very heavily Democratic; Obama got about 73% of the vote here.

District 2 – Jared Polis – This is the district I am least happy with. I tried to give Salazar a more favorable district by removing Mesa County (Grand Junction), which is a deep shade of blood red, and giving him all of the ski resort counties, most of which are insanely Democratic. However, that means that Polis’s district now contains Grand Junction, as well as some other conservative areas like Delta County. It’s still anchored by Boulder, though, and Obama got 57-58 percent of the vote here, but I’m still worried I might have diluted the district too much.

District 3 – John Salazar – John Salazar is as safe as can be in his current district, but I wanted to create a district that we’d have a good chance of holding if and when Salazar retires. To do that, I removed a whole section of his district stretching from Wyoming to Grand Junction. In its place, he got some heavily Democratic territory currently represented by Jared Polis, some swing areas to the west of Colorado Springs that are currently being wasted in Doug Lamborn’s district. Unfortunately, I also had to give him part of Douglas County, and a few of the counties on the eastern plains, but they are more than offset by Pueblo and the San Luis Valley. Obama got about 51-52 percent of the vote here, making it a swing district in presidential races.

District 4 – Betsy Markey – One of my main goals was making Markey safer. This is the district that I live in, and after six years of having Marilyn Musgrave be my voice in Washington, Markey is a nice change. I didn’t have to work too hard to make her safer, since the rapid growth in Weld and Larimer counties allowed me to move most of the Eastern Plains to a different district while adding hardly any new territory. This is another swing district where Obama won 51-52 percent of the vote, but I think it’s enough to make Markey safe.

District 5 – Doug Lamborn – I wanted to do something to get rid of Doug Lamborn; his two biggest backers are the Christian Coalition and the Club for Growth; that should tell you all you need to know. However, for the forseeable future, there is going to be a heavily Republican district based in Colorado Springs, so I stripped the district of the swing areas in the western section, and added most of the counties in the Eastern Plains that Markey was relieved of, as well as part of heavily Republican Douglas County. McCain got about 61 percent of the vote here.

District 6 – Mike Coffman – I thought about trying to come up with a gerrymander that would make Coffman’s district too Democratic for him to be re-elected, but I decided against it. However, don’t lose hope yet. Because of explosive growth in the district, it is dramatically reduced in size, and it is anchored by Democratic leaning Arapahoe County, as well as about 60 percent of the population of Douglas County. In the new, more compact district, Obama got 52-53 percent of the vote, and it’s still trending our way. Coffman, like most Colorado Republicans, is very conservative, and thus is a poor fit for a classic swing district like this one. He’ll have the fight of his life in 2012, and if he survives that, we’ll get him eventually just because of the long term trends in the district.

District 7 – Ed Perlmutter – Perlmutter’s new district is sort of gerrymandered, and looks like a pair of nunchucks. It contains all of Jefferson County except Aurora, and the parts of Adams County that aren’t in Polis’s district. It leans Democratic. Obama got about 56% of the vote in this district.

Another Open Senate Seat? Ken Salazar at the Top of the Rung for Interior

Hot off the presses a few hours ago:

President-elect Barack Obama, who has vowed to adopt an aggressive approach to global warming and the environment, will announce his choices to lead the effort at a news conference on Monday.

He is also close to naming a secretary of the interior — the federal department that leases public lands for oil and gas drilling. Sen. Ken Salazar of Colorado, who once practiced as an environmental lawyer, is the leading contender, sources close to the transition said.

Now that John Salazar is out of contention for Secretary of Agriculture, Ken could provide Obama with another prominent Hispanic in the Cabinet (as Raul Grijalva of AZ seems to have falled off the radar).

Who do you think would get the Senate seat if it opens up? This would be a big prize: Ken was young and had the seat as long as he wanted it, and Mark Udall was just elected, so no Dem would see a realistic opportunity to move to the Senate for 12 years, barring death/incapacitation.

Some of the possible names after the jump

Colorado has a deep Democratic bench, and as Ken was the most prominent Hispanic official in the state, there will be significant pressure on Gov. Bill Ritter to appoint a Hispanic replacement. Here’s a quick look at all the possible replacements, though:

Lt. Gov. Barbara O’Brien: A former nonprofit executive, O’Brien hadn’t held elective office before 2006, and would be unlikely to get the appointment, though she and Ritter seem quite close.

Treasurer Cary Kenendy: Young, photogenic and having won statewide office in 2006 against a solid Republican, Cary Kenendy is probably the easiest choice Ritter could make. She seems to like her current job though, and has two young children, which may make her unlikely to start the commute to and from DC.

Former Speaker of the House Andrew Romanoff: Another young, progressive,  popular Democrat who was just term-limited out of the House this year. He is currently applying to fill the now-vacant Secretary of State position, so openly looking for this appointment could smack of opportunism. Romanoff is one of the most effective and popular pols in Colorado, though, and could hold the seat against strong Republicans.

Rep. John Salazar: A non-starter, though people think he’d jump at the chance. His recent ascension to the Appropriations Committee would make becoming a junior Senator unappealling. He’s staying put in his right-leaning district.

State Rep. Alice Madden: A popular woman in the statehouse, Alice is a talented politician, but this too seems like a nonstarter. A purple state like Colorado wouldn’t accept having two Democrats from Boulder as its Senators.

State Sen. Peter Groff: The President of the Senate, and the most prominent black politician in Colorado. A relative moderate for a pol from Denver, he’d be a compelling choice, but would have a tough race in 2010.

Former State Sen. Polly Baca: Was talked up for lots of races in Colorado in the 1990’s, but never went for any of them. Would be the first Hispanic woman in the Senate, and would have strong institutional backing. She’d most likely be a placeholder though, as she’s getting older, and may not want to run a constant campaign for the next 2 years.

State Sen. John Morse: A Democrat from Colorado Springs, and a bright guy, John might be a good compromise choice if Ritter can’t quite decide on anyone. He’s a moderate, gets a ton of stuff done in the House, and doesn’t seem to have many enemies on either side of the aisle.

Thoughts? Additions? Dream Candidates?