AR, CA, IA, ME, NJ, NV, SC & SD Results Thread

11:33pm: Party’s moved next door.

11:31pm: AR-02 has been called by AP for Elliott, now 54-46. She’ll face Tim Griffin… probably not as good a matchup for Dems as Wills.

11:29pm: Angle’s back in the lead in NV-Sen! 35, to Lowden’s 33, with 21 for Tarkanian. 14% in. I’m sure we’ll see lots of back and forth gyrations in this one as different counties report. Lowden has small lead in Clark, while Angle has a much bigger lead in Washoe.

11:27pm: AP has called GOP primary in NJ-12 for Scott Sipprelle, rich guy, over teabagger opposition, but only 54-46. Rush Holt probably not very scared. GOP primary in NJ-06 is still 50-50, with Diane Gooch trailing by 100.

11:25pm: Add a couple more New Jersey races to the list of races where no-name teabaggers held moderates down to so-so numbers. Leonard Lance only racked up 56% in NJ-07, and Chris Smith in NJ-04 held to 69%. Both were ‘yes’ votes on cap & trade.

11:21pm: All the Arkansas House races are super close. In AR-01, it’s Causey 51, Wooldridge 49, with 94% in. In AR-02, it’s Elliot 52, Wills 48, with 91% in. And in AR-03, it’s Womack 50, Bledsoe 50, with Womack up by about 200, although that’s only with 75% in.

11:15pm: ME-Gov (R) called for Paul LePage. Looking like he’ll take on Libby Mitchell in the fall.

11:12pm: Only 1% reporting, but the AP has already called NV-Gov (R) for ex-judge Brian Sandoval. Even the RGA supported him over Jim Gibbons.

11:10pm: Oh yeah, poll closed in California ten minutes ago.

11:01pm: In Iowa, the AP calls IA-03 (R) for Brad Zaun, who will take on Leonard Boswell. In IA-02, Mariannette Miller-Meeks of the dreaded ophthalmologists will rematch against Dave Loebsack.

11:00pm: The AP calls AR-Sen for Blanche Lincoln.

10:51pm: A smattering of precincts and early votes coming in from Nevada, including Clark County (Las Vegas). Gibbons is losing big time to Sandoval in NV-Gov, 57-23. Chicken Lady ahead of Angle 36-33 with Tarkanian at 20.

10:48pm: Ganja break OVER! Maine is now up to 38% in. Libby Mitchell has extended her lead to 34-26 over Rowe, and Paul LePage is cruising.

10:43pm: How baked must they be in Maine right about now? Been at 12% since… whoa… are those Cool Ranch Doritos?

10:40pm: Chad Causey looks like he might hold out over Tim “The Hangman” Wooldridge in AR-01. Meanwhile, Joyce Elliott now has a lead over Robbie Wills in AR-02. And in AR-03, teabagger fave Cecile Bledsoe is beating Steve Womack 54-46. Bledsoe is both a teabagger queen and sort of the establishment choice – I dunno, though, it was a weird race.

10:37pm: We’re pretty confident in calling ND-AL for state Rep. Kristi Noem, who beat the more-or-less establishment choice, SoS Chris Nelson. You only need 35% to avoid a runoff in SD, and Noem has a 41-36 lead with most of the votes in.

10:32pm: Halter took a brief lead for a moment there, but it’s back to where it was.

10:27pm: AR-Sen is 51-49 Blanche, but Halter is still behind where he needs to be, according to our model. If you want a fuller explanation of how our model works, click here.

10:23pm: With 12% reporting, Terry Branstad is up just 51-40 over Bob Vander Plaats in IA-Gov (R).

10:13pm: Can’t wait to see those NV-Sen results start to roll in (soon, I hope). Meanwhile, our friends up in Maine seem to be on the first ganja break of the evening.


RESULTS:

AR, ME, NJ, SC & SD Results Thread

10:19pm: It’s a moveable feast – join us in the new thread.

10:09pm: I think I forgot to mention that the AP called SD-Gov (R) for Dennis Daugaard a few minutes ago. He’ll take on Scott Heidepriem in November.

10:06pm: In AR-01, Chad Causey is a little bit behind where he needs to be from round one in order to beat Tim Wooldridge. In AR-02, Joyce Elliott trails slightly, but she’s actually out-performing her first-round share by a lot, suggesting she’ll take the win. See our model for more.

10:03pm: With 12% reporting in Maine, Paul LePage has a 34-17 lead over Les Otten on the R side, while it’s a very tight 31-30 for Libby Mitchell over Steve Rowe on the D side.

10:00pm: It’s ten o’clock – do you know where your polling place is? Well, it’s closed now if you live in IA, MT or NV.

9:52pm: Ayup – the AP calls a runoff between Haley and Barrett. Monster failures on the part of McMaster and Bauer.

9:45pm: We project that Nikki Haley will miss out on avoiding a runoff by about 5,000 votes. Meanwhile, in SC-04, Gowdy is down to 42%, but Inglis is at just 26%, and the AP has called it for a runoff between those two men.

9:44pm: That’s funny – AR-01, AR-02 and AR-03 are all 51-49 right now.

9:39pm: Compared to his round one showing, Halter is doing three points worse in the territory that’s already reported.

9:35pm: Hmm, so, things aren’t really looking so hot for Bill Halter so far. Lincoln’s up 53-47, but much of what’s reported is (narrowly) Halter country.

9:33pm: AP calls it for Jon Runyan in NJ-03 (R). His 56% looks pretty unimpressive, if you ask me.

9:31pm: It seems all but certain that the GOP primaries in SC-01 and SC-03 (both open seats) will go to runoffs. No one has more than 30% in either race.

9:23pm: While NJ-06 and NJ-12 are not high on anyone’s takeover lists, the establishment GOP picks in each race – Diane Gooch and Scott Sipprelle – are both trailing teabaggers, as nj1122 points out.

9:19pm: John Runyan, the establishment choice by a hundred yards in NJ-03, is only up 54-46 on Justin Murphy with about 38% in.

9:15pm: Back in SC-04, Trey Gowdy has 49.6% of the vote with 50% reporting. That rounds up to 50, of course, but he’ll actually need 50%+1 to clear the runoff hurdle.

9:13pm: In SD-AL, establishment fave Chris Nelson only has a narrow lead over Kristi Noem, 41-39 with 25% in.

9:12pm: With 19% of the vote in in SD-Gov (R), Dennis Daugaard has a huge 53-21 lead over Scott Munsterman. Daugaard is generally considered to be the more conservative contender.

9:11pm: Blanche Lincoln up 54-46 with about 2% reporting.

9:09pm: Oy. Let’s hope not.

9:07pm: Note that our model for Arkansas is being thrown off right now by the absentee votes. As more votes come in, it should start to make more sense.

9:03pm: Polls have also now closed in the western part of South Dakota (they closed in the east an hour ago).

9:00pm: The AP has called SC-Gov (D) for Sheheen, who wins the Dem nod without a runoff.

8:56pm: No results in from Maine yet, but we also have a model (more of a back-of-the-envelope projector) that aggregates results by county for ME-Gov.

8:51pm: Meanwhile, in SC-04, our model is predicting a runoff. Trey Gowdy has 44% and Rep. Bob Inglis has a truly feeble 26%. Even if Inglis survives to a runoff, he’ll be in extremely bad shape.

8:50pm: With a little over a third of the vote in, state Sen. Vincent Sheheen is pulling an impressive 58% in SC-Gov (D), while Jim Rex trails at 23 and Robert Ford is at 19. Sheheen might avoid a runoff here. On the GOP side, Nikki Haley is at 46 and Gresham Barrett at 26.

8:48pm: Looks like a handful of votes have shown up in Arkansas, but zero precincts are listed as reporting, so I’m guessing absentees and the like.

8:33pm: We have a bitchin’ model for the AR-Sen runoff, which you can check out here. We’ll keep it updated throughout the night so that you can see our latest projections.


Polls have now closed in Arkansas, and we’re still counting votes in ME, NJ & SC.

RESULTS:

SC, VA & GA-09 Results Thread

8:34pm: This thread is getting a bit portly, so time to head on over to our new party scene.

8:27pm: For a while there, it was looking like Bob Inglis might lose outright tonight, with Trey Gowdy over the 50% mark. Now we’re looking like a runoff, with Gowdy at 34 and Inglis at 31 with 20% reporting. That’s not good news for Inglis either, as Gowdy’s likely to consolidate the anti-sanity vote.

8:25pm: Huh, I’d totally forgotten that John Adler (the Dem in NJ-03) was getting a challenge from the left over his HCR vote. He’s at 75%, against Bob Bendar.

8:24pm: We’re starting to see some New Jersey numbers trickling in. Most notably, in NJ-03, establishment meathead Jon Runyan is leading teabagger Justin Murphy 64-36, with 2%.

8:22pm: OK, go ahead and put that check mark next to Graves after all. The AP just called GA-09 in his favor.

8:17pm: Don’t quite put that check mark next to Tom Graves’ name in the GA-09 special just yet. He’s losing some ground, now leading Lee Hankins 59-41 with about half in. He’s crushing in every county except Hall (presumably Hankins’ home), which is keeping Hankins in the game.

8:13pm: In the GOP primary in the 3rd, all I can tell you is that we’re going to a runoff and CfG fave Jeff Duncan will be one of them. Three other guys are bunched around 15-19%, and right now the previously unheralded “R. Cash” is on track to make the runoff at 19%. (10% reporting.)

8:11pm: The AP has called it for Keith Fimian in VA-11, so we’re pretty much done in Virginia. That’s probably good news for Gerry Connolly; the more moderate Herrity would seem to match up better.

8:10pm: Looks like some asses finally got in gear in SC, as they’re suddenly up to 8% reporting. For the Rs, it’s still a Haley (40)/Barrett (28) runoff. McMaster’s at 17, Bauer’s at 14. Looks like the last-minute polygraph thing didn’t pan out. For the Ds, Sheheen is at 54, with Rex a surprisingly weak 26 and Robert Ford a surprisingly strong 20.

8:08pm: As far as actual numbers, in the 2nd, it’s Rigell 41, Loyola 24, Mizusawa 20, with 48% in. Not a dominant performance, but a win’s a win, and no runoffs in VA. In the 11th, it’s Fimian 61, Herrity 39, with 58% in.

8:06pm: AP has called it for Scott Rigell in VA-02.

8:05pm: Polls have closed in Maine and New Jersey, so we’re adding links for those below. Let’s see if anyone showed up in Maine.

8:00pm: Ticker tape is spewing out from the SSP Lab mainframes, and we’re feeling like we’re at a place where we can call both VA-02 for Scott Rigell and VA-11 for Keith Fimian. It would require massive turnarounds to go a different way at this point.

7:54pm: Still less than 1% in in SC-04, but Trey Gowdy is whomping Bob Inglis, and everybody else; he has 66 to Inglis’s 17. Of course, these are coming from Spartanburg, which is Gowdy’s home county, so expect that to tighten.

7:49pm: Things also seem to be going according to plan for the NRCC in the 2nd, where establishment pick Scott Rigell has 41%, ahead of Ben Loyola at 23, who just pulled ahead of Bert Mizusawa, at 21. We’re at 37% reporting.

7:46pm: Hmm, the twittersphere is saying that Rob Hurt has been declared the winner in VA-05. He’s up to 46% of the vote, with 65% reporting. McKelvey’s still in 2nd at 26%. If McKelvey follows through with threats to support the 3rd-party teabagger indie in November, he could probably move a bunch of votes with him.

7:44pm: We can probably expect a call soon in the GA-09 special. With about 23% reporting, CfG fave Tom Graves still leads Lee Hawkins 65-35.

7:42pm: In SC-Gov (R), it’s looking like a two-person race to make the runoff, between Haley (37) and Barrett (32). Still less than 1% reporting, though. (Also good for a laff: Trey Gowdy is winning 100% of the vote in SC-04. Out of a total of 2 votes, all from the 1 precinct out of 265 that’s reported.)

7:37pm: Things not looking so hot for Pat Herrity, the more establishment choice in VA-11. With 15% in, he’s still trailing Keith Fimian 61-39. Also worth noting he’s ahead only 50.1-49.9 in his home county of Fairfax, where he’s a county supervisor (granted, Fairfax Co. takes up about 2/3ds of the district, so maybe the Herrity areas haven’t reported yet).

7:34pm: Dang, more seesawing in VA-02. Rigell’s back in front at 40, with Mizusawa at 29. We’re at 26% reporting.

7:31pm: The AP is finally dribbling out some SC details. With a whopping 3 precincts out of 2,109, Nikki Haley’s just above the runoff-avoidance mark at 51%. Gresham Barrett’s in 2nd at 30. On the Dem side, Vince Sheheen is at 52 with Jim Rex at 41.

7:28pm: I might have been hasty about VA-02; check it out. Bert Mizusawa has actually pulled ahead of Scott Rigell, with 17% reporting. Bert’s up 37-33, with Ben Loyola at 18. Maybe Rigell’s insufficient purity caught up with him after all.

7:27pm: In VA-05, we’re up to 33% in. Hurt’s just moving sideways, still at 40%, but McKelvey is losing ground as other teabaggers’ local strongholds seem to be trickling in. McK is at 31, with McPadden up to 11.

7:26pm: Things are closing a lot in VA-11; maybe they started with Keith Fimian’s precinct. Fimian still has a big lead over Herrity, though: 63-37, with 6% in.

7:24pm: The AP has already called the GOP primary in VA-01 for incumbent Rep. Rob Wittman. Not that he was expected to lose to Cathy “Bullet Box” Crabill, but it wasn’t close.

7:21pm: Early outlook in GA-09, with 1% reporting, is a big lead for Tom Graves. He’s leading Lee Hawkins 65-35. Looks like that whole construction lien story didn’t damage him much.

7:19pm: Things are actually moving fast in VA-05. We’re up to 20% reporting. And things are tightening up between Hurt and McKelvey. It’s now Hurt 40, McKelvey 36. Remember, though, that VA doesn’t have runoffs.

7:17pm: Hmmm, I wonder if this a geographical blip or a sign of things to come? In VA-11’s GOP primary, 2008 nominee Keith Fimian is pounding Pat Herrity, by a surprising 80-20 margin. 1% is in.

7:15pm: There’s 1% in in the 2nd, and as expected, Scott Rigell, the wealthy guy/establishment choice, has a large lead. He’s at 57%, with Bert Mizusawa at 18%.

7:12pm: No preliminary ganja break in Virginia; they’re hitting the ground running. (These results are only at the BOE, not at the AP yet.) Maybe most significantly, with 4% reporting in the GOP primary in VA-05, Robert Hurt is in first place at 47%. Jim McKelvey seems to have consolidated much of the teabagger vote; he’s not too far back at 37%, with everyone else in single digits.


Polls are set to close in half an hour in South Carolina, Virginia and Georgia, and we’ll be using this thread to follow the returns. We’ll put up new threads throughout the night as polls close in other states. Grab your Pop Secret and let’s go!

RESULTS:

The Solid South

By: Inoljt, http://thepolitikalblog.wordpr…

It is a popular today to say that the South has switched from voting Democratic to Republican. Many people are fond of looking at previous electoral maps. Hey, isn’t that funny – the states have completely switched parties. It’s like the Republicans have recreated the Solid South.

That statement is unequivocally false. Most people have no idea how unbelievably Democratic the Solid South was. For half a century, Democrats in the Deep South did about as well as the Communist Party did in Soviet Union elections.

Let’s take a look at a model Republican southern state: Alabama. John McCain won 60.32% of the vote here, his second best showing in the South. Below are the counties in which Mr. McCain won over 70% of the vote (all my statistics below are from http://www.uselectionatlas.org/ – an amazing website).

Photobucket

That’s a lot of counties. The Republicans are doing quite well – about as well as the Democrats used to do in Alabama, many would say.

Here is another map, filled with blue counties.

It is the 1940 presidential election. I invite you to guess – what do these blue counties represent? Counties in which Roosevelt won over 70% of the vote? 80%? 90%? Remember, Roosevelt was quite a popular guy. He must have done pretty well in Alabama, part of the Solid South.

Photobucket

Continued below the flip.

In fact, the blue counties are those in which Roosevelt won over 95% of the vote in 1940. In all, he won 85.22% of the good folk of Alabama.

Those are incredible numbers. If today that result occurred, we would all cry fraud.

Of course, fraud – of a sort – was occurring in Alabama at that time. As everybody knows, blacks were not allowed to vote at that time. Notice how all but one of the blue counties surround Alabama’s Black Belt. What is less well known, however, is that many poor whites (more likely to vote Republican) were also unable to vote. The poll tax didn’t hurt just African-Americans, after all.

Different southern states enacted different voting restrictions with an intent to continue Democratic dominance. Some were more strict; some were less so. Republicans in North Carolina, for example, generally held Democrats to below 60% of the vote; they even won the state in 1928. On the other hand, South Carolina probably disenfranchised the most voters.

Here is the result:

Photobucket

The blue indicates a county that gave the Republican candidate less than 10% of the vote – for nine straight elections, from 1912 to 1944. From 1900 to 1944, South Carolina’s average vote (per election) went 94.89% Democratic, 3.98% Republican.

How did South Carolina achieve this amazing result?

A revealing clue is provided by looking at the voting count numbers. For example, in the year 1912 a total of 50,405 people voted in South Carolina (48,357 of whom supported the Democrat). At that time the census had just reapportioned electoral votes; South Carolina had a total of nine.

By comparing South Carolina to states with similar populations, one can get an idea of how many potential voters were disenfranchised. Kansas, for example, had ten electoral votes; 365,560 people in the state voted that year. West Virginia had eight electoral votes; 268,828 people voted in that state (remember, this was before women’s suffrage). In South Carolina, therefore, several times more citizens “should” have voted than actually did.

In conclusion, to state that the Solid South always voted Democratic is a misnomer. Even to say that it voted extremely Democratic might still be inaccurate. It would be like saying I’m interested in politics. Technically its true, but the picture the words imply far and away understates the reality.

SC-Gov: Jim Rex moves closer to run

    State Superintendent of Education Jim Rex, currently the only statewide elected Democrat in South Carolina, plans to file paperwork today to form an exploratory committee to look at running for governor in 2010. Rex says he will make a decisions on whether to run by September. Rex could also choose to run for reelection for his current post.

     If Rex chooses to run this could be a game changer for the good guys. Jim Rex has spent much of his life working in higher education ( President of Columbia College, Dean of Education at Winthrop University and Coastal Carolina University, and Vice President at the University of South Carolina). Education should be a big issue in next year’s election due to fallout from a statewide tax swap that has made public school’s more reliant on revenue from the sales tax. There is fear this will cause a budget crunch for many school districts and this is an issue that Jim Rex could exploit. It also worth remembering that Jim Hodges won the 1998 governor’s race by emphasizing funding for education.

     This is an important race for Democrats. While I personally think South Carolina is going to be heavily Republican for the forseeable future, in order to begin to win in places like South Carolina, we need a base to build off of. If we control the governor’s office, it will give us somebody to build the party around. Given the fact that Jim Rex has a statewide profile and organization, he would clearly be our best candidate. While it would still be a tough race, this drastically improves our chances of winning this race.


South Carolina Redistricting with Republicans in Control

I finally decided to create a map that is realistic. Since Republicans seem to be in control of South Carolina, I think they will aim for a map like this one. It is 5-2 Republican even though some of the Republicans should have shaky holds on their districts. I decided to think like a Republican would to draw this map. My main objectives were to strengthen Republicans Henry Brown and Joe Wilson while creating a new Republican district. I also strengthened John Spratt because it is almost impossible to weaken him enough to beat him while protecting the other Republicans. Anyway, Spratt is heavily entrenched. Also, I want to say thanks to Dave of Dave’s Redistricting App for enhancing the feature. Now here are the maps.

South South Carolina

Southern South Carolina

Up Country

Up Country

Eastern South Carolina

Eastern South Carolina

Charleston Area

Charleston Area

District 1 Henry Brown (R) Blue

The Republicans biggest worry should be that Brown has not been strengthened enough by redistricting. Yes, he does have most of Charleston County but the parts he has are mostly Republican. I did not alter the old district boundaries there much. Also, he has Republican Horry County to offset Democratic margins. I am not sure if I strengthened Brown enough. McCain probably won 55%-57% of the vote here. The racial stats are 17% African American and 75% White. Status is Likely Republican.

District 2 Joe Wilson (R) Green

Wilson also had a surprisingly competitive race even though he won by 10 points. I helped shore him up and reduced the African American percentage of the population by three points. I removed most of the Democratic rural counties and the parts I included were only to connect the coastline to Aiken and Lexington Counties. I strengthened Wilson even more by putting in Republican parts of Berkeley and Dorchester Counties. McCain probably won 56% of the vote here. Racial stats are 23% African American, 5% Hispanic and 68% White. Status is Likely Republican if Democrats want to challenge this district.

District 3 Gresham Barrett (R) Purple

There is not much difference here. Barrett is pretty safe with heavy Republican margins from Oconee and Pickens Counties. Even with McCormick County which leans Democratic, Barrett has no worries. I even reduced the African American population by two points. McCain probably won 64%-65% of the vote here. Racial stats are 18% African American and 76% White. Status is Safe Republican.

District 4 Bob Inglis (R) Red

I did not alter this district much either. Inglis is pretty safe without any worries. The only changes I made were removing Union County and part of Spartanburg County, mostly for population purposes. McCain still probably won about 60% of the vote here. Racial stats are 18% African American, 6% Hispanic and 71% White. Status is Safe Republican.

District 5 No Incumbent (R) Yellow

This is the new district I created for the Republicans. It basically contains Republican areas in the Up Country, Conservative Lexington County and some white parts of Richland County. I slipped in part of Chester County which Obama barely carried but this should still be Republican. I do not know who the new Republican congressman might be here. I found the names Jeff Duncan and Mac Toole, Republican members of the South Carolina State House whose districts contain part of the 5th. I have no idea if they are potential candidates or not. It would be great if someone who knows South Carolina better could elaborate on it. McCain probably won 62% of the vote here. Racial stats are 21% African American and 71% White. Status is Safe Republican.

District 6 James Clyburn (D) Teal

Since Clyburn is pretty safe, I left him alone pretty much. All I did was remove some northeastern precincts to strengthen John Spratt. All I can really say about this district is that it is still African American majority and Republicans have no shot at winning it. Obama probably won 67% of the vote here. Racial stats are 57% African American and 37% White. Status is Safe Democrat.

District 7 John Spratt (D) Gray

Since the Republicans would be pushing all the Republican areas into other districts, they had to leave behind some Democratic areas and many of them went here. Spratt is strengthened by the removal of most of York County and the inclusion of some African American precincts from the old 6th district. This increases the African American population from 32% to 39%. The changes do not matter much because Spratt is pretty safe. They do help elect a Democrat when he retires. Obama probably won 53% of the vote here. Racial stats are 39% African American and 56% White. Status is Safe Democrat.

By what margin will Bob Shamansky win?

View Results

Loading ... Loading ...

South Carolina Redistricting Maps

I made this map aiming for a 4-3 Republican delegation. Even though I strengthened shaky Republicans like Henry Brown and Joe Wilson from the 1st and 2nd districts, I was able to create a new safe Democratic district. This is assuming that South Carolina gets another district and that Joe Wilson and Henry Brown survive 2010. My main objectives were to keep John Spratt and James Clyburn safe and create a new Democratic district. The problem is that I wanted to create a new African American majority seat but I was unable to. Maybe the new district could be branded as a coalition district since Whites are a minority. This plan will probably not pass if Republicans control the legislature and the Governorship. Anyway, my next map will be Georgia or Minnesota. There will be no “different state” on the poll this time. Yes, I love giving polls and I have been asking the same question, I will admit. I guess I do not need to explain what the rankings mean. Well, here is the link to the maps http://frogandturtle.blogspot….

District 1 Henry Brown (R) Blue

Yes, I had to strengthen him even though I did not want to. He won by 4 points against openly lesbian Linda Ketner. In South Carolina, such a narrow win against an openly gay candidate is humiliating to Brown. I strengthened Brown by removing most of Charleston County (his district connects by water.) He should be safe with a strong base in Horry County and the Republican parts of Charleston County. I think McCain won this district with about 60% of the vote. Racial stats are 15% African American, a few points lower than the percentage for the current 1st and 78% White. Status is Safe Republican.

District 2 No Incumbent Green

This was my failed attempt at an African American majority district. It takes in most of Charleston County and Democratic parts of Berkeley and Dorchester Counties. I know I am going to get criticisms for not exchanging some parts of the 2nd district with the 1st. I wanted to make the White population a minority here so I could form a coalition district. I am not sure if I can do that with such a low Hispanic population. This district also takes in every Democratic area near the coast and even snakes up into heavily Republican Aiken in Central South Carolina. Even though I could have made this an African American majority district, I had to protect Clyburn without creating a district more convoluted than the old NC-12. Anyway, Obama probably won 58% of the vote here. Racial stats are 46% African American and 47% White. Status is Safe Democrat.

District 3 Gresham Barrett (R) Purple

I know that Wilson won by eight points in the last election but I needed to strengthen the 2nd district. I changed the look of this district a bit by extending it completely up the border of South Carolina and Georgia all the way up to the North Carolina border. I removed all of Richland County (Columbia) and almost all of Conservative Lexington County. Even though Gresham Barrett has his home here, Joe Wilson might take a run because it contains most of his old district. From the looks of the district, only a strong challenger could make this competitive. McCain probably won here with 63% of the vote. Racial stats are 20% African American and 74% White. Status is Likely Republican.

District 4 Bob Inglis (R) Red

Since the South Carolina Up Country is so Conservative Inglis should have no trouble here winning against a Democrat. I made the district even more Republican by removing the inner city of Spartanburg. This district is still based in Greenville and I had the district take in part of Pickens County. I think McCain won here with 64% of the vote. The racial stats are 16% African American (lower than the 20% African American population from the old 4th,) 6% Hispanic and 75% White. Status is Safe Republican.

District 5 Joe Wilson (R) Yellow

Joe Wilson should be strong in his Lexington County base but he should be wary of a challenge from the northern part of the district. An Up Country Republican may take a run at this district and looking at Wilson’s not so large 54% winning percentage from 2008, he may be in trouble in a primary. He should not worry about the general election because the territory the district includes is heavily Republican. McCain probably won here with 67% of the vote. The racial stats are 17% African American and 75% White. Status is Safe Republican.

District 6 John Spratt (D) Teal

Even though I needed to keep the African American percentage high for two other districts, the African American population of this one did not change much. It decreased by one point, to 31%. Since I kept most of the old territory in this district, I believe that Spratt should not worry about a challenge. He has been Congressman since 1982. I think that McCain won with 53% of the vote here. The racial stats are 31% African American and 64% White. Status is Safe Democrat.

District 7 James Clyburn (D) Gray

This district looks a bit convoluted. I had to make it this way to keep it an African American majority district so the Voting Rights Act can protect it and also protect Clyburn. I barely succeeded in keeping the African American population above 50%. I had to extend it all the way up to Spartanburg and I almost sent it into Greenville to take in African American precincts without endangering the 2nd or the 6th district. Clyburn should be safe even from a primary challenge. Obama probably received 62% of the vote here. Racial stats are 51% African American and 43% White. Status is Safe Democrat.

By what margin will Bob Shamansky win?

View Results

Loading ... Loading ...

Redistricting South Carolina: 2 Black-Majority Seats UPDATED

Ok, so this is my first redistricting diary not focused on Michigan.  I chose the state of South Carolina for several reasons, it’s relatively small, it will probably gain a seat, and that new seat may be a Majority-Minority seat.  I don’t know if the DOJ will require a new Min-Maj seat, or what the recent Supreme Court decision has to do with this.  

The rest of the map I drew with a Republican gerrymander in mind.  I tried to dislodge Rep. Spratt, and I think that I was probably successful.  I also made Rep. Brown and Rep. Wilson safer, in light of their recent competitive races last year.  

This map is incredibly gerrymandered.  I mean incredibly.  I don’t know much about SC, so let me know if I’ve done something wrong.

District 1- Henry Brown (R) Blue

72% White, 19% African American, 6% Hispanic

Drops all of Horry County (Myrtle Beach) in exchange for Beaufort, Hilton Head area.  Drops some heavily African American areas in exchange for more Republican Charleston areas.

District 2- Joe Wilson (R) Green

77% White, 17% African American, 3% Hispanic

This is the most gerrymandered non-VRA seat, mostly so that it can cede it’s black areas to the new 7th District.  It follows the SC-GA border, then winds down to the Columbia area and takes in almost all of Lexington County, where Wilson’s home is located. AA population drops almost 10% and this district is much safer for Wilson.

District 3- TBD (successor of Gresham Barrett) Purple

78% White, 14% African American, 5% Hispanic

Includes all of Oconee and Pickens as well as northern Greenville and Spartanburg Counties and winds down to pick up some conservative Columbia suburbs formerly in Wilson’s district.  This district includes Barretts home but may or may not contain the home of his successor, which could be problematic if he or she is from Anderson County. Black population drops 6%

District 4- Bob Inglis (R) Red

70% White, 22% African American, 5% Hispanic

Includes all of Anderson Couny and the cities of Greenville and Spartanburg.  By far this is the least gerrymandered district in the state.  Because it now grabs Aiken County and due to growing minority populations in North SC, the African American and Hispanic populations actually go up in this district slightly.

District 5- John Spratt (D) Yellow

75% White, 18% African American, 4% Hispanic

I drew this district with the intend of defeating John Spratt, because I doubt that South Carolina Republicans settle for a 3-4 Delegation, especially because 2 districts are VRA.  The African American vote here is nearly halved, and the district now stretches into Horry County and includes all of Myrtle Beach, a Republican stronghold.  I don’t know whether Spratt would win this district, but he may decide to retire rather than find out.

District 6- Jim Clyburn (D) Blue-Green

52% African American, 43% White, 2% Hispanic


This district takes in more of Columbia than before and stretches north into Fairfield, Chester, and Union Counties.  To stay majority African American, and to hurt Spratt, it has now grown several oogie tentacles that slither into some of the more rural African American areas, as well as a few small cities.  Don’t worry though, it remains contiguous.  Despite the additon of another majority Black district, the AA population only falls about 5%

District 7- NEW (D) Gray

54% African American, 41% White, 3% Hispanic


I’ll admit, this district is awfull, but maybe not as awful as it looks at first glance. It starts by taking in the Black neighborhoods of Charleston and North Charleston, the takes in as many black majority tracts as humanly posible without going into Columbia.  I tried to salvage some integrity for this map, so I made sure that there were no oogie tentacles like in the 6th, so give me credit for that at least.

What does everyone think? Are they legal?

Update– Based on comments and criticism, I’ve totally redrawn my map, this time giving Spratt the African American majority seat instead of creating a new one.  This district is  a thousand times less gerrymandered than the last, so I think you’ll all like it much better.

Spratt’s New District is exactly 50% Black

While Clyburn’s is about 55% Black.

To compensate for lost population, Clyburn’s district takes in more of both the Charleston and Columbia areas.


The  new 7th district follows the North Carolina border from Spartanburg to Myrtle Beach, taking up much of what was Spratt’s District.  The other districts remain almost unchanged, although the first and second become a few percentage points more white. I tried very hard to split as few counties as possible, and even though it may look bad, many counties remain compact in even the 5th and 6th Districts.

DOJ to the Black Courtesy Telephone (South Carolina)

If South Carolina does gain a district, as projected, it will be possible to make that new district a second majority African American one.

Here’s one such map that does this:


(Full Resolution)

Charleston:

Columbia:

The racial demographics of the two districts are:

District 6 (Charleston based):

Black: 341,718 (53.4%)

White: 263,579 (41.2%)

Other (inc. Hispanic): 34,797 (5.4%)

District 7 (Columbia based):

Black: 357,623 (55.9%)

White: 242,185 (37.9%)

Other: 39,613 (6.2%)

Even if the DOJ doesn’t mandate the creation of new African American district, the Republican controlled legislature may want to create one anyway, since it would shore up the 1st and 2nd districts, both of which had strong challenges last year, and take some Black voters out of the 5th, which would go from 32 to 25 percent Black, though it would remain unlikely that they will be competitive there until Spratt retires.

Redistricting 2011: Illinois & South Carolina

Here is Episode 7 in my redistricting series. Episode 7 was meant to be Arizona & New York, but with NY-20 undecided and likely to be for a time, I thought it was time to press ahead with other states I’ve drawn. So here we have it: the Land of Lincoln and the founding state of the Confederacy, wrapped together at last in one diary!

Previously covered:

Diary 1: Massachusetts and Texas

Diary 2: Michigan and Nevada

Diary 3: Iowa and Ohio

Diary 4: Georgia and New Jersey

Diary 5: Florida and Louisiana

Diary 6: Pennsylvania and Utah

Jump below to read what I was doing at 3:00 AM last night!

Illinois

First, the basics about Illinois: the Democrats control the redistricting trifecta and, I believe, still will after 2010. The state should lose a seat for a total House delegation of 18; though the current slowdown in migration may just save the state its 19th spot, most number-crunchers believe Illinois will just miss out on holding steady.

With Democrats in control of the process, I got to draw my first bona fide hypothetical Democratic gerrymander for 2011. The first key was to ensure that the lost seat was a Republican one, and since this decade, it looks like Chicago will suffer the loss rather than downstate, I chose the ever-frustrating Mark Kirk of Highland Park. His district is cracked in this map between the new seats of Melissa Bean (D-Barrington) and Jan Schakowsky (D-Evanston), both of which would decidedly favor Democratic incumbents. Kirk’s home would be in Schakowsky’s district, FWIW.

Knowing the dangers of overreaching or “getting too greedy” in gerrymandering, I don’t believe Democrats will or should go after every last GOP seat in metro Chicago, particularly with the need to protect Bean, Bill Foster (D-Geneva), and Debbie Halvorson (D-Crete). So I pushed Foster and Halvorson into Cook County and made their districts more compact/urban/suburban and less sprawling. While Obama’s popularity in his home state makes it very easy to put GOP incumbents in “Obama districts”, that kind of thinking all too easily leads to spreading Dem votes thinly and often backfires.

From this map, Democrats can expect a 12-6 majority, with an outside shot at 13-5. Which district did I soften up? Actually, Aaron Schock’s downstate…making his district more competitive was fairly easy compared to the tortuous work that would be required to dislodge Peter Roskam while protecting Foster, Halvorson, and Bean.

VoilĂ :

Photobucket

By the way, don’t pay too much attention to my boundaries in the urban Chicago districts; the granularity at this level is absurd, and I drew these boundaries crudely, since I’m using Paint and a calculator rather than any real redistricting technology.

District 1 – Bobby Rush (D-Chicago) — VRA black-majority, South Side.

District 2 – Jesse Jackson, Jr. (D-Chicago) — VRA black-majority, South Side.

District 3 – Dan Lipinski (D-Western Springs) — entirely within Cook County, working- and middle-class close-in Chicago suburbs.

District 4 – Luis Gutierrez (D-Chicago) — VRA Hispanic-majority, takes in the heavily Latino areas of Chicago, Cicero, etc.

District 5 – Vacant — the North Side seat should be rock-solid for Quigley or any other Democrat.

District 6 – Peter Roskam (R-Wheaton) — entirely within DuPage County, Obama-supporting but traditionally Republican. Believe me, as one of Tammy Duckworth’s most active volunteers in 2006, I would have loved to draw Roskam a district he can’t win, but couldn’t find a way to do so without endangering Foster and Halvorson, and in partisan gerrymanders, safety comes first.

District 7 – Danny Davis (D-Chicago) — VRA black-majority seat: downtown Chicago, Oak Park, Maywood, etc.

District 8 – Melissa Bean (D-Barrington) — dominated by its 64% portion of Lake County, but takes in 5% of Cook to help Bean a bit.

District 9 – Jan Schakowsky (D-Evanston) vs. Mark Kirk (R-Highland Park) — the remaining 36% of Lake (including Kirk’s home base) and 9% of Cook (which dominates population-wise). With Schakowsky’s North Shore base intact and stronger numerically than Kirk’s turf in southern Lake County, I’d feel good about our chances in a match-up.

District 10 – Debbie Halvorson (D-Crete) — all of Will and a tiny, heavily black South Side portion of Cook is meant to protect Halvorson by allowing her to shed all that GOP-leaning exurban country to the west.

District 11 – Jerry Costello (D-Belleville) — the most Democratic downstate district, centered on metropolitan St. Louis and other traditionally Democratic areas like Carbondale. I caused a little mischief by putting John Shimkus’ home in this district, though I think he’d do well to move to the 18th since Costello would be a solid fit here.

District 12 – Judy Biggert (R-Hinsdale) — this monster reminds me of Lamar Smith’s 1990s district in Texas, designed to grab every possible Republican voter for the sake of Democratic incumbents in the area. This comprises the southern 23% of DuPage, 6% of Kane, 62% of Kankakee, and exurban counties DeKalb, Grundy, Kendall, LaSalle, and Lee, dramatically reshaping the district to remove GOP areas that would otherwise be represented by Foster and Halvorson. In a way, having one sprawling seat like this makes more sense than the previous incarnation that had Foster and Halvorson writhing all over the place in positively serpentine fashion.

District 13 – Bill Foster (D-Geneva) — 94% of Kane (Foster’s base) and 5% of Cook (to push his district bluer) = the likelihood of holding this seat when Foster retires.

District 14 – Timothy Johnson (R-Urbana) — other than Johnson’s native Champaign County, this could be the state’s most Republican district; if not, it’s nearly as much so as Shimkus’. Why make Johnson so overwhelmingly safe? Well, I was interested in weakening Schock a bit (or a lot), and it seemed logical to pack Republicans into Johnson’s district due to pure geography. Also, if I was going to help solidify a GOP seat, why not reward Johnson’s relative sanity compared to people like Schock?

District 15 – Donald Manzullo (R-Egan) — due to growth up there, Manzullo’s district becomes more compact and probably remains Obama-supporting, though I suspect it tilts quite Republican in most years.

District 16 – Phil Hare (D-Rock Island) — I’ve always disliked the current 17th and its embarrassingly gerrymandered lines, so sought to clean it up without hurting Hare. By losing its southern “Springfield leg”, it took in some normally GOP-leaning counties in the northwest, though the Obama numbers are probably better than before due to Obama’s superb performance in even exurban and rural northern Illinois. This is now something of a north-south Mississippi River seat, but should still favor a Moline-area Democrat.

District 17 – Aaron Schock (R-Peoria) — To hurt one GOP incumbent without rendering the must-protect Chicago-area Democrats, Schock was an obvious choice: he’s young, new, and rather obnoxious. This district still leans Republican, but is a heck of a lot more moderate, anchored by the Peoria area, Springfield, and Bloomington-Normal, with a small sliver of Champaign County. This district would have voted for Obama, and Schock would be vulnerable to a strong challenge from a conservative Democrat. Without hurting Hare and Costello, that’s the best I could do.

District 18 – John Shimkus (R-Collinsville) would run here — As I said, his home would be represented by Costello, but he’d choose to run here, a very strong GOP seat with only traces of moderation (Springfield and Decatur, mostly).

Overall, I have mixed feelings about this map. I think I handled the Chicago area fairly well (and after all, I did live there for four years), not overextending Democratic strength by getting greedy about Roskam or Biggert. I’m decently happy with my downstate reconfiguration, but am curious if Hare would still be safe enough. Obviously no Democratic gerrymander would result in a much-weakened seat for Hare, so perhaps I should have preserved Springfield and Decatur for him (then again, northwest Illinois needs to go somewhere!).

Anyway, an average year would result in a 12-6 split under this map, and a good year could see 13-5 should Schock fall. What about a bad year? Do you think Hare, Foster, Bean, and Halvorson would all be fine in a difficult year? Input needed!
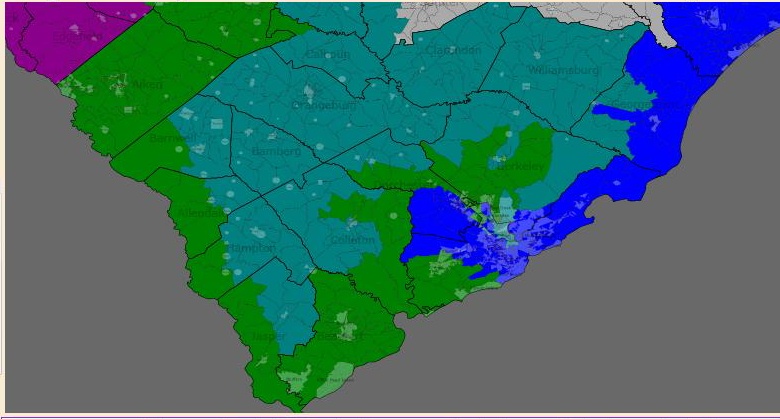
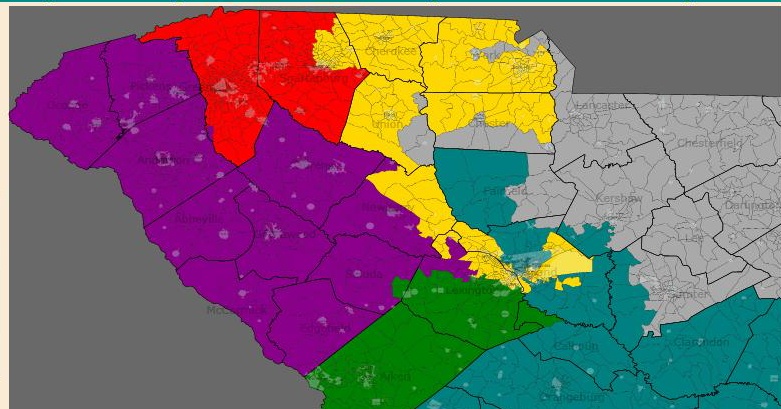
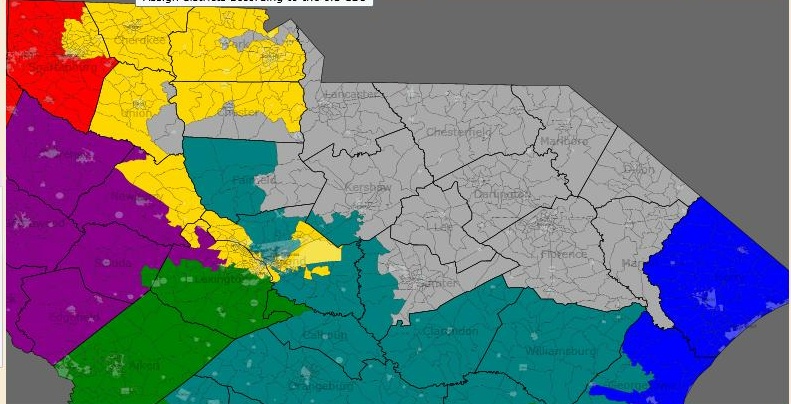
South Carolina

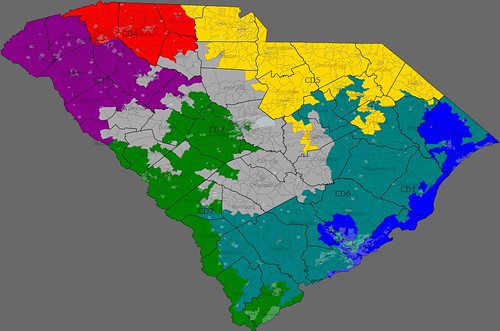
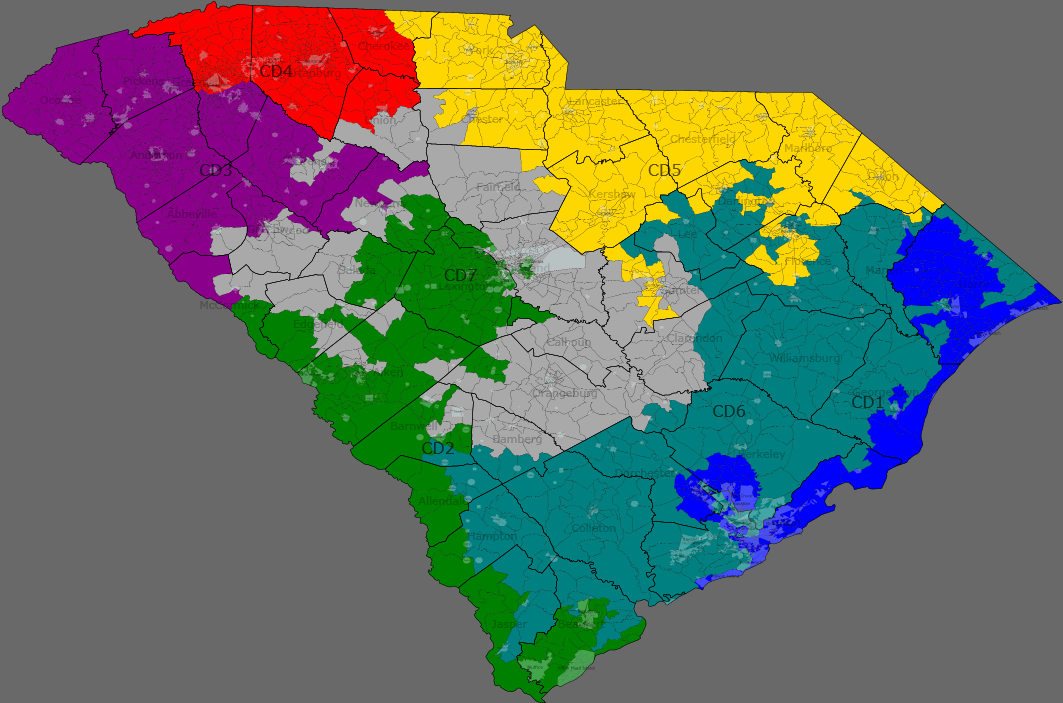
And now for something completely different: this Deep Southern state experienced the highest domestic migration rate in the nation between 2007 and 2008. Monopolized by Republicans, I sought to draw a GOP gerrymander here that would protect the four current Republican seats and add a new one, while weakening John Spratt (D-York) if at all possible.

Knowing how Republicans love to pack minority votes, I drew Majority Whip Jim Clyburn the most heavily African-American district imaginable. It looks like a crab, actually, and yes, it’s exactly the kind of racial gerrymander Republicans would draw (interesting that we saw so many Democratic maps in the South that aimed for maximizing black representation thrown out by the courts as “racial gerrymanders” in the 1990s, but recent Republican racial packing in states like Florida and Texas has gone unnoticed).

One nit: with the state’s black population around 30%, the Justice Department might want a map that creates two VRA black-majority seats (two seats out of seven = 29%). That would involve diluting Clyburn’s seat a little and trading some turf with Spratt, rendering Spratt’s district a lot safer.

But I presumed only one VRA seat, so with that in mind:

Photobucket

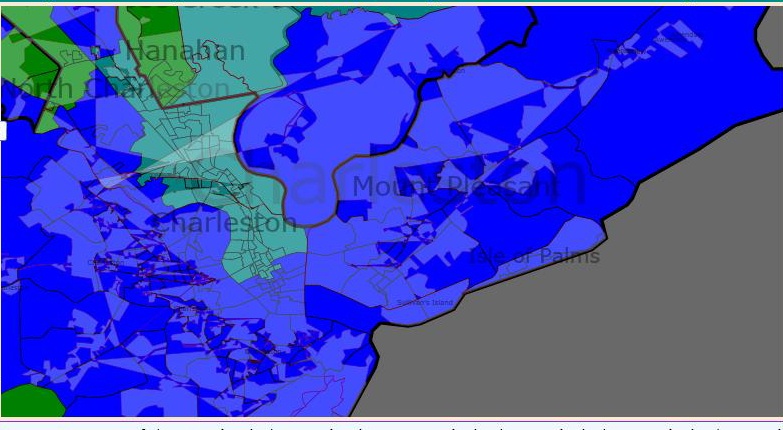
District 1 – Henry Brown (R-Hanahan) — More compact and less coastal than Brown’s current district, it loses Charleston to aid him and prevent a future close call like he faced in 2008 from Linda Ketner.

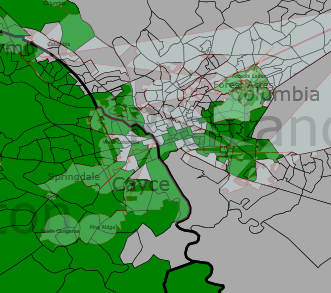
District 2 – Joe Wilson (R-Springdale) — Heavily Republican, takes the white areas around Columbia from Clyburn, acting as a sort of Alabama 4th to Clyburn’s Alabama 7th.

District 3 – Gresham Barrett (R-Westminster) — also heavily Republican, with the cleanest lines I could possibly draw.

District 4 – Bob Inglis (R-Travelers Rest) — due to growth in the Greenville/Spartanburg area, this district is getting positively small!

District 5 – John Spratt (D-York) — while carving out GOP turf for Brown, Inglis, and Barrett, I tried my best to keep Spratt’s seat potentially GOP-friendly should he retire. But if the Justice Department demands two VRA seats, this could turn out very differently, with Spratt getting a solid Dem district for the first time in recent memory.

District 6 – Jim Clyburn (D-Columbia) — dominated by Columbia, taking every possible black-majority county. Truly a lawsuit-worthy gerrymander, but Republicans seem to get away with those (look at how the courts have reacted to Corrine Brown’s FL-03 versus their decisions in the 1990s about Cynthia McKinney’s GA-11, Cleo Fields’ LA-04, and Mel Watt’s NC-12).

The new District 7 – Designed for a Charleston/Beaufort County Republican due to growth along the coast. This seat would be GOP-friendly but trending Dem long-term and might need to be reconfigured in 2021 to stave off Democratic gains.

Overall, Republicans could hope for a 6-1 majority when Spratt retires, but in the mean time would have to settle for 5-2. When Spratt does go, the coast may be blue enough for a Democrat to win either District 1 or District 7. And if the state creates a new VRA seat, Republicans will make it Spratt’s to avoid ceding more territory. I do wonder how that map would look…

EDIT: It was brought to my attention that the current 5th is as heavily Democratic as any VRA district, and is essentially wasting votes. So I adjusted the lines a bit based on someone’s suggestion to create two skinny DuPage-Cook mix districts; the 5th would be Quigley land, and the 6th would be a more Democratic seat for Roskam. Thus this map could easily produce 13-5, not counting Schock.

Someone else suggested softening up Lipinski, but since that district is already somewhat socially conservative, and doesn’t link easily with Roskam’s, I chose to leave it alone. The 5th is needlessly packed in the current map, while the 3rd is significantly less solid. Here’s the adjusted map:

Photobucket

Which one do you folks like better? In this version, Roskam’s district has about 415K from DuPage and 301K from Cook, while Quigley’s district has precisely reversed numbers.