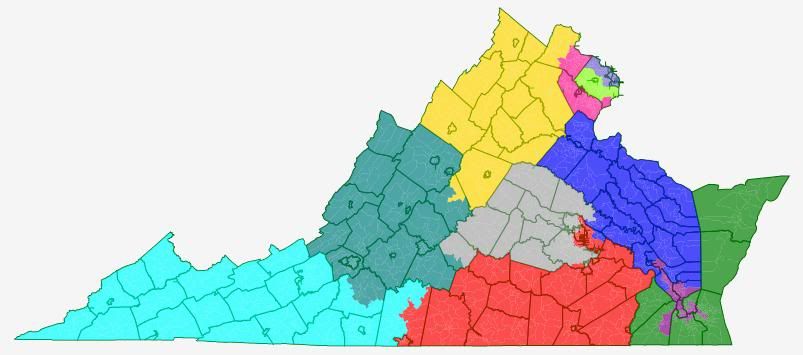
4-4 Gerrymander of Maryland

Obviously an exercise, inspired by the flood of 8-0 Democratic Marylands. Originally I had attempted to make five Republican seats in Maryland, but while it was possible to make five seats won by McCain it would have been a huge overreach and Republicans would have been unlikely to hold all five seats in even a neutral year (possibly none in a Democratic wave). Given that, the exercise became a matter of shoring up four seats as much as possible. While Maryland is quite a blue state these years the Democratic voting base is heavily concentrated so forcing it into four ultra Democratic seats was entirely possible. The remaining four Republican seats all ended up with a 44-54 Obama/McCain lean.    

CD1 (Blue): W85 B10, O44 M54 Much of Anne Arundel county, coastal Baltimore county and smallish bits of Harford and Prince George’s. PVI R+9  

CD2 (Green): W31 B63 O87 M12 Most of Baltimore city with tiny amounts of Baltimore county. PVI D+34  

CD3 (Dark Magenta): W80 B16 O44 M54 The entire Eastern Shore, all of Calvert and St. Mary’s, and parts of Charles and St George’s in south Maryland, and a piece of Harford in the north. PVI R+9  

CD4 (Red): W21 B69 O91 M9 Mostly Prince George’s, with a little of northern Charles D+38

CD5 (Gold): W47 B36 O77 M21 Northern Prince George’s with a tendril stretching to Annapolis (the Severn river does maintain contiguity) and toward (though not into) Baltimore city. D+24

CD6 (Teal): W87 B7 O44 M54 Mostly Baltimore county but spilling over into adjacent counties. PVI R+9  

CD7 (Dark Grey): W58 B15 A12 H12 O73 M25 The most Democratic parts of Montgomery county. D+17

CD8 (Slate Blue): W88 B6 O44 M54 Western Maryland and the less Democratic parts of Montgomery county. PVI R+9  

Texas: Population by CD

Texas has always been, in my mind, the most interesting state for redistricting in 2010, partly because it grew much more than any other state (it gained four seats, while no other state gained more than two), and partly because much of that growth was Hispanic. This sets up a major conflict in the redistricting process: the Republicans, who control the trifecta here, will want to draw as many of those four new seats for themselves as possible, obviously, but the Obama administration’s Dept. of Justice, via the Voting Rights Act, will compel the creation of as many majority-minority seats as possible. Given the numbers that came out today, Texas Republicans may actually feel lucky getting away with two of the four new seats… assuming that’s what they end up with, after the conclusion of the inevitable litigation process that will result.

Texas gained a whopping 4,293,741 people between 2000 and 2010, growing from 20,851,820 to 25,145,561. Of that 4+ million, only about 10% were non-Hispanic whites. The non-Hispanic white population in 2000 was 10,933,313, and in 2010 it’s 11,397,345, a difference of 464,032. Contrast that with the growth in Hispanics, who went from 6,669,616 to 9,460,921, a gain of 2,791,305. Expressed as percentages, Texas now has only a plurality, not a majority, of non-Hispanic whites. They make up 45.3% of the population in 2010, along with 11.5% non-Hispanic blacks, 3.8% non-Hispanic Asians, and 37.6% Hispanics. (In 2000, non-Hispanic whites were 52.4%, along with 11.3% black, 2.7% Asian, and 32% Hispanic. Those don’t add up to 100 because there are also categories for Native Americans, Pacific Islanders, two or more races, and “some other” race.)

With Texas about to expand to 36 seats, that means the target average for each new congressional district will be 698,488. Here’s a chart that looks at each current congressional district, giving old and new populations, the amount gained (or lost), and the “deviation,” which is what we’re calling how many people each district will need to shed (or in a few cases, gain) in order to hit its 2010 target. (In case you’re wondering, yes, the 2000 data is for the post-2004 DeLay-mander configurations of each district.) I’m also including the 2000 and 2008 presidential election results, so you can see which direction the districts are headed (very different, when you contrast the trend in rural east Texas districts with suburbs for the major cities).

District Rep. 2000 total 2010 total Total change Deviation 2000 election 2008 election
TX-01 Gohmert (R) 651,652 723,464 71,812 24,976 33/68 31/69
TX-02 Poe (R) 651,605 782,375 130,770 83,887 37/63 40/60
TX-03 Johnson, S. (R) 651,782 842,449 190,667 143,961 30/70 42/57
TX-04 Hall (R) 651,500 846,142 194,642 147,654 34/66 30/69
TX-05 Hensarling (R) 651,919 725,642 73,723 27,154 34/66 36/63
TX-06 Barton (R) 651,691 809,095 157,404 110,607 34/66 40/60
TX-07 Culberson (R) 651,682 780,611 128,929 82,123 31/69 41/58
TX-08 Brady (R) 651,755 833,770 182,015 135,282 31/69 26/74
TX-09 Green, A. (D) 651,086 733,796 82,710 35,308 69/31 77/23
TX-10 McCaul (R) 651,523 981,367 329,844 282,879 34/67 44/55
TX-11 Conaway (R) 651,590 710,682 59,092 12,194 25/75 24/76
TX-12 Granger (R) 651,770 831,100 179,330 132,612 36/64 36/63
TX-13 Thornberry (R) 651,665 672,781 21,116 (25,707) 26/74 23/77
TX-14 Paul (R) 651,837 779,704 127,867 81,216 36/64 33/66
TX-15 Hinojosa (D) 651,580 787,124 135,544 88,636 54/46 60/40
TX-16 Reyes (D) 652,363 757,427 105,064 58,939 59/41 66/34
TX-17 Flores (R) 651,509 760,042 108,533 61,554 32/68 32/67
TX-18 Jackson-Lee (D) 651,789 720,991 69,202 22,503 72/28 77/22
TX-19 Neugebauer (R) 651,610 698,137 46,527 (351) 25/75 27/72
TX-20 Gonzalez (D) 651,603 711,705 60,102 13,217 58/42 63/36
TX-21 Smith (R) 651,930 856,954 205,024 158,466 31/69 41/58
TX-22 Olson (R) 651,657 910,877 259,220 212,389 33/67 41/58
TX-23 Canseco (R) 651,149 847,651 196,502 149,163 47/54 51/48
TX-24 Marchant (R) 651,137 792,319 141,182 93,831 32/68 44/55
TX-25 Doggett (D) 651,477 814,381 162,904 115,893 47/53 59/40
TX-26 Burgess (R) 651,858 915,137 263,279 216,649 38/62 41/58
TX-27 Farenthold (R) 651,843 741,993 90,150 43,505 50/50 53/46
TX-28 Cuellar (D) 651,259 851,824 200,565 153,336 50/50 56/44
TX-29 Green, G. (D) 651,405 677,032 25,627 (21,456) 57/43 62/38
TX-30 Johnson, E. (D) 652,261 706,469 54,208 7,981 74/26 82/18
TX-31 Carter (R) 651,868 902,101 250,233 203,613 32/69 42/58
TX-32 Sessions (R) 650,555 640,419 (10,136) (58,069) 36/64 46/53

Now let’s turn to the changes in racial composition in each district. The Hispanic population increased in all of Texas’s 32 districts, with the smallest increase being 35,816 (in TX-32 in north Dallas, the only district which lost population overall – I’m not quite sure why this district lost population, other than the fact that it’s fairly dense, and boxed in by other urban districts, so it’s unable to sprawl in any direction). Eight districts gained more than 100,000 Hispanics each, with the biggest gain in the Laredo-based TX-28, gaining 166,375. The second biggest gain was 159,747 in TX-10, the wormlike district that links Houston’s western suburbs with Austin’s eastern suburbs and which gained a whole lot of everybody of all races. TX-10 is also more remarkable in that the Hispanic share of the total population nearly went up 10%, from 19% to 29% (by contrast, in TX-28, the Hispanic share barely increased, seeing as how they’re already the vast majority there).

These two existing districts point to where two of the new VRA districts are likeliest to pop up: the Rio Grande Valley, and the Houston area. (A new Hispanic-majority Houston seat would probably be located in the downtown and western parts of town, pushing TX-07 and then TX-10 further west.) The third possibility is a Dallas area Hispanic-majority seat, which might be anchored in downtown and western Dallas but wander further west to grab areas near DFW airport and maybe even in Fort Worth. The GOP, I’m sure, would prefer to try to limit the number of VRA seats to two, but it may be a difficult balancing act; in particular, it’ll be hard to avoid having a new VRA seat pop up in the Rio Grande Valley (thanks to huge growth in TX-15 and TX-23, too) if they’re going to try to reconstruct a more Republican-favorable TX-27 in order to protect unexpected new member Blake Farenthold (maybe linking Corpus Christi with Victoria instead of Brownsville, for instance).

District 2000 white White % 2010 white White % % change 2000 Hispanic Hispanic % 2010 Hispanic Hispanic % % change
TX-01 485,238 74.5 514,939 71.2 -3.2 59,688 9.2 109,499 15.1 6.0
TX-02 462,830 71.0 493,830 63.1 -7.9 82,578 12.7 176,196 22.5 9.8
TX-03 467,828 71.8 539,627 64.1 -7.7 111,121 17.0 186,890 22.2 5.1
TX-04 540,477 83.0 666,802 78.8 -4.2 50,410 7.7 110,993 13.1 5.4
TX-05 505,283 77.5 523,328 72.1 -5.4 83,113 12.7 157,037 21.6 8.9
TX-06 477,168 73.2 537,602 66.4 -6.8 103,380 15.9 185,397 22.9 7.0
TX-07 505,703 77.6 529,586 67.8 -9.8 117,392 18.0 198,587 25.4 7.4
TX-08 553,472 84.9 686,659 82.4 -2.6 58,820 9.0 128,027 15.4 6.3
TX-09 213,041 32.7 240,882 32.8 1.1 213,195 32.7 310,931 42.4 9.6
TX-10 490,353 75.3 676,833 69.0 -6.3 122,894 18.9 282,641 28.8 9.9
TX-11 523,788 80.4 577,078 81.2 0.8 192,811 29.6 257,633 36.3 6.7
TX-12 505,402 77.5 635,292 76.4 -1.1 154,032 23.6 239,268 28.8 5.2
TX-13 526,737 80.8 544,719 81.0 0.2 114,488 17.6 157,732 23.4 5.9
TX-14 491,492 75.4 588,513 75.5 0.1 162,778 25.0 226,440 29.0 4.1
TX-15 504,686 77.5 674,927 85.7 8.3 506,447 77.7 649,297 82.5 4.8
TX-16 483,295 74.1 620,074 81.9 7.8 507,249 77.8 617,465 81.5 3.8
TX-17 512,489 78.7 585,982 77.1 -1.6 100,241 15.4 157,049 20.7 5.3
TX-18 240,569 36.9 281,511 39.0 2.1 231,548 35.5 313,533 43.5 8.0
TX-19 502,156 77.1 549,589 78.7 1.7 188,932 29.0 235,973 33.8 4.8
TX-20 425,519 65.3 500,530 70.3 5.0 437,800 67.2 509,208 71.5 4.4
TX-21 531,029 81.5 680,337 79.4 -2.1 138,599 21.3 240,713 28.1 6.8
TX-22 464,216 71.2 557,629 61.2 -10.0 132,379 20.3 244,900 26.9 6.6
TX-23 467,321 71.8 672,404 79.3 7.6 423,648 65.1 562,913 66.4 1.3
TX-24 476,428 73.2 488,398 61.6 -11.5 116,586 17.9 214,851 27.1 9.2
TX-25 439,574 67.5 584,962 71.8 4.3 220,942 33.9 315,776 38.8 4.9
TX-26 474,910 72.9 652,345 71.3 -1.6 93,451 14.3 193,973 21.2 6.9
TX-27 495,162 76.0 623,615 84.0 8.1 443,919 68.1 543,306 73.2 5.1
TX-28 518,245 79.6 748,669 87.9 8.3 505,754 77.7 672,129 78.9 1.2
TX-29 357,764 54.9 398,350 58.8 3.9 430,980 66.2 514,861 76.0 9.9
TX-30 238,931 36.6 256,028 36.2 -0.4 223,200 34.2 280,508 39.7 5.5
TX-31 477,328 73.2 647,694 71.8 -1.4 106,121 16.3 195,753 21.7 5.4
TX-32 439,551 67.6 422,818 66.0 -1.5 235,626 36.2 271,442 42.4 6.2

Unfortunately, for some reason, while American Factfinder has “Hispanic or Latino by Race” available for entire states, the only data it currently has available at the CD level is the less precise “Race and Hispanic or Latino.” While that seems like a minor semantic distinction, this means there’s no way to parse out non-Hispanic white (and non-Hispanic black, etc.) for CDs. Bear in mind that “Hispanic,” for Census purposes, isn’t a race unto itself, but a box that gets checked in addition to race. So, while most people who check “Some other race” are Hispanic, not all Hispanics identify as “Some other race;” in fact, more than half of Hispanics identify as “white” (with most of the rest as “some other”) instead. This makes a big difference, in making the sample look whiter than it actually is (at least if one defines “white” in the narrow non-Hispanic sense). At the state level, in 2010, Texas appears as 70.4% white, 11.8% black, and 3.8% Asian in this format, in addition to 37.6% Hispanic. (Considering that adds up to 124%, it’s very confusing. Here, it’s also confusing because it makes districts with an already-large Hispanic majority look like they got even whiter, at the same time as they gained more Hispanics.) So, I’d focus more on the Hispanic column than on the white column in this table, and maybe I’ll revisit this when we get data on non-Hispanic whites.

More data over the flip…

Finally, here are tables for the African-American and Asian populations for each congressional district. While African-American growth is fairly slow (though seemingly faster than growth in non-Hispanic whites), the Asian growth in Texas is just as fast-paced as Hispanic growth (if not faster, in certain suburban districts).

District 2000 black Black % 2010 black Black % % change 2000 Asian Asian % 2010 Asian Asian % % change
TX-01 120,705 18.5 127,714 17.7 -0.9 3,256 0.5 6,487 0.9 0.4
TX-02 124,420 19.1 168,647 21.6 2.5 16,395 2.5 26,501 3.4 0.9
TX-03 59,496 9.1 97,376 11.6 2.4 54,246 8.3 102,783 12.2 3.9
TX-04 67,155 10.3 87,583 10.4 0.1 4,300 0.7 17,420 2.1 1.4
TX-05 80,743 12.4 100,881 13.9 1.5 10,365 1.6 14,086 1.9 0.3
TX-06 83,081 12.7 134,647 16.6 3.9 21,819 3.3 32,795 4.1 0.8
TX-07 36,603 5.6 78,428 10.0 4.4 44,670 6.9 79,224 10.1 3.3
TX-08 56,930 8.7 65,401 7.8 -0.9 5,098 0.8 11,934 1.4 0.6
TX-09 244,295 37.5 262,525 35.8 -1.7 69,533 10.7 79,853 10.9 0.2
TX-10 59,420 9.1 111,799 11.4 2.3 25,383 3.9 57,124 5.8 1.9
TX-11 26,925 4.1 28,410 4.0 -0.1 3,527 0.5 5,222 0.7 0.2
TX-12 36,133 5.5 56,115 6.8 1.2 14,963 2.3 24,464 2.9 0.6
TX-13 36,690 5.6 39,620 5.9 0.3 7,762 1.2 11,586 1.7 0.5
TX-14 63,978 9.8 71,281 9.1 -0.7 10,962 1.7 27,358 3.5 1.8
TX-15 12,020 1.8 12,169 1.5 -0.3 3,588 0.6 6,854 0.9 0.3
TX-16 20,477 3.1 24,499 3.2 0.1 6,946 1.1 8,205 1.1 0.0
TX-17 67,278 10.3 74,834 9.8 -0.5 9,434 1.4 15,071 2.0 0.5
TX-18 263,106 40.4 265,109 36.8 -3.6 21,547 3.3 24,340 3.4 0.1
TX-19 35,845 5.5 39,777 5.7 0.2 5,521 0.8 8,840 1.3 0.5
TX-20 43,738 6.7 51,563 7.2 0.5 9,964 1.5 13,859 1.9 0.4
TX-21 41,027 6.3 57,403 6.7 0.4 16,805 2.6 32,375 3.8 1.2
TX-22 61,165 9.4 129,682 14.2 4.8 50,695 7.8 115,594 12.7 4.9
TX-23 18,617 2.9 29,870 3.5 0.7 6,650 1.0 16,040 1.9 0.9
TX-24 63,194 9.7 117,088 14.8 5.1 39,716 6.1 75,088 9.4 3.3
TX-25 63,750 9.8 64,042 7.9 -1.9 12,146 1.9 18,460 2.3 0.4
TX-26 100,881 15.5 122,856 13.4 -2.1 14,125 2.2 35,991 3.9 1.7
TX-27 17,084 2.6 17,385 2.3 -0.3 5,091 0.8 8,837 1.2 0.4
TX-28 8,178 1.3 13,116 1.5 0.2 3,179 0.5 6,502 0.8 0.3
TX-29 65,414 10.0 68,630 10.1 0.1 8,492 1.3 7,826 1.2 -0.1
TX-30 271,812 41.7 293,203 41.5 -0.2 8,552 1.3 8,848 1.3 0.0
TX-31 84,561 13.0 113,076 12.5 -0.5 14,275 2.2 31,047 3.4 1.2
TX-32 50,833 7.8 54,869 8.6 0.8 26,923 4.1 33,982 5.3 1.2

2010 Virginia & Majority-Minority Districts

This is just a quick diary playing around the new version of Dave’s App and the new 2010 Census data for Virginia.

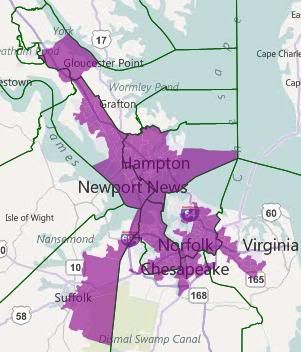
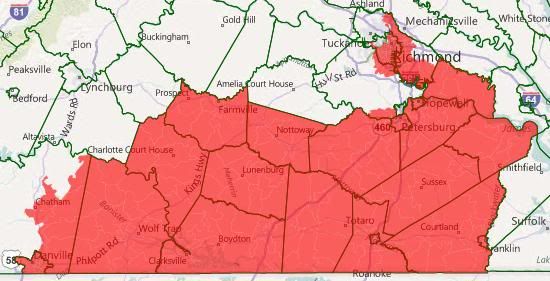
My first interest in playing with the new Census data was to figure out if two African-American-majority districts are possible, as most recent estimates have indicated. They are:

Here are the stats for those districts:

As you can see, it was just possible to make those two districts majority African American.

Here are close-ups of those two districts:

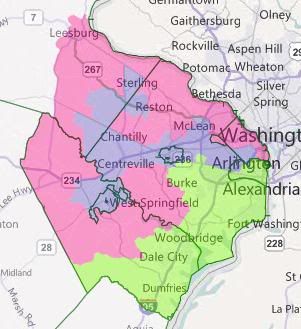
I found NoVA interesting too. In my ACS version of this map, which I don’t think I ever posted, VA-08 and VA-11 both fit entirely within the confines of Fairfax County and the closer-in localities, with a small amount of population left over. This ended up being true in the Census data as well.

What was different was VA-10. The ACS version took up the remainder of Fairfax County, along with all of Prince William, Loudoun, Manassas, and Manassas Park, and then also needed to go into Fauquier. The Census version not only doesn’t go into Fauquier, it takes in only about half of Loudoun (geographically.)

I also thought it was interesting that of the three NoVa districts, it was actually the exurban Prince William-Loudoun hybrid that was closest to being majority-minority.

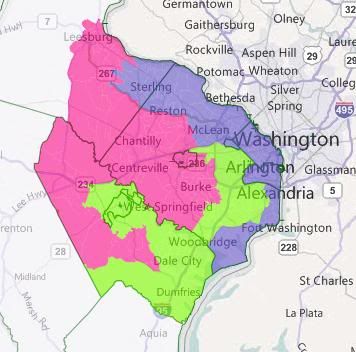
Here’s a map of a true majority-minority district in NoVa — which doesn’t go into either Arlington or Alexandria(!):

The lime green district has a VRA breakdown of

41 white/18 black/25 hispanic/12 asian/0 native/4 other

The other two districts are 60% white. Obama won all three districts, even with the Loudoun County bug.

Here’s a map with two majority-minority districts:

VA-08 (blue) is 46/10/21/18/0/3. VA-11 (green) is 48/18/19/11/0/4. Pink is 69% white, with Asians as the next largest group at 12%. Obama won all three of these districts as well — interestingly, this is actual a better configuration for him. He won the pink district by about three points more in the 2 majority-minority configuration than in the single. This is primarily because much of Arlington ended up in the pink district.

Other configurations are certainly possible. I suspect, although I haven’t been able to construct it yet, that a majority-minority district where Asians are the second largest group after whites is possible. So far, the best I’ve done puts Hispanics five points ahead of Asians.

Daves Redistricting 2.1 – 2010 Data [Updated 2]

2010 data is here! Yesterday evening I uploaded Daves Redistricting 2.1. Here’s what is new:

2010 data is available for VA, MD and NJ. More states will be available in the next 2 days.

[Update: LA, MS and IN available]

[Bugs fixed in 2.1.1:

– old election data shows up

– 0% Obama districts corrected (to make them 0% McCain, too)

– unassigning districts now ok (lesson: don’t divide by zero!)]

Election data along with the 2010 data is available for VA and MD.

The UI is improved.

Z-Drag (like Ctrl-Drag) allows you to draw a box to color. Works on both Mac and Windows.

In other news, I will potentially be partnering with a non-profit and seeking contributions to support the Dave’s Redistricting project. I will let you know when I have more news on that.

More detail below.

1) The data: When you select a state you will be asked to select a data set from the choices available.

  — I’ve downloaded all the data for available states and the vote district (VTD) shapes from the Census site. I expect to have MS, LA, AR and IN late today. I’m currently using VTDs. I will evaluate using Block Groups in states where VTDs are too big.

  — 2010 data includes voting age population (18+) which is now shown with the overall population data.

2) Election data: a group of professors, led by Steve Ansolabehere of Harvard, is gathering election data for nearly all states. In general you will see the 2008 Pres numbers + an Average over some elections in the last decade. Important:

  — To aggregate the Average across VTDs, we use the voting age population for the VTDs.

  — To aggregate the 2008 Pres, we (temporarily) do the same. Steve is working to get VTD actual Pres vote counts in the data and I will use them when available.

3) The UI: Top Panel

  — you can minimize the top panel.

  — Tools and Area Views are collapsed by default. Tools includes less used stuff like Auto Color, Reposition CD Labels and more. Also, a check box to go back to the “Old” coloring method.

  — Help button takes you to a dialog where you can navigate to “How To” sections on common tasks. The link to the Help Page is on those dialogs.

4) The UI: Right Panel

  — The data for the current CD has been moved from the bar under the top panel to the right panel. This should give you much better readability, especially with more data.

  — You’ll notice also that VTD tool tips appear in the upper right of the map, also for better readability with more data. Note: I use the less desirable fixed-width font for performance reasons.

5) UI: Coloring:

  — “New” coloring (introduced 1 months ago) is on by default. “Old” is still available. See Tools.

  — Z-Drag, like Ctrl-Drag, drags out a box and colors the box. Ctrl-Drag was introduced 1 month ago, but does not work on the Mac. Z-Drag does the same thing and works on both Mac and Windows. [Hold down the Z key, hold down mouse button and move the mouse to draw a box. When you release, everything in the box is colored. On the Mac TrackPad, moving 3 fingers is the same as pushing the pad down while moving.

6) Show:

  — City/Town boundaries: These are a prominent magenta. They are meant to help you color in or out of the boundaries, rather than for pretty viewing.

  — Vote District lines: when you hide these the app zooms out and back in. I have found no other way to get them to go away. (I’ve tried a lot of other things.)

  — County lines are a little thicker.

7) Performance:

  — Bottom line: this takes a bunch of memory no matter what.

  — The DataGrid used to show CD data on the right panel is fairly expensive, which is why I didn’t use it for VTD tool tips.

  — Setting the tool tips has always been slow. When loading a saved DRF, I use to do them twice. That’s been fixed, but loading a large state is still slow. I intend in the future to push this to the background.

  — Silverlight 4 seems to have some memory leaks. There’s much discussion on their forums. My app may force you to upgrade to 4.0.6something, but not all is perfect.

  — Because of memory issues, I recommend refreshing your browser if you are switching a lot between states. I found that, using the 2010 data, if I did VA, then NJ, and both again, I would run out of memory. (Browser would should memory usage of 1.3GB.)

8) The Help pages are not updated yet. I’ll be working on that soon.

Thanks for your feedback. As always, let me know of bugs. Happy Redistricting!

SSP Daily Digest: 2/17

  • AZ-Sen: As Dems cast about for a candidate in this newly open race, the last guy who ran for this seat is saying he won’t seek it a second time. Former state party chair (and rich guy) Jim Pederson is doing the upstanding thing by flatly declaring he’s out: “I don’t want to play a cat-and-mouse game with this U.S. Senate race.” In an age where would-be candidates drag out the “exploratory” phase with leaks of rumors of hints of tea leafs for months, Pederson’s stance is refreshing, even if it does mean a potentially strong contender won’t run. (Of lesser note, Rep. Raul Grijalva also says he’s not interested.)
  • Meanwhile, the Club for Growth says it’s already raised $100K for the only dude in the race so far, Rep. Jeff Flake, who just announced a few days ago.

  • CT-Sen: In a move that will surely disappoint Beltway hacks endlessly thirsting to write more stories about Camelot, Ted Kennedy, Jr. says he won’t seek Joe Lieberman’s open senate seat. He did note that he might consider politics in the future (he’s 50).
  • FL-Sen: Not really a surprise, but Rep. Connie Mack (R) is amping up his fundraising, hiring a veteran NRSC fundraiser who has also worked for Bill McCollum and Mel Martinez, Anne Ekern. Mack is also having a “major” event this Friday, which will supposedly feature  “cigars.” I assume it will also feature top hats and lighting said stogies with $50 bills.
  • MA-Sen: By now you’ve probably caught wind of the Daily Kos effort to draft Elizabeth Warren, the interim director of the new Consumer Financial Protection Bureau. Note also that David Kravitz of Blue Mass Group, the top progressive blog in the Bay State, recently said he also supports a Warren run.
  • VA-Sen: It seems that everyone is trying hard to get DNC chair Tim Kaine to run for the senate seat being vacated by Jim Webb, including Barack Obama himself, who apparently talked on the phone with Kaine yesterday. (But don’t these guys talk regularly, anyhow?) Webb also said he wants Kaine to replace him. Meanwhile, ex-Rep. Tom Perriello told the Washington Post he’d consider getting in, but only if Kaine – whom Perriello said he wants to see run – doesn’t make the race.
  • LA-Gov: Opulence – I has it. So says Bobby Jindal, who is sitting on a $9.2 million stack of doubloons, after hauling in $3.4 million in 2010. Seeing this, Dem state Sen. President Joel Chaisson is too smart to kiss the mini-giraffe. Though he pulled in a decent-ish $180K and checked the “statewide” box on his campaign finance disclosures, Chaisson says he’s just hedging his bets in case Jindal decides to run for president instead.
  • OH-Gov: The douche is strong in this one: John Kasich was easily one of the schmuckiest candidates of the 2010 cycle, and one of the most obnoxious Republicans alive – which is saying a hell of a lot. Of course, he hasn’t changed one bit since his inauguration. Just check out this video of him calling a police officer who had the temerity to ticket him “an idiot” three times in sixty seconds. Listen in particular to his tone of voice at 1:07. What an asshole.
  • AZ-06: Here’s another Republican name in the mix to succeed the running-for-senate Jeff Flake: First-term Mesa Mayor Scott Smith.
  • CA-36: The endorsements just keep rolling in for Janice Hahn, who has now secured the backing of local Dem Reps. Karen Bass, Lucille Roybal-Allard, and Xavier Becerra, the last of whom is a big cheese in House leadership. So far I haven’t seen word of any big names coming out for Debra Bowen (but correct me if I’m wrong). Relatedly, for a good look at which sides the various power players might line up on, check out this piece by LA Weekly’s Gene Maddaus.
  • By the way, Jane Harman has now said she’ll delay her resignation until Feb. 28th at the request of Gov. Jerry Brown. That gives Brown a better chance to consolidate the CA-36 race with a budget-related special election that’s likely to be held in June – but even that date is still up in the air. In any event, if round one goes forward in June, then round two (if needed) would take place in August.

  • MI-05: The exact words of 81-year-old Rep. Dale Kildee (D), when asked if he’s quitting: “They’ll have to carry me out of here.” Despite having just $12K in the bank, the veteran lawmaker says he’s definitely going for another term, and that you can ignore his warchest: “I usually don’t start raising money until March, so that doesn’t mean anything.”
  • NY-26: Erie County Republican Chair Nick Langworthy says that he and his fellow party leaders for the seven counties which comprise the 26th CD are interviewing candidates this weekend to fill ex-Rep. Chris Lee’s seat. Since this is the fourth special election in New York in less than two years, you probably recall that nominees are selected by local party chairs, rather than in a primary. Anyhow, the GOP shortlist:
  • Amherst Town Supervisor Barry Weinstein; Jack Davis, a Democrat turned Republican who unsuccessfully challenged Rep. Tom Reynolds for the same seat; Chris Jacobs, member of the Buffalo school board; the front-runner, Assemblywoman Jane Corwin; Dan Humiston, a businessman and owner of Tanning Bed; and Erie County lawmaker Ed Rath.

    You better believe emphasis added! Oh please oh please pick Jack Davis! Anyhow, on the Dem side, it definitely looks like one speculative candidate is out: departing White House deputy press sec’y Bill Burton is starting a consulting firm, according to Politico, which you’d think would rule out a run.

  • SD-AL: South Dakota’s single at-large CD is one seat where we definitely won’t have to worry about redistricting, so it makes sense that Steve Israel’s reached out ex-Rep. Stephanie Herseth Sandlin about a potential rematch against GOPer Kristi Noem. Herseth Sandlin says they’ve “traded some emails” and that she’s considering the idea – but obviously she hasn’t taken the plunge yet, since that would probably have been front-page news here.
  • At the same press briefing, Israel also made a good point: Dems are holding off on announcing House recruits not just because they don’t necessarily know where the lines will be drawn, but because they don’t want to give Republicans a chance to redistrict strong candidates into oblivion. RCP does report, though, that “Democratic congressmen on the recruitment team have visited 15 states on recruitment trips and made recruitment calls to candidates in another 15 states.”

  • State Leges: We had a few special elections the other night. In the Los Angeles area, GOPer Sharron Runner took over her husband’s seat in SD-17 in a landslide. In SD-28, Dem Ted Lieu avoided a runoff as well. Both were holds. Over in Minnesota’s Iron Range, 25-year-old Carly Melin also held a seat for Team Blue. But in a special election primary in South Carolina’s HD-64, Alvin Greene (yes, that Alvin Greene) pull just 37 votes out of 3,960 cast. Wonder if he remembered to vote for himself.
  • And finally, talk about overtime: The last uncalled race of 2010 was decided in court yesterday, with an appeals panel declaring Republican Thomas Kirwan the victor in New York’s 100th Assembly District. Interestingly, Kirwan is framing this as a boon to Gov. Andrew Cuomo, pointing out that Republicans now have enough votes to prevent Speaker Shelly Silver from over-riding any Cuomo vetoes.

  • WATN?: Ah, Tom Emmer, man of principle. Two years ago, the former GOP gubernatorial candidate was vigorously fighting Minnesota’s ban on expensive satellite radiation clinics, demanding that “market forces” be allowed to work. Now he’s a registered lobbyist with only one client… and that client has instructed him to advocated in favor of extending the very same ban. Market forces at work, indeed.
  • In better news, it’s always nice to see one of our guys land on her feet. Dem ex-Rep. Betsy Markey (CO-04) has landed a job with the Dept. of Homeland Security. She’ll be the “assistant secretary for intergovernmental affairs.”

    Trivia Time, Incumbent Losers Edition

    I liked this puzzler from user markhanna (slightly edited):

    Can you cite an example from the past 20 years where a non-scandal plagued incumbent lost to a challenger in a Presidential year when the incumbent’s state voted for the same party he (or she) was from?

    While I think Mark was limiting his inquiry to senators, let’s add governors to the mix as well to make it more interesting. A few folks have already taken a stab in the prior comment threads, but what have you got?

    Analyzing the Illinois Senate Election

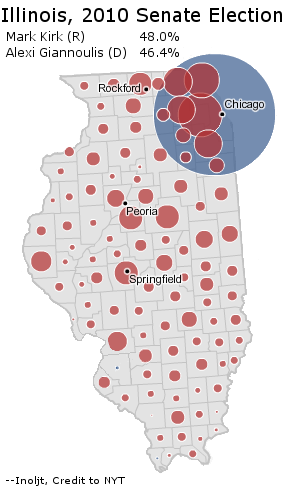
    This is a part of a series of posts analyzing the 2010 midterm elections. This post will focus on the Illinois Senate election, in which Republican candidate Mark Kirk pulled out a close Republican victory in a strongly Democratic state.

    Illinois’s Senatorial Election

    Photobucket

    More below.

    Senator Mark Kirk’s victory follows the contours of a previous post, titled Previewing Senate Elections: Illinois. This post argued:

    So what does Mr. Kirk have to do? Say that  he gets 35% of the vote in Cook County – propelled by inner-ring  suburban strength and minority apathy – and wins a landslide everywhere  else in the state (for instance, a 3:2 margin). This gives him 50.3% of  the vote in the 2008 Illinois electorate. If white Republicans downstate  turn out, and minorities in Chicago do not, Mr. Kirk may get bumped up  to a 2-3% victory.

    As it turns out, this is almost exactly what actually happened in the election.

    The previous analysis divided Illinois into three sections: Chicago, the suburbs of Chicago, and downstate Illinois. Let’s take a look at what Mr. Kirk did in each part of Illinois.

    Chicago

    Illinois is generally a Democratic stronghold. Cook County, home to the  city of Chicago, composes more than 40% of the state’s population, and  Democrats always win by a landslide in the county. Republicans have to  stretch themselves to the limit everywhere else in the state – winning  even the areas that normally vote Democratic – to get close.

    But Republicans also must dampen Democratic margins in Cook County. This happens if Republicans can do well in the parts of Cook County outside Chicago, which are whiter and more conservative. In the city of Chicago itself, most voters are so Democratic that they will prefer not voting to casting the ballot for a Republican. There, low turn-out is more important for Republicans than actually winning over voters.

    In 2010, Democratic candidate Alexi Giannoulias won 64.3% of the vote in Cook County.

    At first glance, this sounds quite good. Winning 64.3% of the vote is nothing to sniff at. No president has ever won that much of the popular vote in history.

    But Senator John Kerry won 70.2% of the vote in Cook County. And President Barack Obama took 76.2% of the vote. In modern Illinois politics, a Democratic candidate who takes only 64.3% of the vote in Cook County is in deep trouble.

    Chicago’s Suburbs

    “Previewing Senate Elections, Illinois” stated that:

    The true test of Mark Kirk’s candidacy will come in the Chicago suburbs…

    He will not just have to win the suburbs, but  turn the clock back two decades – back to the glory years in which  Republicans won around 70% of the vote in DuPage County. (Mr. Kirk will  probably not have to do that well, given rising Republican strength  downstate.)

    Is this doable? Given that Republicans seem  to be winning suburbs everywhere this year, it is certainly possible.  Mr. Kirk, moreover, has spent a decade representing a Chicago suburb  congressional district; this is why Republicans have nominated him.

    As it turned out, Mr. Kirk passed the test with flying colors. His moderate image and suburban origin led to double-digit victories in every one of the collar counties surrounding Cook County.

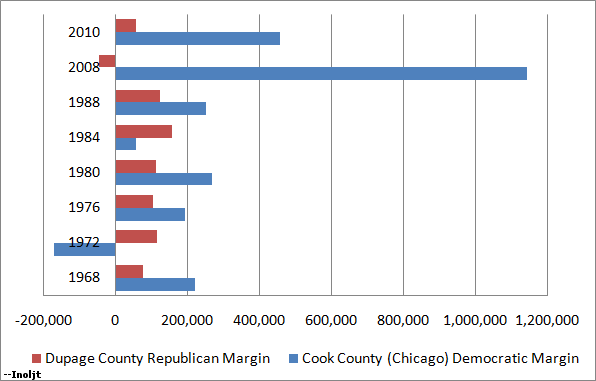
    In the past, Republicans have won Illinois through massive support in the Chicago’s suburbs to offset the Democratic advantage in Chicago itself. Mr. Kirk was able to somewhat replicate this model in 2010:

    Photobucket

    This strength did not extend to all Republicans. Republican candidate Bill Brady, for instance, still won the Chicago suburbs. But his margins were just the slightest bit off – a high single-digit rather than double-digit victory here; a 15-point rather than 20-point margin there – and ultimately this led to Mr. Brady’s defeat.

    Downstate Illinois

    Imagine that the year is 1990, and Republican Mark Kirk pulls the exact same numbers in the Chicago metropolis.

    Most analysts in that year would say that Mr. Kirk is on his way to a sure loss – after all, Democrats are quite competitive in downstate Illinois, and Mr. Kirk just hasn’t squeezed enough juice from the collar counties.

    Today, however, downstate Illinois has trended firmly Republican. Without this trend Mr. Kirk would not have won.

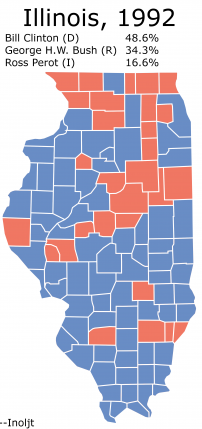
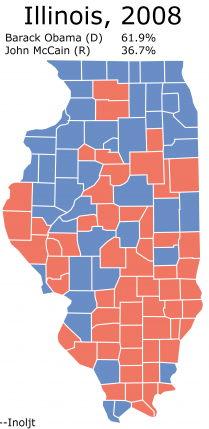
    Here is an illustration of Illinois in the 1992 presidential election:

    Photobucket

    President Bill Clinton is doing quite well, winning almost every single county downstate – many by double-digits. Compare this to President Barack Obama’s performance:

    Photobucket

    Mr. Obama is actually doing much better in Illinois than Mr. Clinton, and yet he loses a number of the downstate counties Mr. Clinton won.

    This illustrates the shift in downstate Illinois to the Republican side, and in 2010 Mr. Kirk took full advantage of that trend to win re-election.

    Conclusions

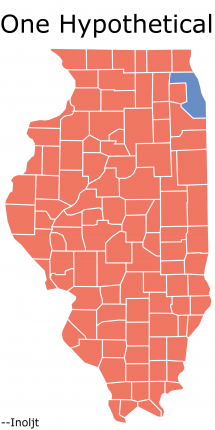
    The post “Previewing Senate Elections: Illinois” concluded by mapping, somewhat light-heartedly, a hypothetical Republican victory:

    Photobucket

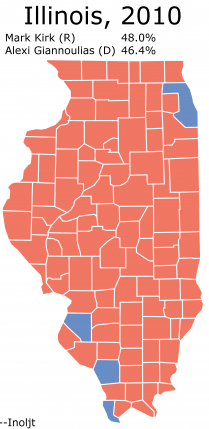
    Mr. Kirk’s victory ended up looking extremely similar:

    Photobucket

    All in all, it is always exciting to see a Republican victory in a Democratic  stronghold, or a Democratic victory in a Republican stronghold. Mr.  Kirk’s victory is the first time a Republican has won Illinois in quite a  while. It constitutes one of the Republican Party’s greatest triumphs  in the 2010 midterm elections.

    –Inoljt

    Texas Split

    For those who don’t know “a clause in the document annexing Texas to the United States allowed for Texas to be divided into five different states.”

    For more info on that topic, you can visit: http://www.snopes.com/history/…

    Long story short, it’s kind of unnecessary since Article IV, Sec. 3 of the U.S. Constitution already allows for states to be split apart.

    Since Texas can’t succeed (sorry Gov. Perry) I thought why not for fun split it into five states.

    Texas being so big it’s hard to classify the state. East Texas in general is more like the old South. West Texas is more like the plains states. South Texas is more like a border state in the Southwest. In addition:

    …El Paso, in the western corner of the state, is closer to San Diego, California than to Beaumont, near the Louisiana state line; Beaumont, in turn, is closer to Jacksonville, Florida than it is to El Paso. Texarkana, in the northeastern corner of the state, is about the same distance from Chicago, Illinois as it is to El Paso, and Dalhart, in the northwestern corner of the state, is closer to the state capitals of Kansas, Colorado, New Mexico, Oklahoma and Wyoming than it is to Austin, its own state capital.

    http://en.wikipedia.org/wiki/G…

    Here goes…

    After racking my brain to come up with some clever names for these 5 new states I finally came up with North Texas, South Texas, East Texas, West Texas, Central Texas. I also tried to estimate how the 36 congressional districts might get split between the 5 new states.
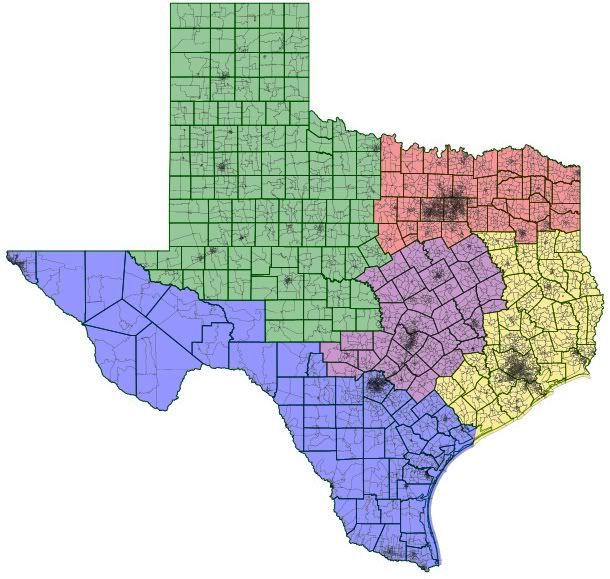
    Starting with the smallest and working our way up.

    West Texas

    Green

    Pop. 1.8 million

    66% White/26% Hispanic/6% Black/2% Asian

    75% McCain/25% Obama

    Major cities: Midland, Odessa, Abilene, Amarillo, Lubbock, San Angelo, and Wichita Falls.

    Now Gov. Perry can go back to West Texas and be governor.

    Think of this as the Texas of the movies, i.e. Giant.

    In terms of population it’s in between West Virginia and New Mexico, which would give it 3 congressional districts. No matter what, this would be a state that Republicans would dominate.

    Central Texas

    Purple

    Pop. 3.3 million

    65% White/21% Hispanic/10% Black/4% Asian

    54% McCain/46% Obama

    Major cities: Austin, Round Rock, Killeen, Temple, Fort Hood, Waco, Bryan, College Station

    Although it has a Republican lean, I could easily see this state having a Governor Chet Edwards. A moderate-conservative Democrat could win statewide here.

    In terms of population, it would be between Iowa and Connecticut with probably 4 congressional districts with maybe a 3-1 Republican majority or even at 2-2.

    South Texas

    Blue

    Pop. 5 million

    68% Hispanic/26% White/4% Black/2% Aisan

    56% Obama/44% McCain

    Major cities: San Antonio, El Paso, Laredo, Corpus Christi, Brownsville, McAllen

    A state with a solid Hispanic majority, it’s a state that Democrats would definitely be the governing majority.

    In terms of population, it would be just ahead of Colorado, so it would likely have 7 congressional districts, possibly all Democrats or a 6-1 Democratic majority.

    East Texas

    Yellow

    Pop. 7.1 million

    53% White/25% Hispanic/17% Black/5% Asian

    56% McCain/44% Obama

    Houston would be the dominate city in this state, followed by the smaller ones like Beaumont and Galveston

    This state would definitely a Republican majority, but the right Democrat could probably win it.  If the minority population continues to increase, so could the Democratic influence. The right Democrat could probably have a chance here.

    In terms of population, it would be in between Washington and Virginia so probably 10 congressional districts with a 6-4 Republican split or 7-3 Republican tilt.

    North Texas

    Pink

    Pop. 7.7 million

    64% White/18% Hispanic/13% Black/5% Asian

    58% McCain/42% Obama

    Major cities would of course be DFW, followed by the bedroom communities around them plus Tyler.

    An even stronger Republican tilt, but again like East Texas, with increasing minority strength, it should be contested by Democrats.

    In terms of population, again like East Texas, in between Washington and Virginia, so again, 10 congressional districts with a 6-4 or 7-3 Republican tilt.

    For the two left over congressional districts, I’d lean to towards giving one to Central Texas and one to South Texas.  Both lean closer than the others to getting the extra seats.

    In terms of the Electoral College, Democrats would come out ahead. The new division means the Senate and the Electoral College have to grow.

    West Texas: 5 EV

    Central Texas: 7 EV

    South Texas: 10 EV

    East Texas: 12 EV

    North Texas: 12 EV

    Republicans would conceivably win 36 EV, while Democrats would win 10 EV. The new reapportionment mean Texas gets 38 EV votes likely to go Republican.

    8-0 Maryland, Re-revisited

    This is the third of my diaries on the state of Maryland. What I have found is that there are many, many ways to draw the state of Maryland with eight Democratic seats. There are a couple things that I think any map of Maryland must do, however, in order to have a practical chance of passing:

    *Keep the Eastern Shore intact in one district, to avoid upsetting the Shore legislators

    *Give all Democratic incumbents a district that they would be okay with. None should have to move to represent a new district.

    *Make sure that the district drawn for Frank Kratovil is one where he can win the primary. The last thing we want is to put in too much of Prince George County or Baltimore so that a liberal from those areas who cannot win the general makes it out of the primary.

    *And of course, keep all districts Democratic, except for the district where Kratovil runs which should be around PVI EVEN so that he wins it.

    Here are some possibilities I have come up with to accomplish those goals.

    Option 1


    The 8th and 6th show the familiar pattern; 8th taking the panhandle, 6th stretching into Montgomery. The 8th is 61/37 Obama and the 6th is 59/39 Obama. The 4th stretches up all the way to Carroll county now to pack in Republicans. This is terribly ugly, but the district is still 31%W/53%B/11%H and 76/23 Obama. The Carroll and western Howard county parts of the district are very white and Republican, but they do not have enough population to really make Edwards uncomfortable. Steny Hoyer’s 5th district located in eastern PG county, Anne Arundel co, and South Maryland is 60/39 Obama. The 7th district takes in some Republican areas in Anne Arundel county, making it 51%B/42%W and 68/31 Obama. The 3rd district stretches from the Baltimore county suburbs where Sarbanes lives through Howard County down to some of the most white areas of Northern PG county that were in the old 5th. It is even more Democratic than before, 62/36 Obama. The population base of this district is now in Howard county. This should be fine for Sarbanes as most of these areas are used to being represented by Baltimore representatives, but it does show that it would probably be a good idea for Sarbanes to move to Howard county in the long run, especially if he sees a statewide run in the future. This is even more true with the rapid growth in Howard’s population, as indicated by the last census. The 2nd district balances out some conservative areas in Baltimore and Harford counties with some white liberal areas in Baltimore city. It is 58/39 Obama, which represents a shift of <1% from before. Given that Ruppersberger won with 64% in 2010, he should be fine here, especially given that this district contains a lot of conservative Democrats who vote Republican nationally but Democratic locally so it is more Democratic than the Obama numbers suggest. The 1st district, drawn for Frank Kratovil, takes in the Democratic areas of Harford county and some majority-black, heavily Democratic areas in Baltimore County. It is 52/46 Obama, which I believe Kratovil should definitely win.

    Option 2


    This map makes extensive [ab]use of trans-Chesapeake water contiguity, giving the 1st some Democratic precincts up and down the Chesapeake, including drawing it straight into the city of Baltimore with no land connection. In this plan, the 1st is 52/46 Obama. The one potential advantage to this is that because the Democratic primary vote is split up between different areas instead of being concentrated in a single area, no liberal Democrat with a base in one area could upset Kratovil in the Democratic primary. The 2nd is 58/40 Obama, which again is a one point shift to the GOP from the current district but not enough to affect Ruppersberger given the landslide margins he has won by (and probably not enough to make it much more competitive in an open-seat election, either). The 3rd has the same partisanship it currently does, 60/39 Obama. It is much more of a Baltimore-area district than my first map, with only a tiny part of Montgomery and none of PG county in the district. The 7th is 51%B/43%W and 65/34 Obama, which is incredibly Republican for a majority-black district in Maryland. Steny Hoyer should be happy with this map, as it makes his district 69/30 Obama. Donna Edwards gets some Republican areas of Anne Arundel packed into her district, but it is still 72/26 Obama and 33W/50B/12H. The 6th and 8th are both 60/38 Obama.

    Option 3


    This is very similar to the second map, but it eliminates some of the ugliest uses of water contiguity in South Maryland by adding one some Democratic precincts in Anne Arundel and Baltimore city to the 1st. The 1st is now 53/45 Obama and the 7th is now 64/34 Obama, but all the other districts are the same. This is definitely my favorite of the three.

    I’m interested to hear any potential problems that you think these maps have. I still strongly believe that it is possible to draw an 8-0 map of Maryland that all incumbents are okay with, even if it requires some very creative drawing like this.

    IL and OK: Population by CD

    The four states this week for the Census 2010 data dump are Illinois, Oklahoma, South Dakota, and Texas. South Dakota has only one congressional district and Texas I’m reserving for its own special in-depth post which will look at changes in racial composition in each district over the decade (and Texas isn’t out yet today, so it’s a moot point), so here are just Illinois and Oklahoma. The Illinois target (based on the drop to 18 seats) is 712,813. (Check out the depopulation on Chicago’s South Side in IL-01 and IL-02. Bobby Rush and Jesse Jackson Jr.’s districts already include small amounts of suburbs, but they’re going to need to take on significantly more.)


    District Population Deviation
    IL-01 587,596 (125,217)
    IL-02 602,758 (110,055)
    IL-03 663,381 (49,432)
    IL-04 601,156 (111,657)
    IL-05 648,610 (64,203)
    IL-06 657,131 (55,682)
    IL-07 638,105 (74,708)
    IL-08 738,840 26,027
    IL-09 628,859 (83,954)
    IL-10 650,425 (62,388)
    IL-11 759,445 46,632
    IL-12 666,459 (46,354)
    IL-13 773,095 60,282
    IL-14 840,956 128,143
    IL-15 681,580 (31,233)
    IL-16 718,791 5,978
    IL-17 634,792 (78,021)
    IL-18 665,723 (47,090)
    IL-19 672,930 (39,883)
    Total: 12,830,632

    In case you were wondering about population growth in the few Illinois districts where the state’s growth was concentrated, much of that growth is Hispanic. For instance, IL-08 went from 11% Hispanic in 2000 to 17% Hispanic in 2010. IL-11 went from 7% to 11% Hispanic. IL-13 went from 5% to 11% Hispanic, while IL-14 went from 18% to 25% Hispanic. (Perhaps not coincidentally, we lost seats in three of these districts, as turnout in 2010 was much whiter and older than in 2008.)

    Oklahoma (which stays at 5, and where the growth has been remarkably consistent across CD boundaries) has a target of 750,270.


    District Population Deviation
    OK-01 754,310 4,040
    OK-02 729,887 (20,383)
    OK-03 732,394 (17,876)
    OK-04 785,424 35,154
    OK-05 749,336 (934)
    Total: 3,751,351