NY-Gov: Rick’s Revenge

Memo to U.S. politicians: 2010 is not evidently not the best year to be a party-switcher.

Yesterday, Suffolk County Executive Steve Levy, the Democrat-turned-Republican, who switched parties in the hopes of taking on Democrat Andrew Cuomo in the upcoming New York Guberntorial race, tanked at the state’s GOP convention. Levy’s support was so thin, he failed to secure a spot on the party’s primary ballot, ensuring fmr. Rep. Rick Lazio will be the official GOP nominee to challenge Cuomo.

Yes, THAT Rick Lazio.

The fmr. Long Island Congressman, who scored fifteen minutes of national fame a decade ago in the 2000 U.S. Senate race against Hillary Rodham Clinton, has returned for another statewide beating. Lazio became the subject of political notoriety for his debate performance against Clinton, in which he abandoned his debate podium and demanded, face-to-face, that the fmr. First Lady sign a pledge, aiming to ban soft money in political campaigns. Meant to strike a chord with Independent voters, who’d been weary of Clinton’s political ambitions, the move instead solidified Clinton’s support among female voters, who saw Lazio’s move as positively cringe-worthy.

A toss-up race quickly became Clinton’s to lose, and she did claim a strong, double-digit victory, sending Lazio forever into the dark, murky shadows of failed New York politicos. Or, so we thought.

Lazio’s bid against the sitting Attorney General is, to put it mildly, the mother of all long-shots. After all, Cuomo’s actually quite popular among even registered Republicans, and conservatives are raving over his policy positions, not too unlike those of Republican New Jersey Gov. Chris Christie’s. Plus, one has to consider why Steve Levy gave this race a shot in the first place. Lazio, while respected among the state’s conservative circles, is generally looked upon as a washed-up has-been, not to mention a personality who’s hardly of the most telegenic or exciting kind. Levy, despite his failings, at least had a sort of hammy, humorous demeanor which may have paid off come the face-to-face debates with Cuomo.

Alas, the GOP has sided with Lazio, and I must say, this race looks like a complete blow-out to me. How I currently see it playing out…

Democrat – 47%

Independent – 28%

Republican – 25%

Cuomo – 97%/70%/35% = 75%

Lazio – 3%/30%/65% = 25%

Such a race would even best the stellar showing of Elliot Spitzer in his 2006 bid against John Faso, which was a 69%-29% victory. Now, let’s pretend, for a moment, that Lazio actually runs a solid campaign, while Cuomo’s is surprisingly underwhelming. (For the record, I highly doubt this will be the case.) Presuming such, I suspect a best-case-scenario for Lazio looks something like…

Democrat – 44%

Republican – 30%

Independent – 26%

Cuomo – 93%/20%/65% = 64%

Lazio – 7%/80%/35% = 36%

This margin roughly mirrors that of the 2008 Presidential race. That is, the Republican wins a decent majority of GOP-ers and self-described “conservatives,” but “moderates” still flock to the Democrat, and the Dem base is still basically shored-up. No matter what, I can’t imagine Cuomo not winning about two-to-one over Lazio, especially given the Democrat’s aggressive willingness to work across-the-aisle. Lazio, on the flip side, will probably run a very anti-Democrat campaign, and try to win over the state on a platform of conservativism. Of course, one cannot win statewide in New York by doing this.

http://polibeast.blogspot.com/…

GERRYMANDERING (movie) – World Premiere Tribeca FF

Greetings all –

I’m the writer/director of a new feature-length documentary about redistricting, a subject which I know is near and dear to many hearts here.  It’s called, aptly, GERRYMANDERING.  I’ve been working it now for about five years and the film will have its world premiere two weeks from today in the Discovery section of New York’s Tribeca Film Festival.

In the course of making the film, I got in touch with DavidNYC who provided terrific advice here and there.  When I let him know about the premiere he suggested I diary about it, so here goes…

GERRYMANDERING World Premiere!

Tribeca Film Festival 2010

Tuesday, April 27, 6:00 pm, Village East Cinema (181 Second Avenue at 12th Street)

Tickets are available now for Amex cardholders: http://www.tribecafilm.com/fes…

General tickets go on sale 4/19.  

If you can’t make the premiere, we’ll screen three more times:

Wednesday, April 28, 5:30 pm, Village East

Friday, April 30, 7:00 pm, Clearview Chelsea  (260 West 23rd Street (between 7th and 8th Avenues)

Saturday, May 1, 10:00 pm, Clearview Chelsea

Here’s the Tribeca FF description:

What is “gerrymandering”? You don’t have to wait for your oversized 2010 census envelope to figure out what exactly it means. Named for the Massachusetts governor who conveniently redrew a few erratic lines in 1812, gerrymandering is the redistricting of electoral boundaries to effect voting outcome in favor of a particular candidate, political party, et cetera. And why should you care? As the governor of California will tell you, the reestablishment of district lines takes away the voice of individual communities, reduces voter turnout and lessens competition among candidates. Whether it’s a community, race, or party issue, an issue it surely is.

Director Jeff Reichert gathers an impressive bevy of experts to smartly present a well-rounded exposé. From California’s struggle to pass Prop 11 to The Daily Show’s mockery of a gaggle of border-jumping Texas politicians, this accessible and informative documentary encourages us to put on our bifocals and more closely inspect the warp and woof of America’s democratic system.

–Ashley Havey

Residents of California, Florida, Texas, Iowa, DC, New York, Massachusetts, Louisiana or Oklahoma will recognize a lot of our shooting locations.  (Hopefully we’ll be able to get the film to the rest of the country soon).

For more info (and a quick, somewhat old teaser trailer) check out our website: www.gerrymanderingmovie.com

And if you have specific questions about the film, I can try to answer them in the comments…

By what margin will Bob Shamansky win?

View Results

Loading ... Loading ...

The Seven States of New York (Maximizing Democrats)

Previously, I did a hypothetical exercise in which I turned California into a Democratic gerrymander of five states (four of them were basically guaranteed to be Democratic under nearly all circumstances and one Democratic leaning, but not completely safe, state. The state that I really wanted to do though was New York, especially New York City (in fact, my original idea was to simply make states out of the city and the rest of New York could just be its own state, but I decided that with some creativity, it's possible to play around with the rest of the state and still give the Democrats an edge over the Republicans. Some accomodations are necessary in order to create some of these states, and that'll be apparant when they're viewed, but rather than try to explain here, I'll just let the maps do the talking:


Ok, with the maps out of the way, here come the explanations:


State 1 (New Island) (Blue)

Population: 4,191,074
Demographics: White 56%, Black 16%, Hispanic 23%, Asian 3%
Partisanship: Obama 62%, McCain 38%
Areas: Bronx, Nassau, Suffolk

Notes: Originally, my plan was to combine the Bronx with Staten Island, which would make for some poetic justice for the Bastard Child of New York City (my grandpa was born in Staten Island, so I'm allowed have a little fun at SI's expense :P). Unfortunately, a friend of mine reminded me that the Bronx has both serious corruption issues, and that the voters there are less progressive than their substantial Democratic lean would suggest (see Pedro Espada and Ruben Diaz for more on the problems with the Bronx). His suggest was that I combine the Bronx with Manhattan or with Weschester County, but I ultimately decided that would be a huge waste of Democratic votes, so I made my choice to combine the Bronx with the Long Island counties of Nassau and Suffolk. This change turns the swingy Long Island into a reliably Democratic state without giving the Bronx too much statewide influence.


State 2 (New New York) (Green)

Population: 2,151,335
Demographics: White 52%, Black 14%, Hispanic 24%, Asian 8%
Partisanship: Obama 78% McCain 21%
Areas: Staten Island, Manhattan

Notes:  Alright, as I said earlier, my original plan was to combine Staten Island with the Bronx, but it didn't work out, so I had to decide what to do with it, and the solution was to throw it in with Manhattan. Staten Island's population base is largely ethnic Italians, which also makes it relatively conservative and Republican, so naturally the best thing to do with them is to throw them in with among the most (if not the most) liberal counties in the country. This isn't horribly bad though, as the two boroughs combined are only a little bit little bit less populous than neighboring Queens. By the way, yes, the name is a shout-out to Futurama.


State 3 (New Brooklyn) (Purple)

Population: 2,589,378
Demographics: White 35%, Black 34%, Hispanic 20%, Asian 8%
Partisanship: Obama 80%, McCain 20%
Areas: Brooklyn

Notes: All I did was make Kings County into its own state. Its wikipedia page should suffice to explain my father's new birth state.


State 4 (New Queens) (Red)

Population: 2,319,060
Demographics: White 33%, Black 19%, Hispanic 25%, Asian 18%
Partisanship: Obama 75%, McCain 24%
Areas: Queens

Notes: This state is the entirety of Queens and nothing more, so I'll just give the wikipedia page for more information


State 5 (New Amsterdam) (Yellow)

Population: 1,828,601
Demographics: White 70%, Black 11%, Hispanic 13%, Asian 4%
Partisanship: Obama 58%, McCain 41%
Areas: Westchester

Notes: This is the first state that is completely outside of the borders of New York City, and the first one that did not go at least 20 points for Obama, the county is half Westchester, and half from the more Republican lower upstate counties (which is what bring down Obama's numbers, while helping to prop up his numbers at a couple of other places. Now, this does means that in a really really bad year, this state could be prone to some close calls for the Democrats, but still it's Democratic enough that I'm not horribly worried about it.


State 6 (New Albany) (Blue-Green)

Population: 4,514,692
Demographics: White 85%, Black 8%, Hispanic 3%, Asian 2%
Partisanship: Obama 57%, McCain 41%
Areas: Albany, Rochester, Buffalo

Notes: I'm sure I don't need to say just how atrocious this district is, but you know something, I'm ok with that, especially given some of the most egregious historical state gerrymanders (I'm looking at you North and South Dakota…) This state basically absorbs all of the major cities in the upstate area while taking pains to keep out the more heavily Republican parts of the state. This is the most populous of the new states, which it must be to keep it as Democratic as it is (without having to send tentacles into the city). I was originally planning to divide upstate into east and west, with one state (east) having a slight (but not very pronounced) Democratic lean, while the other half (the west) would be a pure toss-up state, but it would subject the new states to crazy swings based on the environment (even moderately bad cycles could be enough to give the Republicans 3 of 4 of the two states' senate seats), so I just decided to create a more strongly Democratic state at the cost of conceding a state to the Republicans, which leads us to…


State 7 (New Farmland) (Grey)

Population: 2,011,300
Demographics: White 95%, Black 3%, Hispanic 3%, Asian 1%
Partisanship: Obama 47% McCain 51%
Areas: Rural upstate New York

Notes: Once you take the cities of Albany, Rochester and Buffalo (not to mention places like Utica) away, upstate New York becomes quite Republican by northeast standards (although certainly more moderate). The Republicans should be able to hold this area for the short-term, though if the Republicans don't moderate themselves, they'll probably find this state will turn on them.

By what margin will Bob Shamansky win?

View Results

Loading ... Loading ...

Fusion Voting in New York, the Working Families Party & Close Elections

New York State has an unusual way of conducting elections. Here, one candidate can run for office on the ballot lines of more than one political party. All votes each candidate receives on all lines get added up into one final total – it’s called “fusion voting,” and it’s actually not permitted in most states. But it adds a very interesting wrinkle to New York politics.

For instance, back in 1993, the corrupt and thankfully defunct Liberal Party gave its line in the NYC mayor’s race to Rudy Giuliani. This gave Democrats who opposed David Dinkins but couldn’t countenance pulling the Republican lever a way to vote for Rudy that salved their consciences (even if it had zero practical effect). Giuliani scored some 62,000 votes on the Liberal line, but won by only 57K overall, putting him forever in Liberal chair Ray Harding’s debt. This debt was repaid through patronage, a common stock-in-trade for Harding – and an activity he was eventually indicted for last year (in connection with his dealings with Alan Hevesi).

Not all third-party behavior in New York is this colorful or unseemly. There are fewer small parties today than in the past, and only three of them matter: the Conservative Party, the Independence Party, and the Working Families Party. To get on the ballot in the first place, you need to undertake a difficult, state-wide signature drive. To stay on the ballot, you need to get at least 50,000 votes for governor on your line every four years. Most minor parties, like the Green Party or the Right to Life Party, can’t sustain this and eventually wither. (Same with the Liberals.) The survivors, however, endure.

The Conservatives, as you’d expect, almost always cross-endorse Republicans (though occasionally they back Democrats). They act as a grumpy right-ward pressure group and have been known to split the vote in favor of Democrats – remember NY-23 last year? (Something similar also happened in the same region in a race which led to Dem David Valesky getting elected to the state Senate a few years ago.)

The Independence Party, near as I can tell, is a vestige from the Ross Perot days (though it was founded shortly before his presidential run). My personal opinion is that it remains a force because enough people register as members thinking instead that they are registering as “independents.” (To do that in NY, you need to leave the party selection box on your registration form blank.) Plenty of people probably vote that line for similar reasons. The IP doesn’t have much of a platform and sometimes experiences local power struggles reminiscent of the SDS, but for any politician craving the aura of “independence” (ie, all of them), it’s a bonus.

Finally, there’s the most potent of the bunch, the Working Families Party. Formed in 1998 as the Liberal Party was clearly dying, they are by far the best organized and most powerful of the bunch. They are tightly aligned with NY’s unions and stake out a pretty progressive platform. They also offer a lot more than just their ballot line – a full-fledged WFP endorsement comes with serious field resources as well. At the federal level, they’ve cross-endorsing Dems since 2000. (They’ve supported some Republicans at other levels in the past, but I’ve already expressed enough grar about that to last a lifetime.)

Anyhow, by my count, the WFP has provided the margin of victory in five House races in New York. They are:


Year CD Democrat Overall Margin WFP Votes Without WFP
2002 1 Timothy Bishop 2,752 2,951 -199
2004 27 Brian Higgins 3,774 8,091 -4,317
2008 29 Eric Massa 5,330 9,003 -3,673
2009 20 Scott Murphy 726 3,839 -3,113
2009 23 Bill Owens 3,584 6,589 -3,005

The next-best “near-miss” performance was Dan Maffei’s run against Jim Walsh in 2006, which he lost by just 3,400 votes (and where the WFP supplied 6,500). On the flipside, Mike Arcuri’s close shave had very little margin for error – without the WFP line, he would have won by just 465 votes, instead of 9,919. And incidentally, the Working Families Party has also found its way into neighboring Connecticut, where they gave their line to all five Democrats who ran for Congress in 2008. That year, they helped pad out Jim Himes’s victory from fewer than 3,000 votes to almost 12,000.

The bottom line is that the WFP’s recent decision not to back any Democrats who vote against healthcare reform can and very likely will have a material impact on the 2010 elections. In recent years, almost every Dem running for federal office in NY has gotten the WFP line. For vulnerable Democrats in close races, if the WFP endorsement is not forthcoming, it will be missed.

The Great SSP Redistricting Contest, Round 1 Results

[A note to the winners: Please email me your address so that I can send you your babka! – DavidNYC]

So, I’m lazy and took my sweet time in writing this up. In my defense, Martha Coakley happened, and I chose to distract myself by working on more datasets for Dave’s App. I won’t steal Dave’s thunder, and I’ll leave it to him to announce any news on his time.

Nevertheless, here are the results from the Great Swing State Project Redistricting Contest, Round 1.

Some specifics first. I received 18 entries that were judgable; if I was missing anything from you, I tried my best to reach out and get everything I needed to judge your entry.

Of the 18 entries, with David’s generosity, I selected two winners: abgin, and MattTX2.

The first, I hope, is of no surprise – abgin’s 28-0 map, I think, made everyone’s jaw drop in its brilliance/hideousness/all-around-awesomeness. His/her entry was simply too good not to reward with babkaness!

For the other 17 entries, there was only one 26-2 plan, from silver spring. Three of you tried 28-0 plans, and the remaining 13 of you gave us 27-1 plans.

I tried to come up with some objective measures to help me consider them. Here are the two I considered:

1. To determine the amount of gerrymandering, I created a “county fragmentation index,” which indicates the number of “unnecessary” splits.

2. I also created a “swing index,” to measure quantitatively the improvements given to each district. I used a “safe line” concept (ala my New York State Senate district diary). Since reasonable people can disagree on what an appropriate safeline is, I evaluated each plan on safe lines at 1% increments from 50% Obama to 60% Obama.

Without further ado, I chose MattTX2 as the second winner. I thought he executed the screwing of Peter King in the most precise way, and as the first entrant, showed that this could be done (something I was skeptical of; I believed that the population simply wasn’t in place for that to happen.) His map also produced the best objective improvements, improving the 27 Democratic districts by an aggregate of 5,600 basis points in the 57-60% ranges, the best among the 27-1 plans. The performance, notably, didn’t drop off in the 54-56% range either. Matt’s map, compactness wise, wasn’t a horrendous gerrymander either; with 26 more county fragments than minimally necessary, this was solidly in the middle of the pack (the median, in fact.)

Here are improvement and county fragment scores for every entry.

I would be remiss in judging, though, if I didn’t mention some other notable entries:

  • Abgin obviously had the loosest defintion of “contiguity”, but I think the award for loosest definition of “water contiguity” goes to andgarden.
  • duffman gets the award for most compact map, creating just 11 more county fragments than necessary.
  • bschak made the best attempts for population equality, acheiving a total deviation of only 3,902.
  • AdmiralNaismith played population equality the loosest, racking up a total deviation of more than 113,000.
  • Alibguy had the best 28-0 plan, yielding the best improvements from 52-60%.

In conclusion, thanks to everyone who participated, to Dave for developing this wonderful time-sink (I could never get GUIs down when programming), and to DavidNYC for giving me this opportunity to judge the contest, and for spreading the glory that is Green’s chocolate Babka! Congratulations again to abgin and MattTX2!

Update: I should better explain what the swing index is: the swing index is, in total, a slightly-adjusted measurement of the Democratic percentage improvement. The index is the sum, across all Democratic districts, of swings toward Obama in basis points.

When I say slightly adjusted, for example, I want to punish someone for unpacking Louise Slaughter’s district. So you have the Obama percentage before (Ob1), and the Obama percentage after (Ob2), and the “Safe line” percentage (SL).

So you have four situations:

1. Ob1 > SL, and Ob2 > SL: the district was above the safeline before, and the new district is above the safeline. The contribution to the swing index from the district is 0.

2. Ob1 < SL, and Ob2 > SL: the district used to be below the safeline, the new district was boosted above the safeline. The contribution to the swing index from the district is Ob2-Ob1, in basis points.

3. Ob1 > SL, and OB2 < SL: the old district was above the safeline, the new district was weakened. The contribution to the swing index from the district is SL-Ob2, in basis points. I did this so that you’re not being punished for an astronomic drop for a district that was much much too safe before, like Louise Slaughters.

4. Ob1 < SL, and OB2 < SL: the old and new districts are both in marginal territory; the new district could be stronger or weaker than the old. The contribution to the swing index from the district is Ob2-Ob1 in basis points. This can be positive or negative.

So I totaled up the numbers from each district, yielding the swing index that you see.

Also, the ones highlighted in green are the highest two indexes for a given safe line.

Lastly, the CFI is the “County Fragment Index” – the number of excess county fragments created over what is minimally necessary for 28 districts with perfect population equality.

Contest Entry: New York 27-1

Photobucket

Edit: I just realized the deadline was of course Eastern standard time. Forgive the foolish Californian. At any rate, I did send my .drf.xml to Jeff in time, but even if I am too late this has been a lot of fun.

For my entry in New York redistricting contest, I decided to create a 27-1 map. I chose to eliminate Peter King and pack as many republicans as possible into Chris Lee’s 26th district.  

I expect all democrats to be reelected. Eliminating the old 3rd allowed me to move Nita Lowry’s district southwards, thereby opening up much of Westchester county to reinforce Hall and indirectly the other upstate districts. I aimed for 55% Obama (i.e. a PVI of D+2) for most of the vulnerable upstate districts. The most vulnerable incumbent is Bill Owens in the 23rd at 53% Obama. In general, I tried to keep incumbents in their main bases of support. Also, I was careful to make sure all incumbents’ homes were actually in their new districts.

I aimed for clean lines where possible; however, I had no compunction about obscene gerrymandering when necessary (e.g. Rochester). Some of the uglier districts where necessary to ensure VRA compliance (Nadia Velazquez’s). Also just for fun, I tried to keep all the NYC bridges within the same district.

All districts are within 1600 or about 0.2% of the average population and all but four are within 1000. Finally, I adjusted the district numbers to reflect the changes.

Now without further ado onto the districts.

Long Island

Photobucket

NY-01

Incumbent: Tim Bishop (D)

Population: 701,285

2008 Results: 54% Obama – 45% McCain

This district stays based in western Suffolk county including Bishop’s home in Southampton. I strengthened it from 51% Obama by grabbing some very blue parts of Islip in exchange for swingy parts of Brookhaven and solid red Smithtown.

NY-02

Incumbent: Steve Israel (D)

Population: 699,873

2008 Results: 54% Obama – 46% McCain

The 2nd stays based in western Suffolk county, including all of Israel’s home in Huntington. I had to weaken this district slightly to strengthen the 1st. I made up for this partly by sending a finger into true blue North Hempstead while moving GOP leaning parts of Babylon into McCarthy’s district.

Photobucket

NY-03

Incumbent: Carolyn McCarthy (D)

Population: 700,667

2008 Results: 56% Obama – 43% McCain

Formerly the 4th, this district takes in most of south eastern Nassau County, including most of McCarthy’s base in Hempstead.

NY-04

Incumbent: Gary Ackerman (D)

Population: 700,640

2008 Results: 55% Obama – 44% McCain

The remnants of Peter King’s district had to go somewhere, and this (formerly the 5th) is where much of it went. I moved the swingy parts of the old 3rd west of Hempstead here, while giving part of north Queens for balance. I also took in the blue parts of Glen Cove. This district drops a fair bit from its old D+12, but should stay blue.

New York City

Photobucket

Queens

Photobucket

NY-05

Incumbent: Gregory Meeks (D)

Population: 699,395

2008 Results: 74% Obama – 26% McCain

Formerly the 6th, this is probably my favorite district, simply because it royally screws Peter King. This stays based in southeast Queens, but stretches along the coast to take in the truly brutal parts of the old 3rd, including all of King’s hometown in Oyster Bay. At 50% African American, it stays VRA compliant and should be a cakewalk for Meeks.

NY-06

Incumbent: Anthony Weiner (D)

Population: 700,140

2008 Results: 61% Obama – 38% McCain

This district, formerly the 9th, is mostly unchanged. It is based in central and south western Queens, with a finger into republican parts of south Brooklyn.

NY-07

Incumbent: Joseph Crowley (D)

Population: 699,985

2008 Results: 72% Obama – 27% McCain

This district sheds its northern half in the Bronx, which instead goes to Nita Lowey. This is balanced out by the Queens part of Gary Ackerman’s old district.

Brooklyn

Photobucket

NY-08

Incumbent: Edolphus Townes (D)

Population: 700,681

2008 Results: 85% Obama – 15% McCain

Formerly the 10th, this district is still based eastern Brooklyn and still majority (56%) African American. I slightly extended the finger into south Brooklyn to take in some of the deep red areas.

NY-09

Incumbent: Nydia Velazquez (D)

Population: 700,803

2008 Results: 87% Obama – 12% McCain

Formerly the 12th, this VRA district continues to take in the majority Hispanic neighborhoods in northern Brooklyn, western Queens and lower Manhattan. In total the district is 51% Hispanic

NY-10

Incumbent: Yvette Clarke (D)

Population: 701,024

2008 Results: 86% Obama – 14% McCain

Formerly the 11th, this district stays deep blue with its 56% African American majority

NY-11

Incumbent: Michael McMahon (D)

Population: 699,849

2008 Results: 57% Obama – 43% McCain

Formerly the 13th, this district gets a big boost with the inclusion of the financial district and Batter Park in southern Manhattan. I also have a couple fingers into deep blue parts along the Brooklyn shore. The core of the district remains Staten Island however.

Manhattan

Photobucket

NY-12

Incumbent: Jerrold Nadler (D)

Population: 699,549

2008 Results: 71% Obama – 28% McCain

Formerly the 8th, this is probably the most gerrymandered district I have. As before it takes in most of the Lower West Side, wanders through lower Manhattan, the jumps across the Brooklyn Bridge to take in much of western Brooklyn

NY-13

Incumbent: Carolyn Maloney (D)

Population: 699,640

2008 Results: 80% Obama – 19% McCain

This districts stays based in eastern Manhatten then jumps accross the Queensboro Bridge and Long Expressway to take in north western Queens.

NY-14

Incumbent: Charlie Rangel (D)

Population: 701,118

2008 Results: 92% Obama – 7% McCain

Formerly the 15th, this district stays based in Harlem and the rest of northern Manhattan. At 44% Hispanic and 28% AA, this is still solidly majority minority.

Bronx

Photobucket

NY-15

Incumbent: Jose Serrano (D)

Population: 699,572

2008 Results: 95% Obama – 5% McCain

At 63% Hispanic, this is the Bronx area VRA district taking in the south west of the borough.

NY-16

Incumbent: Nita Lowey (D)

Population: 699,561

2008 Results: 67% Obama – 32% McCain

Formerly the 18th, this district stays based in New Rochelle, but moves to take in the Bronx parts of the 7th and red parts of Northern Nassau County.

NY-17

Incumbent: Eliot Engel (D)

Population: 699,626

2008 Results: 70% Obama – 29% McCain

This district stays based in the north west Bronx, then stretches along western Westchester to take in the blood red parts of Rockland county.

Upstate

Photobucket

NY-18

Incumbent: John Hall (D)

Population: 701,862

2008 Results: 58% Obama – 41% McCain

We now get to the second benefit of eliminating Peter King. Since a series of NYC districts moved south and west to fill in the old 3rd, I’m able to open up some bright blue parts of Westchester County. Hall’s district, formerly the 19th, now extends much further south, taking in White Plains, part of Yonkers, and Mount Vernon. For balance, I shed Orange county and south western Dutchess county.

NY-19

Incumbent: Maurice Hinchey (D)

Population: 700,165

2008 Results: 55% Obama – 44% McCain

Formerly the 22nd, this district gets the most radical redraw of any in the state. I shed the entire northern half of the district, using Binghamton and Ithaca to strengthen Acuri. Meanwhile, I extend the district south to take in Orange county and the blue parts of Rockland county. Most of Hinchey’s base in Ulster County is still in so she should still be able to hold onto it, but it will definitely won’t be cakewalk anymore.

NY-20

Incumbent: Scott Murphy (D)

Population: 700,715

2008 Results: 55% Obama – 44% McCain

The biggest change here is the addition of deep blue Troy and part of western Albany. Also I have added in Poughkeepsie and swingy parts of south western Dutchess County. I have given Washington county to the 23rd, along with a blue finger running down the west part of the district. This should be a little easier to hold.

NY-21

Incumbent: Paul Tonko (D)

Population: 700,770

2008 Results: 55% Obama – 43% McCain

This district is weakened slightly to help out Scott Murphy and to some extent Bill Owens. To make up for the loss of Troy and part of Albany I extend the district both north and south west. To the north I take in deep red Hamilton County along with GOP parts of Fulton, Saratoga, and Warren Counties. To the south west I take in swing parts of Greene and Sullivan Counties, red parts of Delaware county, and solid blue parts of north Ulster County.

NY-22

Incumbent: Mike Acuri (D)

Population: 700,450

2008 Results: 55% Obama – 44% McCain  

Formerly the 24th, this district gets a significant boost with the addition of Ithaca and Binghamton. I also shed the deep red area north of Rome. Finally to get sufficient population, I added in swingy Syracuse suburbs in south and western Onondaga County.

NY-23

Incumbent: Bill Owens (D)

Population: 701,668

2008 Results: 53% Obama – 45% McCain  

This remains our most vulnerable district in New York. Still I manage to make it a point bluer by shedding the deep red area north and west of Rome and extending the aforementioned finger down the eastern border.

NY-24

Incumbent: Eric Massa (D)

Population: 701,475

2008 Results: 55% Obama – 43% McCain  

Formerly the 29th, this district gets a significant boost from a large chunk of downtown Rochester. I also shed the deep red Western half of the district. Finally I sent out a finger going east to claim the rest of the swing parts of Maurice Hinchey’s old district

Photobucket

NY-25

Incumbent: Dan Maffei (D)

Population: 699,797

2008 Results: 55% Obama – 43% McCain  

This district also gets a bump from parts of Rochester. However, this is then canceled out by the very republican areas in and around northern Oneida County. The end result is a point more competitive, but Maffei should be able to hold it with his base in Syracuse

NY-26

Incumbent: Chris Lee (R)

Population: 700,240

2008 Results: 42% Obama – 57% McCain  

All the republicans in western New York had to go somewhere, so this is it. I added in the deep red western parts of Massa’s district along with any republican leaning areas in Erie and Chautauqa counties.  Meanwhile I moved in swing areas around Rochester or Buffalo into the 27th and 28th.

Photobucket

NY-27

Incumbent: Brian Higgins (D)

Population: 699,327

2008 Results: 57% Obama – 41% McCain  

This district is mostly unchanged, with a bit more of Higgins base in Buffalo. Should be an easy hold.

Photobucket

NY-28

Incumbent: Louise Slaughter (D)

Population: 699,260

2008 Results: 57% Obama – 41% McCain  

This district probably ties the 8th for most gerrymandered. Seriously, Congresswoman Slaughter please for all that is holy move to the other side of Rochester. As it is now this district is D+15. I wanted to share some of that wealth with Maffei and Massa. The result is a serious of fingers taking in all the swing or only lean blue suburbs of Rochester, with just the thinnest sliver running through the downtown area to connect her home. As before I then run along the shore of Lake Ontario to take in northern Buffalo. I realize this district is ugly, but then it already gets a bad rap as the “earmuffs.”

At any rate, that’s my crack at New York. I think that’s about as much as we can strengthen upstate without sacrificing one of our incumbents. If nothing else though, I am convinced we need to get rid of Peter King once and for all.

Full size maps are available at http://s862.photobucket.com/al…

Contest Entry: 27-1 NY Map

This is my contest entry for Redistricting New York.

The aim of this entry was to create a map where 27 Democrats should be expected to win in New York in any given election. Every Democratic district is 53%+ for Obama. (Notwithstanding the astute observation by jeffmd that Presidential toplines don't mean everything) only 16 Republicans were elected in districts that Obama won by 53% or more (DE-AL, IL-06, IL-10, IL-13, IL-16, IA-04, LA-02, MI-06, MI-08, MI-11, NJ-02, OH-12, PA-06, PA-15, VA-10, and WA-08 [55% or more in bold]).

This entry respects VRA districts in New York City, puts King an a solid Obama district, and solidifies Democratic districts in upstate New York. 

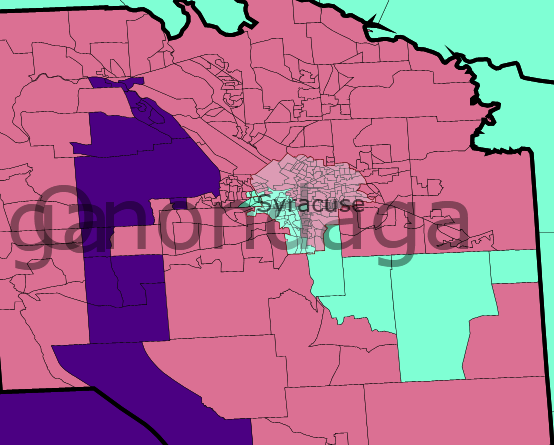
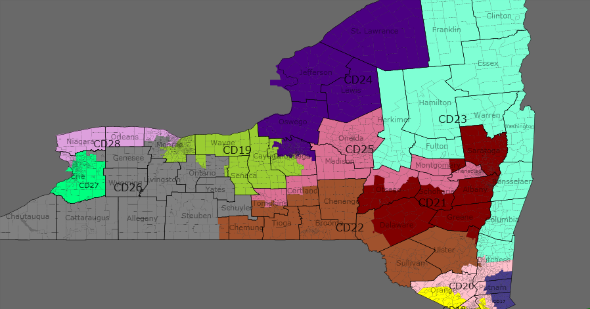
Since New York is expected to lose one Congressional seat, one incumbent's district needs to be eliminated. Although the current Representative from New York 23 is a Democrat, I eliminated Representative Owens district and combined his home with Representative Murphy's NY-20. This map also shifts Representative Massa out of his district (represented here as NY-19). The reason for this is the location of his home in southeastern Steuben County. Steuben County is surrounded by Republican leaning counties, and a way to create a third solid Democratic district in Western New York is to connect Rochester and Syracuse.
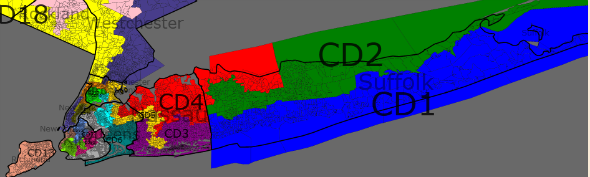
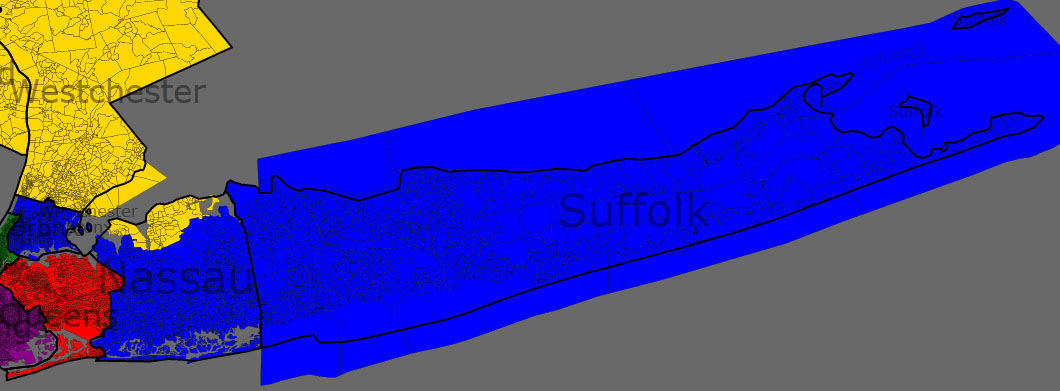
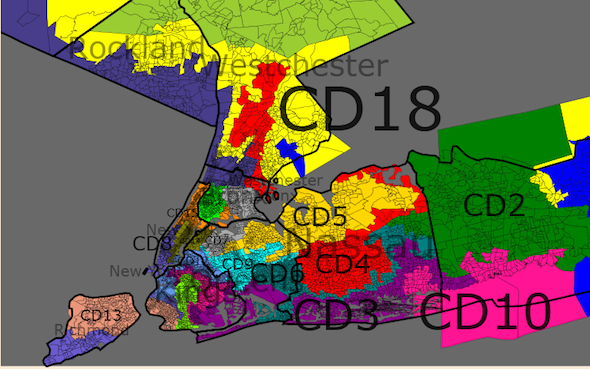
Photobucket

Photobucket

Long Island

NY 1 Current Incumbent – Bishop

Population – 700,226

White Black Asian Hispanic
Race 77% 7% 2% 12%
Obama McCain
Old District 54% 44%
New District 54% 46%
Change 0% +2%

NY 1 becomes the southern half of Suffolk County.

NY 2 – Current Incumbent – Israel

Population – 700,711

White Black Asian Hispanic
Race 78% 7% 3% 10%
Obama McCain
Old District 56% 43%
New District 54% 46%
Change -2% +3%

NY 2 contains the central and northeastern portions of Suffolk County. This district remains potentially competitive, as the district vote for Obama was 53%.

Of all of the districts drawn on this map, this is probably the hardest one to justify – going from a district where Obama won with 56% in 2008. The only solace that I have is that a) Republicans rarely win districts where Obama won with 53% or greater, and b) there are plenty of Republican precincts in Nassau in Suffolk counties, especially along the border and along the northern shore. This, then requires a couple of decisions that need to be made. First, you could divide up Nassau and Suffolk counties east-west as exemplified by Answer Guy with a historical discussion here. Answer Guy's map divides Nassau into seven districts – each taking a portion of the Republican areas on Long Island.

NY 3 – Current Incumbent – None

Population – 700,454

White Black Asian Hispanic
Race 70% 13% 4% 11%
Obama McCain
Old District 47% 52%
New District 55% 44%
Change +8% -8%

Unlike other maps for this contest, I did not feel the need to split up Long Island – just moving the pieces around could create four Democratic-leaning districts (and BTW, and FWIW, WA 1 is connected by Ferry between Edmonds and Kingston).

This configuration of NY 3 draws Representative King out of the district. Even if he were to decide to run in the district, and not against Representative McCarthy in his NY 4, he would face a district where Obama received 55% of the vote.

The district is split into two areas, those parts of Hempstead adjacent to Queens and the portion of Hempstead adjacent to Suffolk County. The two areas are connected through Long Beach.

NY 4 – Current Incumbent – McCarthy

Population – 700,121

White Black Asian Hispanic
Race 77% 5% 9% 9%
Obama McCain
Old District 58% 41%
New District 54% 46%
Change -4% 5%

Photobucket

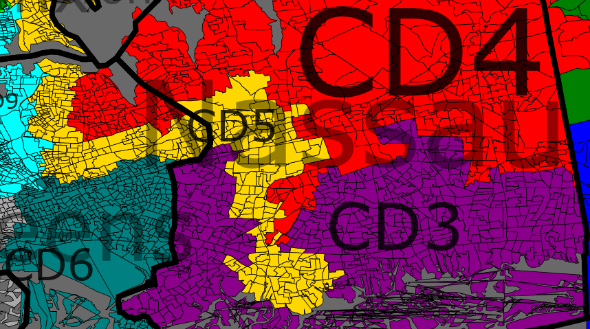
This is perhaps my ugliest looking district, but Representative McCarthy should be able to retain his seat under this configuration. The district encompasses the northern part of Nassau County, some Republican areas of Hempstead, and the North and West portions of Suffolk County. The district also extends into the Bay Side and Bay Terrace neighborhoods of the Queens.

If Representative King were to run for this seat, he would find its dynamics very unfavorable, with a lot of new constituents with a strong Democratic lean.

NY 5 – Current Incumbent – Ackerman/King

Population – 700,231

White Black Asian Hispanic
Race 54% 9% 20% 14%
Obama McCain
Old District 63% 36%
New District 60% 39%
Change -3% +3%

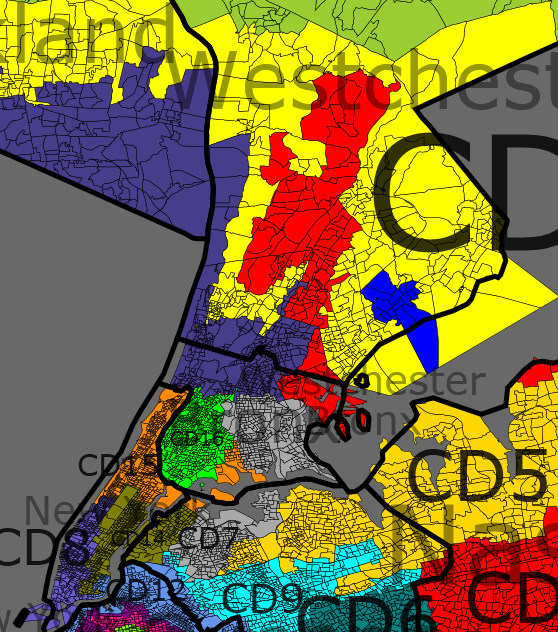
NY 5 could be considered a New York City district, as it stretches from the Bronx through Queens into North Hempstead and Republican areas of Hempstead (including Representative King's Seaford neighborhood).
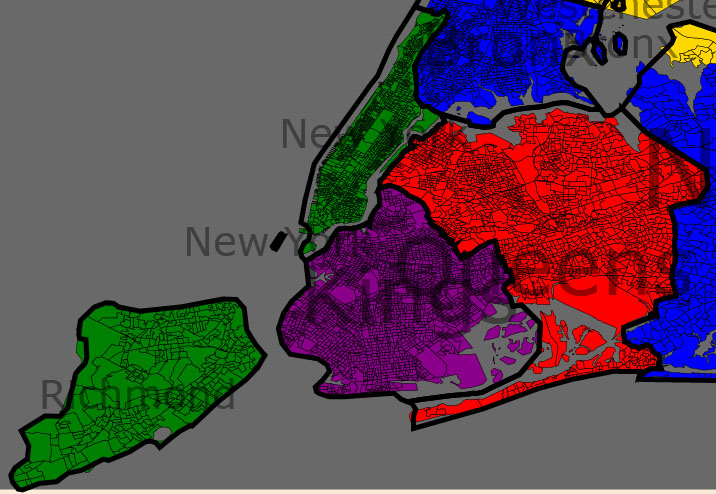
New York City

NY 6 Current Incumbent – Meeks

Population – 700,218

White Black Asian Hispanic
Race 16% 51% 8% 16%
Obama McCain
Old District 89% 11%
New District 86% 13%
Change -3% +2%

This is a VRA district, and it does not change much from the current district. It does add all of the Rockaways.

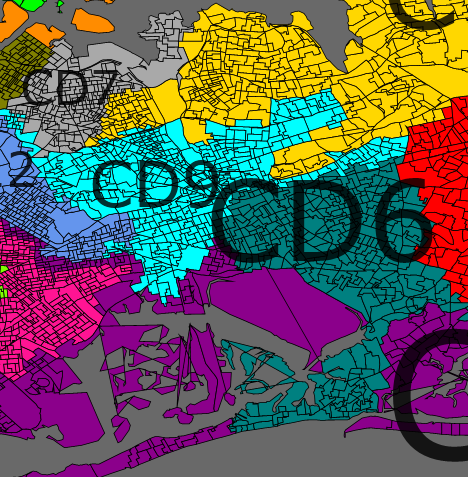
NY 7 Current Incumbent – Crowley

Population – 700,095

White Black Asian Hispanic
Race 41% 9% 11% 34%
Obama McCain
Old District 79% 20%
New District 70% 29%
Change -9% +9%

Like the existing district, there are two distinct areas of the district. Instead of going North, NY 7 now orientates South, from Woodside and Hunters Point, through Ridgewood and Bushwick, and Woodhaven. From there, the district cuts into Jamaca Bay, Floyd Bennet Field and Marine Park to connect to Seagate, Coney Island, Brighton Beach and Manhattan Beach.

This is a minority-majority district.

NY 8 Current Incumbent – Nadler

Population – 700,295

White Black Asian Hispanic
Race 52% 11% 15% 20%
Obama McCain
Old District 74% 25%
New District 87% 13%
Change +13% -12%

NY 8 is now entirely a West Side/Lower Manhattan district.

NY 9 Current Incumbent – Weiner

Population – 700,395

White Black Asian Hispanic
Race 26% 11% 17% 42%
Obama McCain
Old District 55% 44%
New District 76% 23%
Change +21% -21%

NY 9 takes what was lost from NY 7 – crossing from the Queens into the Bronx over the Bronx-Whiteshone Bridge. The district is a minority-majority district.

NY 10 Current Incumbent – Towns

Population – 700,417

White Black Asian Hispanic
Race 24% 52% 4% 16%
Obama McCain
Old District 91% 9%
New District 84% 16%
Change -7% +7%

Photobucket

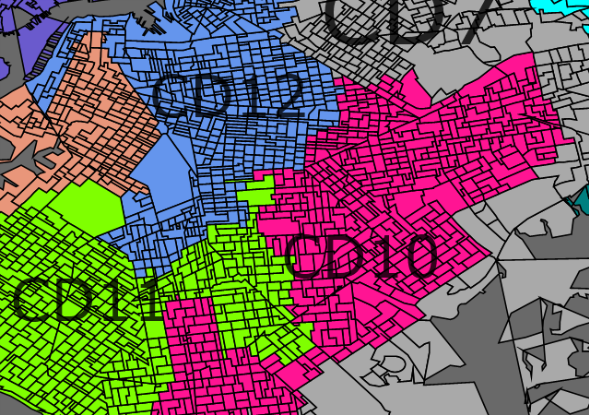
NY 10 loses the Willamsburg neighborhood and areas toward the west, and gains Republican areas in Manhattan Terrace. The district remains an African-American majority district.

NY 11 Current Incumbent – Clarke

Population – 700,102

White Black Asian Hispanic
Race 49% 15% 16% 16%
Obama McCain
Old District 90% 9%
New District 60% 40%
Change -30% +31%

The district extends from Representative Clarke's home precinct in Prospect Gardens in the north to Bath Beach in the south. While NY 11 is no longer an African-American majority district, it remains a minority-majority district. Because it takes in many of the Republican precincts in Queens, Obama's percentage in the district drops to 60%.

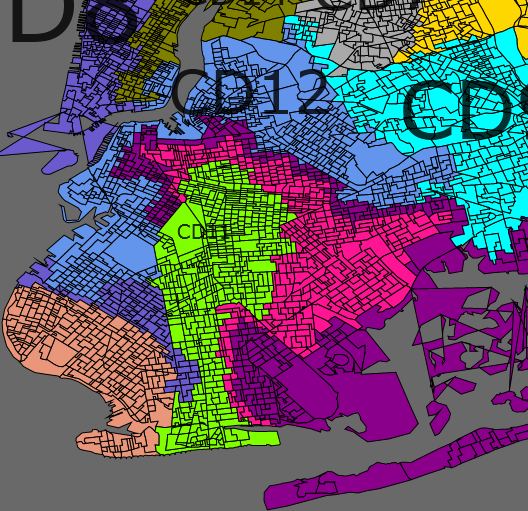
NY 12 Current Incumbent – Velazquez

Population – 700,391

White Black Asian Hispanic
Race 22% 50% 4% 20%
Obama McCain
Old District 86% 13%
New District 91% 9%
Change +5% -4%

NY 12 is now the second African-American majority district located entirely in the Queens. The district encompasses the Crown Heights and Prospect Heights neighborhoods as well as the Williamsburg neighborhoods. On the western edge of the Queens, a finger stretches south to pick up Representative Velazquez's home precinct in Carroll Gardens.

It is possible that neither Nydia Velazquez nor Yvette Clarke would be happy in their districts, since Representative Clarke will represent the more Hispanic-leaning district, while Representative Velazquez will represent an African-American majority district. However, this could be easily rectified. First, in my original map (before I learned what precinct each representative lives in), I had Representative Clarke in NY 12 (and she now is the Northernmost precinct of NY 11). Second, since Representative Velazquez is a renter, it is possible that she could subsequently move into the then open NY 11.

NY 13 Current Incumbent – McMahon

Population – 700,091

White Black Asian Hispanic
Race 67% 9% 6% 15%
Obama McCain
Old District 49% 51%
New District 60% 39%
Change +11% -12%

All of Staten Island remains in NY 13, and the district crosses into Brooklyn over the Verrazano-Narrows Bridge. From the bridge, the district heads north along the New York Bay into the Red Hook and Gowanus neighborhoods.

This composition makes the swing district a reliable Democratic district. Obama won 60% in this district.

NY 14 Current Incumbent – Maloney

Population – 700,256

White Black Asian Hispanic
Race 61% 8% 9% 19%
Obama McCain
Old District 78% 21%
New District 80% 19%
Change +2% -2%

NY 14 retains much of its current shape – although it does go a bit further north to encompass Rikers Island. Representative Maloney should be happy, as Obama won 80% of the vote here.

NY 15 Current Incumbent – Rangel

Population – 699,954

White Black Asian Hispanic
Race 14% 30% 3% 50%
Obama McCain
Old District 93% 6%
New District 91% 8%
Change -2% +2%

Photobucket

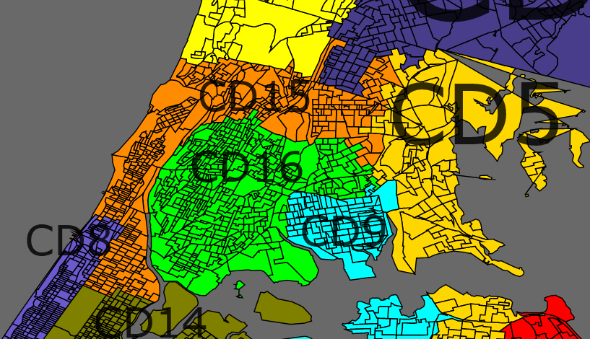
Charlie Rangel may face a stiff primary challenge in this district where Obama won 91% of the vote. The district loses portions of the Upper West Side for the Norwood and Olinville neighborhoods in the Bronx. The district does retain most of Harlem.

The district is a majority Hispanic district (just over 50%). 

NY 16 Current Incumbent – Serrano

Population – 700,580

White Black Asian Hispanic
Race 5% 30% 2% 60%
Obama McCain
Old District 95% 5%
New District 93% 6%
Change -2% +1%

60% Hispanic. 93% Obama. Not much more I can say about this Bronx district.
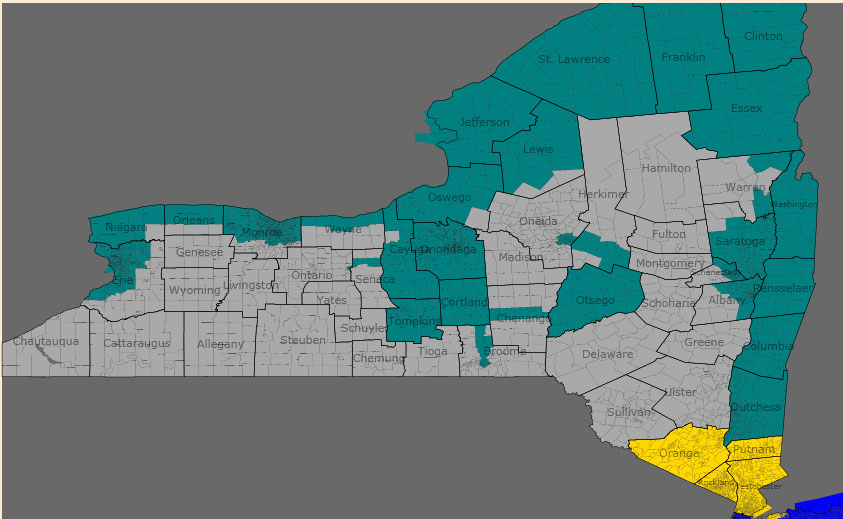
Upstate New York

NY 17 Current Incumbent – Lowey

Population – 700,687

White Black Asian Hispanic
Race 62% 20% 3% 12%
Obama McCain
Old District 62% 38%
New District 62% 37%
Change +0% -1%

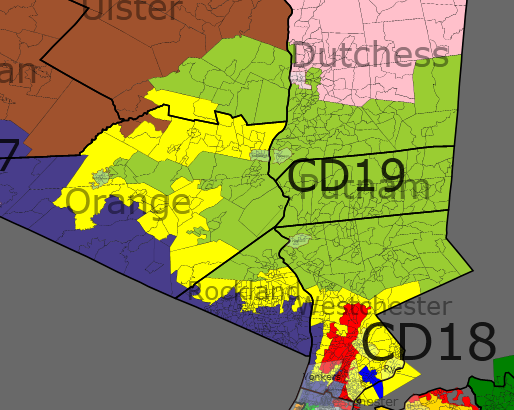
Representative Lowey's district extends from the Bronx and follows I-95 and I-695 through Mount Vernon to the Connecticut border. To complete the district, NY 17 extends north along I-84 into eastern Putnam County and southern Dutchess counties.

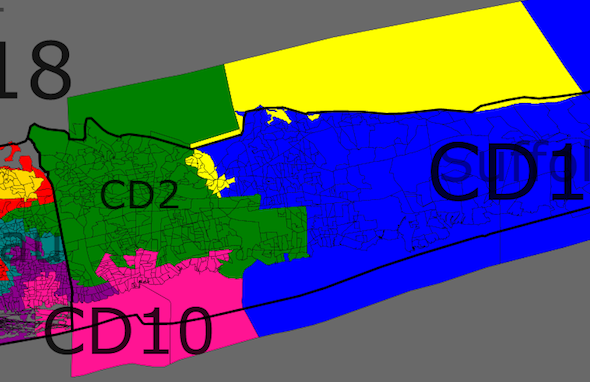
NY 18 Current Incumbent – Engel

Population – 700,238

White Black Asian Hispanic
Race 70% 9% 5% 14%
Obama McCain
Old District 72% 28%
New District 58% 41%
Change -14% +13%

New York 18 extends into the Bronx to pick up Representative Engel's neighborhood of Fairport goes north through Yonkers into Westchester and Putnam counties. The District crosses the Hudson over I-87, and takes the Republican portions of Rockland and Orange County.

Engel's district takes a hit in order to strengthen Representative Hall. Obama's percentage in the district drops to 58%, which still should be a safe seat for a Democrat.

NY 19 Current Incumbent – None

Population – 700,409

White Black Asian Hispanic
Race 86% 6% 2% 3%
Obama McCain
Old District* 56% 43%
New District 56% 43%
Change +0% -0%

* Percentage for Representative Maffei's current district
Percentage for NY 29 = Obama 48%, McCain 50%

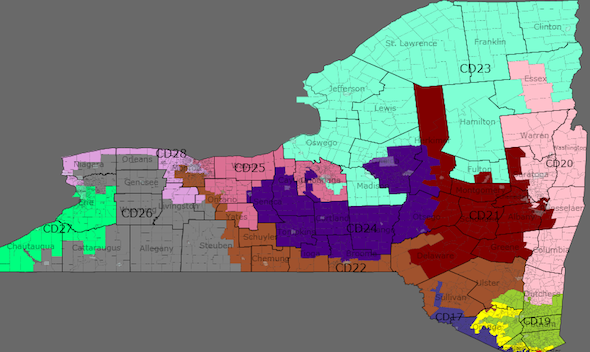
This configuration of upstate New York is necessary to preserve a 27-1 delegation. With Eric Massa's home in Corning in Southeastern Steuben County, the possible routes are to go north to Rochester, north and east to Ithica and Syracuse, or west towards Buffalo. None of these options make much sense and damage the possibilities of creating a Democratic performing district for Representative Arcuri's Utica based district because of the need to add population to NY 22 (or Maffei's Syracuse based district).

1) North to Rochester/Syracuse. This route is problematic for the creation of a sensible (to the eye) district for Representative Arcuri. Since in this formulation, his district spans I-90 and dives south to pick up Ithaca, any finger north puts pressure on Arcuri's district to ensure contiguity. (Also see MattTX2's entry for a good explanation of why going North does not work).

2) West to Buffalo. This route is more logical than going North, but has the effect of making NY 26 an eyesore, when it is possible to create a compact Republican performing district in Western New York and safer Democratic districts throughout upstate New York.

Instead, what I did was to create a district spanning I-90 from Syracuse to Rochester and Democratic portions of Ontario county, which is similar to the existing NY 25. In this district, Obama received 55% of the vote. As I suggested in the intro, 55% is really the safest magic number, with 7 Republicans representing districts 55% plus. Of those 7 Republicans, one Cao won because of scandal, two are in Illinois (where Obama is from), and one is a state institution (Castle). For me, the only head scratchers are the two Pennsylvania districts and WA-8 (but that is a different story).

To sum up, NY-19 is a very safe Democratic district and follows much of the current NY 25, even if it does not contain Representative Massa's (or Representative Maffei's) current residence. This does not pose a Constitutional problem, but long-term, is a relatively compact district that should safely elect a Democrat to Congress. In addition, if Massa is not able to win reelection in 2010 (rated lean Democrat by CQ; Kerry 42%, Gore 43%), the issue then becomes moot. However, since that is not part of the conditions of this contest, I choose to create a compact district between Rochester and Syracuse and elsewhere in upstate New York that are more consistently Democratic performing.

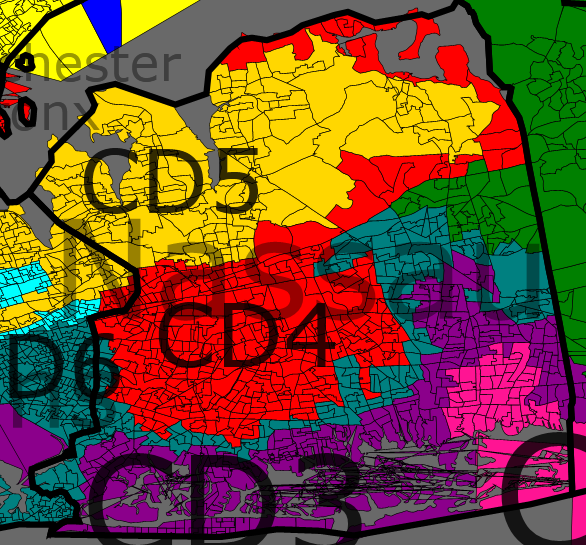
NY 20 Current Incumbent – Hall

Population – 700,079

White Black Asian Hispanic
Race 74% 10% 3% 12%
Obama McCain
Old District 51% 48%
New District 55% 44%
Change +4% -4%

Photobucket

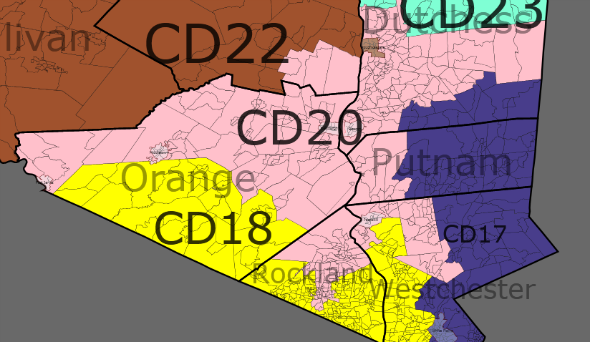
Representative Hall's district, like most of the swing districts in upstate New York is strengthened. The district stretches from the northern portion of Weschester County (including Yorktown and New Castle) to a small portion of Ulster County and includes the Democratic parts of Rockland County and Orange County.

The district becomes a safe seat for Representative Hall, with Obama's percentage at 55%.

As an aside, I think this district looks like a M.U.S.C.L.E. Man, with its head in Ulster County, two arms going from Orange County to Dutchess County, and its two legs stretching into Ramapo and Yorktown and New Castle.

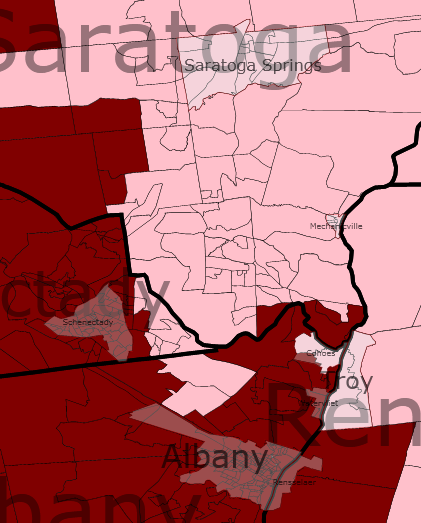
NY 21 Current Incumbent – Tonko

Population – 700,765

White Black Asian Hispanic
Race 89% 6% 2% 3%
Obama McCain
Old District 58% 40%
New District 56% 42%
Change +2% -2%

Photobucket

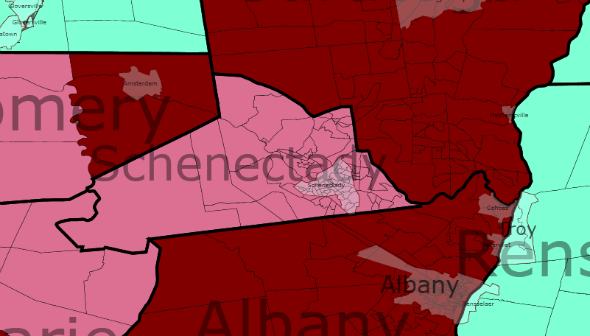
This Albany-centered district becomes less Democratic to shore up Representative Arcuri's seat, but the district should remain a safe seat for Representative Tonko.

In the Capitol Region area, the district loses Schenectady and gains Saratoga. Outside of the region, the district takes in Republican-leaning portions of Schohare and Greene counties, and Republican areas of Delaware and Ostego counties. Representative Tonko's residence in Amsterdam remains in the district.

NY 22 Current Incumbent – Hinchey/Massa

Population – 700,478

White Black Asian Hispanic
Race 88% 5% 2% 4%
Obama McCain
Old District 59% 39%
New District 55% 44%
Change -4% +5%

This district is drawn for Represenative Hinchey, but would be a good district for Representative Massa should Hinchey (72) retire.

The district stretches along the Southern border of New York from Hinchey's home town of Hurley to Corning in Steuben County. The district also encompasses the Southern portions of Tompkins and Cortland counties and, in the East, the City of Poughkeepsie. The performance of the district does drop to 55% – staying above the potentially competitive line.

NY 23 Current Incumbent – Murphy/Owens

Population – 700,469

White Black Asian Hispanic
Race 93% 3% 1% 2%
Obama McCain
Old District 51% 48%
New District 53% 45%
Change +2% -3%

New York 23 takes in many of the counties in the Adirondack Mountains in upstate New York and then follows the Vermont/Massachusetts border into Dutchess County. 

This district contains most of the current NY 20 and portions of the current NY 23 and 24, but still raises Obama's percentage from 51% to 53%. Most of the increase is due to losing Greene and Delaware counties, in favor of more reliable Democratic Franklin and Clinton counties in the North.

Both Murphy and Owens reside in this district, but this is necessary to create safer districts across the State.

NY 24 Current Incumbent – Maffei

Population – 700,386

White Black Asian Hispanic
Race 91% 4% 1% 2%
Obama McCain
Old District* 52% 47%
New District 55% 43%
Change +3% -4%

* Percentage is for the current NY 23
Percentage for the current NY 25: 56% Obama, 43% McCain

Photobucket

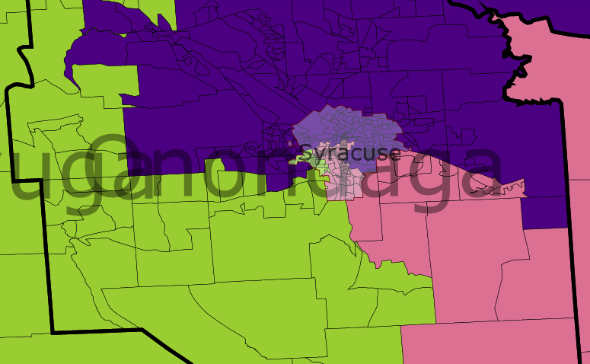
Instead of going east from Syracuse, as Maffei's current district does, this district goes North, picking up large portions of the current NY 23 (Oswego, Lewis, Jefferson, and St Lawrence Counties). This district is Syracuse based, both in population and possess a shared community of interest, with most of the district in the Syracuse TV market (or Watertown market, which overlaps with Syracuse anyway).

This configuration does suggest a swing, but increasingly Democratic district. Obama did get 55% in 2008, but it may have barely gone for Bush in 2004. Perot did well in this district in 92, probably getting close to 25-26% of the vote (compared to 16% in New York and 19% nationwide).

NY 25 Current Incumbent – Arcuri

Population – 700,483

White Black Asian Hispanic
Race 87% 7% 2% 3%
Obama McCain
Old District 50% 48%
New District 54% 44%
Change +4% -4%

Photobucket

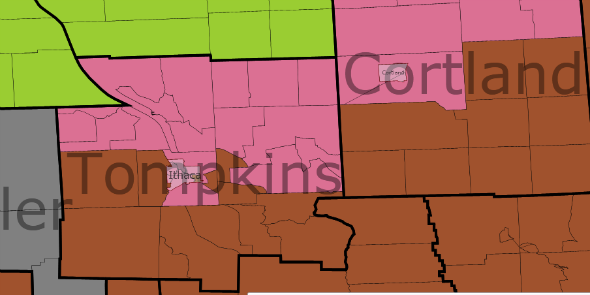
District 25 becomes an octopus looking district that stretches from Democratic Schenectady to Democratic Syracuse and Ithaca in the east. The head of the octopus is Representative Arcuri's home county of Oneida. The district also picks up portions of Syracuse. Despite the uglish looking nature of the district, the district gains 4% for Obama from 2008.

The district contains all of Schenectady, Oneida, and Madison counties, as well as portions of Montgomery, Schoharie, Otsego, Cortland, Tompkins, and Canondaga counties.

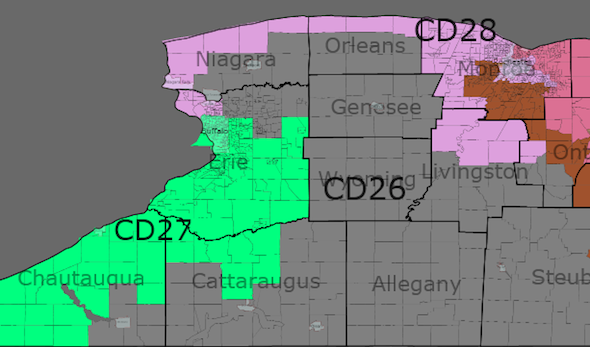
NY 26 Current Incumbent – Lee

Population – 699,996

White Black Asian Hispanic
Race 94% 2% 1% 1%
Obama McCain
Old District 46% 52%
New District 44% 55%
Change -2% +3%

With this map, Representative Lee is the safest Republican in any of the New England states. This NY 26 takes in his home precinct of Clarence 22 in Erie County, and encompasses most of the Republican leaning counties in Western NY as well as Republican-leaning areas in Western Monroe county. The district is comprised of all of Genessee, Wyoming, Livingston, Yates, Schuyler, Allegany, Cattaraugus, and Chautauqua counties, most of Stuben and the Republican areas of Ontario counties.

NY 27 Current Incumbent – Higgens

Population – 700,487

White Black Asian Hispanic
Race 81% 14% 2% 2%
Obama McCain
Old District 54% 44%
New District 57% 41%
Change +3% -3%

Photobucket

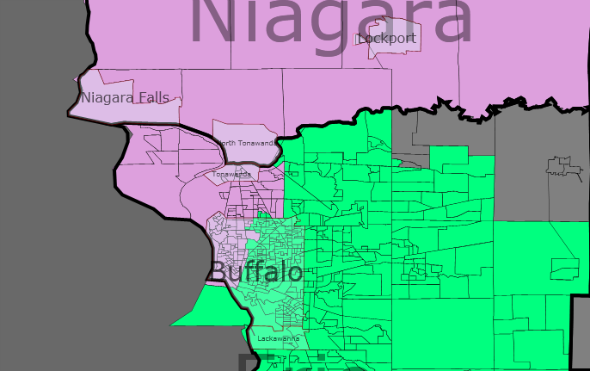
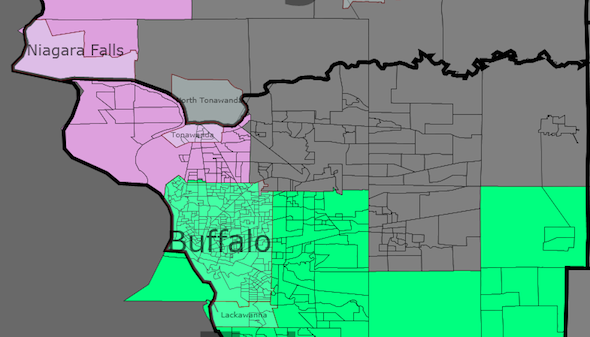
In creating a Republican performing district for Lee, NY 27 is the most immediate beneficiary. NY 27 now is an entirely Erie County district, with the exception of the town of Newstead and parts of Clarence in the Northeast corner (NY 26) and the North and West portions of Buffalo (NY 28).

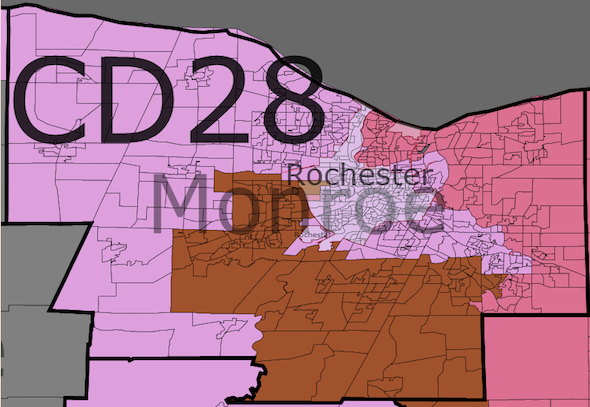
NY 28 Current Incumbent – Slaughter

Population – 699,977

White Black Asian Hispanic
Race 79% 12% 1% 6%
Obama McCain
Old District 68% 30%
New District 57% 41%
Change -11% +12%

Photobucket

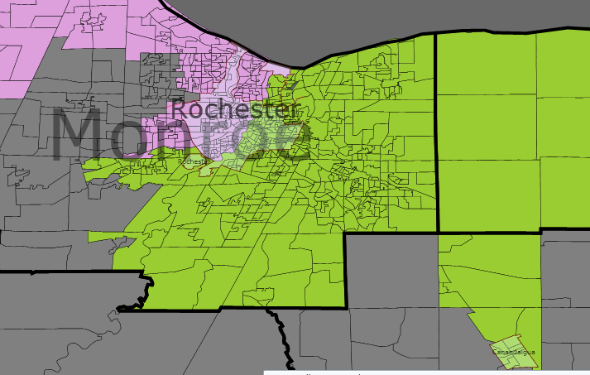
Representative Slaugher's district stays similar in form to her existing district, but includes all of Niagara and Ontario counties and a large portion of Monroe County. The district does include most of Rochester. The Obama performance in the district drops, from 68% to 57%, but a Democrat should remain safe here.

Conclusion

I am proud of the map. Although not every Democratic incumbent may like the map, at least 24 of the 27 current Democratic incumbents will be very safe in every single election. Of the Democratic incumbents, every district gave Obama at least 53% of the vote. The only remaining potential swing districts are NY 1, NY 2, NY 4, NY 23, and NY 25. Of these districts, NY 23 and NY 25 are significantly safer than before, while NY 1, NY 2, and NY 4 are in Democratic leaning areas of Long Island (NY 4 has a significant presence in New York City as well).

I believe that preserving County and City lines are important to the districting process. Communities of interest should not be broken up whenever possible, and I tried to keep towns intact, especially in upstate New York.

To supporters of Representative Massa, I expect that he will succeed Representative Hinchey when he retires.

By what margin will Bob Shamansky win?

View Results

Loading ... Loading ...

Contest Entry: Peter King is Out to Sea

As has been thoroughly discussed in other diaries, New York is likely to lose one House seat in the 2010 census. And given the population trends, the district likely to disappear will be upstate. This presents a problem for Democrats, who now control all but one seat there. If the Democrats keep their monopoly on state government in 2011, they will need to make some uncomfortable compromises: unless a seat is somehow removed from downstate, they will either have to leave one incumbent Democrat without a seat to run in or weaken all upstate Democrats in order to remove Chris Lee. Keeping in mind the pitfalls of the “Dummymander” (PDF), I have made the following choices:

1. To “pair” two upstate Democrats in one seat;

2. To ensure that all downstate seats are safe for current or future Democratic incumbents, including the ones that are not currently safe;

3. To give all but one upstate upstate Democrat a familiar seat that s/he can win;

4. To the extent possible, pack upstate Republican voters in Chris Lee’s seat; and

5. To comply with all contest requirements.

Follow me below the fold for maps, data, and discussion. . .

As a preliminary matter, I will refrain from “hiding the ball” and share overview maps; one for upstate, and another for downstate. In the city especially, districts can be difficult to make out, but I will attempt to clarify below.

Upstate Overview:

Upstate 590

Downstate Overview:

Downstate 590

In general, my discussion will move from west to east, and from upstate to downstate. By no coincidence, this means that higher-numbered districts will be discussed first. We begin, therefore, with western and central New York.

WNY 590

Buffalo 590

Rochester 590

Syracuse


District Population Black% Hispanic% Asian% Obama Votes McCain Votes Obama% McCain% Swing From 2008 Map
28 699,770 13% 5% NA 191,081 130,799 59% 40% R+20%
27 699,850 15% 4% 1% 192,759 123,020 60% 38% D+12%
26 700,982 3% 2% 1% 146,555 172,357 45% 53% R+2%
25 699,439 5% 2% 2% 187,103 154,111 54% 44% R+3%
24 700,615 3% 2% 2% 158,656 136,049 53% 45% D+5%
22 700,635 4% 3% 2% 174,645 147,498 53% 45% R+12%

Who loses?

Eric Massa currently represents NY-29. In a map with 28 districts, there can obviously no longer be one numbered 29, but by no coincidence, on my map there is also no corresponding district. Massa’s Corning home is now in NY-22, which reaches from  the NYC suburbs all the way north to Monroe county and the Rochester suburbs. Maurice Hinchey continues to live in NY-22, and retains most of his political base. However Ithaca is removed and given to NY-24 to strengthen Michael Arcuri. Thus Massa and Hinchey are the two Democratic incumbents I have chosen to pair. My best guess is that Hinchey would retire rather than face this map. I expect that Massa would fare well here. In any case, one of the two must go. For population equity, and (again) to strengthen Arcuri, Dan Maffei’s NY-25 (Syracuse, Wayne, Monroe) is three points more Republican than before. This was one of the more frustrating aspects of my map. However, the district is substantially as it was before, Maffei retains his Syracuse base.

What remains?

From a thousand miles away, it looks as though I have retained the much-derieded “earmuff” district (i.e. NY-28). However, it is substantially different from before. Louise Slaughter retains most of Rochester (i.e. her base) and Niagara falls, but gives up her half of Buffalo. This is sufficient to cause a 20% Republican swing in NY-28. But Neither Slaughter nor her successors should worry: Obama still won the new district 59/40%. In return, Brian Higgins’s NY-27 picks up the rest of Buffalo, and his district swings 12% more Democratic, making it a safe seat. Chris Lee’s NY-26 (Erie, Wyoming, Allegany, Monroe) expands substantially, picking up all of the nasty bits and becoming two points more Republican. I could have made Lee’s district even more Republican, but this would have required (a) touch-point contiguity (not allowed in this contest), or (b) substantially reconfiguring NY-25, NY-24, and NY-23. I considered option (b), but decided against it mainly because I thought there was real value in leaving the cores of existing districts intact. I believe the incumbents would agree. Finally in this region, NY-24. Michael Arcuri had a close call here in 2008. So he gets a district that is 5% more Democratic. To provide for this, I removed the most Republican precincts to the east and added  Ithaca. I would not call the 24th safe, but for Arcuri it should be substantially improved.

We proceed to eastern Upstate:

Albany Troy Schenectady Saratoga


District Population Black% Hispanic% Asian% Obama Votes McCain Votes Obama% McCain% Swing From 2008 Map
23 699,639 4% 2% 1% 146,382 125,538 53% 45% D+3%
21 699,912 6% 3% 2% 183,489 140,360 56% 43% R+5%
20 700,285 4% 3% 1% 176,803 149,128 53% 45% D+5%

(Note that for the sake of space, I will not reproduce images from above).

Who loses?

Paul Tonko’s NY-21 (Albany, Schenectady, Montgomery) becomes 5 points more Republican. However, at 56/43 Obama, it is still reasonably comfortable for him. And in the event, he retains almost all of his former territory. Suffice to say that if Democrats are having trouble in this district, they are likely losing the House of Representatives.

What Remains?

NY-23 (Jefferson, St. Lawrence, Clinton) becomes 3 points more Democratic, and NY-20 (Saratoga, Dutchess) swings 5 points D. Both land at 53/45 Obama. Bill Owens and Scott Murphy both won their special elections in districts that were substantially the same, except more Republican (the 23rd also picks up some Syracuse precincts). If Owens and Murphy cannot win in these districts as I have strengthened them, then one or both should be sacrificed in redistricting. In that respect, 2010 should be revelatory.

The march south continues with a look at NYC’s northern suburbs:

Northern Suburbs

Manhattan Bronx Westchester


District Population Black% Hispanic% Asian% Obama Votes McCain Votes Obama% McCain% Swing From 2008 Map
19 700418 7% 10% 2% 170,996 139,646 54% 45% D+6%
18 700,555 10% 15% 4% 165,531 118,461 58% 41% R+7%
17 700,144 27% 18% 4% 175,408 80,686 68% 31% R+7%

Who loses?

NY-18 takes the greatest hit here, becoming 7 points more Republican, and even reaching down into Long Island. But Nita Lowey has very little to be concerned about. Her Westchester base, though reduced by being parceled out to several surrounding districts, is largely intact. And at 58/41 Obama, it is difficult to imagine a serious Republican challenge. As above, if there’s a tidal wave here, NY-18 is not the first district Dems will need to worry about.

What Remains?

John Hall’s NY-19 (Putnam, Dutchess, Westchester) gets the biggest boost, becoming 6 points more Democratic. It’s probably fair to say that Sue Kelly is out of the running for good. And because the core of Hall’s existing district is retained, he won’t need to worry about unfamiliar and hostile territory. NY-17 does take on some more hostile territory in Sullivan county, but at 68% Obama, Eliot Engel should not lose much sleep.

Finally, we protect Michael E. McMahon and make Peter King walk the plank. Into the city!

Brooklyn

Queens

Nassau

Suffolk 590


District Population Black% Hispanic% Asian% Obama Votes McCain Votes Obama% McCain% Swing from 2008 Map
16 701,167 30% 63% 2% 160,961 8821 95% 5% 0
15 699,479 31% 50% 3% 218,488 13,982 93% 6% 0
14 700,439 6% 14% 13% 217,459 54,510 79% 20% D+2%
13 700,540 9% 13% 12% 108,539 85,063 56% 44% D+14%
12 700,623 12% 49% 10% 168,574 23,627 87% 12% D+2%
9 699,725 8% 21% 18% 130,195 61,300 68% 32% D+25%
8 700,774 3% 10% 10% 192,868 84,698 69% 30% R+9%
7 701,294 14% 40% 14% 141,199 39,762 78% 22% R+3%
5 699,981 4% 22% 23% 135,473 86,728 61% 39% R+5%

The City, Continued:


District Population Black% Hispanic% Asian% Obama Votes McCain Votes Obama% McCain% Swing From 2008 Map
11 700,323 50% 10% 6% 166,981 39,649 80% 19% R+21%
10 700,640 50% 10% 2% 197,163 61,690 76% 24% R+30%
6 701,002 51% 13% 4% 206,280 55,143 79% 21% R+20%
3 700,343 16% 12% 4% 168,982 112,455 60% 40% D+25%
4 700,408 17% 12% 6% 191,113 130,871 59% 40% D+2%
2 700,451 9% 14% 3% 167,660 132,736 56% 44% R+1%
1 699,901 4% 8% 2% 163,358 144,040 53% 47% D+2%

(Note: sorry about the strange table format just above.)

Everything is tied together to some degree here, so I will shift my categorization from above.

Without a doubt, Peter King (NY-3) is the biggest loser. His new district, if you can cal it that, is the purple one that sprawls over my three downstate images from Long Island into Brooklyn. NY-3 is now a 60% Obama district, and probably out of reach for the Republicans (that makes this a 27-1 map). So how did I do it? In a nutshell, I made him walk the plank.

First, I protected the existing white Democrats downstate. Tim Bishop’s NY-1 (Suffolk,The Hamptons) and Carol McCarthy’s NY-4 (Nassau, Hempstead)  both reach out over Long Island Sound into Westchester, but are otherwise substantially the same as before. Gary Ackerman’s NY-5 (Great Neck) is barely changed from before. NY-9 (Queens) is quite strengthened. Whites are now just a plurality, but Weiner keeps his home base, so he should be safe. I made some changes around the edges of NY-2 (Suffolk, Plainview), but nothing that should phase Steve Israel.

Keeping in mind my goal of not disturbing the Democratic incumbents, I at first thought that it might not be possible to sufficiently weaken NY-3 with what was left, considering the accommodations needed for VRA districts. With touch-point contiguity, it would have been a fairly quick job, but without that I had to take some care. The problem is that there are a number of contiguous Nassau and Suffolk precincts that are very white and very Republican. (i.e., King’s base). They would have to be parceled out among the VRA districts, but how? First, NY-11 picks up all of the Republican territory possible in Brooklyn, becoming 21% more Republican. But Yvette Clarke retains here home base and her black majority, so she’s in no trouble.

Now the fun part. NY-10 is still based in Brooklyn and majority black. But it is a whopping 30% more Republican now. How? It reaches across Jamaica Bay into Nassau and Suffolk (I like to think of this as the Republican ferry). Towns is still safe, but King is sunk. Most of the rest of former NY-3’s territory is vacuumed into Greg Meeks’s NY-6 (still black majority and based in Queens, but now reaching accross Nassau to touch Suffolk). NY-3 is thus drawn towards Brooklyn, and more Democrats.

I deal with Staten Island in a similar way. Nadler’s NY-8 retains the Upper West Side (and my present apartment), and hugs a shipping lane near New Jersey to  Raritan Bay and the southern tip of Staten Island. Lots of Republican precincts there go to NY-8, but as you can see from the chart above, Nadler is in no trouble (he also retains his Republican Brooklyn precincts, but he never had trouble there before, so far as I know). NY-13 gets a big boost, taking on much more of Brooklyn. But it’s not so mangled that Staten Islanders are likely to take out blame on Michael McMahon, who now has a solid Obama district.

Wrapping up, NY-14 (the Upper East Side) is much the same, as is NY-12 (Queens, Brooklyn), so Maloney and Velázquez should be happy. In the rest of the city, my no-change-broken-record continues. Crowley’s 7th (Parkchester, Jackson Heights) is sitting pretty. Rangel’s NY-15 is now about 50% Hispanic, but that is because of demographic changes in Harlem, not my fiddling. Serrano’s ultra-Bronx 16th is as it was, and retains the required Hispanic supermajority. All should be pleased with their very familiar districts.

The political trends were in my mind as I drew this map, and to be honest I am still uncomfortable with upstate. But I think there are at least a few solid districts up there, and even if Republicans make gains, they will not be riding back to the majority on this map on the basis of New York wins.

By what margin will Bob Shamansky win?

View Results

Loading ... Loading ...

Contest Entry: 27D-1R New York Redistricting Plan

Upstate New York has trended Democratic quickly over the past decade. Therefore I’m spreading Democratic support thin over Upstate to make only Democratic districts.

However Long Island has trended Republican at the presidential level since 2000. I’m keeping Peter King’s district Republican in order to keep the other Long Island districts safe Democratic. If Long Island becomes more Democratic then Peter King’s district becomes a tossup when he retires. If Long Island becomes more Republican then at least the Democrats on the Island remain safe.


I did not split a single municipality north of Westchester and Rockland Counties except for Buffalo.


I’m sorry the 11th and the 16th are almost the same color.


Please don’t read anything into the colors assigned to the 13th and 14th districts. Those are the colors that automatically get assigned to those numbers, nothing more.

1st District Tim Bishop (D)

Hamptons, Brookhaven

New 54%O 46%M Old 52%O 48%M

82% White, 5% Black, 9% Hispanic, 3% Asian

I removed Smithtown and added some Hispanic parts of Islip to make it more Democratic.

2nd District Steve Israel (D)

Huntington, Babylon, Islip

New 56%O 44%M Old 56%O 43%M

73% White, 9% Black, 13% Hispanic, 3% Asian

These days the south shore of Suffolk County is less Republican then the north shore, so I removed the north shore and added more south shore. I hope I kept Steve Israel’s home in the district. The most Democratic parts of Huntington are still in the 2nd.

3rd District Peter King (R)

Oyster Bay, Glen Cove, Smithtown

New 48%O 52%M Old 47%O 52%M

88% White, 2% Black, 6% Hispanic, 3% Asian

I tried to find the right balance between making the 3rd possible for a Democrat to win when Peter King retires, while keeping the 1st and 2nd as safe as possible for the Democrats.

4th District Carolyn McCarthy (D)

most of Hempstead, some North Hempstead

New 58%O 42%M Old 58%O 41%M

63% White, 17% Black, 13% Hispanic, 5% Asian

This is the only Long Island district with a sizable minority population, almost enough for a black or Hispanic candidate to have a chance. The northern protrusion is so that the 5th district reaches Gary Ackerman’s home in Mineola. The eastern protrusions are to take either minority or extremely Republican parts out of the 3rd.

5th District Gary Ackerman (D)

Flushing, Floral Park, North Hempstead

New 62%O 37%M Old 63%O 36%M

51% White, 5% Black, 14% Hispanic, 27% Asian

The loss of a district Upstate can already be felt in the 5th district. It has more Queens and less Nassau than before. Pretty soon it will be possible to make an Asian majority district in Queens.

6th District Gregory Meeks (D)

Jamaica, Ozone Park, Far Rockaway

New 86%O 14%M Old 89%O 11%M

17% White, 50.2% Black, 17% Hispanic, 7% Asian

It’s still the black district in southern Queens. It expanded west to take some Republican territory from Anthony Weiner.

7th District Anthony Weiner (D) (Old 9th)

Brighton Beach, Sheepshead Bay, Ridgewood, Forest Hills

New 61%O 38%M Old 55%O 44%M

55% White, 7% Black, 21% Hispanic, 14% Asian

It still has the same 2 far-apart population centers. It loses its Hasidic Jews and gains more of Queens.

8th District Edolphus Towns (D) (Old 10th)

Williamsburg, Bedford Stuyvesant, East New York, Canarsie

New 94%O 6%M Old 91%O 9%M

8% White, 66% Black, 20% Hispanic, 2% Asian

Probably the blackest district in America. Yet it borders another black-majority district and is only block away from another black-majority district.

9th District Yvette Clarke (D) (Old 11th)

Park Slope, Crown Heights, Flatbush

New 91%O 9%M Old 91%O 9%M

27% White, 51% Black, 14% Hispanic, 5% Asian

I removed the panhandle from the Towns district so it would be more compact. As a result the Clarke district barely has a black majority. But it’s good enough.

10th District Michael McMahon (D) (Old 13th)

Staten Island, southwest Brooklyn

New 51%O 48%M Old 49%O 51%M

68% White, 9% Black, 12% Hispanic, 9% Asian

The border between the 10th and 12th districts is the only ugly political gerrymander in this map. (The 11th is an ugly racial gerrymander.) The Brooklyn part of this district gave Obama 62% of the vote. Also keep in mind that a Staten Island Democrat has at least a 5 point advantage here over a presidential Democrat, so Michael McMahon should be safe.

11th District Nydia Velazquez (D) (Old 12th)

Sunset Park, Lower East Side, Chinatown, Bushwick, South Corona

New 85%O 14%M Old 86%O 13%M

14% White, 7% Black, 54% Hispanic, 22% Asian

The existing 12th is a Hispanic district, and it also seems to be an Asian district, so I added more of both groups, and extended it into north Queens.

12th District Jerrold Nadler (D) (Old 8th)

Upper West Side, west Midtown, Lower West Side, extremely Republican parts of Brooklyn

New 69%O 30%M Old 74%O 26%M

76% White, 3% Black, 9% Hispanic, 9% Asian

The extremely republican Hasidic parts of Brooklyn had to get buried somewhere. I could have buried them in the black districts but I decided it would be better for race relations to give them to a white Jewish Democrat. The Manhattan part of the district is almost completely unchanged.

13th District Carolyn Maloney (D) (Old 14th)

Upper East Side, east Midtown, Long Island City, Greenpoint

New 79%O 20%M Old 78%O 21%M

69% White, 4% Black, 13% Hispanic, 10% Asian

I added Greenpoint (northern point of Brooklyn) because Greenpoint is turning into another rich gentrified neighborhood. Besides that, it’s mostly unchanged.

14th District Charles Rangel (D) (Old 15th)

Harlem, some Upper West Side

New 93%O 6%M Old 93%O 6%M

16% White, 31% Black, 48% Hispanic, 3% Asian

Everything north of 96th street on the east side and 90th(?) street on the west side. And also Rikers Island. I decided it’s more important to make the district geographically compact (Manhattan only) than to add more black population by trading precincts with a Bronx district.

15th District Jose Serrano (D) (Old 16th)

South Bronx

New 95.0%O 4.8%M Old 94.8%O 5.0%M

2% White, 31% Black, 63% Hispanic, 2% Asian

This has the distinction of being the most Democratic district in America. I did my best to keep it that way.

16th District Joseph Crowley (D) (Old 7th)

East Bronx, Astoria

New 84%O 16%M Old 79%O 20%M

24% White, 30% Black, 35% Hispanic, 7% Asian

Renumbered 16th because it’s now a Bronx district not a Queens district (thus forcing me to renumber so many other districts). I hope it still includes Crowley’s home in Woodside, it’s hard to tell.

17th District Eliot Engel (D)

Riverdale, Mount Vernon, Ramapo

New 63%O 37%M Old 72%O 28%M

58% White, 17% Black, 18% Hispanic, 5% Asian

It’s not as Democratic as before because it loses black parts of the Bronx and gains Republican parts of Orange County.  But it’s still safe Democratic.

18th District Nita Lowey (D)

New Rochelle, White Plains, Mount Pleasant

New 61%O 39%M Old 62%O 38%M

71% White, 8% Black, 14% Hispanic, 5% Asian

The Westchester district didn’t change much.

19th District John Hall (D)

Peekskill, Middletown, Newburgh, Ploughkeepsie

New 53%O 46%M Old 51%O 48%M

78% White, 8% Black, 10% Hispanic, 2% Asian

It gets pushed further upstate. Fortunately gaining northern Orange County and Ploughkeepsie makes it more Democratic.

20th District Maurice Hinchey (D) Old 22nd

New Paltz, Woodstock, Hudson, Albany suburbs

New 55%O 44%M Old 59%O 39%M

89% White, 4% Black, 4% Hispanic, 1% Asian

This district now includes several Hudson Valley counties instead of a finger into Ithaca.

21st District Paul Tonko (D)

Albany, Troy, Schenectady

New 56%O 42%M Old 58%O 40%M

87% White, 7% Black, 3% Hispanic, 2% Asian

It still has Tonko’s home in Montgomery County and it picks up Republican territory in Fulton, Saratoga, and Rensselaer Counties.

22nd District Scott Murphy (D) Old 20th vs Bill Owens (D) Old 23rd

Watertown, Plattsburgh, Saratoga Springs

New 53%O 46%M Old 20th 51%O 48%M, Old 23rd 52%O 47%M

93% White, 3% Black, 2% Hispanic, 1% Asian

All of Democratic northern rural New York gets packed into 1 district. It’s only 53% now but expect it to continue trending Democratic into the future. I decapitated Herkimer for aesthetic reasons. Unfortunately Murphy and Owens can’t both be Congressman in 2013 but I’m sure they saw this coming when they ran.

23rd District Michael Arcuri (D) Old 24th

Utica, Ithaca, Binghamton

New 54%O 45%M Old 51%O 48%M

90% White, 3% Black, 2% Hispanic, 2% Asian

Made safer by adding Ithaca and Binghamton and removing most of Oneida County.

24th District Dan Maffei (D) Old 25th

Syracuse, Rome, Oswego

New 55%O 45%M Old 56%O 43%M

88% White, 6% Black, 2% Hispanic, 1% Asian

The Syracuse district buries extremely-Republican northern Oneida County. It shifted east because Western New York lost a lot of population and its districts are expanding.

25th District Eric Massa (D) Old 29th

Webster, Brighton, Corning

New 50%O 49%M Old 48%O 51%M

92% White, 3% Black, 2% Hispanic, 1% Asian

This November Eric Massa will hopefully get reelected by a significant margin. This plan then makes his district more Democratic, so he will be able to keep getting reelected. The district includes most of Massa’s original district, and the rest is currently represented by Dan Maffei and Michael Arcuri. If this district becomes open then it’s a tossup, so I’m counting on Massa to keep running for reelection.

26th District Louise Slaughter (D) Old 28th

Rochester, Greece, Batavia

New 55%O 44%M Old 69%O 30%M

78% White, 14% Black, 5% Hispanic, 1% Asian

No more earmuffs! This district includes the entire city of Rochester, its suburbs to the west, and 4 rural conservative counties. Louise Slaughter’s home isn’t in the district, and drawing her in would weaken the Massa district too much. But it’s still Slaughter’s district.

27th District Chris Lee (R) Old 26th

Buffalo, Amherst, Niagara Falls

New 55%O 43%M Old 46%O 52%M

87% White, 8% Black, 2% Hispanic, 2% Asian

There’s a fine line between increasing a city’s influence by putting it in more Congressional districts, and decreasing a city’s influence by spreading it too thin over too many districts. I hope I did the former, not the latter. Chris Lee, an unremarkable Republican, will now have to face reelection in a 55% Obama district.

28th District Brian Higgins (D) Old 27th

Buffalo, Lackawanna, Olean

New 54%O 45%M Old 54%O 44%M

84% White, 10% Black, 4% Hispanic, 1% Asian

Brian Higgins gains some more black parts of Buffalo, and also gains some rural conservative counties. This makes the district as Democratic as it was before, just bigger.