SSP Daily Digest: 1/19

FL-Sen: With everyone fixated on the three retirements in the Senate in the last week (although the Fix makes the good point this morning that by this point in the 2010 cycle, there had already been four retirements), Bill Nelson seems compelled to point out that he won’t be one of them. In front of as many reporters as possible (at an AP gathering), he confirmed today that he’s running again.

MO-Sen, MO-06: Wow, this is out of nowhere (although I’m not sure whether this is going to have any legs beyond today), but potentially very interesting: Republican Rep. Sam Graves is suddenly expressing some interest in the Senate race, calling it a “great opportunity.” He’s been in the House since 2000 and is chair of the Small Business Committee, so giving that up would be a big move. He may be seeing the diminished likelihood of a Jim Talent run and sensing there’s room for another establishmentarian-type candidate to go against the more tea-flavored Sarah Steelman. (This would open up MO-06 in the state’s rural northwest, which was Dem-held before Graves but has shifted to the right, currently R+7; Dems tried to make it competitive in 2008 and didn’t get any traction.)

ND-Sen: Ready for a whole lot of names of people who might run for Senate? In fact, let me just blockquote the Bismarck Tribune, rather than transcribing it laboriously:

The list of Republicans whose names are being thrown out include Gov. Jack Dalrymple, Lt. Gov. Drew Wrigley, Rep. Rick Berg, Attorney General Wayne Stenehjem, Tax Commissioner Cory Fong, Public Service Commissioners [Brian] Kalk and Kevin Cramer, Sen. John Hoeven’s state director Shane Goettle, GOP state treasurer Bob Harms, and Great Plains Software developer Doug Burgum.

As for Democrats, names circulating include both [ex-state Sen. and radio host]Joel and [ex-AG] Heidi Heitkamp, former state Sen. Tracy Potter, USDA Rural Development Director Jasper Schneider, state Sen. Mac Schneider, U.S Attorney Tim Purdon, Conrad’s state director Scott Stofferahn and former Byron Dorgan staffer Pam Gulleson, former agriculture commissioner Sara Vogel, former state Rep. Chris Griffin, State Sen. Tim Mathern of Fargo, Senate Minority Leader Ryan Taylor and even Earl Pomeroy.

The Bismarck Tribune article also gets a number of these people on record, although their comments are all various degrees of noncommittal. Kent Conrad tipped his hand a bit yesterday, giving nods in the Grand Forks Herald to both Heitkamps, as well as to Schneider. One other Dem who got mentioned a lot yesterday, Roger Johnson (the president of the National Farmers Union) has already said he’s not interested. And in what’s not a surprise, the Tea Partiers aren’t happy with anyone of ’em (although some had some words of praise for Berg), but are still promising to “battle for control.”

VT-Sen: It looks like Republican state Auditor Tom Salmon’s Facebook attacks on Bernie Sanders weren’t just the work of a bored guy at work but, as many speculated, part of a coordinated plan to move toward a run against Sanders; he’s now publicly saying that he he’s interested in the race. Color me puzzled: why would Salmon (who was a Democrat until a year and a half ago) go after an entrenched institution like Sanders in 2012 when he could run for Gov. against Peter Shumlin, who’s just getting situated and won by only a narrow margin in 2010?

KY-Gov: This one gets filed straight to the Department of Foregone Conclusions, but it was made official today: Republican state Sen. president David Williams and Ag Comm. Richie Farmer filed their candidacy papers today, to go up against incumbent Dem Steve Beshear in November.

WV-Gov: We’re getting some pushback/clarification from Shelley Moore Capito’s team regarding claims from gubernatorial candidate Betty Ireland that she wasn’t going to run for Governor; a spokesperson says the only thing that’s off the table is a run in the special election for Governor (which we know now will be held this November). She’s still open to a bid for either Governor or Senate in 2012. Dave Catanese also wonders whether Capito’s timeline is a little longer, i.e. a 2014 run against Jay Rockefeller (or for his open seat, if he retires, seeing as how he’ll be 77 then). It’s also looking like the candidates for November’s special election will be picked by primary rather than by the parties; acting Gov. Earl Ray Tomblin, who was the main impediment to a 2011 election until yesterday’s supreme court ruling, says he’s working with SoS (and likely Dem primary opponent) Natalie Tennant to set special primaries in motion.

NY-13: Ex-Rep. Mike McMahon seems to be laying groundwork for a rematch against Mike Grimm, who defeated him narrowly in 2010. He reached out to members of the Staten Island Democratic Association at a meeting last night.

OR-01: Rep. David Wu has always struck people as a little odd (many of you probably remember his Klingons speech), but it seems like something has intensified lately, and it’s starting to come out in the open. It’s been revealed that in the last few months, he’s lost a number of his key staffers amidst complaints about his public behavior, including his chief of staff (who left to join a Rep. with less seniority) and his communications director (who left without having another job lined up, which is even more highly unusual, especially in this economic climate). This chief fundraiser and chief pollster also say they don’t plan to work with him any longer. This is a D+8 district with a robust Dem bench, which is good because this may be a difficult story for Wu to shake, especially given general rumblings of discontent with him that have been building over time.

Mayors: Philadelphia mayor Michael Nutter looks like he’s in good shape for his 2011 re-election, according to a new poll from Municipoll. Nutter’s at 47-39 against Generic D primary opponent, wins a three-way primary against Bill Green and Anthony Williams 46-21-18, and wins a three-way against Sam Katz and Williams 44-22-21. Interestingly (though consistent with the original coalition that elected him), Nutter has stronger support among whites (64% favorable) than he does among African-Americans, at 45%. (Nutter is black.) Nutter also just secured the support of the Laborers union. Even further down the weeds in Philly, Republican state Rep. (and, briefly, former speaker) Dennis O’Brien will run for a vacant city council seat in NE Philly. That’s good news, because it might free up his state House seat and make any Dem attempt to retake the state House in 2012 easier, seeing as how his seat is one of the most Dem-leaning seats held by a Republican.

Minnesota: Two stories developing in Minnesota; one, the legal battle over 2012 redistricting has already begun, with Minnesota its first flashpoint. With the GOP controlling the legislature (but not the governorship), Dems have filed a suit seeking an injunction requiring legislators to submit proposed redistricting plans directly to the court (where they’ll probably wind up anyway, regardless of how this suit goes). Also, Minnesota GOP legislators are seeking to emulate their next-door neighbors in Wisconsin in making it more difficult to vote, seeking to push a voter ID bill.

Redistricting: You may remember some Republican laments from a few days ago about the apparent failure of their MAPS program to raise the money needed to coordinate redistricting at a national level; those fears seem to be spreading, including to ex-Rep. Tom Reynolds, who’s spearheading the process for the GOP this year. Part of the problem seems to be that they spent so much money winning control of state legislatures in November that nothing was reserved for coordinating the subsequent redistricting. Nathan Gonzales also previews how state legislators from both parties are currently hunkering down in Washington learning (since many weren’t in office in 2000) the redistricting process from the ground up; in particular, they’re learning the new technologies (like GIS programs like Maptitude), which obviously have come a long way since the last round of redistricting.

Census: Hats off to the Census Bureau, who, just in time to go with their upcoming onslaught of 2010 data, have launched a new and improved version of American FactFinder (the main research tool on their site), a significant improvement over the rather clumsy and unintuitive existing version. I wouldn’t go so far as to call the new version intuitive either, but it makes multi-variable searches and customized maps much easier.

Georgia w/ 6 VRA seats

OK, so the recent thread on potential VRA seats in South Carolina has got me thinking about other Southern states. Leaving aside Texas & Florida, which are special cases in my view, the most obvious candidate seems to be Georgia as it also gained a seat for this redistricting cycle.

In short, I wanted to see whether I could increase the number of compact minority-majority seats. As an initial (somewhat crude) effort, the following map features six.

One thing I’ve realized, having made this map, is that the apparent conventional wisdom that Georgia’s 14th seat will be a heavily Republican seat north of Atlanta may very well be incorrect. It’s quite easy to draw a fairly compact minority-majority seat north of GA-04 & GA-05, and I’d say a strong argument could be made that the VRA would require as much.

Whether it would require that GA-12 become a bare majority-minority district as in my map below is another matter. Anyhow, more after the fold!

Below I’ve posted a statewide map and a close-up of the Atlanta region. The following districts on this map are majority-minority.

Downstate:

GA-02: 51% minority (45% Black – 4% Latino)

GA-12: 51% minority (46% Black – 2% Latino)

Atlanta Metro:

GA-04: 72% minority (56% Black – 10% Latino)

GA-05: 67% minority (53% Black – 10% Latino)

GA-13: 64% minority (52% Black – 8% Latino)

GA-14: 54% minority (22% Black – 20% Latino)

The usual caveat applies that my maps are only as good as the data at Dave’s app.

Here are the maps:

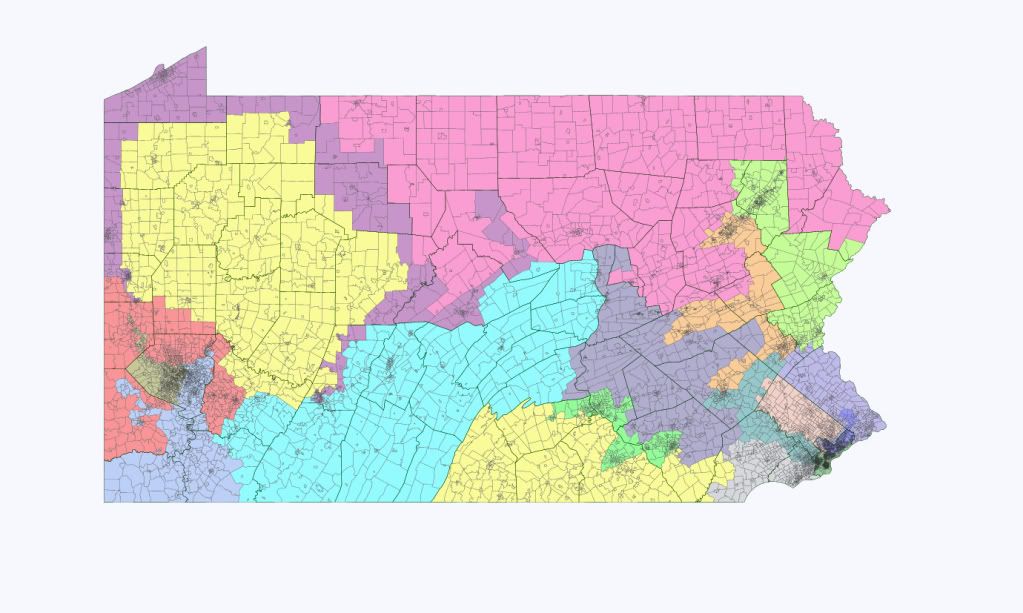
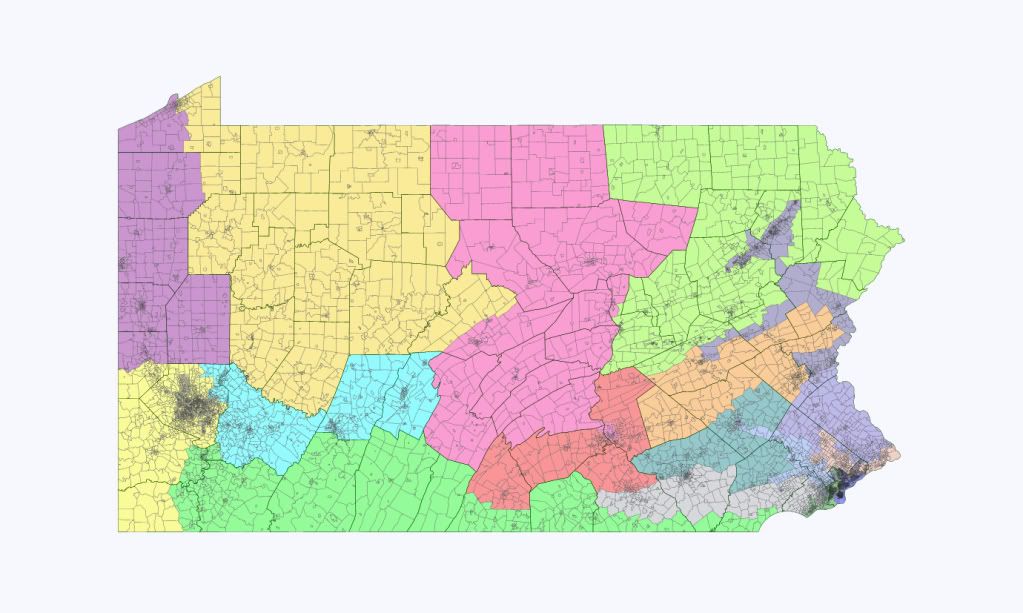
12-6 Democratic Pennsylvania Gerrymander

Last week, I looked at why a 12-6 Republican map was most likely.  This week, I’ll take a look at the converse – a 12-6 Democratic map.  

Although a pretty heavily Democratic state, it is hard to create enough safe seats for Democrats in Pennsylvania.  The reason is most Democratic votes are concentrated in Philadelphia.  Under the strictest interpretation of the VRA, it may be required to keep PA-1 majority-minority, and PA-2 majority black.

For Pennsylvania, I’d argue that a safe Democratic seat needs a PVI of D+5.  This is because the Republicans have been successful at holding down one D+4 seat all decade.  It was hard to draw all the eastern suburban districts to meet D+5 and maintain the two Philadelphia districts as listed above, but after some work, I came up with a good map. Two democratic districts have a lower PVI than this because they are outside of the region, but are as Democratic as the situation allowed.

I didn’t pay particular attention to the location of Democratic incumbents, quite honestly.  This map opens a lot of opportunities for Democrats, which I think outweighs any potential issues.  

Details below

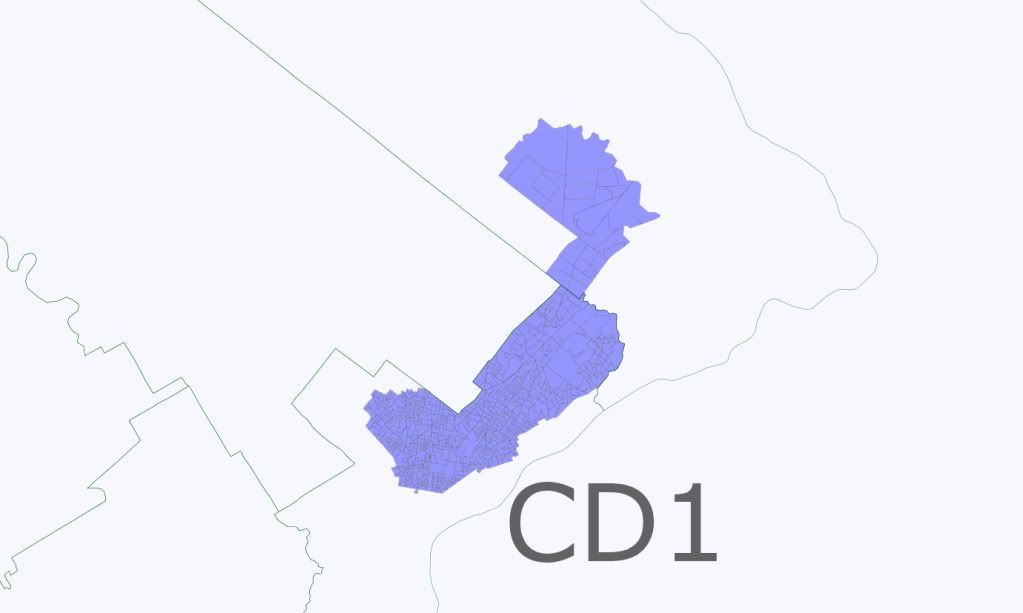
PA-1

Majority-Minority (46% white – forgot to write down non-white breakdown)

76% Obama, 24% McCain (D+22)

This district swings dramatically to the North, taking in somewhat swingy parts of northeast, and with an arm going into Bucks county to take in some Republican-leaning suburbs.  Bob Brady doesn’t live here.  

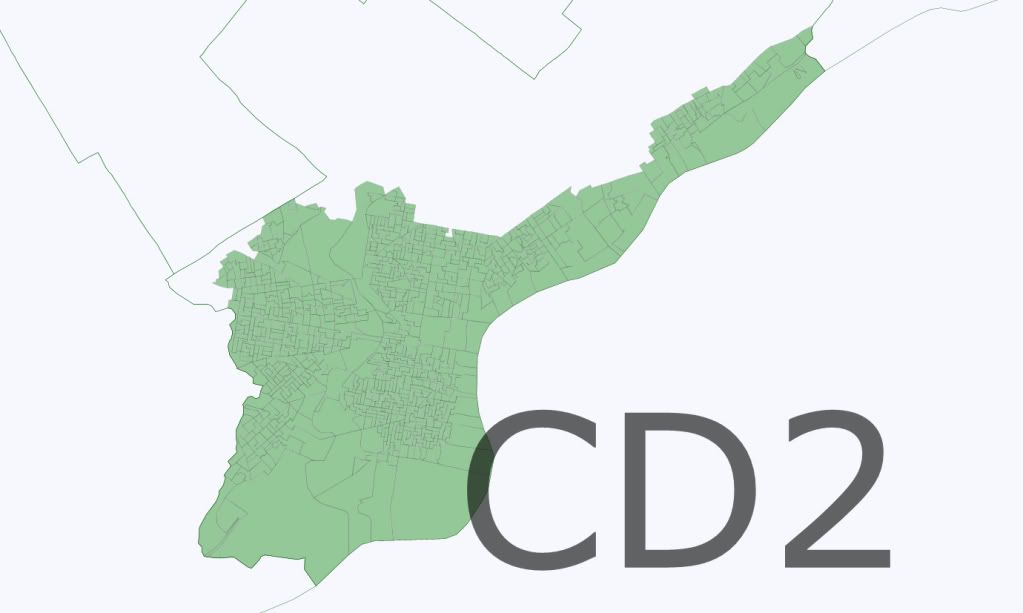
PA-2

Majority black (51%)

87% Obama, 13% McCain (D+33)

The district becomes based in south Philadelphia, and takes in some more Republican-leaning areas of the city.  It’s still pretty Democratic however.  Unfortunately, there are no lily-white highly Republican areas nearby I could have swapped in.  

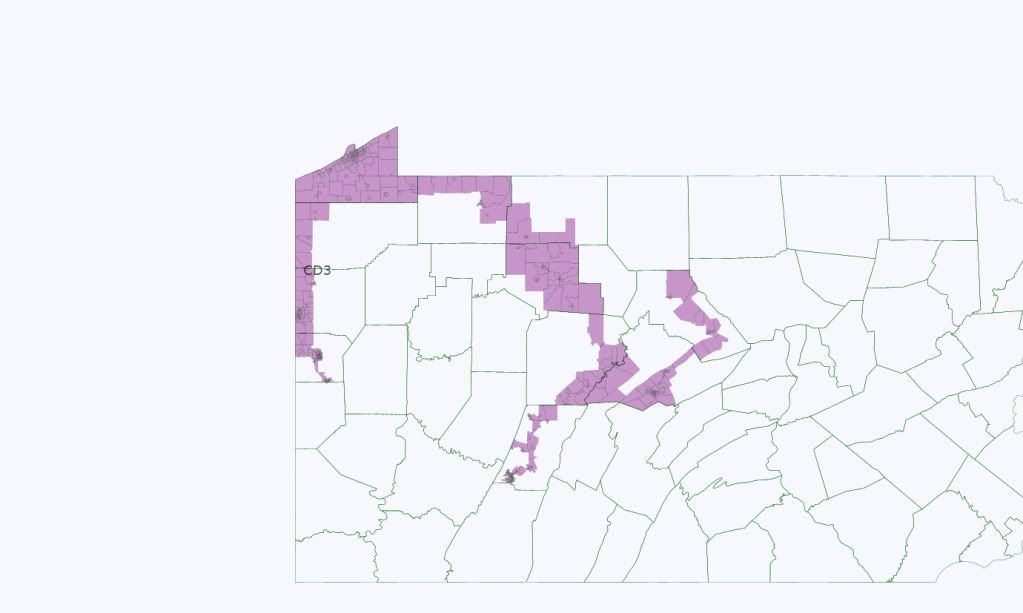
PA-3

58% Obama, 42% McCain (D+4)

One ugly district which draws in all the Democratic areas in the northwest and central portions of the state (State College, Johnstown, Erie, New Castle, Hermitage, etc).  This was the best PVI that could be managed for the district without poaching on PA-14 to some degree (which I wanted to avoid).  It should still elect a Democrat comfortably, given the PVI is calculated by Obama votes only, and he actually underperformed Kerry in certain parts of the district.  That said, given the rightward drift of much of the region, I wouldn’t be surprised if the PVI becomes closer by the end of the decade.  Still, Erie and State College are not turning to the right, so it’s hard to see the PVI slipping to less than even.  Call it a Lean D seat.  

PA-4

59% McCain, 41% Obama (R+13)

This is the first of the Republican voter sinks, drawing in most of the Republican areas in metro Pittsburgh.  Technically, Jason Altmire is the incumbent here, but he might want to move to PA-14 (which is now vacant) which should be a safe seat for him.  No Republican congressmen lives in the district, but it has a good deal of Tim Murphy’s old district, so he may decide to relocate.  

PA-5

60% McCain, 40% Obama (R+14)

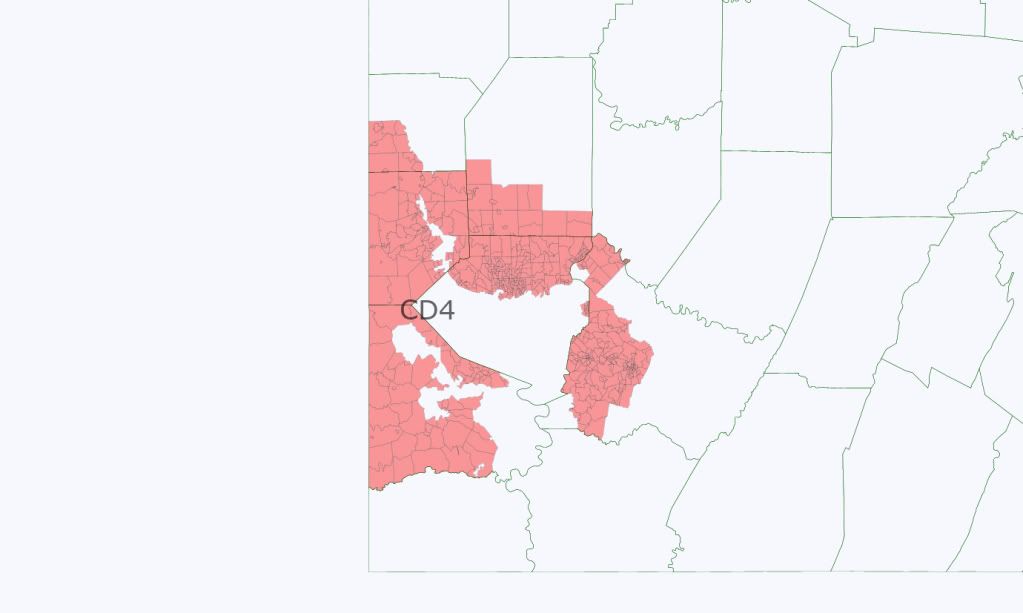
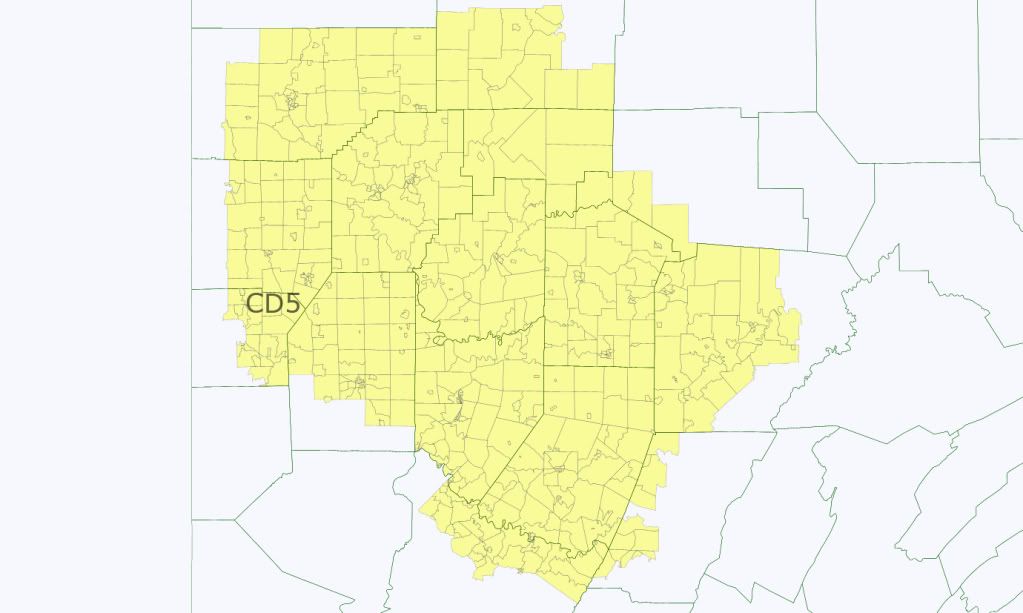
This district absorbs Republican votes across a huge swath of Western Pennsylvania.  Mike Kelly lives here (barely), and he’d be wise to run for this seat.  

PA-6

59% Obama, 41% McCain (D+5)

The district is made more Democratic by a hair than Jim Gerlach’s old district.  While it might not defeat him immediately, given the trends of the region, along with the close elections he faced in 2004 and 2006, he should lose the seat within two or three election cycles.  

PA-7

59% Obama, 41% McCain (D+5)

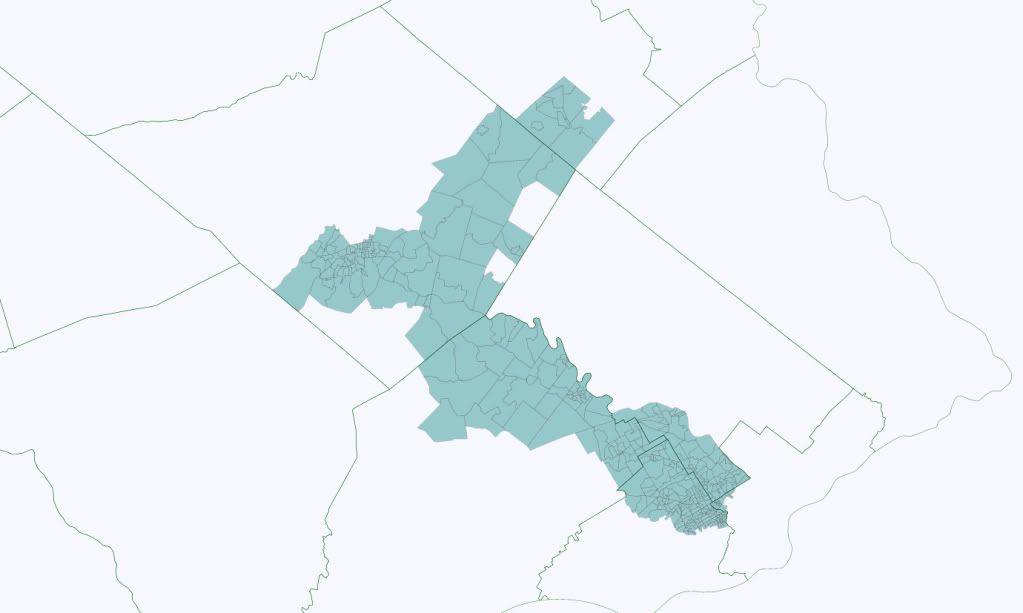
The district draws in Democratic and heavily-black areas like Chester and Yeadon.  Joe Pitts lives here, but it is much less Republican than his old district, so he will likely be forced into retirement.  Pat Meehan lives just outside of the district now, in PA-6.  Given he’s a freshmen and dealing with a bigger swing than Gerlach, I’d say he’ll lose the seat immediately if he ran.    

PA-8

59% Obama, 41% McCain (D+5)

The district is made more Democratic by including some heavily-Democratic parts of Cheltenham and north Philadelphia.  Mike Fitzpatrick’s days are numbered.  

PA-9

63% McCain, 37% Obama (R+17)

Republican vote dump for the central Pennsylvania.  Bill Schuster is welcome to this seat.  

PA-10

58% McCain, 42% Obama (R+12)

This is the least Republican of their six planned seats, mainly because the eastern half of the district is pretty uniformly only narrowly Republican.  Still, it’s a boost for Tom Marino, or Lou Barletta – whoever wins the primary.  

PA-11

59% Obama, 41% McCain (D+5)

This district sheds much of the Wilkes-Barre area and instead takes on most of Northampton County, spitting Charlie Dent’s base in half.  It should be a safe district for the right sort of Democrat.  

PA-12

59% Obama, 41% McCain (D+5)

The district is somewhat reconfigured.  It continues to contain the more heavily-Democratic areas of rural southwestern PA down the mon valley, but also picks up Pittsburgh’s eastern suburbs, along with a few neighborhoods of Pittsburgh itself.  Mike Doyle lives here, so I’m guessing he runs for this district rather than PA-14, which is only marginally more Democratic.  

PA-13

59% Obama, 41% McCain (D+5)

Allyson Schwartz’s district becomes a little less Democratic, and becomes more exclusively focused on Montgomery county.  She should hold down the slightly more swingy district with little trouble.  

PA-14

61% Obama, 39% McCain (D+7)

The new PA-14 still contains most of Pittsburgh, but draws in swingy and Republican suburbs in the South Hills, and Democratic areas in Beaver County.  I resisted attempting to even the PVI of this and PA-12 to D+6, because there was no way to do so without putting even more of Pittsburgh into the 12th, to minimal effect.  No incumbent, but Jason Altmire would be smart to relocate here, and immediately position himself to the left.  

PA-15

59% Obama, 41% McCain (D+5)

Charlie Dent loses over half his base, gets a slightly more Democratic district, and gets Tim Holden (and a fair portion of his old base) drawn into it.  He’s toast.  

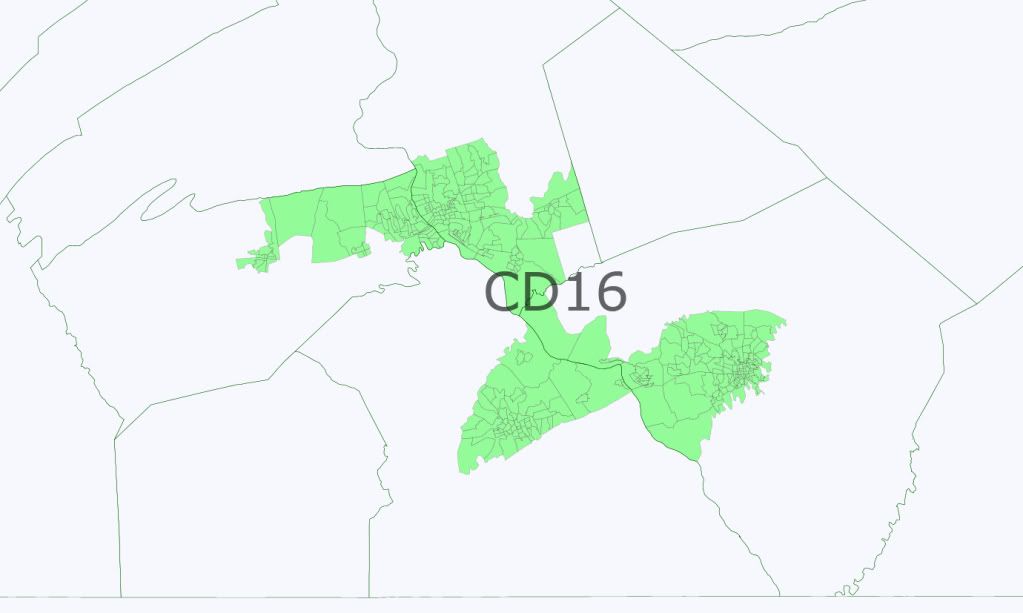
PA-16

55% Obama, 45% McCain (D+1)

All of the most democratic parts of York, Lancaster, and Dauphin counties are drawn into one district.  The PVI is close enough there is no guarantee that the district will elect a Democrat.  Indeed, PA-19’s Todd Russel Platts (who lives in York), is somewhat moderate and a good fit for the district ideologically).  The district will only be getting bluer however, as minority immigration to York and Lancaster has been quite high.  Thus it should be safely Democratic by the end of the decade – or sooner if an open seat.  

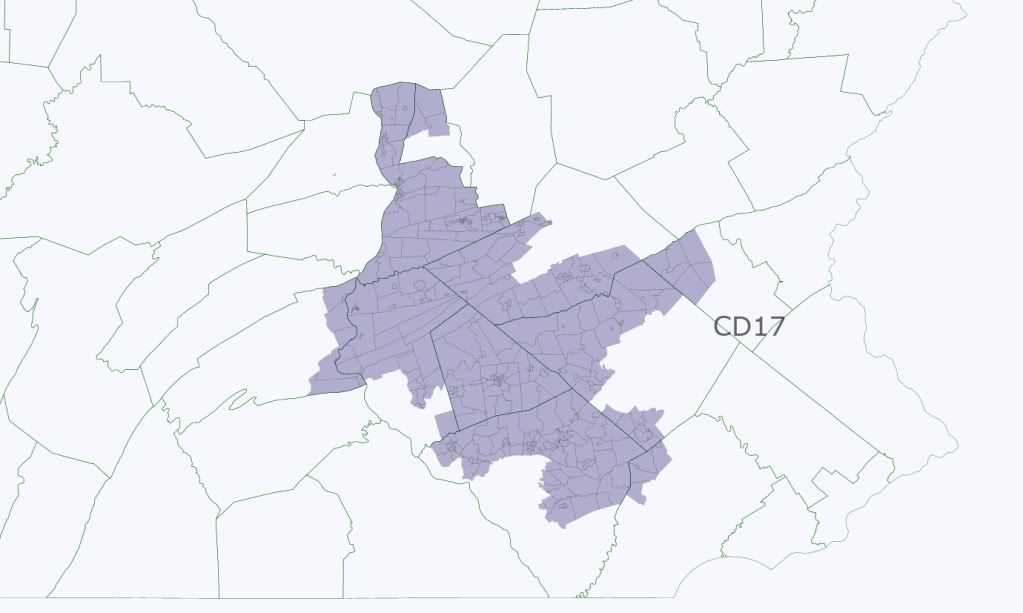
PA-17

61% McCain, 39% Obama (R+15)

An open Republican seat consisting of mainly the northern reaches of Pennsylvania Dutch Country and some mountains.  The bulk of the district was actually represented by Tim Holden previously, and not only does no Republican incumbent live there, but none even represented a large portion.  I’m unsure who would choose to run here.  

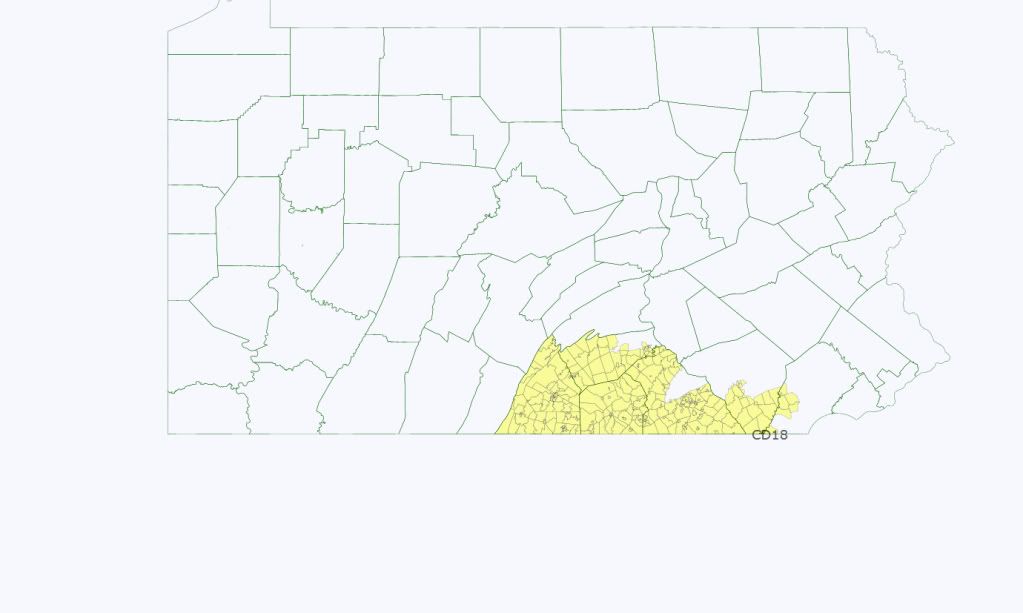
PA-18

63% McCain, 37% Obama (R+17)

The remainder of Pennsylvania Dutch country.  Again, there is no Republican incumbent, although theoretically both Joe Pitts and Todd Russel Platts may show some interest in the district.

Later, I’ll show my compact redistricting plan for the state.  Thoughts?    

Hyper-partisan Democratic Texas Gerrymander

A hyper-partisan Democratic gerrymander of Texas.  Probably not VRA compliant and Texas might even have some laws against such whacked-outness.  However when drawing hyper-partisan maps I like to take “screw the other party over as much as possible and forget the law” approach.  This another full Texas map, the first I drew was before partisan data was available.

The two crowning achievements of this map are the three Democrats out of Travis County (City of Austin), which is something I posted earlier and worked to further perfect, and six Democrats out of Harris County (City of Houston).  

Every Republican seat is a major vote sink, only 4 of the 14 GOP seats are less than 70% McCain.  Which means there are 10 seats that are R+24 or higher including what would be the most Republican district in the country at R+30.

For the sake of classifying districts 59% Obama and higher are labeled as Safe D, 56-58% is Likely D and <56% is Lean D.  There is only one district that is less than 56% Obama than isn’t a GOP vote sink.

Overall this is a 22-14 Democratic Map with one district that could be won by the GOP in a wave year.  So I think the worst case scenario for the Dems would be 21-15

District 13

Obama 23%

McCain 76%

69% White, 6% Black, 22% Hispanic

The most Republican district in the state and probably the most conservative in the country.  Interestingly enough despite being a R+30 district it is 22% Hispanic.

Safe R

District 17

Obama 26%

McCain 73%

67% White, 5% Black, 26% Hispanic

A R+27 West Texas District that is 26% Hispanic.  Includes the cities of Midland, Odessa and San Angelo.

Safe R

District 19

Obama 27%

McCain 72%

67% White, 6% Black, 25% Hispanic

This is a third West Texas district that is over 20% Hispanic.  That definitely doesn’t help in this district.  Includes the cities of Abilene and Lubbock

Safe R


District 4

Obama 31%

McCain 68%

81% White, 8% Black, 8% Hispanic

North East Texas and part of Collin County

Safe R

District 5

Obama 28%

McCain 71%

76% White, 13% Black, 9% Hispanic

Tyler-Longview based district for Louie Gohmert.  Hey we got to keep the most entertaining Republicans right!

Safe R

District 8

Obama 26%

McCain 73%

81% White, 4% Black, 11% Hispanic

Includes most of the very fast growing Montgomery County.

Safe R

District 11

Obama 28%

McCain 71%

74% White, 8% Black, 14% Hispanic

This is my favorite GOP vote sink based on unattractiveness.  It gets all the Republican vote that would have ended up jeporadizing district 10, 31 and 9 if no counties were split.

Safe R

District 14

Obama 29%

McCain 70%

73% White, 6% Black, 17% Hispanic

Another GOP vote sink near Houston.  

Safe R

District 25

Obama 27%

McCain 72%

78% White, 13% Black, 8% Hispanic

East Texas GOP district.  

District 35

Obama 26%

McCain 73%

78% White, 6% Black, 11% Hispanic

Like the rest of the GOP districts, another vote sink carefully drawn.

District 16

Obama 59%

McCain 40%

24% White, 3% Black, 70% Hispanic

Most of El Paso but I also used 16 to grab some of the more Republican counties from district 23 in order to help make 23 more Democratic.

Safe D

District 23

Obama 55%

McCain 44%

27% White, 2% Black, 69% Hispanic

Shedding some of the more Republican counties and picking up part of Southern El Paso shifts this district 4 points towards the Democrats compared to it’s previous 51% Obama/48% McCain breakdown.  In 2010 Conseco beat Rodriguiz by 5 points.

Lean D

District 36

Obama 29%

McCain 70%

80% White, 2% Black, 16 Hispanic

Contains a decent amount of Lamar Smiths current district including the conservative parts of North Bexar County.

Safe R  

District 15

59% Obama

40% McCain

19% White, 1% Black, 78% Hispanic

Most of McAllen and the most Republican parts of Corpus Christi are here.  

Safe D

District 27

Obama 58%

McCain 41%

22% White, 2% Black, 74% Hispanic

Solomon Ortiz’s loss to Blake Farenthold was definitely a sign of a GOP wave.  The old district 27 was 53%/46%.  I would want to rate this district Safe D since Farenthold won by 1 point and the shift by 5 probably would have safed Ortiz, but I’d be breaking break my own rules.

Likely D

District 28

Obama 59%

McCain 41%

19% White, 3% Black, 76% Hispanic

This district shifts a few more points Democratic from his current 56%/43% district.  It was difficult to get a good image capture of this district since it is drawn like it is.

Safe D

District 20

Obama 58%

McCain 41%

30% White, 5% Black, 61% Hispanic

I tried so hard to get two 59% Obama districts in San Antonio and just couldn’t do it.  58% is really close and as much as I want to label this a safe D district I can’t since my intro says 59% will be considered a safe D district.

Likely D

District 21

Obama 58%

McCain 41%

33% White, 10% Black, 54% Hispanic

Eastern San Antonio and southern Bexar county.  

Likely D


I would have zoomed in more but that would have cut off several of the districts originating from Houston.

District 2

Obama 59%

McCain 40%

36% White, 26% Black, 33% Hispanic

Very Democratic part of North Houston and the Democratic parts of Huntsville in East Texas

Safe D

District 7

Obama 59%

McCain 40%

35% White, 24% Black, 30% Hispanic, 11% Asian

District 9

Obama 59%

McCain 41%

38% White, 27% Black, 23% Hispanic, 12% Asian

Stretches from Galveston up into Brazos County, most of the Democratic vote is in Fort Bend.  Interesting note is this district is 12% Asian

Safe D

District 18

Obama 59%

McCain 40%

39% White, 25% Black, 28% Hispanic

South and West Houston district.

Safe D

District 22

Obama 60%

McCain 40%

39% White, 32% Black, 26% Hispanic

The most Democratic district partially in Houston also includes Beaumont, Port Arthur, Hudson and Nacodoches.  

Safe D

District 29

Obama 59%

McCain 40%

29% White, 10% Black, 57% Hispanic

A good piece of Green’s current district is in the new 29, he should have no problem winning here.

Safe D


Like Houston I had to take this photo to account for the sprawly districts

District 10

Obama 60%

McCain 39%

52% White, 6% Black, 38% Hispanic

This district includes most of Lloyd Doggetts current district in South Austin and it sort of stretches all the way down into South Texas.  

Safe D

District 31

Obama 58%

McCain 40%

47% White, 24% Black, 25% Hispanic

Squeezing a third Democratic district out of Travis County was great.  This district includes parts of Travis County, Waco, Killeen, Temple, College Station

Likely D

District 33

Obama 59%

McCain 40%

67% White, 7% Black, 19% Hispanic

Most of Austin is in this district including Round Rock.

Safe D

District 3

Obama 60%

McCain 38%

39% White, 18% Black, 38% Hispanic

The most Democratic district in the state with Obama winning by a 22 point margin.  It loops around the very conservative Park Cities and Preston Hollow area of Dallas County

District 12

Obama 59%

McCain 40%

45% White, 21% Black, 29% Hispanic

Contains much of the City of Fort Worth.  I’d like to see Lon Burnam run in this one.  He’s a very liberal State Representative in Fort Worth.

Safe D

District 24

Obama 59%

McCain 40%

53% White, 18% Black, 21% Hispanic

Contains the Democratic parts of Arlington in Tarrant County and Southwest Dallas County.   The college town Denton is also roped into the district.

Safe D

District 30

Obama 60%

McCain 39%

40% White, 19% Black, 35% Hispanic

Mostly West Dallas including southern parts of the city and Democratic pieces of Collin/Denton County

Safe D

District 32

Obama 60%

McCain 39%

45% White, 28% Black, 21% Hispanic

South Dallas and some eastern Dallas suburbs including Garland.  I think Eddie-Bernice Johnson would run in this one.

Safe D

Well it happen?  No, but a Democrat can dream 🙂

California: Back to the Future

I have drawn a number of maps trying to predict California’s 2012 redistricting.  I will not be posting any of them in this diary, as I think it’s just a guessing game trying to figure out how exactly the lines will look.  There are several different ways the lines can be drawn – all adhering to the new commission standards.  (OK, maybe I will post a prediction map at some time in the future, once I feel confident that I am drawing the lines in a purely objective way – which is hard to do perfectly) …

Nevertheless, in this diary I wanted to find a totally objective way in which to predict only what the net effect of such a perfectly non-partisan, non-biased redistricting may be – in a “most likely” scenario.  I thought that one of the best and most objective ways to do this is to look back at the 1992 non-partisan map and see how those districts compare, in partisan terms, to the existing ones.  This entails nothing more than redrawing the 1992 districts into Dave’s Application.  Hence, I will not even post any statewide maps here, as you can see what the districts looked like via this link:

http://swdb.igs.berkeley.edu/m…

Instead of the maps, I have included a chart here showing how each 2002 district voted in the 2008 election and how each of the 1992 districts would have voted had that map been in effect in 2008.  Granted, there were obvious population shifts between the 90’s and the last decade, so the 1992 lines now would produce over-populated or under-populated districts, and the biggest difference is that there were 52 districts back then instead of 53 now.  But the districts can still be compared for the purpose of this analysis — because the point here is not really trying to see how any particular district would change, but only what the net effect would be, ie. more or less Democratic or Republican districts overall ??  As far as the missing 53rd District, I get to that too, towards the end of the diary …

Photobucket

Under this exercise, it appears that had the 1992 lines stayed in place for 2002, there might now be upwards of 40 seats in California that Obama won by at least 6 points (at least a 52-46 margin) as compared to only 34 such seats currently.

As can be inferred from the above chart, a perfectly fair redistricting of California is likely to add several more Democratic districts.  The numbers highlighted in yellow are districts where the partisan balance doesn’t change much when you go from the 2002 incumbent protection map to the 1992 non-partisan map.  These are districts where the change in Obama’s margin over McCain (or McCain over Obama) is no more than 4 points.  The numbers highlighted in red are ones where the margin changes by 5 points or more in the Republican direction, while the numbers highlighted in blue are ones where the margin changes by 5 points or more in the Democratic direction.  

First, we need to take out the districts where the numbers change by 5 points or more in the Democratic or Republican direction, BUT the change is not likely to make a difference because the district is already super-Democratic or super-Republican.  These include CA-7, CA-30, CA-34, CA-35 and CA-37, which are already very Democratic and which might become even more Democratic under a re-map, as well as CA-1, CA-10, CA-23, CA-27, CA-36, CA-43 and CA-53 which become less Democratic, but are still very likely to be retained by a Democrat even if the lines were changed (all except CA-23 and CA-36 would have Obama percentages of at least 62%).  

What’s left are 7 districts where the partisan change may entail a change in party control.  These include 2 districts that move in a Republican direction, and 5 that move in a Democratic direction (I have marked these districts using a bolded outline in the column referencing the 1992 District partisan breakdown).

CA-18 and CA-20 become less Democratic to the point where, at least in CA-20, the Republican candidate would have very likely won last November under the old lines.  It appears that CA-18 would have also been a 50/50 district in last year’s election had it remained under the old lines.  (For what it’s worth, it should be noted that both districts still remain “Obama districts”.)   However, for both of these Central Valley districts, the actual 2012 redistricting may not be as “brutal” if you’re a Democrat because of the VRA.  The commission is likely to feel the need to be quite “VRA-compliant” in this part of the state, and the resulting districts are likely to have more Hispanics than under the 1992 lines, and thus be more Democratic.

The 5 more Democratic districts include CA-3, CA-24, CA-25, CA-26 and CA-42.  All move in the Democratic direction in this exercise.  CA-24 and CA-26 become so much more Democratic, that a Democratic takeover would be likely, while the other 3 are right on the line – with the caveat that Congressmen like Lungren and Miller would not likely be able to hold the districts in a Democratic or even “neutral” year.  McKeon – I’m not sure, but he certainly doesn’t have the moderate reputation of someone like Bono Mack who is able to currently hold a district with a similar partisan makeup.

What’s interesting, at first, is that Calvert’s district does not appear to change much in the chart.  Here’s where the “53rd District” comes in … Out of the 52 districts under the 1992 plan, two stand out like a sore thumb, in terms of over-population (I am using today’s population numbers, but under the 2000 population numbers they would have been over-populated in a similar fashion).  Both the western and eastern halves, respectively, of Riverside Co. (which under the 1992 map were labeled CA-43 and CA-44 but now more closely correspond to CA-44 and CA-45) are over-populated by over 300,000 persons, or something like 150% (Calvert’s area is at +367,000 while Bono Mack’s is at +321,000) … No other districts in the state even come close (every other is under 200,000, in most cases 100,000 or less) … Taken together, the +367,000 and +321,000 over-populations add up to almost exactly one new Congressional district in Riverside Co.  Granted, we’re using 2006-2008 population estimates on 1992 lines.  Nevertheless, even between the 1990 and 2000 Censuses, Riverside Co. had the highest population growth in the state (other than three relatively small counties – San Benito, Placer and Madera).  Thus, if the 2002 map was truly “non-partisan” the 53rd district created may have been centered not in the Central Valley, but in Riverside Co.  

To see how this plays out in a partisan way, I drew 4 different possible scenarios of how Riverside may look if it contains 3 districts of equal population (with each district corresponding to an ideal district size using population estimates for 2006-2008) …

The first map below is simply the districts under the 1992 map; the old CA-43 is in magenta while the old CA-44 is in blue:

Photobucket

The second map shows how the districts may look if Riverside Co. is divided into 3 districts of equal population.  In this scenario, equal numbers of people are taken out of both the western (magenta) and eastern (blue) halves of the county to create a new district in the middle.  I tried to draw so that cities are not split up by the district lines.  The new district, in orange, encompasses Riverside, Moreno Valley, Calimesa, Beaumont and Perris, and its partisan breakdown is 56 Obama – 43 McCain (the western district in magenta is 47 Obama – 51 McCain, while the eastern district in blue is 51 Obama – 48 McCain).

Photobucket

The third map below shows how the map may look if, instead, Riverside, Moreno Valley and their immediate environs are put together into one very compact district (almost rectangular) while the magenta and blue districts adjust accordingly for equal population.  In this scenario, the new orange district is 58 Obama – 40 McCain, the magenta one is 46 Obama – 52 McCain, while the blue one is 50 Obama – 48 McCain.

Photobucket

The fourth map has Riverside, Norco and Corona all in one orange district at 53 Obama – 45 McCain (the magenta district is 50 Obama – 48 McCain, while the blue one is 50 Obama – 49 McCain).

Photobucket

The last map tries to keep most of Moreno Valley together with Palm Springs (as they are currently); while Norco and most of Corona stay with Riverside.  The orange district here is 55 Obama – 43 McCain; magenta one is 44 Obama – 54 McCain and the blue one is 55 Obama – 43 McCain.

Photobucket

As you can see, any reasonable way you slice and dice Riverside, you’re creating at least one quite Democratic district (and possibly two) – which, like CA-3, CA-24, CA-25, CA-26 and CA-42 above would likely move in the Democratic direction (in scenario #4, the one that produces the “weakest” partisan shift for Democrats, still has the new Riverside Co. district at 53 Obama – 45 McCain which is a 7 point improvement in the Obama – McCain margin over the existing CA-44).

You can see from this exercise that the 2002 plan, even though it was an incumbent-protection map, has benefitted Republican incumbents significantly more than Democratic incumbents.  If something truly non-partisan had been created in 2002 Democrats would likely have at least several more members currently.  With 2012 redistricting being non-partisan it is therefore likely (though never guaranteed ofcourse) that the map will increase the number of Democrats in California.  And, as you can see from the “53rd District” scenario above, even in Republican districts which have or are experiencing the highest population growth in California (like Riverside Co.) the growth has been in Republican districts, but among Democratic constituencies.  

To sum up, therefore, I think that a non-partisan map will ultimately be more of a plus for Democrats than Republicans.  If drawn in a neutral manner, a new CA-18 and CA-20 might be marginal to leaning Republican — but the VRA is likely to “save” those districts for the Democrats.  Meanwhile, non-partisan criteria will more likely than not enable the creation of more Democratic districts in geographic areas currently corresponding to CA-3, CA-24, CA-25, CA-26, CA-42 and CA-44.  The new Democratic-leaning districts may even not correspond to the districts listed here — as this exercise for me really tried to gauge a net effect rather than trying to predict individual districts — but they will appear somewhere in California (mostly in the southern part of the state).  Several of these new districts will likely go Democratic in 2012, while others may be more marginal but may nevertheless provide Democrats at least an even chance of takeover (later if not sooner, as demographic change progresses) — which is better than what the existing map has to offer.  If you’re a Democrat, fortunately we no longer will have the self-defeating Democrats of 2002 to draw the map for us. Instead, we should look forward to the Commission’s work in the Golden State.

Mass Confusion: 4 Plans for MA Redistricting

For my first diary, I decided to tackle my (adopted) home state. Given that Olver is not going to go quietly, it really seems to be up in the air who gets eliminated. I think there are 4 realistic options:

1. Olver gets pushed in with Neal anyway. Western Mass is where the population loss has been, and this would produce the least-gerrymandered map.

2. Lynch is booted. He’s not popular among the liberal establishment and can be eliminated pretty easily.

3. Tierney is eliminated. He’s probably the weakest incumbent in the delegation, and if it stays the same, I think the 6th is the only district that could flip in 2012 (assuming Tisei runs).

4. Frank retires. The 2010 race, and the prospect of going back into the minority, may convince him that now is the time to hang it up and write his memoir.

I think 2 and 3 are the more likely scenarios, but 1 and 4 are still possible. Notice I did not include Scenario 5: Capuano runs for senate. That’s because the plan will face a lawsuit if they do not draw a Majority-Minority District. I think it is likely to succeed, based on VRA analysis I’ve read here pertaining to other states. Since Capuano’s district is already on the VRA borderline, I think it is going to stay the same regardless. In all my plans I made sure the 8th was below 50% white.

Quick notes for these:

A) Nantucket and Martha’s Vineyard are always in Keating’s district. It’s just easier to leave them off the maps for readability.

B) All districts are safe D in all years in my opinion, unless otherwise indicated.

C) I tried to keep any non-eliminated incumbents in districts that are as similar to their current ones as possible.

D) Keating’s district gets the number of the eliminated district, just for convenience (I know MA always renumbers its districts to count up from the West to Cape Cod)

I have individual district maps for all these – I’ll post them if there’s confusion, but there are so many districts here (36) I’d rather not do that.

The coloring scheme should be familiar:

District 1: Blue

District 2: Green

District 3: Purple

District 4: Red

District 5: Yellow

District 6: Teal

District 7: Hot Pink or Orange(Map II)

District 8: Lavender

District 9: Cyan

Map I: Neal vs. Olver

West:

MA_1_West

Northeast:

MA_1_Northeast

Southeast:

MA_1_Southeast

Boston:

MA_1_Bos

I-1. Keating

This district changes quite a bit – it keeps it base on the Cape and Islands but now includes Keating’s actual residence in Sharon. New Bedford is added too to make this more Dem.

I-2. Neal vs. Olver

Compact Western Mass seat. Should be a fair fight between the two.

I-3. McGovern

This district is now Worcester County-based, losing its tail into Fall River. McGovern should hold it fine, but I’d be concerned about him retiring in a bad year.

I-4. Frank

Frank gets a lot of liberal MetroWest areas along with some more conservative ones around Franklin. He also swaps out New Bedford for Fall River. Probably makes it a point or two less Dem, but Frank should be fine.

I-5. Tsongas

Very similar to her current district, but adds Fitchburg and Leominster while losing Haverhill.

I-6. Tierney

Adds Haverhill and Woburn but otherwise doesn’t change much. A potential alternate configuration would be to move Revere and Winthrop to I-6 and give Woburn back to I-7. That’s probably a wash politically.

I-7. Markey

Pretty similar to his current seat with a little more of MetroWest.

I-8. Capuano.

Similar to his current seat with a few territory swaps in Brighton, Hyde Park, and Everett to make sure it’s majority-minority (47% white).

I-9. Lynch.

Takes in conservative parts of Plymouth county as well as the Blue-collar towns of Quincy and Brockton. Excellent fit for Lynch, but could be competitive if he retires at the wrong time.

Map II: Capuano vs. Lynch (in reality, eliminating Lynch)

West:

MA_2_West

Southeast:

MA_2_Southeast

Northeast:

MA_2_Northeast

Boston:

MA_2_Boston

II-1. Olver

Expands east just a tad and gets rid of that silly tail on the 2nd district, which has outlived its usefulness.

II-2. Neal

Same situation as Olver. These 2 districts are more-or-less identical in maps II, III, and IV.

II-3. McGovern

Almost identical to his current district.

II-4. Frank

Moves a bit further out of Boston. Probably about the same politically, or maybe a point or two less D, due to the addition of Brockton canceling out some more conservative suburbs. Frank should still be safe here.

II-5. Tsongas

Similar to her current district, with a bit more of MetroWest added. Probably a point or two more D.

II-6. Tierney

Pulls in closer to Boston, taking the Northeast part of Markey’s district. Probably a point or two more D, but I’d be really worried about Tisei winning this seat as the new territory coincides with his former State Senate District.

II-7. Markey

Loses its northeastern portion and exchanges it for Brookline, Brighton, and West Roxbury. Maybe a point or two more D.

II-8. Capuano vs. Lynch.

Majority-minority district that contains Capuano’s and Lynch’s homes, but that Lynch can not win. If Capuano runs for Senate, I imagine Chang-Diaz could beat Lynch in a primary easily.

II-9. Keating.

Adds Milton, Braintree, and Weymouth (giving Keating more of his Norfolk County base) but otherwise few changes. Probably a point or two more D than it is now.

Map III: Eliminating Tierney

West:

MA_3_West

Northeast:

MA_3_Northeast

Southeast:

MA_3_Southeast

Boston:

MA_3_Bos

III-1 and III-2. Olver and Neal

See map II above.

III-3. McGovern

This one changes a lot. It becomes basically a MetroWest district. If anything that makes it more Democratic, but I could see McGovern having a tough primary fight if somebody from the Framingham area had the gall to challenge him.

III-4. Frank

This district shifts west, taking the tail of MA-3 and giving up its central portion. The population centers stay the same though (Newton, Brookline, New Bedford, and Fall River) so I think Frank should be fine here.

III-5. Tsongas.

This one has big changes, taking in the northern (and more conservative) half of the old 6th. On the plus side, it loses some conservative areas west of Lowell. It’s probably a point or two more Republican, and I could see Tsongas being vulnerable here in a 2010-like year.

III-6. Keating.

Similar to his current district, but adds Wareham and Braintree.

III-7. Markey vs. Tierney

This is designed as Markey’s district, but I don’t think he’s going to like it. It’s about 60% new territory for him and includes Tierney’s home. If Tierney doesn’t retire voluntarily, I don’t see them going for this as it would put Markey at serious risk in the primary. Even if Tierney retires, I think Markey would still complain loudly at having to absorb so much new area. This should be very safe for whichever Dem wins it in 2012, though.

III-8. Capuano.

Majority Minority District. Basically identical to I-8 above.

III-9. Lynch.

Lynch expands to the South, taking in conservative exurbs. Probably a couple points less Democratic, but this is a good fit for Lynch.

Map IV: Frank retires

West:

MA_4_West

Northeast:

MA_4_Northeast

Southeast:

MA_4_Southeast

Boston:

MA_4_Boston

IV-1 and IV-2. Olver and Neal.

See map II above.

IV-3. McGovern

Very similar to his current district, with one big exception, the addition of New Bedford. Probably significantly more Dem as a result.

IV-4. Keating

Gets fatter by adding more of Plymouth Co. and probably gets more Republican. Keating himself is probably safe, but I’d be very worried about him leaving in a bad year.

IV-5. Tsongas

Loses Haverhill and plunges deep into MetroWest. Probably siginificantly more D than before.

IV-6. Tierney

Adds Haverhill. Probably a wash, and I’d still think Tisei could win this seat.

IV-7. Markey

Adds Newton, Brookline, and West Roxbury while losing MetroWest. Probably more Dem than before.

IV-8. Capuano

Basically identical to I-8 above.

IV-9. Lynch

Very similar to his current district, shifted a little south and west, and adding Wellsley and Needham. Lynch won’t like that, but I think the more conservative rest of his district should be enough to hand him easy primary and general victories.

The moral of the story: Each of these have their strong and weak points. If you make a MMD in Boston (which means not tinkering with Capuano) it’s almost impossible to make 9 truly safe Dem seats. You can make 7 safe, 1 safe except in a really bad year, and 1 safe except for a Tisei run, but I think that’s about the best you can do without looking at a VRA suit. And I honestly don’t know what the final map will be most like – it’s so up in the air I don’t even think I can speculate. But the reason I did these 4 maps is to compare the possibilites, and I feel like the final product will look pretty similar to one of these, depending on who retires and who the legislature favors.

PS: Also note that with Maps 3 and 4, you can swap portions Keating’s and Lynch’s districts to give Lynch Plymouth and Quincy and Keating Norwood and Taunton as I did with Map 1, without affecting any other district.

That’s what I should’ve done for Map 4, but I didn’t realize it until after it was posted. So imagine Lynch’s district going East of Keating’s through Quincy, and Keating taking in Needham and Wellsley. That would solve Lynch’s primary and Keating’s general election problems.

SSP Daily Digest: 1/14

CT-Sen: Rep. Chris Murphy has been studiously avoiding saying he’s running for Senate, but seems to be dancing up to the edge of it more. He tells the Hartford Courant that he’s “interested” and that his decision will be “independent” of whether or not Joe Lieberman decides to run for another term. Murphy’s also claiming the backing of 2010 Lt. Gov. candidate Mary Glassman. Murphy may have a large hurdle to clear even before getting to take on Lieberman, though; here’s another reminder that Rep. Joe Courtney is still scoping out the Senate race too. Dem insiders and labor leaders are conflicted, with the differences between the two more stylistic than ideological, and are, at this point, mostly just hoping to avoid a divisive primary.

FL-Sen: The Republicans have their first big-name candidate to go up against Bill Nelson, although several more seem likely to get in: state Senate president Mike Haridopolos hasn’t formally announced, but unveiled his operation yesterday, kicking off his fundraising efforts and launching his website. For what it’s worth (not worth much, since Nelson is a thoroughly-known statewide figure at this point) Nelson and Haridopolos share the same geographical turf on the Space Coast.

HI-Sen: An interview with Mufi Hannemann, now decamped to the private sector, raises the question of the 2012 Senate race. Hannemann says that octogenarian Dan Akaka has indicated to him that he’ll run again, and he would never run against Akaka, but would “look at it” if there were an opening instead.

MA-Sen: We’ve already seen the mayors of some of Massachusetts’s cities cited as potential candidates (especially Newton’s Setti Warren), but here’s another one to keep in mind: Salem mayor Kim Driscoll, who has been asking around about the race. Two other mayors get cited in the piece as additional down-in-the-weeds possibilities for the Dems: New Bedford’s Scott Lang and Fitchburg’s Lisa Wong.

PA-Sen: The magic 8-ball is telling us that Mark Schweiker’s odds of running for Senate are pretty hazy at this point. The ex-Gov. just took on a “senior advisor” role (read: lobbyist) at a major law firm, which isn’t usually the action of a likely candidate for something.

TX-Sen: The big question today seems to be who all will pile into the overstuffed clown car that will be the GOP field to replace Kay Bailey Hutchison (who announced her retirement yesterday). Lt. Gov. David Dewhurst has already said he’s in (which may have surprised some people who thought he was more interested in becoming Governor instead… although those who know Texas politics know that being Governor is actually a step down from being Lt. Governor). Lots of sources today have long lists of all the potential candidates, with the one from the Texas Tribune probably the most thorough, with the other “high” probability GOPers besides Dewhurst being Elizabeth Ames Jones (the mama grizzly), Michael Williams (the teabaggers’ fave), Roger Williams (the business candidate), and the state’s former solicitor general, Ted Cruz. One other interesting bit of news is that right-wing kingmaker Jim DeMint, who has been squarely behind Michael Williams so far, is branching out his support, also expressing an interest in Cruz (probably at the best of social conservatives, who seem particularly fond of Cruz).

As for the Dems, most of the news has been prominent potential candidates saying “I’m not touching this one.” That includes former Dallas mayor Ron Kirk and former Houston mayor Bill White, both of whom have already lost statewide. While John Sharp is expected to run (though he hasn’t said anything official since KBH’s announcement), some Dems are already casting an eager eye toward San Antonio mayor Julian Castro, an up-and-comer who they think may be ready for prime time, calling the charismatic 30-something the Dems’ “Marco Rubio.” Other fallback options might include recently defeated ex-Rep. Chet Edwards, or two state Sens., Kirk Watson and Leticia van de Putte, who both were briefly speculation-subjects for last year’s gubernatorial race.

MT-Gov: Here’s one more Republican candidate for the open seat gubernatorial race, where the field is dominated by ex-Rep. Rick Hill but two state Senators are also in the mix. Jim O’Hara is an elected official, although it barely gets him out of Some Dude territory: he’s a Chouteau County Commissioner (population approximately 5,000).

WA-Gov: Chris Gregoire’s popularity in Washington seems to be keeping on dwindling; a recent Elway poll put her at just 38/61, worse than her position before the 2010 election. While nobody’s really expecting her to run for a technically-possible third term, it’s likely she won’t announce her plans until after the legislative session is done in order to avoid being a lame duck and have some clout instead.

MA-06: Rep. John Tierney’s wife, Patrice, was sentenced to 30 days in jail for aiding and abetting filing of false tax returns (on behalf of her fugitive brother). This is worth a mention here only because it could weigh on Tierney in terms of retirement or drawing a legitimate challenger for 2012, although this mini-scandal has been in the news for months and didn’t seem to have caused of an impression in 2010 (although Tierney’s kooky opponent probably wasn’t in a position to capitalize).

WA-St. House: There’s legislation afoot in Washington that could dramatically change the way the state House is set up. Currently, each of the state’s 49 legislative districts elect one senator and two representatives (meaning each Washingtonian has three state legislators to keep track of, instead of two). The proposed changes would move Washington toward the more conventional system of 98 individually-districted House districts, which would give each Rep. half as many constituents and in theory make them more accessible. There’s no indication, though, of whether this has the backing to go anywhere or if it’s just one Rep.’s personal hobby horse.

Mayors: One of the higher-profile mayoral races up for grabs this November will be in Las Vegas, although it’s doubtful any of the contenders will have the high profile of termed-out, outgoing mayor Oscar Goodman. (Any reporter writing about Goodman is required by law to refer to him as “colorful” in the first paragraph.) It seems pretty wide open, but three candidates who are already jockeying for position include Clark Co. Commissioner Larry Brown, city councilor Steve Ross, and Chamber of Commerce president Katherine Duncan.

Redistricting: Here’s a nice promise from Pennsylvania Republican state Senate president Dominic Pileggi regarding transparency in the redistricting process this year. He says that he’s planning a website that will offer “voter data, past district maps… and proposed maps when time allows.” Easy access to that kind of data ought to get a whole lot of SSPers salivating, but bear in mind that, for now, simply remains a promise. (Also, bear in mind that Pennsylvania has an odd system, where state legislative boundaries are drawn by a bipartisan commission but congressional boundaries are drawn directly by the legislature, subject to the governor’s veto. The GOP, rather inconveniently for us, just took over the trifecta for the first time since, oh, the last redistricting.)

TX Redistricting 20R-16D Map

Never done a map, so I thought why not.

First, I have no illusions that there is anyway a map that would have the chance to elect 16 Democrats would ever pass the current legislature, let alone survive a veto by Rick Perry.

I just wanted to see if i could a map that had districts that were a little more compact.

Let me just say that I threw out most of the current map and renumbered the districts and probably ended up redistricting a lot of current reps out of their districts.  

I also threw out the old numbers. I just have this pet peeve about numbering.  I hate to have district 1 and then district 2 on the other side of the state.  You can pretty much follow a trail from NE TX to SE TX, over to Houston, down the coast to the border, up to San Antonio, then Austin, then to El Paso, up to the Panhandle and south, then over and north into DFW.

Photobucket

TX-1, Safe Republican

Blue, NE corner of the state.

76% White, 16% Black, 7% Hispanic, 2% Asian

70% McCain/29% Obama

I think I redistricted Louie Gohmert out of this district and into the 2nd, which contains most of his old district.

TX-2, Safe Republican

Green, east Texas

73% White, 16% Black, 9% Hispanic, 1% Asian

70% McCain/29% Obama

TX-3, Safe Republican

Dark Magenta, SE corner of the state.

63% White, 21% Black, 13% Hispanic, 3% Asian

59% McCain/41% Obama

I gave the Golden Triangle (Beaumont, Port Arthur, & Orange) it’s own district.  I redistricted Ted Poe out of this district.  Although it’s a 60-40 district, I think someone like Nick Lampson could have a chance in it since it contains both Beaumont and Galveston.

Photobucket

TX-4, Safe Republican

Red, just north of Harris County (Houston)

77% White, 13% Hispanic, 8% Black, 2% Asian

73% McCain/26% Obama

Although it has less population than the other districts, it’s a fast growing area that will likely grow.  I also figured why not give the Houston suburbs their own district.

TX-5, Safe Republican

Gold

67% White, 15% Hispanic, 11% Black, 6% Asian

62% McCain/37% Obama

As Houston expands, this area may get more Democratic.  I don’t live in the Houston area, so I can’t say for certain.

TX-6, Safe Democratic

Teal

Majority-Minority

37% Hispanic, 33% White, 24% Black, 6% Asian

60% Obama/40% McCain

TX-7, Lean Democratic

Dark Gray

Majority-Minority

41% Hispanic, 40% White, 14% Black, 4% Asian

51% Obama/48% McCain

TX-8, Likely Republican

Slate Blue

Majority-Minority

47% White, 40% Hispanic, 9% Black, 4% Asian

56% McCain/43% Obama

TX-9, Safe Democratic

Cyan

Majority-Minority

33% White, 31% Hispanic, 29% Black, 6% Asian

67% Obama/32% McCain

TX-10, Likely Democratic

Deep Pink

Majority-Minority

34% White, 26% Hispanic, 26% Black, 14% Asian

55% Obama/45% McCain

TX-11, Likely Republican

Chartreuse

56% White, 22% Hispanic, 14% Black, 8% Asian

56% McCain/43% Obama

TX-12, Safe Republican

Cornflower Blue

59% White, 28% Hispanic, 9% Black, 3% Asian

65% McCain/34% Obama

Ron Paul gets to keep his seat.  This district combines most of the current 14th and 25th CDs.

TX-13, Lean Democratic

Dark Salmon

Majority-Minority

70% Hispanic, 26% White, 2% Black, 2% Asian

54% Obama/45% McCain

Although it’s a lean Democratic district, the right Democratic shouldn’t have trouble holding it.  This district takes in Corpus Christi and Brownsville.

TX-14, Safe Democratic

Olive

Majority-Minority

86% Hispanic, 13% White, 1% Asian

67% Obama/32% McCain

A border district, easy hold.

TX-15, Safe Democratic

Dark Orange

Majority-Minority

88% Hispanic, 10% White, 1% Asian

68% Obama/31% McCain

This district is anchored by Laredo.  Henry Cuellar gets to keep his job.

TX-16, Safe Democratic

Lime

Majority-Minority

71% Hispanic, 20% White, 7% Black, 2% Asian

66% Obama/33% McCain

Encompasses most of San Antonio.  Charlie Gonzalez gets to keep his job.

TX-17, Toss Up

Dark Slate Blue

Majority-Minority

50% Hispanic, 41% White, 5% Black, 3% Asian

50% Obama/49% McCain

This would be my new district.  I took in more of San Antonio and Bexar County and was able to cut down the size of this district.  Rather than stretching to El Paso, it now only goes to Del Rio.  In addition to cutting down the size, I also cut out a lot of the Republican areas in northern Bexar County that really came out in 2010 (such as Fair Oaks Ranch and Stone Oak).  Ciro Rodriguez could probably win this district.

TX-18, Safe Republican

Yellow

64% White, 26% Hispanic, 7% Black, 3% Asian

62% McCain/37% Obama

Democrats in the NE part of Bexar County won’t like it, but I made Lamar Smith’s district much more Republican.  I took those Republican areas from Ciro’s old district (haven’t gotten used to having Canseco yet) and gave them to Lamar Smith.  Austin Democrats should love this district because no longer do they have to deal with Lamar Smith.

TX-19, Safe Democratic

Lime Green

56% White, 30% Hispanic, 8% Black, 6% Asian

68% Obama/30% McCain

Here’s another reason Austin Democrats should love this map…Austin gets its own district.  Welcome back to a compact district Lloyd Doggett.

TX-20, Toss Up

Pink

65% White, 23% Hispanic, 8% Black, 4% Asian

50% Obama/49% McCain

Thanks to Travis, Bastrop, and Hays Counties, this district is a toss up and may continue in the Democratic direction.

TX-21, Safe Republican

Maroon, West Texas and Border

57% White, 38% Hispanic, 3% Black, 2% Asian

71% McCain/28% Obama

This district combines a lot of the current 23rd as well as the current 11th.  This district is dominated by San Angelo, Midland, & Odessa.

TX-22, Safe Democratic

Sienna

Majority-Minority

76% Hispanic, 18% White, 3% Black, 2% Asian

65% Obama/34% McCain

Silvestre Reyes gets to keep his El Paso district.

TX-23, Safe Republican

Aquamarine, Panhandle

66% White, 26% Hispanic, 6% Black, 2% Asian

74% McCain/25% Obama

Republicans keep breaking up Austin, so I thought I’d combine Amarillo and Lubbock and let them fight over one district.

TX-24, Safe Republican

Indigo, West Texas

70% White, 22% Hispanic, 6% Black, 2% Asian

74% McCain/25% Obama

Abilene is the biggest city here.  Charlie Stenholm might have been able to win this district.

TX-25, Likely Republican

Pale Violet Red

69% White, 16% Hispanic, 11% Black, 4% Asian

55% McCain/43% Obama

North of Austin it takes in Williamson County and Killeen.

Photobucket

TX-26, Safe Republican

Gray

67% White, 16% Black, 14% Hispanic, 2% Asian

66% McCain/33% Obama

Waco is the predominant city here.

TX-27, Safe Republican

Red

86% White, 9% Hispanic, 3% Black, 2% Asian

75% McCain/25% Obama

TX-28, Likely Republican

Dark Green

64% White, 24% Hispanic, 8% Black, 4% Asian

57% McCain/42% Obama

Western Tarrant County/Fort Worth.  Depending on where she resides, this district could be ripe in some years for a Congresswoman Wendy Davis.

TX-29, Lean Democratic

Dark Sea Green

54% White, 21% Black, 18% Hispanic, 6% Asian

53% Obama/47% McCain

SE Tarrant County/Fort Worth and Arlington.  If Wendy Davis wanted a better district right away, she could choose this one.

TX-30, Safe Republican

Yellow

80% White, 9% Hispanic, 5% Asian, 5% Black

65% McCain/34% Obama

TX-31, Safe Republican

Khaki

76% White, 11% Hispanic, 7% Asian, 6% Black

60% McCain/39% Obama

TX-32, Likely Republican

Cyan

67% White, 14% Hispanic, 11% Asian, 8% Black

57% McCain/42% Obama

TX-33, Safe Republican

Dark Goldenrod

78% White, 12% Hispanic, 7% Black, 2% Asian

69% McCain/30% Obama

TX-34, Toss Up

Lime Green

Majority-Minority

47% White, 35% Hispanic, 11% Black, 7% Asian

50% Obama/49% McCain

As Dallas goes more Democratic, so should this district.

TX-35, Toss Up

Dark Orchid

53% White, 27% Hispanic, 15% Black, 4% Asian

50% Obama/49% McCain

Second verse, same as the first.

TX-36, Safe Democratic

Orange

Majority-Minority

41% Black, 31% Hispanic, 26% Black, 2% Asian

80% Obama/20% McCain

SSP Daily Digest: 1/13

MA-Sen: No surprises are revealed in the Boston Globe’s post-Vicki-Kennedy-announcement state-of-the-Senate-field story (Mike Capuano, Stephen Lynch, Alan Khazei, and Robert Pozen are the Dems who get the ink). As far as Capuano goes, the story confirms that he’s taking a “hard look” at the race and will make a decision by late spring.

MI-Sen: Here’s some actual confirmation of what everyone assumed a few days ago, that ex-AG Mike Cox’s joining a Detroit law firm meant he wouldn’t be running for Senate in 2012. Cox himself says he’s out of contention, and he talked up his former gubernatorial primary rival, ex-Rep. Peter Hoekstra for the job.

ND-Sen: It’s been clear for a while now that Kent Conrad wasn’t going to be given a bye in his 2012 race, especially now that the GOP seems to be on an upswing in North Dakota. But now it’s looking clearer who the opponent will be: 44-year-old Public Service Commissioner Brian Kalk is forming an exploratory committee. (There are three PSC Commissioners, elected statewide to oversee stuff like utilities and grain elevators.)

NV-Sen: John Ensign seems undaunted by recent polling showing him in deep doo-doo in both the GOP primary and general election for 2012, and says he’s pushing ahead on ahead with his re-election plans, although also admitting that it’s going to be “very, very difficult.” He’s putting together a campaign team and “jump starting” his financial operations (which, considering they’re actually in pieces all over his garage floor, may require a little more than just jump starting). This was revealed yesterday at a rather awkward conference for human resources execs where both Ensign and Dean Heller were speakers; Heller told reporters afterwards that he “would be lying to you if I said I wasn’t thinking about it” and “don’t mind giving voters a choice if it winds up being a head-to-head,” although he also had no timetable for an announcement.

WV-Gov: Five different potential candidates appeared at a forum for the West Virginia gubernatorial race. Not all of them have announced, but this makes pretty clear who’s seriously in the hunt for this (despite the fact that nobody has any idea yet whether the race will be in Nov. 2011 or 2012). Among the Dems, SoS Natalie Tennant, state Treasurer John Perdue, and state Sen. Brooks McCabe were there; representing the GOP were ex-SoS Betty Ireland and state Sen. Clark Barnes. This still leaves out some of the likeliest other candidates, including Dem state House speaker Rick Thompson and acting Gov. Earl Ray Tomblin.

FL-23: Rep. Alcee Hastings, unbeknownst to many, is getting pretty long in the tooth, at 74. He says he has no intention of slowing down, though (not that he needs to work fast, to hold down his safe blue district); he just announced plans to run not only in 2012 again, but in 2014 as well, so long as he’s healthy. The article cites state Sen. Chris Smith as a likely replacement once Hastings does retire. (Which means the House would get two Chris Smiths, to go with its two Mike Rogers.)

MN-08: Here’s a minor bombshell for Minnesota Democrats, where outgoing House majority leader Tony Sertich had been widely expected to take on fluky new Rep. Chip Cravaack in 2012 in this D+3 district. Having just been appointed Iron Range Resources Commissioner, though, he now says that he won’t run. The Duluth-area portion of the district has a pretty thorough DFL bench, so they won’t lack for a credible challenger, but Sertich had been at the top of almost everyone’s list so this scrambles things a bit.

Redistricting: One thing that the Republicans have always been good at is making sure that stuff that can pay dividends down the line is well-funded, but this seems like an unusual case of ball-dropping: Making America’s Promise Secure (or MAPS), a 501(c)(4) oriented toward paying for the legal aspects of the 2012 redistricting battle, never really got off the ground and has almost no money, leaving the state parties to fend for themselves. There are also a number of interesting pieces today on the upcoming battles in individual states, including The Fix’s look at the impact of the citizen redistricting panel on California (where the switch away from incumbent protection has a lot of old-timers of both parties shaking in their boots). There’s also another look at Massachusetts, and also a nice piece about New Mexico that has lots of detail about previous decades’ battles. New Mexico is a state we haven’t thought about much in this context because its House boundaries aren’t likely to change much, but state legislative seats are likely to shift significantly from the state’s stagnant east into Albuquerque’s suburbs.

Voter suppression: Wisconsin’s newly-Republican-controlled legislature is already taking some pains to make sure that it stays that way, with one of their first legislative priorities imposing photo ID requirements for all voters at polling places (and to push for a constitutional amendment that would make that law more difficult to repeal later). They’d also like to move on ending Wisconsin’s well-known same-day-registration, although that may not be as likely a target seeing as how it’s not only popular but would also cost a lot of money (because federal law says that the state would then need to implement a motor-voter registration system instead).

Congress: This may be the single most useful thing you’ll read today: the Hill’s guide to pronunciation of all of the names of the Congress members with hard-to-pronounce names. I learned that I’ve been mentally mispronouncing at least a dozen names; I’m sure everyone will find at least a few surprises.

Meta: Curious how my own gifts for inspiring oratory would look in “word cloud” form, I ran SSP’s front page through Wordle.net, and the net result is, well, not very inspiring… it’s about as sober and nuts-and-bolts as it gets. None of our favorite neologisms made it on there (NWOTSOTB? Some Dude? Cat fud?)

PA – Why 12R, 6D will be the Republican’s choice

Over the past few weeks, I’ve seen numerous maps which have tried to draw Pennsylvania (where Republicans have total control) 13R-5D, or even 14R-4D.  After trying several maps out for myself, I’ve decided that aggressive action by the Republicans, while not impossible, will be foolhardy.

The 2000 Republican redistricting is remembered by some as a success, but in many ways, it was a failure.  PA-13 and PA-17 were both supposed to be Republican seats when drawn.  And as we all know, PA-3, PA-4, PA-8 and PA-7 ultimately were too Democratic to be held consistently through the decade.  

Republicans will surely wish to ensure that one Democratic incumbent loses their seat (most likely Mark Critz).  Knocking off Jason Altmire isn’t too difficult either – there are plenty of deep-red Republican areas to draw into his district, and western Pennsylvania outside of Pittsburgh is swinging to the right pretty rapidly.  However, eastern Pennsylvania has been trending towards the Democrats for just as long.  The Republicans now hold four Democratic-leaning districts in the east.  Not enough Democrats can be siphoned into PA-1, PA-2, and PA-13 to make the seats safe.  

Compounding the issue is Tim Holden.  He has been a formidable campaigner, repeatedly winning re-election in a Republican-leaning district.  Any attempt to trade his seat for a new safe D district scooping up Democrats the northeastern part of the state makes it uncomfortably possible the Republicans will hand the Democrats a free gimme and Holden will survive.

Therefore, I’ve decided a 12-6 breakdown is the best the Republicans can reasonably manage which protects almost all of their incumbents (barring a major scandal), for the remainder of the decade.  Really, a two-to-one margin for Republicans, given they have consistently lost the state on the presidential level since 1988, is pretty damn gerrymandered already – especially if they trade four somewhat unsafe seats for much safer ones.

In the end, I think the map will have these broad outlines:

1.  Eliminate Mark Critz’s seat.

2.  Move PA-12 to the Philly burbs.  It becomes a vote sink for Democratic areas which do not fit into the other three Philly-area districts.

3.  Make Tim Holden’s district as Democratic as possible, which will help shore up both PA-11 and PA-15 for incumbents.

4.  In order to ensure that no Republican incumbent loses a seat, Altmire has to go.  His seat gets dismembered, with his hometown in PA-14, but his base split between PA-18, PA-9, and PA-3.  Thus he’ll have to move, and face an uphill battle regardless.  PA-4 moves to Dutch Country and replaces PA-19.  

Here’s the statewide view.  All Republican incumbents keep their hometowns in their seats, from what information I could gather.  Some districts do change composition rather dramatically however, particularly in the east.  

Details by district:

PA-1

Minority-Majority (39% White, 34% Black, 19% Hispanic, 6% Asian)

82% Obama, 17% McCain (D+28)

I do not know Bob Brady’s exact address, so I am not sure if his home is in the district.  The district sheds its extension into Delaware county, and expands a bit into Northeast Philly.  Still highly safe of course.

PA-2

Majority Black (63% Black, 29% White, 4% Asian, 3% Hispanic)

90% Obama, 10% McCain (D+36)

Again, I am not sure of Chaka Fattah’s exact address, but the core of black west Philadelphia remains intact.  The district takes in predominantly black areas of Delaware county, and also a few heavily-Democratic white areas like Media and Glenolden which don’t fit well into PA-12.  

PA-3

53% McCain, 46% Obama (R+7)

The district sheds half of Erie, in order to become less Democratic, and picks up more Republican areas to the south which were formerly part of PA-4.  It does contain a fairly substantial part of Altmire’s old district, and is only marginally more Republican than his old district, but he would have to move to establish himself here.  

PA-4

56% McCain, 43% Obama (R+10)

This is really a replacement for the old PA-19.  It’s centered around Harrisburg, although Harrisburg itself is drawn into PA-10 in order to stop this district from being swingy.  Should remain a solid Republican seat.  

PA-5

53% McCain, 45% Obama (R+8)

This district migrates to the west, picking up half of Erie, along with some of the outer reaches of southwestern Pennsylvania.  It’s slightly more swingy than it was before with the inclusion of Erie, but should remain a solid Republican seat.  

PA-6

51% McCain, 48% Obama (R+5)

Marginal parts of Chester and Montgomery are shed, along with the city of Redding.  In exchange, it takes in more of rural Redding county, and the northern parts of Lancaster county.  Although the right Democrat could take this, it is a far safer district than it was.  

PA-7

52% McCain, 47% Obama (R+6)

Again, the district shifts west.  It takes on parts of Chester, Lancaster, and York counties, while shedding the most Democratic parts of Delaware, along with the salient into Montgomery.  This should be a fairly secure Republican seat.

PA-8

51% Obama, 48% McCain (R+3)

There were logical limits to how well this seat could be gerrymandered.  It has shed southern Bucks, and picked up in exchange the most Republican parts of Montgomery, along with a Republican-leaning strip of hills in the Lehigh.  However, this area is still very swingy and essentially surrounded by Democrats on all sides, making further improvement difficult.  Compounding issues, Mike Fitzpatrick is from Levittown, in the far south.  Levittown is not a real municipality, it is split across three different townships.  Given I didn’t know where precisely he lived, I decided to leave Middletown in PA-8, which is marginally less Democratic, while putting Bristol and Falls into PA-13.  Democrats will probably take this seat sometime during this decade if current trends continue, but it should be the Republicans’ only loss.  

PA-9

58% McCain, 42% Obama (R+11)

This district changes complexion dramatically, from being based in the Central PA mountains to being mainly based in the Pittsburgh exurbs, with a salient heading towards Johnstown and Altoona.  It is still heavily Republican.  Mark Critz finds himself in this district, and out of a job.  A small amount of Altmire’s old district is in PA-9 now, but I think it will be the least likely option for him to take.  

PA-10

53% McCain, 46% Obama (R+7)

The district moves to the west and south.  It is not an overwhelmingly Republican seat, due to the inclusion of State College and Harrisburg, but is still Republican enough to remain safe.  

PA-11

52% McCain, 46% Obama (R+7)

Much of the Wyoming valley has been shed, as it was too full of Democrats for Lou Barletta’s comfort.  In its place, much of the “Northeast woods” of the state have been added.  The district should be a pretty good fit for Lou Barletta’s moderate stances.  

PA-12

63% Obama, 36% McCain (D+10)

This entirely new district more or less follows the Schuykill River, picking up Democratic votes from Philly all the way to Redding.  It’s an interesting question who in the state house or senate will step forward to run for this seat.  

PA-13

63% Obama, 36% McCain (D+10)

The district retains a focus on Montgomery county, but sheds much of the northern parts of the county.  It also loses much of Northeast Philly, and gains lower Bucks.

PA-14

68% Obama, 31% McCain (D+14)

This district is not quite as Democratic as it could be, as it draws in a few Republican areas to ensure Jason Altmire will live in the district.  If the Republicans are lucky, he may try to primary Mike Doyle (although I think he would lose).  It is otherwise broadly similar to the old Pittsburgh-based district.  

PA-15

50% Obama, 49% McCain (R+4)

This is the other Republican district which could potentially be endangered.  The problem is incumbent Charlie Dent lives in heavily Democratic Allentown.  If I knew precisely where in Allentown he lived, I could shunt most of the city into PA-17, and probably improve the district to R+6 or R+7.

PA-16

57% McCain, 42% Obama (R+12)

This district, as odd as it seems looking at it, was not constructed mainly as a gerrymander.  The incumbent is unfortunately in Chester county, but the old base of Chester and Lancaster was needed in order to make PA-6 and PA-7 into solid Republican seats.  Thus the seat goes far, far to the west, traveling almost the entire length of the southern border of the state.  In southwestern Pennsylvania, it does helpfully sop up Democratic voters in the Mon valley who would otherwise cause issues for Tim Murphy.  

PA-17

61% Obama, 38% McCain (D+8)

Since it’s impossible to ensure Tim Holden is defeated, instead the new PA-17 packs in as many Democrats into his seat as possible.  The only old part of the seat is a small salient into Schuykill county to grab his hometown.  Indeed, it’s plausible he’d be vulnerable in a primary, but he’d have an easier time running as an unknown incumbent in an open seat primary than he would moving and picking more Republican PA-15 which has most of his old base.  My bet is he stays put.  

PA-18

53% McCain, 46% Obama (R+8)

The new PA-18 keeps most of Tim Murphy’s base in the South Hills of Pittsburgh intact.  It does shed Westmoreland county to PA-9, and takes in a good deal of the old PA-4.  The retention of Murphy’s base means Altmire would have trouble gaining traction here.  If the seat ended up open, he’d otherwise potentially be competitive.

Thoughts?