Mini Redistricting Challenge: Alabama

Diarist roguemapper has a great post up featuring the creation of new majority-minority VRA districts in several southern states. I like these maps, but I don’t expect the Obama DOJ to be this aggressive in requiring new maj-min seats – and I also think that many southern legislators probably won’t be interested in drawing lines like these. As most Swingnuts are aware, heavily black districts have operated as Democratic vote sinks for two decades now, helping Republicans win seats abruptly depopulated of reliable blue votes. But with the southern realignment finally complete, I don’t think there are too many GOP officials in Alabama, for instance, who think they can’t easily hold 6 of 7 congressional districts.

In fact, this is exactly what the Republicans are planning on:

The likely result is a new congressional map that protects all six Republican congressmen and keeps intact the majority black district home to the only Democrat, according to U.S. Rep. Mike Rogers, R-Saks.

So the challenge to you is to create a map that packs as many African Americans into a single district in Alabama as you possibly can. No rules, and no prizes other than bragging rights (or maybe a job working for the Republicans on the redistricting committee). I figure there are three rough categories, though: compact (aka goo-goo fetishist-style), ugly but beautiful (aka abgin-style), and supremely ugly with touch-point contiguity (aka andgarden-style). Post as many entries (in as many styles) as you like.

Have fun, and share your results in comments!

P.S. If for some reason you’ve made it this far but haven’t yet encountered the glory that is Dave’s Redistricting App, well go and check it out! It’s the essential tool for any citizen redistricting efforts.

UPDATE: So far it looks like the most extreme gerrymander belongs to goohiost7, whose district is 81.5% African American.

Redistricting outlook: Idaho-Iowa

Now that it’s 2011, the redistricting games will soon begin in earnest, with more detailed Census data expected in February or March and some states holding spring legislative sessions to deal with drawing new maps. Long ago I planned to do state-by-state rundowns of the redistricting process as soon as 2010 election results and Census reapportionment were clear. Now that time has arrived, and it’s time to look at Idaho, Illinois, Indiana, and Iowa.

Previous diary on Alabama, Arizona, and Arkansas

Previous diary on California, Colorado, and Connecticut

Previous diary on Florida, Georgia, and Hawaii

The rest below the fold…

Idaho

Photobucket

Districts: 2

Who’s in charge? Nonpartisan commission

Is that important? Nope

Idaho competes with Hawaii for the prize of least interesting congressional redistricting process of the decade. The commission will move some precincts around to achieve population equality, and Reps. Labrador and Simpson will likely stay in office with huge majorities throughout the 2010s.

Illinois

Photobucket

Districts: 18, down from 19 in 2002

Who’s in charge? Democrats

Is that important? Extremely

This will be the first time in a long while that Democrats control redistricting in Illinois, and as their only obvious major gerrymandering opportunity of the decade, they will milk the state for every seat it’s worth. In such a blue state with an 11-8 Republican majority in its congressional delegation, big swings should not be difficult. They will likely eliminate a GOP seat in the Chicago area (my guess: force Bob Dold and Joe Walsh together in a more Republican North Shore district), though there’s been some discussion of eliminating a downstate district instead (say, Bobby Schilling’s or Aaron Schock’s). That is only the beginning. Lessening the minority percentages by just a little in the 1st, 2nd, 4th, and 7th could ruin suburban Republicans like Adam Kinzinger and Peter Roskam, while liberal urban districts like the 9th and 5th could easily stretch westward to lessen GOP fortunes in nearby seats. In using Dave’s application, I found it possible to create an ethnically diverse, heavily Democratic 11th District for Kinzinger simply by lowering the African-American percentages for Rush and Jackson to the 52-53% range.

I think the Democrats will seek to gain perhaps three seats, for an 11-7 Democratic edge. Given the necessity of VRA protection in those four Chicago seats, any more would be pushing their luck. The most likely Republican casualties are Dold, Walsh, Kinzinger, Roskam, and Schilling, though at least one of them will likely be strengthened by the new gerrymander.

Indiana

Photobucket

Districts: 9

Who’s in charge? Republicans

Is that important? Yes

The bad news for Democrats is that Joe Donnelly is almost certainly toast — split up South Bend and Michigan City between two districts and he will be running in a much more GOP-friendly seat than the current Obama-supporting 2nd District. The silver lining is that Republicans can’t make things much worse for them otherwise. Democratic vote concentration in Lake County and Indianapolis will ensure solid vote sink districts for Pete Visclosky and Andre Carson, and Gov. Mitch Daniels has urged his party not to go crazy with boundary lines (this probably applies more to legislative districts, since only the 2nd will be significantly politically altered in this case).

Iowa

Photobucket

Districts: 4, down from 5 in 2002

Who’s in charge? Nonpartisan commission, with legislative approval

Is that important? Yes

Since the commission will not want to combine two Democrats (Braley and Loebsack) or two Republicans (King and Latham), it is almost sure that Tom Latham will face Leonard Boswell in a politically competitive Des Moines/Ames district. Latham has generally overperformed GOP baseline in his district while Boswell has had a number of tough races over the years and will be 78 next year. I could see the latter retiring if forced to run against Latham. But time will tell. Boswell’s tenacity — winning races since 1996 that, more often than not, have been relatively close — may ultimately pay off.

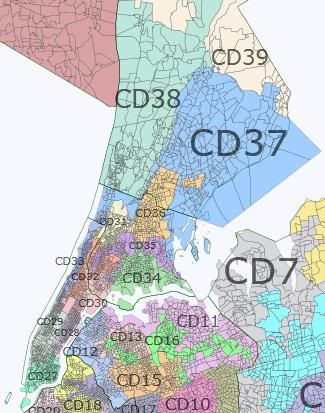
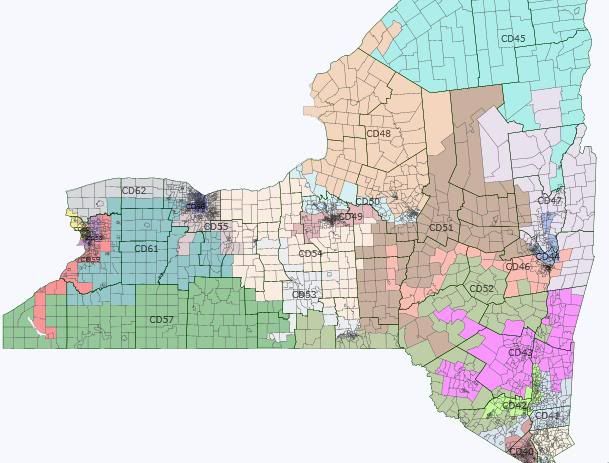
New York State Senate Redistricting: 43-19

After only two years of a slim 32-30 Democratic majority in the New York State Senate, Republicans in this past election barely took back the chamber that they had previously held continuously for more than forty years. People around the country endlessly ask the question: how is it possible that Republicans have a majority of state senators in a state as “blue” as New York?

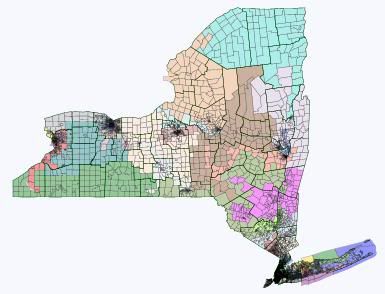
There is no simple answer to that question. Sufficed it to say, one of the most important factors is gerrymandering. Republicans did a masterful job of redistricting a very favorable map for themselves ten years ago. The current map is littered with Republican senators holding light blue Obama districts all over Long Island (9-0 Republican) and Upstate (21-4). With the great help of Daves Redistricting App 2.0, I set about in the task of redistricting New York's State Senate districts with three main goals in mind: 1.) connect Democratic towns and cities in Long Island, 2.) preserve majority-minority districts in New York City, and 3.) consolidate small cities Upstate. Much of the basis for my analysis comes from jeffmd's excellent post on the State Senate written in 2009 in which he looked at the numbers for the current districts. Inspecting the presidential toplines, it was determined that the cutoff between Republican and Democratic districts is about 58-60% Obama. My map uses that percentage as the benchmark. It would create 10 Democratic districts at over 58% in Upstate New York and another four at over 62% in Long Island. Combined with New York City, this would be more than enough to give Democrats a two-to-one majority in the State Senate. So without further ado, here is what I came up with:

New York 


District Pop. Center Pop. Wh% Bl% Asn% Hisp% Oth%
O% M%
D 1 Hamptons 318633 66 11 3 17 2
62 38
R 2 Brookhaven 318569 89 2 2 6 1
49 51
R 3 Lindenhurst 318229 89 2 1 6 1
47 53
D 4 Huntington 318189 60 17 3 18 2
63 36
R 5 Smithtown 318668 91 1 3 4 1
46 54
R 6 Massapequa 318525 90 0 3 5 1
44 56
D 7 Great Neck 318243 67 12 8 11 2
64 35
D 8 Hempstead 318681 51 26 3 18 2
69 31
R 9 Garden City 318620 86 1 5 7 1
43 56
D 10 Jamaica 317030 9 55 9 15 12 Black Majority 92 8
D 11 Bayside 317619 60 5 18 13 3
62 37
D 12 Astoria 315924 42 5 13 34 5
78 21
D 13 East Elmhurst 318053 15 9 16 57 3 Hispanic Majority 81 18
D 14 St. Albans 318613 22 55 4 13 5 Black Majority 82 17
D 15 Forest Hills 316488 59 5 15 17 5
63 36
D 16 Flushing 317432 24 3 48 21 4 Asian Plurality 68 31
D 17 Bushwick 317715 13 13 7 60 6 Hispanic Majority 87 12
D 18 Bedford-Stuyvesant 317273 26 51 2 17 4 Black Majority 90 9
D 19 Canarsie 317538 28 52 3 14 3 Black Majority 83 17
D 20 Brooklyn Heights 318797 25 51 3 18 3 Black Majority 93 6
D 21 Prospect 318898 19 51 5 22 3 Black Majority 92 7
D 22 East Flatbush 317890 21 56 6 12 5 Black Majority 85 14
R 23 Homecrest 316816 81 1 11 6 2
33 67
D 24 Brighton Beach 317711 56 6 21 13 3
55 44
D 25 North Shore 318201 49 13 10 24 4
66 34
R 26 Arden Heights 323582 84 1 6 7 1
37 62
D 27 East Village 311559 45 6 27 19 3
84 15
D 28 Upper East Side 309905 83 3 8 5 2
75 24
D 29 Upper West Side 310495 73 5 8 11 2
85 14
D 30 Spanish Harlem 309111 22 23 3 50 2 Hispanic Majority 91 8
D 31 Bedford Park 308720 12 19 5 61 3 Hispanic Majority 90 9
D 32 Harlem 309836 2 61 1 33 2 Black Majority 97 2
D 33 Washington Heights 309056 22 12 4 60 2 Hispanic Majority 90 9
D 34 Soundview 309592 10 28 3 55 3 Hispanic Majority 90 10
D 35 Belmont 308704 21 21 3 53 2 Hispanic Majority 84 16
D 36 Mount Vernon 309493 14 60 2 20 4 Black Majority 92 8
D 37 Harrison 309361 73 7 5 13 2
61 38
D 38 Yonkers 309287 56 14 5 21 3
64 35
D 39 Ossining 309454 76 7 3 13 1
59 40
D 40 Clarkstown 317946 72 10 5 10 2
53 47
R 41 Carmel 321768 88 3 2 6 1
46 53
D 42 Poughkeepsie 317728 71 12 2 13 2
58 41
D 43 Kingston 320216 85 6 1 6 2
60 38
D 44 Troy 317388 86 6 3 3 2
58 40
D 45 Plattsburgh 317612 94 2 1 2 2
58 40
D 46 Albany 315314 84 9 2 3 1
63 35
R 47 Moreau 317511 96 1 1 1 1
49 49
R 48 Rome 317470 91 4 1 3 1
44 54
D 49 Syracuse 317634 80 12 2 3 3
62 36
R 50 Utica 317412 91 4 1 2 1
54 45
R 51 Herkimer 316544 96 1 0 2 1
45 53
R 52 Blooming Grove 319845 90 3 1 4 1
46 52
D 53 Ithaca 318178 87 4 3 3 2
61 38
R 54 Penn Yan 317011 95 2 0 2 2
47 51
R 55 Perinton 316789 92 3 3 2 1
51 47
D 56 Rochester 318289 60 26 3 9 2
72 27
R 57 Corning 317311 95 1 1 1 2
42 56
D 58 Amherst 317906 80 14 2 2 1
61 38
R 59 Hamburg 318084 94 1 1 2 2
49 49
D 60 Buffalo 317816 67 23 1 6 3
69 29
R 61 Batavia 318545 94 2 0 2 1
41 57
R 62 Greece 318537 93 3 1 2 1
46 52

Note, also, that I broke the state into four regions for simplicity: Upstate, Westchester/Bronx/Manhattan, Brooklyn/Queens/Staten Island, and Long Island. Here is another table that breaks down the numbers by region:

Region County Population Districts (+/-) 316280 (+/-)
Long Island Suffolk 1516544


Nassau 1349555


2866099 9 0 318323 0.6
New York City Queens 2320449


Brooklyn 2588844


Staten Island 496246


5405539 17 1 317972 0.5

Manhattan 1646675


Bronx 1415056


Westchester 961565


4023296 13 1 309484 -2.1
Ustate New York Rockland 301308


Other 7010169


7311477 23 -2 317890 0.5

As you can see from the table, I redraw the map so that NYC gained two seats at the expense of Upstate New York, while Long Island remained the same at 9 districts. The population of each district in each region is very equal with the greatest deviation of -2.1% below the ideal population in the region of Westchester/Bronx/Manhattan. The rest of the seats compensate for this by being about .5% above the ideal. Before discussing the statewide changes that would occur under this redistricting plan, first let me go through the four regions themselves…

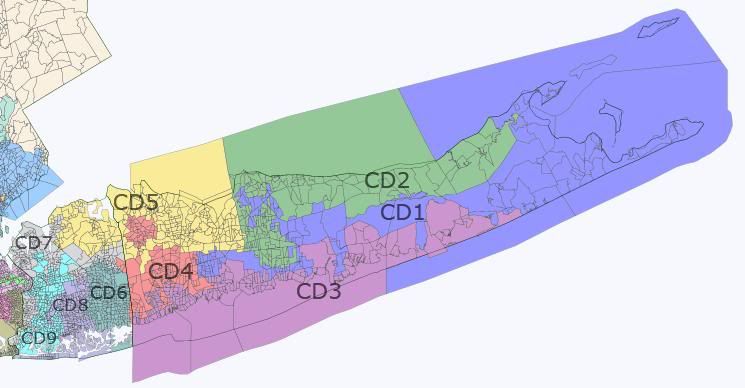
Long Island


District Pop. Center Pop. Wh% Bl% Asn% Hisp% Oth% O% M%

D 1 Hamptons 318633 66 11 3 17 2 62 38

R 2 Brookhaven 318569 89 2 2 6 1 49 51 Ken LaValle-1, Port Jefferson
R 3 Lindenhurst 318229 89 2 1 6 1 47 53 Lee Zeldin-3, Shirley Owen Johnson-4, West Babylon
D 4 Huntington 318189 60 17 3 18 2 63 36

R 5 Smithtown 318668 91 1 3 4 1 46 54 John Flanagan-2, East Northport Carl Marcellino-5, Syosset
R 6 Massapequa 318525 90 0 3 5 1 44 56

D 7 Great Neck 318243 67 12 8 11 2 64 35

D 8 Hempstead 318681 51 26 3 18 2 69 31 Charles Fuschillo-8, Merrick Dean Skelos-9, Rockville Centre
R 9 Garden City 318620 86 1 5 7 1 43 56 Kemp Hannon-6, Garden City Jack Martins-7, Mineola

(The table above is a portion derived from the table in the intoduction. However, included in this table and the three that are to follow it, the number for each district has a link to a picture of that district's new boundaries. Also, I included the incumbent senators in whichever district that they would live in if my map went into affect. Each senator's party is denoted by the font color, and the data entries include the number district that each senator currently represents in the State Senate, as well as where they live and a link to their official biographies.)

Long Island has been the province of Republicans in the New York State Senate for many decades. At the height of the Democratic wave in 2008, Long Island elected only two Democratic senators out of nine total. Both of them lost their seats in this last election, returning Long Island to its usual position of having only Republicans represent them in the State Senate. It's not as though Long Island is that conservative overall — indeed, all but one of the current nine senate districts in Nassau and Suffolk Counties was won by Obama. Republicans have been very effective in diluting Democratic votes, thereby allowing many independents who fear a complete Democratically-controlled Albany to elect Republican candidates for the State Senate.

Of the eight Obama-voting Long Island Senate districts, none of them were won by more than about 55%, which is a very managable percentage for incumbent GOP senators, including the new Majority Leader Dean Skelos, who hails from Rockville Centre in Nassau County. In this region, the goal was to be realistic about what could be achieved and very cautious in achieving it. I drew up four Democratic districts each at over 62% for Obama.

Three out of the four new Democratic districts that I created are left open for any Dem who wants them. The most Democratic district in the region — SD-8, based in Hempstead and Long Beach — is occupied by Skelos and Senator Charles Fuschillo. As the Black and Hispanic populations are spread throughout Long Island, each district retains their white majority.


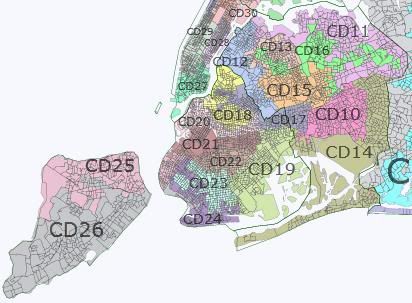
Queens, Brooklyn, and Staten Island


District Pop. Center Pop. Wh% Bl% Asn% Hisp% Oth%
O% M%


D 10 Jamaica 317030 9 55 9 15 12 Black Majority 92 8 Shirley Huntley-10, Jamaica

D 11 Bayside 317619 60 5 18 13 3
62 37 Tony Avella-11, Whitestone

D 12 Astoria 315924 42 5 13 34 5
78 21 Michael Gianaris-12, Astoria

D 13 East Elmhurst 318053 15 9 16 57 3 Hispanic Majority 81 18

Jose Peralta-13, East Elmhurst


D 14 St. Albans 318613 22 55 4 13 5 Black Majority 82 17 Malcolm Smith-14, St. Albans

D 15 Forest Hills 316488 59 5 15 17 5
63 36


D 16 Flushing 317432 24 3 48 21 4 Asian Plurality 68 31 Toby Ann Stavisky-16, Flushing

D 17 Bushwick 317715 13 13 7 60 6 Hispanic Majority 87 12 Joseph Addabbo-15, Ozone Park Martin Malave Dilan-17, Bushwick
D 18 Bedford-Stuyvesant 317273 26 51 2 17 4 Black Majority 90 9


D 19 Canarsie 317538 28 52 3 14 3 Black Majority 83 17 John Sampson-19, Canarsie

D 20 Brooklyn Heights 318797 25 51 3 18 3 Black Majority 93 6 Valmanette Montgomery-18, Boerum Hills Eric Adams-20, Crown Heights Daniel Squadron-25, Brooklyn Heights
D 21 Prospect 318898 19 51 5 22 3 Black Majority 92 7 Kevin Parker-21, Flatbush

D 22 East Flatbush 317890 21 56 6 12 5 Black Majority 85 14


R 23 Homecrest 316816 81 1 11 6 2
33 67 Martin Golden-22, Bay Ridge

D 24 Brighton Beach 317711 56 6 21 13 3
55 44 Carl Kruger-27, Sheepshead Bay

D 25 North Shore 318201 49 13 10 24 4
66 34 Diane Savino-23, Staten Island

R 26 Arden Heights 323582 84 1 6 7 1
37 62 Andrew Lanza-24, Great Kills

While much of Staten Island remains a stubborn Republican bulwark, Queens and Brooklyn voted overwhelmingly for Barack Obama in 2008. They are home to most of New York City's black population, as well as significant Hispanic and Asian communities. Since this area of the state is so heavily Democratic, the overriding goal for this region was not to squeeze out more Democratic seats, but to strengthen a few shaky ones and create new Voting Rights Act (VRA) districts wherever possible. Under my plan, this region would gain one additional seat as a result of new population estimates given by the Census Bureau. 

This map preserves the two African-American majority districts in Queens and adds a fifth black majority district to the four that already exist in Brooklyn. One of the best things about this map is that it creates an Asian plurality district that is based in Flushing and spread throughout many parts of Queens. The 16th district is currently represented by Sen. Toby Ann Stavisky, but if the Asian community were able to unite around a consensus candidate, she could well be displaced in a primary. I found it impossible to make the 16th District any more heavily Asian than 48%, but the next largest racial community was 24% of the population, so if Stavisky were to retire, this would most likely go to an Asian candidate. It also preserves the two Hispanic majority districts in Queens and Brooklyn.

The recently-flipped 11th and 15th Districts would be strengthened for the Democrats. Carl Kruger's 27th district in southern Brooklyn would be radically changed into the 24th district, both strengthening our vote there and also allowing for a primary challenge to the less-than-venerable “Amigo.” At 55% for Obama, the 24th is one of two districts that I created below the magic 58% line that I still counted in the Democratic column — largely because presidential voting patterns in southern Brooklyn are volatile and not necessarily indicative of a broader ideological differentiation. What Republican-leaning communities that do exist here would be consolidated into two large McCain majority districts: the 23rd in southern Brooklyn and the 26th in southern Staten Island, both of which are currently represented by Republican Senators anyway.


Manhattan, Bronx, and Westchester County


District Pop. Center Pop. Wh% Bl% Asn% Hisp% Oth%
O% M%

D 27 East Village 311559 45 6 27 19 3
84 15

D 28 Upper East Side 309905 83 3 8 5 2
75 24 Liz Krueger-26, Upper East Side
D 29 Upper West Side 310495 73 5 8 11 2
85 14 Thomas Duane-29, Upper West Side
D 30 Spanish Harlem 309111 22 23 3 50 2 Hispanic Majority 91 8 Jose Serrano-28, Spanish Harlem
D 31 Bedford Park 308720 12 19 5 61 3 Hispanic Majority 90 9 Gustavo Rivera-33, Kingsbridge Heights
D 32 Harlem 309836 2 61 1 33 2 Black Majority 97 2 Bill Perkins-30, Harlem
D 33 Washington Heights 309056 22 12 4 60 2 Hispanic Majority 90 9 Adriano Espaillat-31, Washington Heights
D 34 Soundview 309592 10 28 3 55 3 Hispanic Majority 90 10 Ruben Diaz-32, Soundview Jeffrey Klein-34, Throgs Neck
D 35 Belmont 308704 21 21 3 53 2 Hispanic Majority 84 16

D 36 Mount Vernon 309493 14 60 2 20 4 Black Majority 92 8 Ruth Hassel-Thompson-36, Williamsbridge
D 37 Scarsdale 309361 73 7 5 13 2
61 38 Suzi Oppenheimer-37, Mamaroneck
D 38 Yonkers 309287 56 14 5 21 3
64 35 Andrea Stewart-Cousins-35, Yonkers
D 39 Ossining 309454 76 7 3 13 1
59 40

This region, encompassing Manhattan, Bronx, and Westchester County, is the most strongly Democratic area in one of the most Democratic-leaning states in the Union. It is home to the largest Hispanic communities in the Northeast United States — mostly Peurto Rican, but also Dominican, Mexican, and other Latin American heritages. The white communities here also tend to be much more liberal than their counterparts in Brooklyn, Queens, and Staten Island. That is especially the case in Manhattan and Westchester, which are home to many educated urban white professionals.

All twelve districts here are represented by Democrats in the State Senate. That would stay the same under my plan, except for the addition of a thirteenth Democratic district. This is the second distric that comes at the expense of Upstate New York — the other one being in Brooklyn.

Both majority African-American districts would remain intact. The map also adds another Hispanic-majority district to the four that currently exist.

Upstate New York


District Pop. Center Pop. Wh% Bl% Asn% Hisp% Oth% O% M%

D 40 Clarkstown 317946 72 10 5 10 2 53 47 David Carlucci-38, Clarkstown
R 41 Carmel 321768 88 3 2 6 1 46 53 Greg Ball-40, Patterson

D 42 Poughkeepsie 317728 71 12 2 13 2 58 41 Bill Larkin-39, New Windsor Stephen Saland-41, Poughkeepsie
D 43 Kingston 320216 85 6 1 6 2 60 38

D 44 Troy 317388 86 6 3 3 2 58 40 Hugh Farley-44, Schenectady
D 45 Plattsburgh 317612 94 2 1 2 2 58 40 Betty Little-45, Queensbury Patty Ritchie-48, Heuvelton
D 46 Albany 315314 84 9 2 3 1 63 35 Neil Breslin-46, Albany James Seward-51, Milford
R 47 Moreau 317511 96 1 1 1 1 49 49 Roy McDonald-43, Stillwater
R 48 Rome 317470 91 4 1 3 1 44 54 Joseph Griffo-47, Rome
D 49 Syracuse 317634 80 12 2 3 3 62 36 David Valesky-49, Oneida John DeFrancisco-50, Syracuse
R 50 Utica 317412 91 4 1 2 1 54 45

R 51 Herkimer 316544 96 1 0 2 1 45 53

R 52 Blooming Grove 319845 90 3 1 4 1 46 52 John Bonacic-42, Mount Hope
D 53 Ithaca 318178 87 4 3 3 2 61 38 Thomas Libous-52, Binghamton Michael Nozzollio-54, Fayette
R 54 Sodus 317011 95 2 0 2 2 47 51

R 55 Perinton 316789 92 3 3 2 1 51 47 James Alesi-55, East Rochester
D 56 Rochester 318289 60 26 3 9 2 72 27

R 57 Corning 317311 95 1 1 1 2 42 56 Thomas O'Mara-53, Big Flats Catharine Young-57, Olean
D 58 Amherst 317906 80 14 2 2 1 61 38 Tim Kennedy-58, Buffalo
R 59 Hamburg 318084 94 1 1 2 2 49 49 Pat Gallivan-59, Elma Mike Ranzenhofer-61, Clarence
D 60 Buffalo 317816 67 23 1 6 3 69 29 Mark Grisanti-60, Buffalo
R 61 Batavia 318545 94 2 0 2 1 41 57

R 62 Greece 318537 93 3 1 2 1 46 52 Joe Robach-56, Greece George Maziarz-62, Newfane

Here more than anywhere else in the state, Republicans dominate in local and state politics. Recently, Democrats lost five of their ten Upstate congressional districts. This is also where Republicans picked up two Senate seats and gained about a half-dozen Assembly seats last fall. Nevertheless, there are still many strongly Democratic areas of Upstate New York: mostly medium- and small-sized cities and liberal inner-suburbs that dot the landscape from the Hudson Valley to the Great Lakes. The goal was to consolidate those areas and churn out as many new Democratic districts as possible. Here again, as in Long Island, the minority ethnic populations are too spread out to create any VRA districts. Instead, this is where the great bulk of Republican Senate seats would hit the buzz-saw.

The region as a whole would lose two seats, mostly from the equalization of populations in each Senate district — which Republicans largely disregarded during the last redistricting ten years ago — as well as the much greater population growth downstate.

I was able to get about half of these 23 districts in the Democratic column. The 40th District, based in Rockland County, is the second of only two districts in this entire map (the other being in southern Brooklyn) that I counted as a Democratic district even though Obama's vote there was less than 58%. The reason is that this seat was one of very few elected offices around the country that Democrats actually gained from the Republicans in this last election. The seat would also bolster its Democratic vote through redistricting, so I figured, if David Carlucci could pick it up for the Dems in a year like 2010, odds are pretty good that he'll be able to hold it in a lot of other political environments.

I was able to get ten of these districts at over 58% for Obama. One of the most certain Democratic gains under this plan would be my native 56th Senate District, based in the City of Rochester and the Town of Brighton. Republican Senator Joe Robach has vexingly been able to hold onto this district for years despite the fact that it voted by a two-to-one margin for Barack Obama in 2008 (66%-33%). Under this plan, Robach's hometown of Greece would be removed from the 56th and replaced by the Democratic-leaning suburbs of Gates and Irondequoit.

The four seats that we do hold here would be strengthened. The 60th District, which is even more Democratic district than the 56th, voted out a Democratic incumbent last fall. This district would remain largely unchanged in the hope that a different Dem might likely be able to win it back from freshman Republican Senator Mark Grisanti.

As is convention when State Senate seats are redistricted in Upstate New York, I left every town intact. In addition, only two cities are divided between different districts: Buffalo and Tonawanda (just south of Niagra Falls). The self-imposed requirement that towns be left undivided was a major constraint, but it would probably help a plan like this to survive a court challenge.


Summary:

A major drawback of this map is that without realizing it, I redraw the lines with no attention paid to which district each senator lives in. Hence, a lot of Democratic primaries and games of musical chairs would happen in this plan that might otherwise have been avoided. But, by the time I realized it, it was too late. In any event, many more Republicans get stuck together than Democrats, so that serves to counter-balance this problem.

This map pays tribute to the Voting Rights Act by creating three new majority-minority district: a new Black-majority district in Brooklyn, an Asian-plurality district in Queens, and a fifth Hispanic-majority district in the Bronx.

My plan also evens out the population disparities between regions by making every seat within only a few thousands residents off from the ideal population of 316,280 people per district. In applying a fairer division among the state's population and using new population estimates given by the Census, Upstate New York lost two districts to New York City.

I am confident that if this plan went into affect at the next election, Democrats would hold a large 43-19 majority in the New York State Senate for many years to come. But alas, Republicans won back this chamber last year and thus, it is not to be. However, I'm still convinced that with new population estimates, it will be extremely difficult for Republicans to redistrict another map that would allow them to retain the majority. Their luck has simply run out. They may be able to preserve many incumbents in Upstate and Long Island, but remember that Democrats only need to gain one seat for them to retake the majority (a 31-31 tie would allow Democratic Lt. Gov. Bob Duffy to act as the tie-breaker). And as I've shown through this analysis, downstate will have to gain two seats for the next redistricting plan to be in compliance with the Census.

It took many practice tries, but I believe this map provides the strongest possible plan for a large Democratic majority in the Senate that not only respects existing VRA districts, but also creates three new ones. In short, this is the ideal Democratic redistricting plan for the New York State Senate.

California: What Could Have Been !

I was almost done drawing this map last year when I realized that the passage of Prop 20 is a likely outcome.  A Democratic gerrymander of California then became moot of course and so I never finished.  However, I recently thought it would be neat to post anyhow, as many of the maps posted here are only theoretical and don’t have a chance of becoming reality (or anything close to reality).  So I finished my map – but perhaps not taking as much care as when I first started.  Hence, I should note that the area around Los Angeles and Kern Counties was drawn “after the fact” and is therefore not as “thought out” as other parts of the map.  

Nevertheless, I still tried to be true to my original goals: creating as many solid Democratic seats as possible, increasing the number of Hispanic and other minority-majority districts, and making sure that all Democratic incumbents kept as much of their current territory as possible.  The resulting map has only 7 Republican seats.  The other 46 districts are all at least 61% Obama districts — except for CA-3 and CA-4, which are 58% Obama (so really, 7 GOP, 2 districts 58% Obama, and 44 districts at 61% or more Obama) … I figured CA-3 and CA-4 could be left at the lower level as those two districts were almost won by Democrats back in 2008 even as their current configurations are a lot more Republican, and also because the percentage change between 2004 and 2008 was not as great in this part of California as it was in the rest of the state.  Hence, under my estimates, John Kerry would still have been the winner in my new versions of CA-3 and CA-4, as he would have been the winner in all the 61%+ Obama districts created.

I figured I would post this map despite the fact that a commission will now be drawing the districts.  I believe that it’s still instructive in some respects.  For example, it’s interesting to me that despite “packing” Republicans into just 7 districts, McCain got 60%+ of the vote in only 1 of those — meaning that the GOP brand is quickly thinning out in the state, and in the near- and mid-term future, even a non-partisan plan of the state is likely to result in a relatively small number of Republican representatives.  Another good example of how thinly-spread the GOP is becoming may be found by looking at San Diego Co. — historically one of the more Republican parts of the state.  In this map, I was able to draw three relatively compact 61 Obama/37 McCain districts (CA-50, 51, 53) wholly confined to the area around the city of San Diego/coastal part of the county, while drawing two other 61/62% Obama districts, both over 60% hispanic, that take in other significant chunks of the county (CA-47, 49).  The only GOP district left in San Diego Co. would be CA-52.

Another interesting thing was that the more minority-majority districts I created, the more Democratic districts I wound up with overall.  This may seem counter-intuitive at first, and certainly doesn’t fit the pattern in most other parts of the country, where the creation of more minority-majority seats means less Democratic seats overall.  Apparently, in California the minority population is pretty thoroughly or effectively spread out these days (no longer just concentrated in urban enclaves) that wherever you draw a district, there’s a good chance it will be a minority-majority district — even if a single ethnic/racial group does not form a majority.  In fact, in this map 30 out of 53 districts are minority-majority.  It appears that much of the hispanic population in the state is geographically interspersed among the GOP population.  Hence, even (and especially ?) when non-partisan districts are drawn much of the two populations will “mix” resulting in, overall, more Democratic districts as the highly-Democratic hispanic population will make the new compact districts lean more towards that side of the political spectrum (this is especially true over the long-term, and especially true if the GOP continiues to alienate hispanics with their policies).

Basically, the map makes the districts of many white Democratic incumbents (like Berman and Filner) more white, while many GOP seats are turned into new hispanic-majority seats.  Each Democratic incumbent save two also gets to keep at least 30% of his or her current constituents (in most cases, the percentage is significantly higher; the only exceptions are Chu — where I only keep her hometown area, but the new asian-plurality district is nevertheless drawn to her advantage; and, Napolitano, who gets to keep a bit under 30% of her constituents — but her new district is still centered around her hometown and is over 60% hispanic.  I should note that the district I “assign” to Linda Sanchez here is CA-39, and she currently represents slightly under 30% of the new district; however, Sanchez could just as well decide to run in what’s labeled as CA-40 on this map, where she would get to keep 50% of her current constituents, and her district would border her sister’s — this is all theoretical, of course, as this map will never happen !     …. I should also note that some districts here “look” as if they were completely “shifted” in terms of geography — Loretta Sanchez’s district is a good example — as the boundaries expand all the way into Oceanside in San Diego Co., and yet population-wise, the Congresswoman still gets to keep over 60% of her current constituents, as much of the population is concentrated in Santa Ana and Anaheim.)

The only districts which are 75% or more Obama are CA-8, CA-31 and CA-33.  The population deviation is  +/- under 1,000 persons.

Anyhow, here’s the map, and then a brief run-down of the districts:

Photobucket

Photobucket

Photobucket

Photobucket

Photobucket

Photobucket

Photobucket

Photobucket

Photobucket

The following districts are drawn to elect a Democrat:

CA-1 Thompson – 63 Obama, 35 McCain – above 70% white

CA-3 Lungren – 58 O, 40 M – above 60% white

CA-4 McClintock – 58 O, 40 M – above 60% white

CA-5 Matsui – 61 O, 37 M – above 50% white

CA-6 Woolsey – 70 O, 28 M – above 70% white

CA-7 Miller – 63 O, 35 M – above 50% white

CA-8 Pelosi – 85 O, 13 M – white plurality, above 30% asian

CA-9 Lee – 74 O, 25 M – white plurality, around 20% black

CA-10 Garamendi – 66 O, 33 M – above 50% white

CA-11 McNerney – 65 O, 34 M – above 50% white

CA-12 Speier – 74 O, 24 M – white plurality

CA-13 Stark – 73 O, 25 M – white plurality, above 30% asian

CA-14 Eshoo – 66 O, 33 M – above 50% white

CA-15 Honda – 68 O, 30 M – white and asian each around 40%

CA-16 Lofgren – 68 O, 31 M – white plurality

CA-17 Farr – 63 O, 35 M – above 60% white

CA-18 Cardoza – 61 O, 37 M – above 50% hispanic

CA-19 Denham – 61 O, 38 M – above 50% hispanic

CA-20 Costa – 61 O, 38 M – above 50% hispanic

CA-22 McCarthy – 61 O, 38 M – around 70% hispanic

CA-23 Capps – 61 O, 37 M – above 60% white

CA-24 Gallegly – 62 O, 37 M – around 70% white

CA-25 McKeon – 61 O, 37 M – above 50% hispanic

CA-26 Dreier – 61 O, 37 M – above 50% hispanic

CA-27 Sherman – 63 O, 35 M – above 50% white

CA-28 Berman – 63 O, 35 M – hispanic plurality (but less than current district)

CA-29 Schiff – 63 O, 35 M – white and hispanic each around 40%

CA-30 Waxman – 63 O, 35 M – above 50% white

CA-31 Becerra – 78 O, 20 M – above 65% hispanic

CA-32 Chu – 62 O, 36 M – asian plurality

CA-33 Bass – 75 O, 23 M – no dominant group, large numbers of whites, hispanics, blacks and asians

CA-34 Roybal-Allard – 73 O, 25 M – above 60% hispanic

CA-35 Waters – 72 O, 27 M – almost equal number of whites, blacks and hispanics

CA-36 Harman – 65 O, 33 M – white and hispanic each around 40%

CA-37 Richardson – 63 O, 36 M – significant numbers of hispanics, whites and blacks, with no group above 40% of population

CA-38 Napolitano – 62 O, 36 M – above 60% hispanic

CA-39 Sanchez – 66 O, 31 M – above 60% hispanic

CA-40 Royce – 62 O, 36 M – above 60% hispanic

CA-43 Baca – 64 O, 34 M – above 50% hispanic

CA-44 Calvert – 63 O, 35 M – hispanic plurality

CA-46 Rochrabacher – 61 O, 37 M – white plurality

CA-47 Sanchez – 61 O, 37 M – above 65% hispanic (asian pop. under 10%)

CA-49 Issa – 62 O, 36 M – above 60% hispanic

CA-50 Bilbray – 61 O, 37 M – above 50% white

CA-51 Filner – 61 O, 37 M – hispanic plurality (but less than current district)

CA-53 Davis – 61 O, 37 M – above 50% white

The following are the GOP seats:

CA-2 Herger – 40 Obama – 58 McCain – around 80% white

CA-21 Nunes – 36 O, 62 M – above 60% white

CA-41 Lewis – 38 O, 58 M – around 70% white

CA-42 Miller – 42 O, 56 M – around 60% white

CA-45 Bono Mack – 41 O, 57 M – around 70% white

CA-48 Campbell – 43 O, 55 M – around 70% white

CA-52 Hunter – 39 O, 59 M – above 70% white

3 Majority-Minority Districts in Arizona

Arizona is gaining a ninth congressional district this year, and it is certain to be based in the Phoenix suburbs where the population has exploded recently. Generally it is believed that the new district will be Republican-leaning as are most of the Phoenix burbs, but it is actually possible to draw a compact new majority-minority district in the Phoenix area.

Phoenix Metro Area:

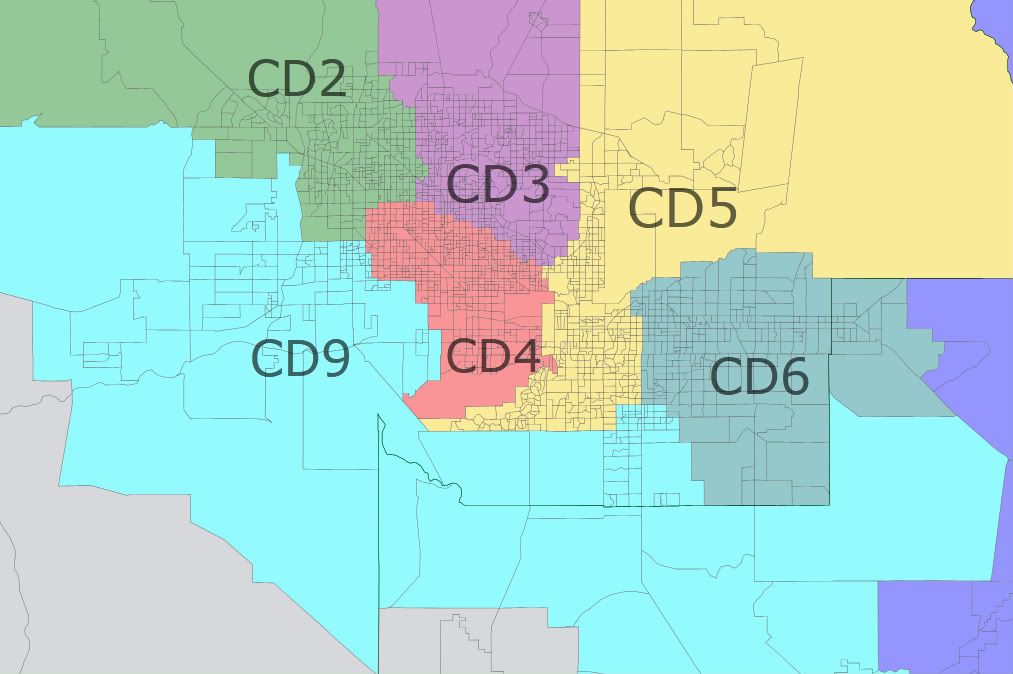
The new 9th district (light blue) is 39% White and 50% Hispanic. It encompasses east Phoenix areas drawn mainly out of the 2nd and 3rd districts with a little taken out of the 4th and 7th as well. To make up for that population loss in other districts, the 4th has taken on Tempe, which increases the white percentage in the district to 29% but those are mostly liberal white voters so it should be okay. The 3rd takes on some areas that had previously been in the 5th, and the 5th grabs Chandler from the 6th, evening out the population in the Phoenix area. Some other minor changes have taken place across the state to even out population changes, but nothing major that would change the partisan balance of power in these districts.

This new plan actually includes some things that conservatives could like. After losing Tempe and gaining Chandler, the previously swingy 5th district is now probably solidly conservative. The 2nd and 3rd have lost a considerable portion of their Hispanic populations, making them much safer for the GOP (this should help scandal-tainted rep Ben Quayle). And the new 9th is probably competitive for the GOP in a good year. I would consider it slightly leaning D, but with the gap in turnout between white and hispanic voters and the fact that SB 1070 may have changed the racial demographics slightly here since the census was taken mean that in a low-turnout midterm election this district may be close to a tossup. The only reason that the GOP would have reason to fight this district is that there is a possibility Rep Trent Franks has been redistricted into the 9th district under this map. He lives in Glendale, most of which is in this new 9th district. I highly doubt he would want to run in a majority-minority district, so he would probably fight this plan heavily. If this was a VRA-obligation, however, that might not matter.

As to whether the VRA requires this district, it may be open to interpretation. Important to note is that Arizona is one of the states that requires section 5 preclearance by the DOJ, so the Obama admin has a good chance to argue for the creation of a new majority-minority district if they wanted to. This district is pretty compact, but I think that Arizona could still make the case that you have to go out of your way to draw something like this. Overall I’m not sure if the Obama admin wants to challenge this in court, and I’m not sure if the Roberts court would be receptive to arguments for a new VRA district in Arizona, but I hope that the Obama admin at least tries here, because there is a chance they could succeed.  

Random Antics: Hypothetical Connecticut Redistricting

Well, I started thinking about ways the Connecticut Democratic Party can get Ted Kennedy, Jr., into politics without potentially screwing over Rep. Chris Murphy of CT-05, the bold young soul in a bid for the Senate seat held by retiring independent Sen. Joseph Lieberman. And I thought, “Well, what about starting him off with a nice House seat?” And that evolved into wondering about exactly how to negate the fact that CT-05 represents a pickup opportunity for the Republicans, provided they field a good candidate, now that Murphy is moving on to (hopefully) bigger and better things.

I came up with this map.

What I’ve done here is I’ve basically cracked the existing CT-05, giving pieces of it to CT-01 (pink), CT-04 (red), and the new south-central-based incarnation of CT-05 (blue). I can’t guarantee Rep. Jim Himes in CT-04 is going to be thrilled, considering he had a closer-than-expected reelection campaign against Dan Debicella (drawn into Rep. Rosa DeLauro’s CT-03 [purple] on this map); Rep. John Larson in CT-01 should be fine, considering the sizable Democratic tilt of Hartford. I think Democrats will have to concede one district as “fair fight” and hope the state’s strong Democratic proclivities and a mediocre Republican bench are enough to keep it in friendly hands, and I think they’d rather trust an incumbent member of Congress to hold it down rather than the likes of First Selectman Mary Glassman, whose ticket didn’t even come close to prevailing in the Democratic gubernatorial primary last year. Having two close districts, as they did last year, is a bit uncomfortable when the Republicans remain capable of winning statewide at least on the state government level.

I’m not too knowledgeable about Connecticut politics in particular. My idea here is that by drawing CT-03 a bit west, CT-04 a bit north, CT-01 over into the northwestern corner of the state (making it much more compact in the process), and CT-02 more into the north-central than the south-central part of the state, I could create a new, open-seat CT-05 without jeopardizing the Democrats’ control of the congressional delegation. This CT-05 is specifically drawn for Kennedy, who lives in Branford (just east of the new boundary with CT-03, in the vicinity of New Haven). With a seat tailor-made for his political debut, Kennedy might be less tempted to upset the apple cart by making a damn-the-torpedoes run at the Democratic nomination-a scenario the Democratic establishment in Connecticut and the DSCC would surely like to avoid.

SSP Daily Digest: 1/20

CA-Sen: Does Meg Whitman seriously not have anything better to do with her money? Rumors are bubbling up that she’s actually considering a return to politics… which, if it’s going to be in 2012, would mean a run against Dianne Feinstein (which, of course, would mean a run against the state’s most popular politician in a presidential year, instead of an open seat run in a down year for Dems).

MT-Sen: Republican businessman (and one-time LG candidate) Steve Daines did some serious fundraising in the last few months since announcing his candidacy, hauling in $225K since his announcement, with the majority of that money coming from in-state. The main target he’s probably trying to scare with that money isn’t Jon Tester (who has about $500K CoH), but Republican Rep. Denny Rehberg, who’s usually the GOPer most associated with this race but has sounded noncommittal so far; I’m sure Daines would like to see Rehberg stay out of the Senate primary. Rehberg has $594K. One other Montana Senate item, although it hopefully won’t be an issue any time soon: the Montana legislature is considering whether, in the event of a Senate vacancy, to switch over from gubernatorial appointment to a fast special election instead.

OH-Sen: Quinnipiac has a poll today of the Ohio Senate race, but, like their Pennsylvania poll last month, the lack of an obvious Republican opponent means the matchup is just against Generic R. Sherrod Brown does pretty well against G.R., especially considering that actual named candidates tend not to do as well as generics at least at this stage in the game; Brown leads 45-33, and has an approval of 45/25. This is definitely a race where we shouldn’t start celebrating short of the end zone, though, considering that PPP recently found Brown in much more of a pickle, and even Qpac points out he’s far from the 50% mark and in “decent but not overwhelming” shape. The Cleveland Plain Dealer’s writeup of the poll spends a lot of ink talking up Rep. Steve LaTourette as a possible GOP candidate; while he’d bring some geographic strengths to the race that other GOPers might not, there hasn’t been any indication so far that he’s interested.

RI-Sen, RI-Gov: Sheldon Whitehouse looks like he’s dodged at least one credible candidate in 2012; John Robitaille, who came close in the 2010 gubernatorial race (although that was only because of the center-left vote split between Lincoln Chafee and Frank Caprio) and has expressed interest in running for something else, now seems focused on a retry in the 2014 gubernatorial race. Partly, he admits, that’s because running statewide as a Republican in Rhode Island in a presidential year would be a kamikaze mission.

WV-Gov: SoS Natalie Tennant has gotten endless mentions as a likely gubernatorial candidate, but with the clock ticking to the now-only-nine-months-away special election, she’s made her candidacy official as of yesterday.

FL-25: OK, here’s a trivia question for you all (which I genuinely don’t know the answer to)… which House freshman holds the record for the shortest partial term, before having to resign in shame? (I’m wondering if Eric Massa actually holds the record, but I’d bet there’s some historical example of someone accomplishing it in less than one year.) The reason I ask is that things seem to be moving into a new phase in the investigation into David Rivera, and whether piles of money paid from a dog track that he helped, to his mother’s marketing company, found their way into his pockets. The Miami-Dade County’s state’s attorney, Katherine Fernandez Rundle, just turned the case over to the Florida Dept. of Law Enforcement. Although that sounds ominous, some observers are seeing the move as a downgrade, though, as the FDLE may not devote the same level of resources to it; Rundle has been viewed as a possible Dem challenger in this district, and may be punting the case to avoid it becoming a liability for her later.

MI-15: Rep. John Dingell (84 years old) says he’ll be back for an unprecedented 30th term in the House, running again in 2012. One important detail, though: whatever district he’s running in, it won’t be the 15th next time, as Michigan is about to lose a seat. Dingell has survived multiple bad redistrictings over the decades, including beating fellow Democratic Rep. Lynn Rivers in a 2002 primary mashup. (Thanks to Greg Giroux, we know now that Dingell will pass Robert Byrd in all-time legislative service in June of 2013.)

Mayors: Two mayoral races are in the news today, although both aren’t up for grabs until 2012. Two-term incumbent Buddy Dyer (who used to be the Democratic leader in the Florida state Senate) says he’s going to run for another term as mayor of Orlando. He also mentioned some vague gubernatorial aspirations. Also, Portland, Oregon will elect a new mayor in ’12; all the action will be in the Democratic primary, where it’s not certain that Sam Adams (damaged by a sex scandal several years ago) will run for a second term. One interesting possibility mentioned: former Senate candidate Steve Novick, who gained a lot of netroots attention during his ’08 Dem primary run, is seriously considering a run.

Votes: As you’re probably already aware, the Dems held the defections down to three on yesterday’s HCR repeal vote. It was the three likeliest suspects, given the combination of their dark-red districts and previous statements on the matter: OK-02’s Dan Boren, NC-07’s Mike McIntyre, and AR-04’s Mike Ross. UT-02’s Jim Matheson has the reddest district of any “no” vote, but he’s a member of leadership and may be sanguine about getting a better district out of redistricting next year (or just figuring that the worst is past).

Redistricting: Arizona legislative Republicans sort of succeeded with their quest to get three members of the state redistricting panel kicked off (on the grounds that they were serving in other political offices); however, it was a partial success because only two of the three challenged members got kicked off by the state supreme court and the one they were really targeting the most didn’t get kicked off. Also, if you’re in Virginia and you’re a college student, the state is having a redistricting contest. No word on whether you absolutely have to be part of a team or can do it individually, but the winners get a cash prize and get to present the design for new congressional and legislative maps to the Governor’s entirely-nonbinding advisory panel. (Actually, it looks like it’s too late to start a team if your college doesn’t already have one, but your college probably already has a team which you might be able to join. See here for the details.)

Updated!! Arizona, take 2

Speak of the devil! After all my grumbling about the inadequacy of the county-level population estimates, it turned out that our friend Dave was about to produce new tract-level estimates from the American Community Survey. So here is a new district map of Arizona, with exactly the same concept (new exurban AZ9 drawn mostly from the overpopulated AZ2, AZ6, and AZ7) but actual district boundaries as opposed to rough guesses.

With the ACS estimates, the aggregate population was very close to the Census 2010 figure so the “phantom” problem disappeared. It also turned out that Nico was exactly right about how much the old districts had grown: AZ6 was first, followed by AZ2, AZ7, and AZ8. AZ3 and AZ4 weren’t far behind, and AZ5 was actually about 9k understrength.

Here is the new state-level map:
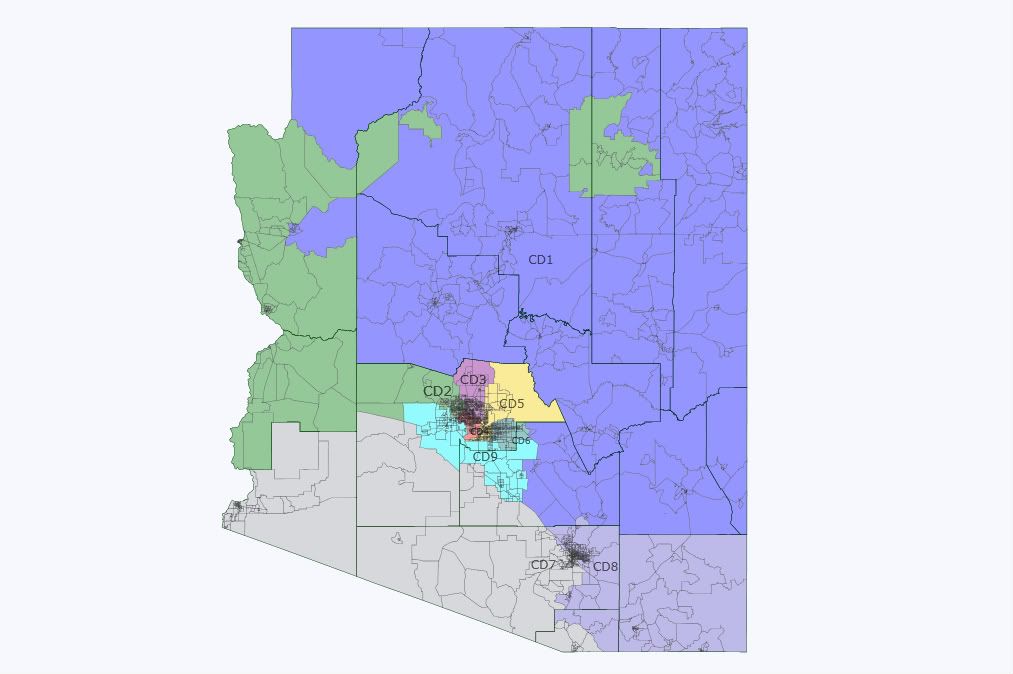
Photobucket

The Phoenix map:

Photobucket

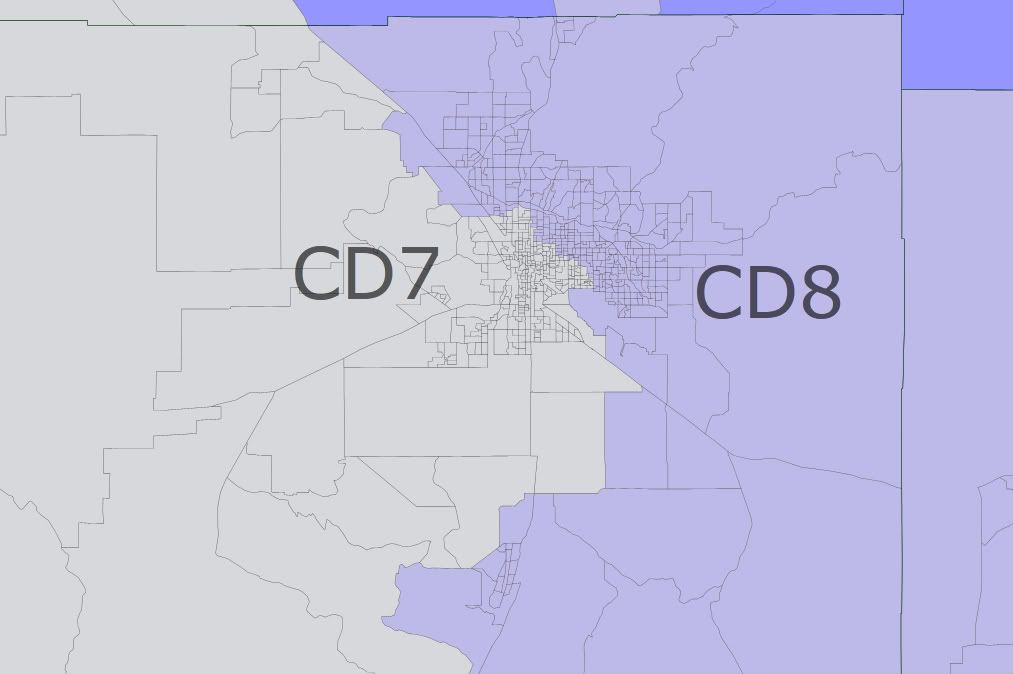
I drew a serious border between AZ7 and AZ8 instead of just guessing, so here is the Tucson map:
Photobucket

District notes:

AZ1: The boundaries were almost identical to the first map I drew, as it needed to take the strip and Kingman from AZ2 to hit its target. Ethnic mix: old 58 white/18 Hispanic/20 Native American, new 61W/15H/21N. Probably a bit more red now.

AZ2: Lost a bit more territory than I expected to the new AZ9. Ethnic mic: old 70W/20H, new 73W/18H.  

AZ3: Had to lose about 45k, and lost them all on its southern end to AZ4. No need to take any of AZ5, which was below its target. Ethnic mic: old 71W/20H, new 73W/18H.

AZ4: Also had to lose about 45k and AZ9 took a big bite out of its southwest corner, forcing it to move a bit north. Not as pretty as it was before, but still nice and blocky. Ethnic mic: old 22W/66H, new 24W/64H. I don’t think Ed’s worried.

AZ5: Only 9k under its target, it could basically stand pat. Swapped a few districts with AZ6 to make the lines cleaner. Ethnic mic: still 71W/17H.

AZ6: I decided to keep Apache Junction here since it’s really an extension of east Mesa and didn’t grow much in the 00s. As in the previous map, it loses the rest of its Pinal piece to AZ9 and its Chandler piece (this time mostly to AZ9 instead of all to AZ5), and retains Gilbert, Queen Creek, and almost all of Mesa. Ethnic mic: old 71W/21H, new 72W/20H.

AZ7: It had to keep a bigger than expected piece of Pinal, which resulted in AZ9 being pushed north. It had to take about 57k people from AZ8, and the current boundaries are a fairly straightforward northwest-southeast line as opposed to a strained attempt to jam as many Hispanics as possible into AZ7. I decided to stick with this and had AZ7 nibble at the edges of AZ8, although I restricted it to tracts that were at least 20% Hispanic. Ethnic mic: old 34W/55H, new 36W/54H.

AZ8: Looks much more like the current AZ8 than my previous map did, and keeps its Pinal tract now. The pieces it lost to AZ7 had the effect of reducing the Hispanic percentage in both districts. Ethnic mic: old 70W/21H, new 71W/20H.

AZ9: The previous AZ9 I drew turned out to not have enough peeps, so now it has to go deep into Chandler on the east side and well north of I-10 on the west side. Interestingly this district is majority-minority at 46% white, 41% Hispanic, and 6% black which is high for Arizona. It probably leans Dem at least in a presidential year.

(here is the original post in its entirety)

Short version: Exurban areas of Pinal and Maricopa counties that grew like a weed in the 00s are carved out of districts 2 (Franks), 6 (Flake), and 7 (Grijalva) to form a new district 9. The other 5 districts only get minor tweaks to meet population requirements for the most part.

This map is my interpretation of shamlet’s description of his own map with an exurban AZ9. My original concept was for AZ9 to stay entirely within the west valley of Maricopa county including the established cities of Glendale and Peoria along with some of the bubble areas to the south, pushing AZ2 to the west to pick up Yavapai county and forcing AZ1 (Gosar) to pick up almost all of Pinal county. I decided that I liked shamlet’s concept better, as mine would have been more disruptive to the current map and would have likely resulted in AZ1 being dominated by exurban Pinal at the expense of its far-flung, highly diverse rural communities.

Some words of warning: The boundaries between the districts are approximate, not absolute. The population estimates in the redistricting app only go down to the county level. This is fine for a state like Iowa where no county is big enough to contain as many as one district, but it causes trouble in Arizona which has just 15 counties, with nearly 80% of the population in just two of them! The distribution of population within Maricopa and Pima counties is uncertain, especially in Pima where nearly 90% of the population is either in Tucson or in unincorporated areas. I drew the lines based on my best guess. A further complication is that the 2010 census shows the state with 6.39m people, well below the 2009 estimate of 6.60m. This map is based on the 2009 estimates for cities and counties, which somewhere include 200k people who apparently aren’t really there. I suspect that a disproportionate number of these phantom people are in the bubblicious AZ9, but they could be anywhere. It will be interesting to see the 2010 census figures for cities and counties, but we don’t have those yet, so…

Here is the statewide map, with the usual color scheme.
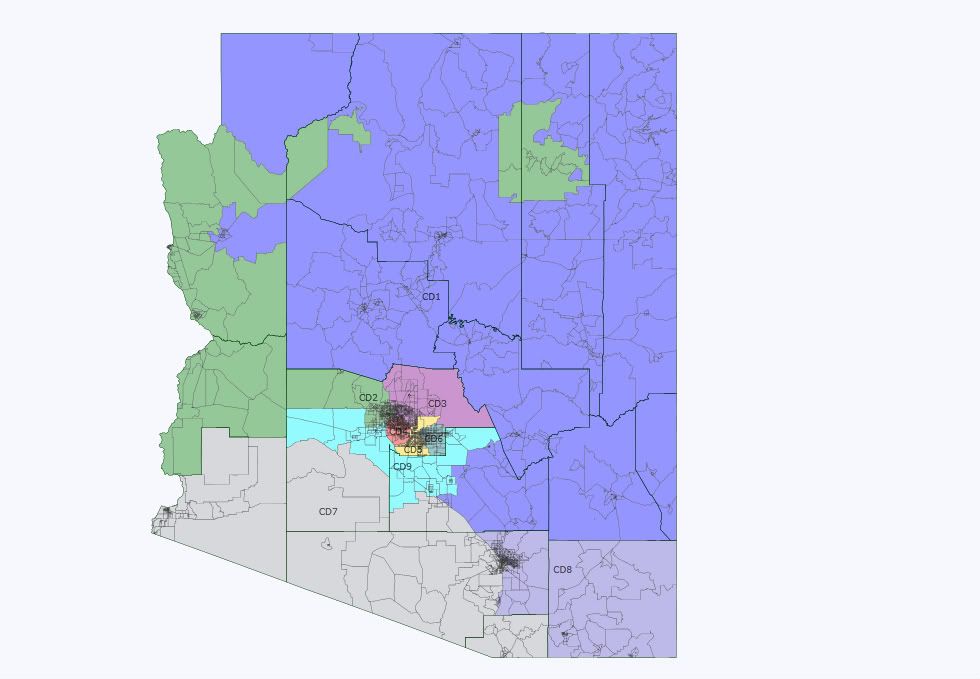
Arizona

And here is the close-up of the Phoenix area.
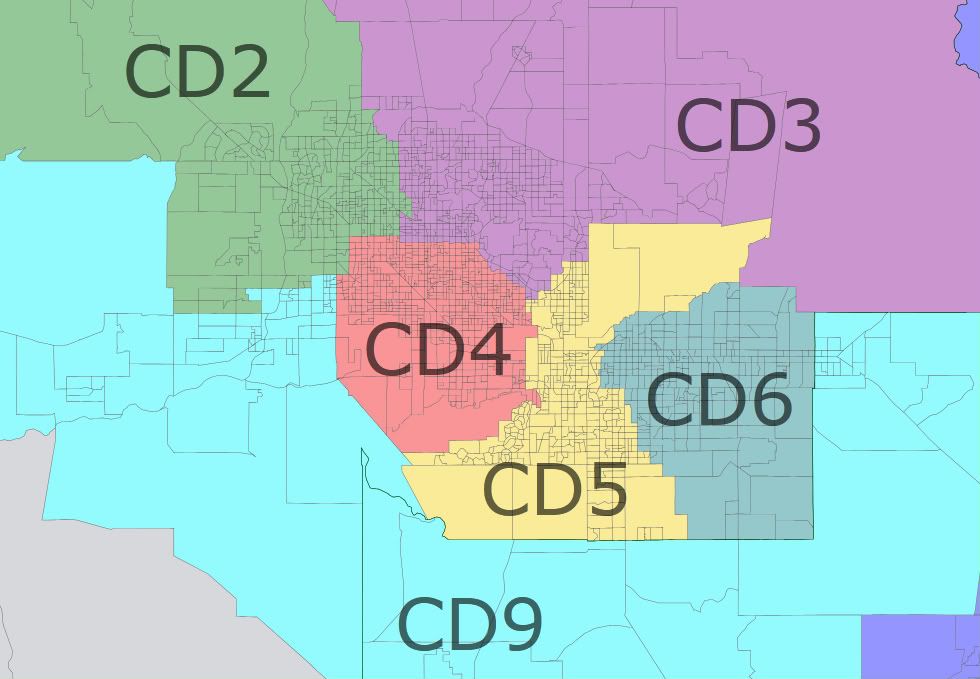
Phoenix area

Now for notes on the individual districts. The target population for each is 713k.

AZ1 (blue): Paul Gosar’s district has an estimated population of 619k (less any phantoms) in its core counties of Yavapai, Coconino, Apache, Navajo, Gila, Graham, and Greenlee. That means it probably needs about 100k from somewhere else, either Mohave or the less populated eastern end of Pinal. I’m  guessing that they would get about that amount from the Kingman area and the “strip” north of the Canyon in Mohave, and from eastern Pinal which has a lot of old mining towns that fit well with the rest of the district. Changes: loses some of south-central Pinal to AZ7, picks up Kingman and strip areas from AZ2 and one Pinal precinct from AZ8 (Giffords).

AZ2 (green): Trent Franks’ district will have to shed a lot of people, but even after losing the Kingman and strip areas and the (formerly?) fast-growing areas of southwest Maricopa, it retains its west valley base with Peoria, most of Glendale, Surprise, and the Sun Cities. I moved La Paz county here from AZ7, as with 33% of its population over age 65 it fits better in AZ2. The boundary shown here between AZ2 and AZ9 is just a guess and could move north or south depending on the final counts. As always, the Hopi reservation is separated from the surrounding Navajo reservation and attached to AZ2. I intended no change in the river-connector between the Hopi rez and the rest of the district, although it does not show up on the map.

AZ3 (purple): I drew Ben Quayle’s Phoenix-dominated district to lose some of its southernmost precincts to AZ4 (Pastor) and absorb north Scottsdale and Fountain Hills from AZ5 (Schweikert), but it appears that it grew faster than AZ5 did. The increase in the House vote from 2002 to 2010 was 34% in AZ3 and just 25% in AZ5, so it’s possible that AZ5 could retain its northeast end. AZ3 could also lose some of its western end to AZ2 if it turns out that AZ2 is too small after AZ9 fills up.

AZ4 (red): Ed Pastor’s Phoenix district started the decade with by far the least undeveloped land of the 8 districts and probably had the least new construction, but its House vote increased by 39% from 2002 to 2010. Its people still vote at a rate far below the state’s other districts (just 92k total votes; the other  7 were all over 150k and 6 were over 200k), so this increase may represent increasing Hispanic participation more than population growth per se. The Census estimated that Phoenix grew just 21% between 2000 and 2009 and it seems likely to me that most of this growth was in AZ3, so I drew AZ4 to pick up some of AZ3’s southern precincts. This may be the cleanest-looking VRA district in the country, and I drew it to stay that way.  If it needs to contract, it would lose some of its southwestern precincts to the new AZ9.

AZ5 (yellow): I generally tried to keep existing districts together, but in this case I went for keeping cities together. David Schweikert’s district loses its Mesa piece to AZ6 while picking up the rest of Chandler. It now consists of Tempe (179k in 2009), Chandler (250k), Ahwatukee (85k in 2000 but probably more in 2009), and enough of Scottsdale (238k) starting from its south end to fill up to its quota of 713k.

AZ6 (teal): Jeff Flake’s district shrinks considerably and pulls entirely out of Pinal. It now consists of Mesa (467k), Gilbert (222k), and Queen Creek (26k) which put together would be big enough to make up a district if not for the phantoms. It could take Chandler-area precincts that I drew it losing to AZ5 as necessary to fill up.

AZ7 (gray): There are a total of 1.39m people (again, less any phantoms) in the four southern counties of Yuma, Pima, Santa Cruz, and Cochise, which is nearly enough to support two districts. Raul Grijalva’s district can pick up the necessary overage from the sparsely populated Gila Bend (I-8) section of Maricopa and the southwest corner of Pinal. If needed it could also retain La Paz, which as mentioned above is a poor fit for the district in my view. I don’t know where the border between AZ7 and AZ8 in Pima should go. I suspect that the AZ8 piece of Pima grew faster, as the House vote increase from 2002 to 2010 was 32% in the AZ7 section compared to 40% in the AZ8 section. I had AZ7 take the mostly-empty remaining sections of Santa Cruz and a few Pima precincts mostly west of I-10 or I-19 from AZ8.

AZ8 (blue-gray): I suspect that poor Gabrielle Giffords’ district won’t have to lose too much ground. Its House vote increased 41% from 2002 to 2010, but this may have been partly due to the 2010 race being a barnburner whereas 2002 was a snoozer. Cochise county grew 10% in the 00s and Pima 21%, and it’s likely that the AZ7 section of Pima grew at a decent clip so it seems probable that AZ8’s growth was less than its vote totals suggest. This district loses its small Pinal and Santa Cruz pieces and otherwise looks about the same as before.

AZ9 (toothpaste blue): The new district comes almost entirely from the fast-growing exurban Phoenix areas of southwestern Maricopa and western Pinal. It combines the Pinal portion of AZ6, some south-central Pinal areas of AZ1, the Phoenix-area piece of AZ7, and much of the southern end of AZ2. Its population centers include Avondale (85k), Buckeye (52k), Goodyear (64k), the city of Maricopa (45k) which oddly enough is in Pinal, most of unincorporated Pinal (161k), Casa Grande (44k), Apache Junction (34k), and probably a fair portion of unincorporated Maricopa (229k). This district may have the highest percentage of homes in foreclosure in the nation, and probably more phantoms than any of the other districts. As necessary it could take some of the eastern part of Pinal from AZ1 or the southern end of AZ2 to get up to full, which would affect the division of Mohave county between AZ1 and AZ2. Politically this district would probably start out tilt-R or lean-R but shift D as its Hispanic population starts to vote more. Flake won exactly 2/3 of the two-party vote in the AZ6 Pinal piece (30k total votes), although this was less than his districtwide margin. On the other hand, the very liberal Grijalva won 54% of the two-party vote in the AZ7 Maricopa piece (24k total). The current AZ2 is blood-red, but the piece it would lose to AZ9 is most likely younger, poorer, and more Hispanic than most of the rest of the district given that housing prices tend to be lowest in the furthest-out areas. Gosar did about as well in the Pinal section of AZ1 as he did districtwide, but the section that would be lost to AZ9 may differ from the section that would remain in AZ1.

Overall, Arizona presents a rare case where a new district can be created without fundamentally changing any of the existing districts. The state’s most explosive growth areas were nearly empty at the start of the decade and close enough together that combining them makes a compact, contiguous, sensible district that would pass muster in a commission-redistricting state. AZ2, AZ6, and AZ7 lose a lot of territory, but almost everyone who lived in one of these districts in 2002 and stayed put will still be in their old district. None of the current House members are likely to be helped or hurt much. Grijalva will be glad to be rid of La Paz but not so much his Phoenix-area precincts, and Gosar would like to pick up some of Mohave, but these are marginal changes.  

Thoughts?  

By what margin will Bob Shamansky win?

View Results

Loading ... Loading ...

South Carolina: 3 Minority-Majority Seats

This is a short diary for me – and one where I just wanted to “make a point.”

The diary is not really about South Carolina, although the state is used here as an example.  The VRA has been discussed in a number of diaries recently, but I think it’s important to revisit this issue again.  I previously did a post on South Carolina where two compact black-majority districts are created:

http://www.swingstateproject.c…

In this diary, three minority-majority districts are created.  Granted, they are not as compact (and would likely not pass a Supreme Court test as they are pretty clear racial gerrymanders), and the African-American percentage is only 49% in each district using the “new population estimate” in Dave’s Application.

Photobucket

Here’s a quick breakdown (pop. deviation is +/- 865 persons, btw).

Yellow – 49% black; 45% white (50%+ black; 46% white using “old” estimate)

Teal – 49% black; 46% white (51% black; 45% white using “old” estimate)

Gray – 49% black; 44% white (49% black; 47% white using “old” estimate)

Blue – 81% white; 10% black

Red – 78% white; 16% black

Green – 82% white; 10% black

Purple – 79% white; 14% black

Nevertheless, I am confident that, assuming the population figures under the Application are correct, it would be quite possible to make each district 50%+ African-American if precincts were split, lines were further refined, etc. — but that’s not really my point, as three black-majority districts will certainly not be drawn in South Carolina in 2012.

My point instead is that — if it’s basically possible to draw 3 black-majority seats in South Carolina — then it’s almost a “must” that just 2 are drawn, and furthermore, the Obama DOJ should not pre-clear any map of a state under the VRA where that map does not reflect the diversity of the state.

The above point should apply for states like South Carolina, which are gaining seats; states like Louisiana, which are losing seats; and states like Virginia, where the number of seats remains constant.  In a previous diary over a year ago, I drew 2 compact black-majority seats in Louisiana:

http://www.swingstateproject.c…

Just yesterday, roguemapper demonstrated how 6 compact minority-majority seats can be drawn in Georgia:

http://www.swingstateproject.c…

Here’s a map I did a while back (and posted only as an attachment to a diary comment) where Virginia gets 2 black-majority seats (and I have seen basically the same map done independently by several other posters on this site).  About 20% of Virginia’s population is African-American; yet there is currently only 1 black-majority district (out of 11) — where all the black population is “packed.”  Incidentally, using the “new population estimate”, the green district here (Hampton Roads area) is 51% black – 41% white, while the yellow district (Richmond and Southside area) is 52% black – 42% white.

Photobucket

Now, below is a really important map — that of geographic areas covered by the VRA:

Photobucket

I’m really not sure what the Obama DOJ will do regarding this issue, but I hope that they will take a strong stand in favor of drawing districts which reflect the diversity of the covered states, and will pre-clear only those maps which pass muster under that standard.

Daves Redistricting 2.0.5

Thanks to all of you who filled out the survey. Highlights below the fold.

But first, I uploaded a new version a couple of nights ago. The changes are:

— the New Way to color is the default (Old Way still there) and the annoying dialog box to choose is gone.

— Loading a 1.0 file that used special data is fixed. (If it’s TX you have to choose special or not; for NY and CA the app can figure it out.)

County lines are a little thicker Correction: coming soon.

— Biggest change: Better Population Estimates if you use Block Groups (for some states: all states coming soon)

— Also Block Groups are now there for all New England States, which give you much finer grain control (as many requested).

http://davesredistricting.com

On population estimates:

Astute observers have noticed that I’ve used County-Level population estimates (2008). Until recently, this was all that was available from the Census Bureau. This meant that any change in a county’s population had to be distributed among the voting districts or block groups. The app does this by assuming that every voting district/block group changed at the exact same rate. This is of course not the case and in counties where there has been significant growth the numbers can be off by a lot.

Recently the Census Bureau released 5-year American Community Survey data at the block group level. I’ve enabled the app to use this data, so if you choose Block Group instead of Voting Districts, and select Use New Pop Est, if the ACS data is on the server, the app will use it. That data is currently available for AZ,CA,FL,GA,MI,NJ,NY,OH,PA,TX and WA.

So, if you want to make more accurate maps, use Block Groups. Of course, there is no partisan data for Block Groups. There’s nothing at this time I can do about that.

Some quick highlights of the survey:

— 80% use Version 2.0 most

— Main like of Version 2.0 is seeing streets (50%); to a lessor degree save/open (30%), JPEGs (30%), Renumber (33%)

— Main dislikes of Version 2.0 ways to pan/zoom/color (each 30%), lose work (12%), move/resize labels (12%)

— To Color districts, 50% like New Way better, 30% Old Way, 20% never used New Way

— Mac Users (16%), Win7 (34%), Vista (24%), XP (26%)

— On the Rate features easy/hard/never used, the majority rated almost everything Very Easy or Easy. Exceptions (majority either neutral, hard or not used):

     – Renumber CD, Recalc CD labels, Area Views, Save As JPEG, Auto Assign Districts, Find CD Parts

Wish List:

(1) By Far: more election data.

(2): non-election data, faster.

(3): Allow LDs and CDs together, measure compactness, demographics for DragBox.

(4): output summary, shared maps, more Auto Assign strategies.

(5): Hide vote district boundaries, Help walkthroughs.

Other things that I’ve had requests for (either in the survey or email) include: the 1 CD states; ability to redistrict single counties; bring back city boundaries….

I’m going to look at the results more and I’ll do my best with all of these features.

I’m still working on trying to get funding to keep working on this. If you have any leads to non-profits who would support this, please let me know. And I’ll keep you posted on that front.

Thanks.