Redistricting Map for New Jersey

I drew this map assuming New Jersey will lose a congressional district. I tried to create 10 Democratic districts and 2 heavily Republican districts. I think at least 2 of the Democratic districts are shaky but the other 8 should hold fine. What I did was eliminate two Republicans, create a new Democratic district and strengthen Obama’s percentage in the 2nd district held by Frank LoBiondo. I did not want to go all out and try for an 11-1 Democratic delegation. My first priority was to strengthen shaky Democrats. The next map I will do will be either Georgia or Louisiana. I have not completely decided yet. I am also starting work on a Minnesota map. That is why I put a poll here to see which one you want me to do first. Safe Democrat/Republican means that the incumbent party solidly has a hold on that district. Likely Democrat/Republican means that the district appears solid but could become competitive. Lean Democrat/Republican means that the district is competitive but one party has a lead. Toss Up means the district is 50-50. With a tilt, it means that the party it tilts to has a 55%-60% chance of winning. You can view the maps at http://frogandturtle.blogspot….

District 1: Rob Andrews (D) (Blue)

This district goes far out of the former area. It takes in Salem and parts of Cape May and Cumberland Counties. I gave it all of Gloucester but took out a lot of Camden County. I kept in Camden and some other heavily Democratic towns to keep it safe for Andrews. Obama probably won around 60% of the vote here. The district contains Gloucester County and parts of Camden, Cape May and Cumberland Counties. The stats are 17% Black and 14% Hispanic with a 66% white population. Status is Safe Democrat.

District 2 Frank LoBiondo (R) (Green)

By taking out most of Cape May and adding part of Camden County, I hope I gave LoBiondo enough Democrats to be kicked out. I kept his home in this district so he would not be inclined to run against Rob Andrews and give him a tough race. I do not know who the challenger to Frank LoBiondo would be but I am sure the Democrats in Camden can find someone. I intended to make this district Democratic enough to throw out LoBiondo. The district contains Atlantic County and parts of Burlington, Camden, Cumberland, Cape May and Ocean Counties. I estimate that Obama won it with about 55% to 59% of the vote. The stats are 13% African American, 9% Hispanic and 73% White. Status is Toss Up if Lo Biondo runs, Lean Democrat if he bails out.

District 3 John Adler (D) (Purple)

Since he is a freshman Congressman who barely won in this district, my first priority was to protect him. I removed all of Ocean County from this district. I added part of Trenton and Mercer County which I estimate gives him an extra 15,000 to 20,000 vote margin for Obama. The margin for Obama in Burlington County is about 55,000 votes and Cherry Hill in Camden gave Obama a 10,000 vote margin. Even though I had to put a bit of Monmouth County in for population purposes, it should take more than 15,000 votes away from Adler. The district contains parts of Burlington, Camden, Monmouth and Mercer Counties. I estimate that Obama won here between 59% and 63% of the vote. The stats are 14% Black, 9% Hispanic and 69% White.  Status is Safe Democrat.

District 4 Chris Smith (R) (Red)

As much as I dislike Chris Smith, I decided to give him a safe Republican district. He was elected the same day Reagan was elected so I figured wherever I put him, he would hold his roots. I gave him most of Ocean County and southern Monmouth County, excluding Democratic precincts in Neptune and Asbury Park. I created this district to pack in all the Republicans so I could make the 2nd, 3rd, 6th and 7th more Democratic. The district contains parts of Ocean and Monmouth Counties. The stats for this district are 7% Hispanic and 85% White. McCain probably won this area with a margin between 56% and 60%. Status is Safe Republican.

District 5 Rodney Frelinghuysen (R) vs. Leonard Lance (R) vs. Scott Garrett (R) (Yellow)

Now wasn’t that a good idea to put three Republicans in the same district? There is no question that a Republican will win this district. It contains all of Sussex and Warren Counties with parts of Bergen, Hunterdon, Morris and Somerset Counties. McCain probably won this with 57% to 61%. The question is which Republican will win it? It looks pretty masterful, sticking all these Republicans in the same district. Both Lance and Frelinghuysen are moderates. My biggest worry is that Frelinghuysen will run in the 11th district which I created for a Democrat. With his moderate voting record, Frelinghuysen could win it if he faces weak opposition. If Lance and Frelinghuysen faced off, I think Frelinghuysen would win because he is more entrenched in his district and he has more of it in District 5 than Lance does. Garrett’s old district only contains Sussex and Warren Counties. That could be enough to win. The district contains Sussex and Warren Counties as well as parts of Bergen, Hunterdon, Morris, Passaic and Somerset counties. The stats are 86% White. Status is Safe Republican.

District 6 Frank Pallone (D) (Teal)

I had to remove some heavily Democratic areas such as Plainfield and part of New Brunswick mostly to strengthen the 7th and the 11th districts. Still, I kept enough Democratic areas in to keep the district strongly Democratic. Even though a lot of the district is in Monmouth County, I gave it Democratic areas like Neptune and Asbury Park. Since Pallone has been a Congressman here for awhile, he should be safe. I estimate that Obama won this district with about 58% to 61% of the vote. The district contains parts of Monmouth and Middlesex Counties. The racial stats for this district are 9% Black, 12% Hispanic, 13% Asian and 64% White. Status is Safe Democrat.

District 7 Rush Holt (D) (Gray)

Yes, this district looks very safe for Rush Holt. Maybe I went a little too far to protect him, giving him parts of New Brunswick and Plainfield, heavily Democratic areas. I just wanted to protect him enough to make sure Lance decides not to run against him. I think Holt can handle himself but Lance is a pretty strong competitor. Lance won by 8 points in an open seat race in 2008. He ran in the 7th district and Obama won it. I think half of Trenton and the heavily Democratic areas in Middlesex and Plainfield should keep Holt safe. The district contains parts of Hunterdon, Mercer, Middlesex, Somerset and Union Counties. I estimate that Obama won this district with about 57% to 62% of the vote. The stats are 16% Black, 14% Asian, 13% Hispanic and 56% White. Status is Safe Democrat.

District 8 Bill Pascrell (D) (Light Purple)

I’d like to tell Bill that I am sorry I had to push his district so far out into the not-so Democratic western Bergen County. Still, he should be fine in his district containing all of heavily Democratic Paterson and some other Democratic cities like Passaic. That portion of the county probably voted for Obama somewhere in the neighborhood of 50,000 votes. The Bergen County portion should not be more than 20,000 votes at the highest for McCain. This leaves Pascrell with a district that voted about 57% for Obama. This should be safe unless Scott Garrett surprisingly jumps into the race. That probably should not happen so it looks like Pascrell is safe for now. The district contains parts of Bergen, Essex and Passaic Counties. The racial stats for the district are 8% Black, 26% Hispanic, 7% Asian and 58% White. Status is Likely Democratic.

District 9 Steve Rotham (D) (Bright Blue)

Even though I extended his district far out to the New York border, I think Democratic margins in Hackensack and other Democratic areas will counter the Republican margins by a lot of votes. I think Obama won this district with 59% of the vote but I am not completely sure. This district should be safe for Steve Rotham. It contains parts of Bergen, Essex and Hudson Counties. The stats are 7% Black, 21% Hispanic, 16% Asian and 55% White. Status is Safe Democrat

District 10 Donald Payne (D) (Dark Pink)

I believe he is the safest Democrat in NJ. It was hard for me to keep it majority Black and I barely did. I wish I could give more of this district to strengthen the 8th and 11th but I could not because of the Voting Rights Act. It says that the 10th district will not be protected if it has less than a majority of a certain minority. I virtually tried to keep it the same as it is now. I estimate that Obama won here somewhere in the 85% range. The district contains parts of Essex, Hudson and Union Counties. The stats are 50% African American, 19% Hispanic, 5% Asian and 24% White. Status is Safe Democrat.

District 11 No Incumbent (Light Green)

My biggest fear is that Frelinghuysen will run in this district to prevent a challenging primary in the 5th. I tried to make the district as Democratic as possible and I removed Frelinghuysen’s home from it to discourage him from running here. I was careful to put in towns like Dover and Morristown which are heavily Democratic towns in Morris County. I also slipped this district into Essex County to take in areas that the 10th district did not contain. Even though the 10th contains all the heavily Democratic areas in Essex County, I still found room for some in the 11th district. I also extended it into Union County to take in the moderate suburbs of Westfield and Summit. Obama won them each by about 10 points. I was able to get part of heavily Democratic Plainfield into this district. It should be safe enough for a Democrat. The district contains parts of Essex, Middlesex, Morris, Somerset and Union Counties. I think that Obama won with 54%-56% of the vote here. The racial stats are 9% Black, 9% Asian, 11% Hispanic and 71% White. Status is Toss up/Tilt Democratic if Frelinghuysen runs. Status is Likely Democrat if Frelinghuysen does not run here.

District 12 Albio Sires (D) (Light Blue)

I designed this district to be a Hispanic majority district. I just barely succeeded. Still, Sires should be safe from a primary challenge from a non Hispanic candidate. This is a pretty long and thin district. It stretches from Perth Amboy in Middlesex County and goes up to the Hudson/Bergen County border. The district contains parts of Essex, Hudson, Middlesex and Union Counties. I estimate that Obama won here with about 74% of the vote. The racial stats are 9% Black, 7% Asian, 50.0% Hispanic and 33% White. Status is Safe Democrat.

By what margin will Bob Shamansky win?

View Results

Loading ... Loading ...

Wakin’ Up in Vegas: Redistricting Nevada

(From the diaries – promoted by DavidNYC)

Redistricting is popular around here, so I really don’t need to explain this any more. Here’s a plan for Nevada that’s 3-1. I wanted to protect Berkley and Titus, and create a 3rd Democratic district.

I crunched population data by census block for Clark County into precincts, and by census VTDs for Douglas, Lyon, and Nye Counties.

So here’s the map:

Data (both political and population) after the flip.

Here’s are closeups of Douglas and Clark/Southern Nye Counties:


And closeups of the Las Vegas area, the first with precincts and the second with incorporated cities and CDPs labelled.


County 2010 Pop Obama McCain Total Obama% McCain%
1st 670,860 129,024 73,473 206,859 62.40% 35.53%
Clark 670,860 129,024 73,473 206,859 62.40% 35.53%

The 1st (in red), this was designed to be Shelley Berkley’s. It captures a big chunk of Las Vegas, with parts of North Las Vegas, Paradise, Enterprise, and the majority of Spring Valley. At 62.4% Obama, not much has changed, about, only down a point or two. McCarran Airport and the Strip are in this district.


County 2010 Pop Obama McCain Total Obama% McCain%
2nd 670,894 148,278 105,987 259,926 57.06% 40.78%
Carson City 54,952 11,623 11,419 23,680 49.08% 48.22%
Clark 161,041 31,008 9,668 41,413 74.98% 23.38%
Douglas 18,566 4,031 4,894 9,127 44.17% 53.62%
Esmeralda 631 104 303 439 23.69% 69.02%
Lyon 4,809 463 1,223 1,732 26.73% 70.61%
Mineral 4,575 1,082 1,131 2,307 46.90% 49.02%
Nye 3,452 296 469 814 36.36% 57.62%
Washoe 422,868 99,671 76,880 180,414 55.25% 42.61%

This is the new Washoe-Clark district, in green. Starting in Washoe, it goes south, taking in as Lyon and Nye Counties as possible. It also takes in the better part of Douglas County and what it needs to connect to the south (44% Obama compared to 40% in the remainder). This district then goes into Clark County, taking the most Democratic precincts possible (74% Obama), including the majority-African-American parts of North Las Vegas (24% of the Clark part is Black). This district is 63% Washoe and another 24% more Clark, making for a 57% Obama district. This should be winnable for a Democrat, especially one from Washoe/Douglas like Jill Derby (who likely lives in this district, or just a bit outside it).


County 2010 Pop Obama McCain Total Obama% McCain%
3rd 670,842 120,321 67,581 192,355 62.56% 35.14%
Clark 670,842 120,321 67,581 192,355 62.56% 35.14%

This is Dina Titus’ district, in blue. It retains most of the population of Henderson and other suburbs of Las Vegas, like the vast majority of Sunrise Manor, and Paradise (not including the part with the Strip though). At 62.56% Obama, this is up 7%. This should set this district firmly out of reach for any comeback attempt by Jon Porter (or for any Republican, really).


County 2010 Pop Obama McCain Total Obama% McCain%
4th 670,832 133,939 164,642 305,560 43.84% 53.89%
Churchill 25,147 3,494 6,832 10,605 32.95% 64.42%
Clark 425,579 98,318 105,326 207,592 47.38% 50.75%
Douglas 26,336 6,641 9,754 16,777 39.58% 58.14%
Elko 48,011 4,541 10,969 16,019 28.35% 68.47%
Eureka 1,775 144 564 745 19.33% 75.70%
Humboldt 18,306 1,909 3,586 5,664 33.70% 63.31%
Lander 5,140 577 1,466 2,102 27.45% 69.74%
Lincoln 5,260 518 1,498 2,107 24.58% 71.10%
Lyon 50,239 7,934 10,927 19,359 40.98% 56.44%
Nye 44,835 6,858 8,958 16,494 41.58% 54.31%
Pershing 6,212 673 1,075 1,836 36.66% 58.55%
Storey 4,638 1,102 1,247 2,418 45.57% 51.57%
White Pine 9,354 1,230 2,440 3,842 32.01% 63.51%

All the Republicans have to go somewhere, and this is where they go. Taking in the remaining parts of Clark County (mostly empty desert except for the western parts of Las Vegas proper), this district grabs most of Nye, Eastern Douglas, and Northern Lyon counties and the remaining counties. Clark does still make up 63% of the district though. Perhaps in a testament to how much Clark County has changed, the Clark part is still 47% Obama. Overall, it’s 43.84% Obama. 4-0 would have been doable, but pushing it, in my mind.

Trying My Hand at Redistricting: Georgia Democratic Gerrymander Using DRA

My goals going into this were:

1.) To make sure the new district elects a Democrat.
2.) To shore up the three Central/Southern Georgia Democrats (especially Marshall and Barrow), not only for the incumbents but also Democrats in general if and when those seats come open.
3.) To create or expand our bench in our districts.
4.) To fuck with Phil Gingrey and John Linder to the best of my ability.
5.) To try my best not create an ode to the Flying Spaghetti Monster. 

To that end, I think I accomplished these goals.  My maps:


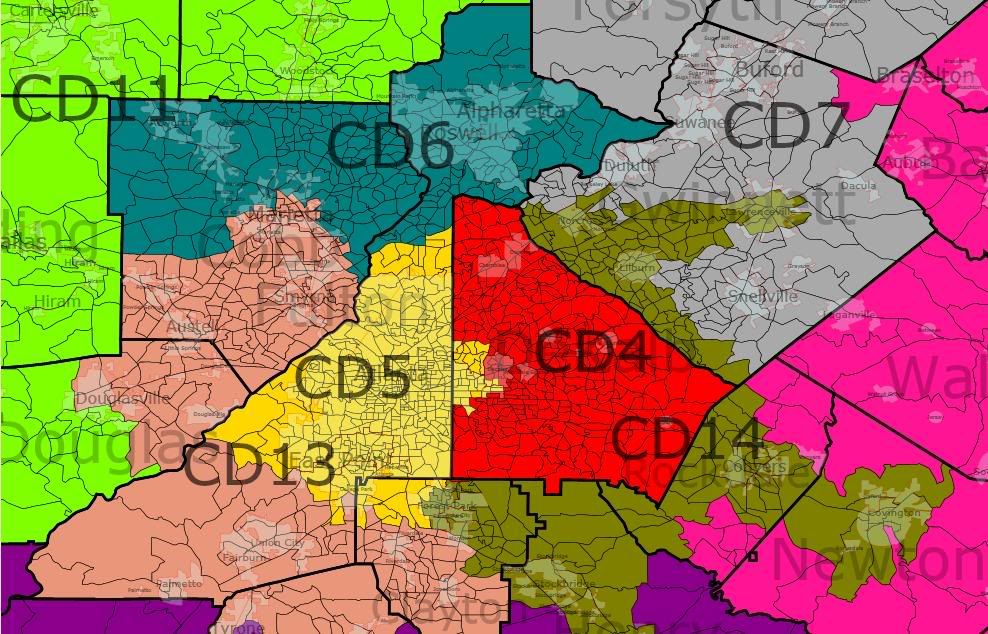
Atlanta Metro Area

1st District (Jack Kingston [R]) BLUE
New Demographics: 71.3% white | 20.8% black | .3% Native American | 1.1% Asian | 5.4% Hispanic | .1% other
Old Demographics: 72.8% white | 21.2% black | .2% Native American | .9% Asian | 3.9% Hispanic | 1% other
Old District: 72.6% white | 22.7% black | .3% Native American | .9% Asian | 4.1% Hispanic | .2% other
I used this as a dumping ground for Republican votes from the 8th and 12th districts while trying to remove Democratic areas for use in those districts.  Kingston gains several Republican counties to the north from the 12th, including much of Effingham County exchange for heavily Democratic Liberty County, some black(er) areas in McIntosh County as well as connectors in Chatham County.  He also picks up much of heavily Republican Laurens County as well as other parts from the 8th.  Surprisingly, the district gets a bit more diverse (and even more surprisingly, from Asians, Hispanics, and Native Americans), but don't hold your breath; it's a very small increase.  Kingston will win in a cakewalk; our bench in the district is non-existent, at least at the state legislature-level.

2nd District (Sanford Bishop [D]) GREEN
New Demographics: 48.4% white | 45.2% black | .3% Native American | .8% Asian | 4.3% Hispanic | 1% other
Old Demographics: 49.7% white | 45.1% black | .3% Native American | .6% Asian | 3.3% Hispanic | .9% other
Old District: 51.4% white | 44.8% black | .3% Native American | .6% Asian | 3.5% Hispanic | .1% other
With some minor scandal involving Bishop and rumors of an adminstration post, I felt the need to shore up his district a bit, considering Bush won it in 2004.  Population loss/stagnation and losses of area to the 8th necessitated moving the district northward, taking up more of Columbus, as well as extending up to take on the swingy Meriwether County plus the heavily black parts of Troup County in and around LaGrange.  Essentially, I added state Rep. Carl von Epps' district.  This also helped offset the addition of very Republican Colquitt County.  The district goes from majority white to plurality white and is trending even more minority.  Bishop should have no trouble and his successor should be in a relatively good position. 

3rd District (Lynn Westmoreland [R]) PLUM
New Demographics: 71.3% white | 20.8% black | .3% Native American | 1.1% Asian | 5.4% Hispanic | .1% other
Old Demographics: 79% white | 16.6% black | .3% Native American | 1.1% Asian | 2% Hispanic | 1% other
Old District: 72.6% white | 22.7% black | .3% Native American | .9% Asian | 4.1% Hispanic | .2% other
The 3rd loses more of Muscogee County /Columbus to the 2nd and some of its Metro Atlanta area but now goes to the Macon area, making it more of a Central Georgia district.  Other than the peninsulas from the 2nd district, it's actually more compact than before. This area has diversified at a pretty good clip, but even running 80 MPH takes a long time when you're driving from New York to Los Angeles.  Plus, it's still demographically very similar to Westmoreland's old district.  Looks like we would have to deal with his “uppity” ass for a while.

4th District (Hank Johnson [D]) RED
New Demographics: 29.9% white | 53.4% black | .2% Native American | 4.3% Asian | 10.8% Hispanic | 1.2% other
Old Demographics: 31.3% white | 54.3% black | .2% Native American | 4.1% Asian | 8.1% Hispanic | 2% other
Old District: 35.8% white | 53.5% black | .4% Native American | 4.3% Asian | 8.5% Hispanic | 0% other
I undid the horrendous four-way cracking of DeKalb, replacing it with a two-way split.  The fourth occupies the overwhelming majority of DeKalb, having been moved completely out of Gwinnett and Rockdale Counties and absorbing DeKalb areas from the 5th, 6th, and 13th.  Even though North DeKalb is pretty white, the additions from Central and South DeKalb more than make up for it.  The district gets a little less black but even more minority than before.  Hank Johnson will win easily.

5th District (John Lewis [D]) YELLOW
New Demographics: 29.9% white | 57.9% black | .2% Native American | 2.8% Asian | 8.2% Hispanic | 1% other
Old Demographics: 31.2% | 59.6% black | .2% Native American | 2% Asian | 5.7% Hispanic | 1.3% other
Old District: 37% white | 56.1% black | .2% Native American | 2.2% Asian | 6.1% Hispanic | 0% other

Pretty similar to its current form, especially in Clayton and Fulton Counties.  It's still an Atlanta plus some inner-ring suburbs districts, taking in slighly less of Forest Park and South Fulton but a bit more of unincorporated Clayton and a bit more of Sandy Springs.  The big difference is it being reducing to about 45% of it's DeKalb area, including its portion of Decatur, and is basically left with the DeKalb portion of Atlanta plus some areas northeast of this area.  John Lewis has nothing to worry about.

6th District (Tom Price [R] vs. Phil Gingrey [R]) TEAL
New Demographics: 75.3% white | 9% black | .3% Native American | 6.3% Asian | 7.7% Hispanic | 1.5% other
Old Demographics: 80.6% white | 7.9% black | .2% Native American | 4.3% Asian | 5.1% Hispanic | 1.8% other
Old District: 85.6% white | 7% black | .2% Native American | 4% Asian | 4.5% Hispanic | .1% other
This is one of my “fuck with the Republicans” districts.  Like before, the district includes white, affluent, Republican North Fulton County (including Tom Price's home) and East Cobb (likewise white, affluent, and Republican).  However, instead of going east to take up North DeKalb County and north to pick up Cherokee County, it goes west to take up the northern half of Cobb County.  In the general election, this doesn't mean anything; it's still a heavily white, Republican district in which we have no bench (although there is some diversification and it now includes a major state university).  However, the district now includes Phil Gingrey's home between Kennesaw and Marietta!

7th District (John Linder [R] vs. ?) GRAY
New Demographics: 68.1% white | 10.8% black | .3% Native American | 6.1% Asian | 13.5% Hispanic | 1.2% other
Old Demographics: 79% white | 6.8% black | .2% Native American | 3.9% Asian | 8.7% Hispanic | 1.3% other
Old District: 85.2% white | 7.1% black | .3% Native American | 3.8% Asian | 5.4% Hispanic | .1% other

Same thing with as with the 6th.  Linder loses more of the diverse areas of Gwinnett County to the 14th, as well as the Newton, Walton, and Barrow County portions.  In return, he gains almost all of Forsyth County and the Southern half of Hall County.  Depending on who wins the Republican primary in the current 9th district, this may set up a primary in this new 7th.  Regardless, this will be a Republican seat for the foreseeable future.  However, it's rapidly diversifying with every minority group taking up a larger share than before.  I think Linder's days are numbered.  It may be a fairly big number, but numbered all the same.

8th District (Jim Marshall [D]) PERIWINKLE
New Demographics: 54.2% white | 40% black | .2% Native American | 1.1% Asian | 3.6% Hispanic | 1% other
Old Demographics: 55.6% white | 39.8% black | .2% Native American | .8% Asian | 2.6% Hispanic | 1% other
Old District: 64% white | 32.6% black | .2% Native American | .8% Asian | 2.8% Hispanic | 1.4% other
Basically, I shifted the district southward and worked to make sure it was more favorable on a presidential level in anticipation of Marshall's eventual departure for higher office.  So, this meant I had to cut almost all of Laurens County out of the district.  Marshall won it big, but Obama lost it big, and Marshall performed less strikingly there in the past.  I regrettably had to remove Dem-trending Newton County from the district, but the benefit from having it in the district was outweighed by the cost of having four heavily Republican counties in the district to connect Newton to the rest of the district, especially considering Marshall only barely won Newton and lost it in 2006.  While I was at it, I also cut out the whiter parts of Bibb County.  I also removed the troublesome Colquitt County, home of Saxby Chambliss and added a few blue and purple counties along the boomerang.  I also shifted down to add Valdosta, thus increasing our bench as all four members of the state legislature from this area are Democrats.  I would have liked to have removed the more Republican parts of Houston County, but I don't know where I'd make up the lost population, but, overall, I think I made Marshall's life much easier, as the district has gotten significantly more diverse and more Democratic. Maybe he can suck less.

9th District (?) CYAN
New Demographics: 85.2% white | 3% black | .3% Native American | .8% Asian | 10% Hispanic | .8% other
Old Demographics: 89.9% white | 2.6% black | .3% Native American | .6% Asian | 6.6% Hispanic | .9% other
Old District: 82.5% white | 13.7% black | .3% Native American | 1.2% Asian | 2.6% Hispanic | .1% other
I made this district more rectangular, removing the parts that dip into the Metro Atlanta area (for the past part), giving it Chattooga and the rest of Gordon Counties, and stretching it all the way to the South Carolina border.  So, now it borders four different states.  I don't know who it will be, but this district will elect a Republican.  We have no bench whatsoever, and this would be the whitest district in Georgia.  Not only is it the whitest district, but, despite some diversification, it's also the least diverse; the majority black districts are more diverse. 

10th District (Paul Broun [R]) HOT PINK
New Demographics: 77% white | 16.3% black | .2% Native American | 1.7% Asian | 3.7% Hispanic | 1.1% other
Old Demographics: 79.9% white | 15.4% black | .2% Native American | 1.3% Asian | 2% Hispanic | 1.1% other
Old District: 89.7% white | 3.4% black | .3% Native American | .7% Asian | 9.2% Hispanic | .3% other

Other than having the tentacle from the 12th come in, the new 10th actually has a pretty regular, compact shape compared to its predecessor.  It still has a lot of its area along the South Carolina border, including the white, Republican suburbs of Augusta, but now includes parts of the Atlanta and Macon exurbs.  It's actually ten points less white than before, but means it's now only 77% white.  In other words, don't expect Broun to go anywhere, unless he gets primaried, which may happen now that a lot of his Athens primary base is gone.

11th District (New Seat) [This would be my district, by the way] NEON GREEN
New Demographics: 79.5% white | 11% black | .3% Native American | 1.3% Asian | 6.8% Hispanic | 1.2% other
Old Demographics: 86.1% white | 7.8% black | .2% Native American | .9% Asian | 3.9% Hispanic | 1.1% other
Old District: 64.8% white | 28.5% black | .3% Native American | 1.3% Asian | 7.2% Hispanic | .1% other
The new 11th looks a lot like the old 11th but becomes more exurban and suburban.  It sheds Chattooga County and its portions of Cobb and Gordon Counties for East Douglas County , a sliver of Forsyth County, and Cherokee County.  I fear I may be switching one wingnut for another in redistricting Gingrey out of his district.  We only have one state legislator in the district and he would be an idiot to try for it.  This is a demographically unfriendly district, although there may be some solace to tke from its diversification.  Still, there's a long way to go before this one's demographics are promising.

12th District (John Barrow [D]) POWDER BLUE
New Demographics: 47.4% white | 45.8% black | .2% Native American | 1.6% Asian | 4.2% Hispanic | 1.2% other
Old Demographics: 47.5% white | 44.3% black | .2% Native American | 1.4% Asian | 3.2% Hispanic | 1.3% other
Old District: 50.8% white | 44.5% black | .2% Native American | .8% Asian | 2.7% Hispanic | .1% other
I removed all or parts of some troublesome majority white, Republican counties (Bulloch, Candler, Effingham, Emmanuel, Mongtomgery, Tattnall, Treutlen, and Toombs) leaving only the areas that were more minority and/or necessary to maintain contiguousness.  In their place, I added heavily Democratic Liberty County by wrapping the district around the coastal areas of Chatham County and using water continguousness.  On the northside, I added some more of Augusta, the blacker parts of Green, and readded Clark County,  The district gets a little blacker and a lot of the old, rural white voters are replace with white voters in a college county more apt to not only vote Democratic but to vote for a black Democrat if and when Barrow gets primaried by a black Democrat.  In becoming more Democratic, I was able to free up some smaller counties along the boomerang for Jim Marshall.

13th District (David Scott [D]) SALMON
New Demographics: 36% white | 46.6% black | .3% Native American | 3% Asian | 12.6% Hispanic | 1.6% other
Old Demographics: 47.1% white | 39.6% black | .3% Native American | 2.4% Asian | 8.6% Hispanic | 2% other
Old District: 47% white | 44.1% black | .3% Native American | 5.1% Asian | 10.1% Hispanic | .1% other
The 13th stays the same mostly.  I removed some of Northeast Clayton County and added more of Central Cobb.  I also added some of the relatively more minority areas of North Fayette.  Overall, Scott's district, once plurality white, is now plurality black.  He'll do fine.

14th District (New District) OLIVE
New Demographics: 36.1% white | 36.4% black | .2% Native American | 7.7% Asian | 18.1% Hispanic | 1.5% other
Old Demographics: 54.7% white | 24.4% black | .2% Native American | 6.4% Asian | 12.3% Hispanic | 1.9% other

Last and certainly not least is the new 14th district.  This district wraps around the southeastern quadrant of the middle ring suburbs, taking in the blue and blueing areas, including Morrow, Stockbridge, McDonough, Conyers, Covington, Norcross, Lilburn, and Lawrenceville.  It would be by far Georgia's most diverse district, having the highest numbers of Asians and Hispanics, the second-highest number of “others,” is plurality black, and still has a respectable white population.  As you can see from the demographic trends, this one is getting even more diverse really quick.  This diversity is reflected in the state legislators whose districts are entirely or partially within the district which includes whites, blacks, and Hispanics.  If it doesn't elect a Democrat, then the Democratic Party has fucked up.


It's also interesting to look at the districts with the old numbers and see which areas are growing and which areas are stagnant or losing populations by seeing how under or over populated they are compared to the 2000-14 district average.  Judging from the numbers, the Southern and Central Georgia are rapidly atrophying.  The 2nd would have had 90,888 extra people!  The 1st would have 40,693, the 8th 55,570, and the 12th 67,639.  The third is pretty much stagnant, having just 2,366 extra people.  If this keeps up, I think we may be looking at the elimination of a district in Middle and South Georgia, and I think it would be a Democrat (my guess would be Marshall's district because of its centrality.

So, where are the people going?  To Metro Atlanta.  The 10th is 15,007 below average, much/most of which I suspect to be from the Metro portions of the district. The 5th is 22,014 under the average.  The 13th 26,921 under.  The 11th and 7th are under by over 60,000, 63,039 and 62,317, respectively.  The 14th is a whopping 120,767 under average.  Only the 4th and 6th are above average, to the tune of 36,782 and 11,235, respectively. 

Redistricting Maps for Nevada

Nevada Redistricting

According to the population estimates, I decided that Nevada would get a new congressional district even though it was hard hit by the foreclosure crisis. My goal was to create a new Democratic district while protecting newly elected Democrat Dina Titus in the 3rd Congressional district. I believe I succeeded  in packing most of the Republican areas into one district. I made the map with Dave’s Redistricting App which is really fantastic. My next map should be either Louisiana or New Jersey. Enough talk, here is the link to my maps: http://frogandturtle.blogspot….

District 1 Shelly Barkely (D) (Blue)

I gave Barkley a strong Democratic district containing much of Las Vegas and neighborhoods in North Las Vegas with high minority populations. Still, I believe I kept enough heavily Democratic areas out of the 1st to protect Titus and strengthen the 2nd. The district is still minority majority and I believe Barkley or any Democrat will have no trouble winning this district. It probably voted about 66% for Obama. The racial stats are 12% Black, 31% Hispanic, 8% Asian and 46% White. Status is Safe Democrat.
District 2 No Incumbent (Green)

This was the new district I created that I hope will vote Democratic. The current representative is Dean Heller and I put his home in Carson City outside of the district. I hope that will deter him from running here. Even though most of his district is here, it is the more Democratic parts. The district stretches from the northern border, through Reno, along the western border and finally goes to take in some Democratic neighborhoods in Clark County (Las Vegas.) I think 20% of the district is in Clark County and 60% is in Reno. This would almost ensure that if a Democrat is elected, he or she will be from Reno. Looking at the numbers, Obama won the northern part of the district by about 13,000 votes but I am not sure of his margin in the Clark County portion. I estimate that he still won about 53%-55% of the vote in this district. That percentage should be enough to elect a Democrat. The racial stats for this district are 3% Black, 24% Hispanic, 6% Asian and 64% White. Status is Lean Democrat.

District 3 Dina Titus (D) (Purple)

I definitely strengthened Dina Titus enough by giving her some precincts that were formerly in the 1st district and by taking out Republican parts of Henderson and the outer Las Vegas suburbs. I believe the district is too Democratic for Jon Porter. He will probably run for the Republican 4th district. Dina Titus should worry about nothing except that she might face a minority candidate in the primary. Whatever way it goes, this district is in Democratic hands for the foreseeable future. It probably voted around 61% for Obama. The racial stats are 10% Black, 31% Hispanic, 8% Asian and 49% White. Status is Safe Democrat.

District 4 Dean Heller (R) (Red)

This district is where I put most of the Republicans. It looks like it is centered in the “Cow Counties” or the counties outside of Clark and Reno Counties. Actually, it is based in Clark County and takes in Republican parts of Henderson. Even though I put Dean Heller’s home in the 4th district, I believe that Jon Porter or another Clark County Republican would run for this district. Dean Heller is a relatively new representative and he would definitely face trouble. Since most of the constituents live in Clark County, Heller will have to struggle to introduce himself to the people there. Still, I think it would be easy for a Clark County Republican to brand Heller as a Republican from the far corner of the state. Heller will probably lose but the district will most likely remain Republican. It probably voted about 56% to 59% for McCain. Racial stats are 4% Black, 18% Hispanic, 5% Asian and 70% White. Status is Safe Republican

By what margin will Bob Shamansky win?

View Results

Loading ... Loading ...

SSP Daily Digest: 6/22

DE-Sen: Wilmington News-Journal writer Ron Williams seems convinced that Rep. Mike Castle will be running for the open Senate seat in 2010 and will announce next month, based on his chats with unnamed “high-ranking Republican operatives who know Castle’s moods and inclinations.” He also points to Democratic “rumblings” that AG Beau Biden may pass on the race, to avoid a career-damaging defeat. The Hill tried to get confirmation on this and didn’t get any new information out of Castle, so take with as much salt as needed.

FL-Sen: This is about the last thing anyone could have predicted: billionaire gadfly Tom Golisano, who ran three races for NY-Gov as an independent and was last seen pulling levers behind the curtain in the New York Senate semi-successsful-coup-type-thing has a new idea: running for Senate in Florida. Either on the Independence Party line (which does in fact exist in Florida, although barely)… or as a Democrat. Despite the fact that he just became a Florida resident a few months ago because he hated New York’s high taxes. Sounds like the kind of thing that’ll last until he’s distracted by another shiny object.

MN-Sen: While we’re trafficking in thinly-sourced rumors, here’s one more: there are plans afoot for the “pre-concession BBQ” for Norm Coleman staffers.

NH-Sen: AG Kelly Ayotte is reportedly “close” to deciding to run for Senate. (If you haven’t already read Laura Clawson‘s takedown last week of the circular rationale for the Ayotte boomlet, do it.)

NV-Sen, NV-Gov: GOP Reno mayor Bob Cashell decided he didn’t really mean to endorse Harry Reid last week; he had co-hosted a fundraising reception for Reid but had done so as a “non-partisan mayor.” He probably noticed that having endorsed Reid wouldn’t help his chances in the Nevada governor’s GOP primary next year. (Although this article says that he’s also considering running for Governor as an Independent.) Meanwhile, Nevada’s other Senator, John Ensign saw his approval numbers take a huge hit with the allegations about his affair with a staffer: the Las Vegas Review-Journal finds him at 39/37, down from 53/18 last month. Still, he’s the most popular guy in Nevada, compared with Harry Reid‘s 34% approval and Gov. Jim Gibbons’ 10% approval in the same poll.

CA-Gov: Antonio Villaraigosa will announce later today on CNN whether or not he’s going to run for California governor, which seemed likely even a few months ago but has gotten called into doubt recently. He can’t be encouraged by a recent LA Times poll, which polled only Los Angeles city voters on the Dem primary. Although Villaraigosa maintained a 55% approval as mayor, he only beat ex-Gov. Jerry Brown and SF Mayor Gavin Newsom by 38-32-13 on his home turf, with a plurality opposing his entry into the race.

IL-Gov: Little-known state Senator Matt Murphy is getting in the Illinois governor’s race. He joins two other state Senators in the field: Bill Brady and Kirk Dillard. Murphy has only been in the Senate since 2006, but may have a geographical advantage against presumptive frontrunner Brady, in that Murphy is from Palatine in the Chicago burbs while Brady is from downstate.

ME-Gov: Somehow this eluded me (and everyone else) last week, but it’s indicative of how little press the open Governor’s seat in Maine is getting. Steve Rowe, the Democratic former House speaker and Attorney General, has filed his campaign paperwork. The likely Dem frontrunner will have his formal kickoff “at a later date.”

NJ-Gov: Chris Christie has some splainin’ to do to Congress: he agreed to testify before the House Judiciary subcommittee on Commercial and Administrative Law, regarding who Christie chose to award no-bid federal monitoring contracts to when he was US Attorney. Christie also looks to be waddling toward the center for the general, as last week his team scrubbed the “Shared Values” portion of his website that was up during the primary, in which he talked about opposition to abortion and gay marraige. Meanwhile, the discovery of an extra $625 million or so under the couch cushions in the state’s tax amnesty program may help Jon Corzine’s chances a lot; with that extra money, Dems may be able to restore the popular property tax rebates that were on the chopping block.

NY-Gov: Rudy Giuliani gave a timeline of sorts for deciding whether or not to run for Governor, saying “it’s something I have to decide sometime this year, but I haven’t really focused on it very much right now.” Also, like clockwork, another Siena poll (pdf) showing David Paterson’s dire straits just came out (although numbers have been stable for several months now): he loses the primary to Andrew Cuomo 69-16 and the general to Giuliani 57-27. Cuomo beats Giuliani 49-40, and has his highest-ever approval ratings at 71%.

FL-08: Rep. Alan Grayson likes to keep ’em guessing. One of the most outspoken liberals in the House, the freshman rep. plans to appear at the next Orlando-area teabaggers’ event on July 4. Apparently he’s there to tout support for a bill to audit the Federal Reserve, a topic where he and the Paulist wing of the GOPers have common cause.

FL-13: More insight into the campaign finance shell game that GOP Rep. Vern Buchanan allegedly had going on, that’s been the subject of investigations: a bankrupt registered Democrat explained his $8,800 contribution to Buchanan in that he was reimbursed for the contributions by his partners in a trucking company, one of whom is one of Buchanan’s biggest backers.

OH-02: David Krikorian, who’s going up against Rep. Jean Schmidt in this dark-red district, has put out an internal poll showing him within striking distance, down 44-39. Those numbers may have a lot to do with the DCCC‘s surprising recent decision to list OH-02 as one of their eight best shots at a pickup.

Redistricting: The presentations from the NCSL’s first Redistricting Seminar are available online. They include topics like the Census and “How to Draw Maps That Will Stand up in Court.” (D)

How to Stop the Embarrassment: MN Redistricting 7 Seat Map

Minnesota is going to possibly lose a seat and with a DFL governor, we’ll be able to do some damage.  These districts should pass any compactness laws as nothing is gerrymandered beyond unacceptability.  My 8 seat map is in the works and near done and both of these maps reflect what I think is possible and appropriate for Minnesota, all Dem seats with one GOP dump district.

I did none of this with a computer program or anything like that.  i was fortunate that MN provides all the info I needed to do this with the MnSOS office providing all the vote totals and also precinct maps of every state house seat, which was the main way I broke down the districts by vote and population when I didnt need to break it down to city/township/precinct level.  The state legislature websites has excellent maps with the two I used constantly were a map of the all the state house seats that also showed city boundaries which made it my go to map for figuring out my planned geography.  More importantly though, a precinct map of the entire state showing election results from dark red to dark blue.  I found county population totals for 2007 and when they broke down beyond that point, I wikipediad it which sometimes included 2006 estimates but mainly for 2000 totals and then I used common sense for population movements, figured out the percentage of growth for that county/area, etc to figure out the 2007 population of said city/precinct.  There is certainly some error involved in this but nothing that would alter more than a couple precincts here or there and then my map accounts for current population movement as opposed to 2000, little bit of a trade off there.

Everything is recorded in excel spreadsheets, they look like a hot mess.

Photobucket

map with county lines can be found here: http://s635.photobucket.com/al…

I figured I had three options with Minneapolis/St. Paul. 1. Put each in their own CD and have to expand them, which meant expanding into more Dem friendly suburbs, which in turn would mean I would end up strengthening Paulsen.  2. Put them both into the same CD, making one uber D+35-like district which would then leave behind all Dem burbs currently in the two districts plus a little bit of one of the cities.  I could then gerrymander two suburban seats into two Dem-leaning districts, most likely.  But McCollum lives in a burb just outside of St Paul so while it wouldnt make an Ellison v McCollum, it would mean her district being gerrymandered to be really Dem and then Paulsen would just get beefed up in return as a consequence.  I could put Ellison in a suburban district but well, that’d never work for him.   McCollum could survive it fine probably.  And option 3, which I chose, was to divide up MSP into three districts and pair them with adjacent suburbs, creating 3 solid Dem seats.  This was the more devious and fun way to go.

I will say at first, doing it this way REALLY bugged me but I was being politically minded, I looked at this and thought, that would never happen.  Quite frankly, I think it would have a decent shot after I’ve sat on it.  The map doesn’t look messed up, it puts the cities and suburbs all compactly into three districts and the other districts all make perfect sense.  It’s compact, simple, but really does a lot of damage.  You just have to get past Minneapolis dominating two districts.

CD1,7,8 all stay heavily rural districts with some exurban areas picked up and CD2 is one huge swath of Republican exurbia.

This map would result in a for sure 6/1 delegation as the seat I eliminated was Bachmann’s and Paulsen’s is now a heavy DFL seat.  An open MN-6 would probably make it 5/2 but maybe not.

As for the tables, the first 2008 is new the district’s 2008 total, the second is former districts.  I also did the 2004 totals since many of you asked in other redistrictings what they would be.  And then are the county totals for each one so one would know where to watch for votes and such.  

MN-1 Rep. Walz Pop. 2008 2008 2004 2004
Total 740228 52/47 51/47 48.5/51 47/51
Pop. Obama McCain Kerry Bush
Houston County 19515 54 44 48 51
Winona County 49802 58 52 48.8 49.3
Watonwan County 7535 53 44 47.5 48
Steele County 36378 46 51 56 43
Dodge County 19552 44 54 42 57
Wabasha County 21783 47 50 47 52
Olmsted County 76470 51 47 47 52
Mower County 38040 60 37 61 38
Freeborn County 31257 57 41 55 44
Waseca County 19528 45 53 43 56
Blue Earth County 59802 55 42 48 51
Nicollet County 31680 54 44 50 49
Dakota County 121909 46 52 43 57

MN-1 is now more based in the southeast corner and is almost indentical to the 1990’s lines (it just worked out that way), this makes it 1% more for Obama as the southwestern rural counties are the Republican ones while the southeast is heavily DFL.  It now includes some of exurban MSP, but still keeps its rural district title.  Walz lives on the edge of the district and should still be quite safe.

MN-2 OPEN Pop. 2008 2008 2004 2004
Total 736283 42/56 48/50 38/61 45/54
Pop. Obama McCain Kerry Bush
Wright County 112870 40 58 38 61
Scott County 126642 44 55 40 60
Carver County 75075 42 57 36 63
Sherburne County 78127 39 60 37 62
Stearns County 81037 39 58 38 60
Anoka County 132044 41 57 40 59
Washington County 7336 43 56 39 60

I combined all the exurban Republican counties from Kline and Bachmann’s districts as they are by far the most Republican in the state and a great population base.  Also, the district took in parts of Hennepin county for population and gerrymandering purposes.  The areas it picked up are exurban for the most part and are extremely Republican, the Lake Minnetonka cities (but not Minnetonka) and also Maple Grove had to be included, and these suburbs lean pretty heavily GOP, as well.

Kline now lives in CD1 but the city he lives in, Lakeville, borders CD2.  I would assume he’d opt to run in the new CD2 as he would certainly not beat Walz and the territory of his included in CD1 are his least favorable counties, and nor would he let Bachmann simply claim CD2 as hers.  Bachmann’s district is simply gone and I would assume she’d move to run here, which  means that I may not have eliminated Bachmann, but actually strengthened her, depending if she could win the primary.  Bachmann could dominate in the caucuses and probably get the GOP endorsement but primary voters would probably be more apt to voting for Kline.  This is a consequence we can live with as at least someone got eliminated still and she is a good fundraiser for us.

MN-3 Rep. Paulsen Pop. 2008 2008 2004 2004
Total 739257 61/36 52/46 57/41.5 48/51
Pop. Obama McCain Kerry Bush
Hennepin County 489340 65 33 60 38
Dakota County 249917 52 42 51 48

This district combines Edina, Eden Prarie,, part of Minnetonka, Bloomington, southern Minneapolis and also Eagan in Dakota County.  All of the suburbs are trending Democratic with most of the areas in the district voting for Obama, but also voting for Paulsen, except for Bloomington which went Madia.  Paulsen lives in Eden Prairie and would be in this district, but would certainly get his ass kicked by just about any Dem challenger.  This district is now solid Dem, whatever the political climate.

MN-4 Rep. McCollum Pop. 2008 2008 2004 2004
Total 739603827 60/36 64/34 58.5/40 62/37
Pop. Obama McCain Kerry Bush
Ramsey County 499891 66 32 63 36
Washington County 199318 53 45 49 50
Dakota County 22126 58 39 61 37
Anoka County 18098 49.2 48.6 44 55

This district stays pretty much the same except for it adds most of Washington county.  I initially divided MSP up three ways perfectly with some of the St. Paul state house seats going to CD5 but this district then dipped below 60% for Obama.  I wanted to maintain at least 60% in CD4&5 so this district maintains all of it’s Ramsey county territory and largely is a St. Paul+burbs district still.

MN-5 Rep. Ellison Pop. 2008 2008 2004 2004
Total 740611 62/35.5 74/24 60/40 71/28
Pop. Obama McCain Kerry Bush
Hennepin County 569459 65 33 61 37.5
Anoka County 171152 53 45 49 50

This district takes in the north half of Minneapolis (where Ellison resides) and includes all the suburbs to the west and then also to the north in Anoka County of Minneapolis, and then also picks up suburbs on the Hennepin/Anoka border and also Blaine.  Everything except Maple Grove and Plymouth are Democratic in Hennepin while the Anoka areas vary with Dem leaning to slight Repub suburbs.  Keith Ellison is really liberal but doesn’t cause very many waves and would still be safe here.

MN-6 Rep. Peterson Pop. 2008 2008 2004 2004
Total 737087 47/51 47/50 43/55 43/55
Pop. Obama McCain Kerry Bush
Kittson County 4505 58 40 50 49
Traverse County 3712 51 46 48 50
Stevens County 9624 49 48 47 51
Swift County 11192 55 42 55 43
Todd County 4378 43 54 41 57
Yellow Medicine County 10000 51 46 49 50
Lake of the Woods County 4095 42 55 38 60
Marshall County 9618 49 48 42 57
Becker County 31964 45 52 40 58
Polk County 30708 51 47 43 56
Pope County 11065 51 47 49 49
Clearwater County 8245 44 54 43 56
Red Lake County 4118 51 45 44 54
Mahnomen County 5129 61 36 53 45
Pennington County 13756 50 48 44 54
Clay County 54835 57 41 47 52
Otter Tail County 57031 42 55 37 61
Douglas County 36075 44 54 44 54
Grant County 6021 51 46 49 50
Big Stone County 5385 52 46 50 48
Lac qui Parle County 7258 52 46 53 46
Renville County 16132 48 49 45 53
Lyon County 24695 48 50 42 57
Beltrami County 43609 54 44 50 48
Roseau County 15946 40 58 31 68
Chippewa County 12465 52 46 52 47
Wilkin County 6418 45 52 33 65
Sibley County 15007 45 52 39 59
Kandiyohi County 40784 46 52 44 55
Norman County 6685 62 35 47 51
Hubbard County 18781 42 56 42 57
Wadena County 13382 40 58 39 59
McLeod County 9603 40 57 36.5 62
Meeker County 23211 43 54 43 56
Le Seur County 28034 47 51 45 54
Stearns County 2465 55 43 49 51
Wright County 4502 48 50 48 51
Martin County 20462 41 56 42 57
Brown County 26013 43 55 37 61
Murray County 8511 49 48 44 54
Jackson County 10883 47 51 46 52
Cottwonwood County 11349 46 52 43 56
Nobles County 20128 48 50 42 56
Pipestone County 9305 42 55 38 61
Rock County 9498 42 56 39 60
Faribault County 14869 46 51 43 55
Fillmore County 21037 53 44 49 50
Lincoln County 5877 49 48 47 52
Redwood County 15519 42 55 38 62
Watonwan County 3487 41 56 38 60

This is the old MN-7 with it having the same base and will have the same congresscritter.  The district had to expand and the only option was into CD1 as CD2 areas are way Republican and the old CD8 is a northern Iron Range district that consistently elect a pretty progressive Dem.  (Oberstar is a lot more liberal than one would think based off the district.)  I managed to only make this district a tick more Republican, which is pretty good considering the areas to expand were all Republican.

MN-7 Rep. Oberstar Pop. 2008 2008 2004 2004
Total 737135 53/44 53/45 52/46 53/46
Cook County 5398 60 37 53 45
Lake County 10741 60 38 60 39
St. Louis County 200528 65 33 65 34
Carlton County 33893 62 35 63 36
Pine County 228164 49 48 50 49
Koochiching County 13459 54 44 50 48
ItascaCounty 44542 55 42 55 44
Cass County 28723 45 53 43 56
Crow Wing County 61648 45 53 42 57
Morrison County 32733 39 58 41 58
Mille Lacs County 26354 45 52 43 55
Kanabec County 16090 44 53 44 55
Aitkin County 15910 49 49 48 51
Chisago County 50128 44 54 43 56
Isanti County 38921 41 56 41 58
Benton County 39504 44 53 44 55
Stearns County 62549 53 46 50 48
Sherburne County 8160 57 40 56 42
Washington County 7655 43 51 42 57

This is the old CD8 with its base up north in Duluth and on the Iron Range.  Unlike what many have done, I left it completely intact except by removing Bemidji. I put in St. Cloud and then also included the colleges St. Ben’s and St. John’s which are blue.  It was tricky to figure out where to put St. Cloud since it is +2000 votes for Obama but the counties attached to it are all so Republian.  The district had to pick up counties south for population and I managed to make it a tick less Republican.  Oberstar is safe and so is his successor, House Majority Leader Sertich.  He could be speaker if Kelliher runs for governor, and he’s young so it’ll be in our hands for the next 50 years guaranteed.

By what margin will Bob Shamansky win?

View Results

Loading ... Loading ...

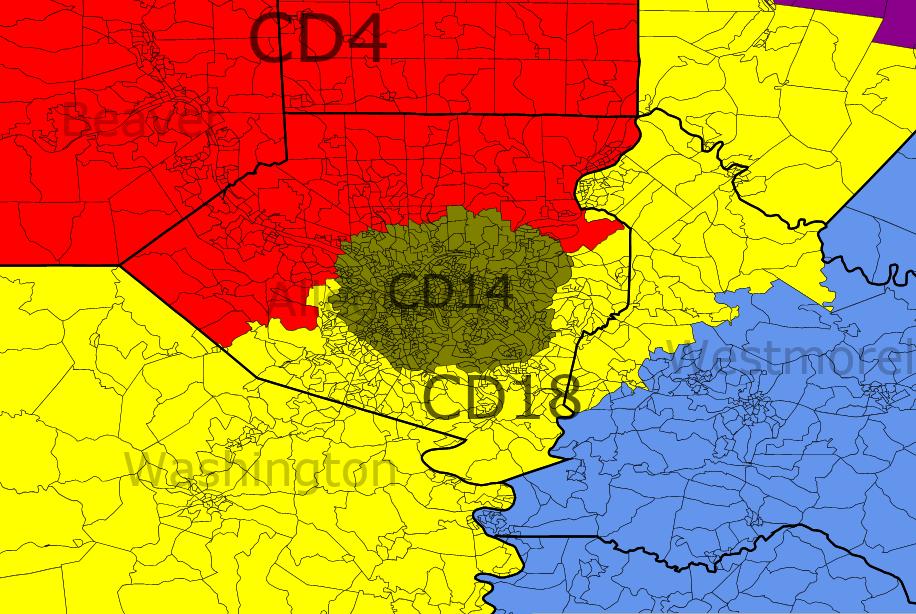
Redistricting Pennsylvania

*** Update July 7: Now I have all precinct data, PVI calculations are complete. ***

Pennsylvania is expected to lose a district so it will have 18. My goals are:

– Make districts that look fair, even if they’re not.

– Keep communities together

– Try not to screw over any incumbent Democrats

– Put Democratic territory in Democratic districts

– Anticipate future voting trends

Here is my redistricting plan:


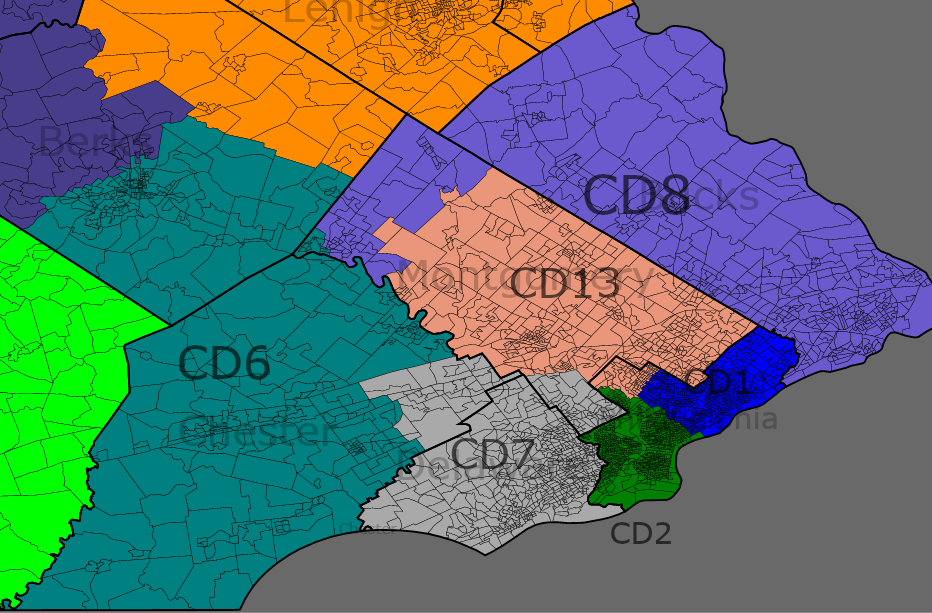
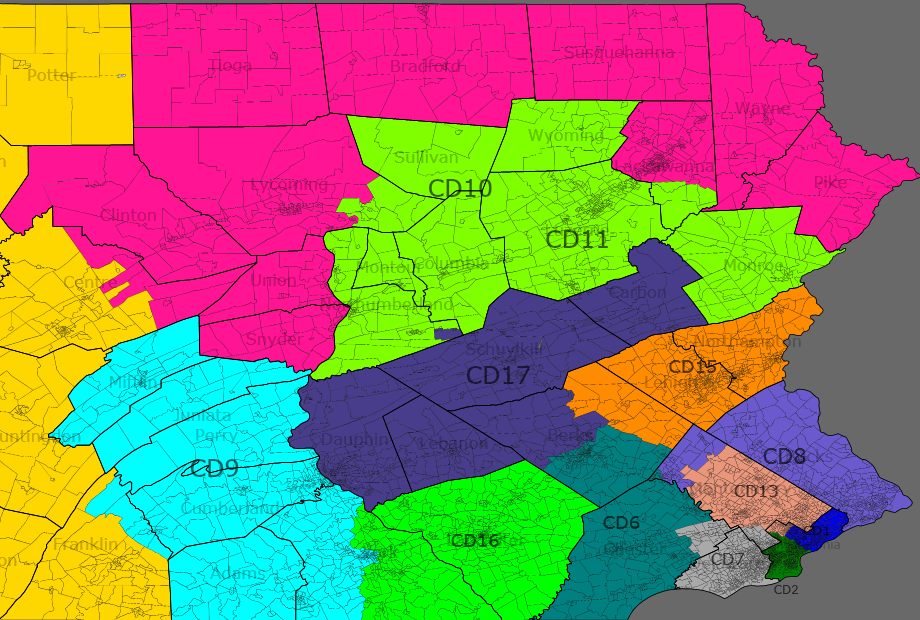
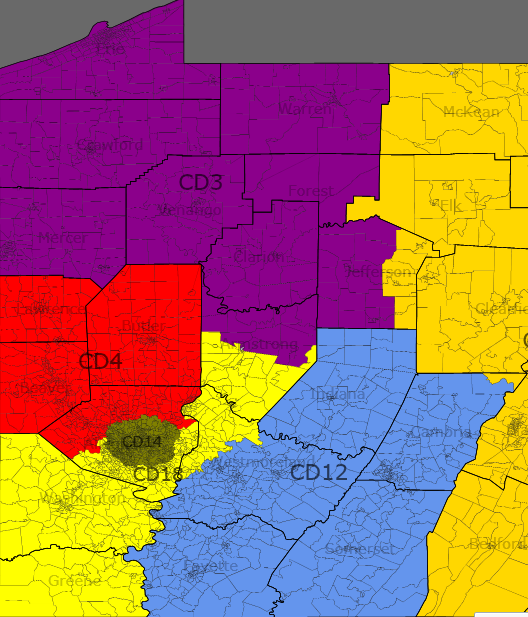
Click on the image for a full size screenshot.

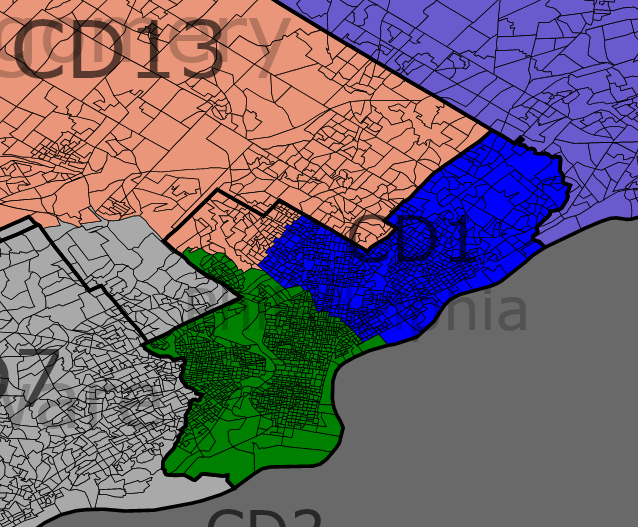
Philadelphia closeup:

1st District (old 1st) D+21

“The Eastern Philadelphia district”

Incumbent: Bob Brady (D)

The first district has been shifted east. It is now 51% white, 21% black, 6% Asian and 20% Hispanic. It gave 73.59% of its vote to Obama, making it D+21. The old 1st is D+35.

County #Obama #McCain %Obama %McCain
Philadelphia (pt) 223428 77797 73.59% 25.62%

2nd District (old 2nd) D+40

“The Western Philadelphia district”

Incumbent: Chaka Fattah (D)

The second district is now 24% white, 67% black, 5% Asian and 3% Hispanic. It gave an incredible 93.03% of its vote to Obama, making it D+40. The old 2nd is D+38. It will be the third most Democratic district in America, behind only NY-15 and NY-16, and tied with Washington DC.

County #Obama #McCain %Obama %McCain
Philadelphia (pt) 341893 24374 93.03% 6.63%

3rd District (old 7th) D+9

“The Delaware County district”

Incumbent: whoever succeeds Joe Sestak in 2010

This district has been made more Democratic. It takes up all of Delaware County, the rest of Philadelphia, and a small amount of Montgomery.

County #Obama #McCain %Obama %McCain
Delaware 178870 115273 60.22% 38.81%
Montgomery (pt) 37275 17659 67.45% 31.95%
Philadelphia (pt) 30659 15050 66.38% 32.58%
Total 246804 147982 61.94% 37.14%

4th District (old 13th) D+6

“The Montgomery district”

Incumbent: Allyson Schwartz (D)

This district is now entirely within Montgomery County.

County #Obama #McCain %Obama %McCain
Montgomery (pt) 215206 147338 58.85% 40.29%

5th District (old 8th) D+1

“The Bucks district”

Incumbent: Patrick Murphy (D)

By removing its territory from Philadelphia and Montgomery and adding territory from Lehigh and Northampton the district becomes a little less Democratic. It stops short of Allentown and Bethlehem but takes Easton from the Dent district. Patrick Murphy should be safe.

County #Obama #McCain %Obama %McCain
Bucks 179031 150248 53.78% 45.13%
Lehigh (pt) 6770 7463 47.02% 51.84%
Northampton (pt) 11346 7145 60.55% 38.13%
Total 197147 164856 53.86% 45.04%

6th District (old 16th) D+1

“The Chester district”

Incumbent: Joe Pitts (R)

The current district takes all of Lancaster County and some of Chester. In this plan it takes all of Chester and some of Lancaster, including the city. Chester is the more Democratic county, so this shift makes it more Democratic. Joe Pitts may be able to win this district but after he retires a Democrat should win it.

County #Obama #McCain %Obama %McCain
Chester 137833 114421 54.19% 44.98%
Lancaster (pt) 38485 35210 51.78% 47.37%
Total 176318 149631 53.64% 45.04%

7th District (old 6th, sort of) R+5

“The Reading district”

Incumbent: whoever succeeds Jim Gerlach in 2010

My ideal scenario: Jim Gerlach runs for higher office and a Democrat from Berks County wins the open 6th district in 2010. This Democrat becomes popular quickly and easily wins the more Republican district in 2012. Over time Berks trends more Democratic and Lancaster trends more moderate.

My less ideal scenario: A Republican wins it in 2010, or Jim Gerlach stays, so we make it more Republican.

It is made of almost all of Berks, most of Lancaster, and a tiny amount of Montgomery.

County #Obama #McCain %Obama %McCain
Berks (pt) 92672 73890 54.89% 43.77%
Lancaster (pt) 61101 91358 39.73% 59.40%
Montgomery (pt) 912 555 61.17% 37.22%
Total 154685 165803 47.72% 51.15%

8th District (old 15th) D+4

“The Allentown district”

Incumbent: Charles Dent (R)

The district loses territory from its southeastern border to the Murphy district, and gains most of Monroe County. This shift makes it more Democratic.

County #Obama #McCain %Obama %McCain
Lehigh (pt) 80319 55919 58.17% 40.50%
Monroe (pt) 30676 23064 56.48% 42.47%
Northampton (pt) 63909 51366 54.71% 43.97%
Total 174904 130349 56.57% 42.16%

9th District (old 19th) R+10

“The York district”

Incumbent: Todd Platts (R)

Because of its fast population growth, the district loses some area. It is still strongly Republican.

County #Obama #McCain %Obama %McCain
Adams (pt) 13783 19866 40.49% 58.36%
Cumberland (pt) 42156 54258 43.23% 55.65%
York 82839 109268 42.65% 56.26%
Total 138778 183392 42.60% 56.30%

10th District (old 17th) R+5

“The Harrisburg district”

Incumbent: Tim Holden (D)

This district is still based in Harrisburg. It loses strongly Republican territory in Perry County and gains strongly Republican territory in Northumberland and Montour Counties. Tim Holden keeps getting reelected despite the Republican lean of the district so he should be able to continue. Northumberland and Montour are currently in the Carney district so they are used to having a Democratic Congressman. It is only 0.18% more Republican than before.

County #Obama #McCain %Obama %McCain
Berks (pt) 4375 6623 39.15% 59.27%
Columbia (pt) 5862 4847 53.62% 44.34%
Dauphin 69975 58238 54.02% 58.86%
Lebanon 23310 34314 39.98% 58.86%
Montour 3364 4574 41.93% 57.01%
Northumberland 14329 19018 42.22% 56.04%
Schuylkill 28300 33767 44.88% 53.55%
Total 149515 161381 47.47% 51.24%

11th District (old 11th) D+3

“The Scranton district”

Incumbent: Paul Kanjorski (D) or his successor

The district now includes all of Lackawanna and Luzerne Counties.

County #Obama #McCain %Obama %McCain
Carbon 13464 12957 50.01% 48.13%
Columbia (pt) 7401 9600 42.67% 55.37%
Lackawanna 67520 39488 62.59% 36.60%
Luzerne 72492 61127 53.63% 45.22%
Monroe (pt) 8777 5229 62.11% 37.00%
Wyoming 5985 6983 45.55% 53.15%
Total 175639 135384 55.83% 43.04%

12th District (old 10th, and most of 5th) R+8

“The northern district”

Incumbent: Chris Carney (D)

The district takes all of the New York border except Erie County, and it extends south into Centre County. In 2008 Carney was reelected by a comfortable margin and this proposed district is 0.12% more Democratic. I expect northern Pennsylvania will eventually become more Democratic, like Upstate New York. Giving them a Democratic Congressman should speed up the trend. One problem is Glenn Thompson, Republican Congressman from the 5th District, lives in Centre County. He should run in the new 14th.

County #Obama #McCain %Obama %McCain
Bradford 10306 15057 39.97% 58.39%
Cameron 879 1323 39.15% 58.93%
Centre 41950 32992 55.37% 43.55%
Clinton 7097 7504 47.98% 50.73%
Elk 7290 6676 51.08% 46.78%
Forest 1038 1366 42.47% 55.89%
Lycoming (pt) 17163 27587 37.91% 60.94%
McKean 6465 9224 40.54% 57.84%
Pike 11493 12518 47.33% 51.55%
Potter 2300 5109 30.64% 68.06%
Sullivan 1233 1841 39.52% 59.01%
Susquehanna 8381 10633 43.46% 55.13%
Tioga 6390 11326 35.53% 62.98%
Warren 8537 9685 46.10% 52.30%
Wayne 9892 12702 43.32% 55.63%
Total 140414 165543 45.29% 53.39%

13th District (old 9th) R+19

“The south-central district”

Incumbent: Bill Shuster (R)

It’s more compact than before, and shifted a little bit east. This is the northern Bible Belt. At R+19 there are only a small handful of districts in America that are more Republican.

County #Obama #McCain %Obama %McCain
Adams (pt) 3850 6483 36.83% 62.02%
Bedford 6059 16124 27.00% 71.84%
Blair 19813 32708 37.31% 61.59%
Cumberland (pt) 6150 9471 38.95% 59.99%
Franklin 21169 41906 33.26% 65.85%
Fulton 1576 4642 24.99% 73.61%
Huntingdon 6621 11745 35.54% 63.04%
Juniata 3068 6484 31.59% 66.77%
Lycoming (pt) 1218 2693 30.72% 67.92%
Mifflin 5375 10929 32.57% 66.23%
Perry 6396 13058 32.39% 66.13%
Snyder 5382 9900 34.77% 63.96%
Somerset (pt) 5323 11473 31.21% 67.27%
Union 7333 9859 42.14% 56.66%
Total 99333 187475 34.23% 64.60%

14th District (parts of the old 5th, 12th and 9th) R+10

“The Johnstown district”

Incumbent: Glenn Thompson (R) [from Centre County]

I’ve been told this area would elect a Democratic Congressman despite its Republican PVI because it’s historically Democratic. I’ll believe it when I see it. This will be the whitest district in PA at 96.1%.

County #Obama #McCain %Obama %McCain
Cambria 32451 31995 49.42% 48.72%
Clearfield 14555 18662 43.05% 55.19%
Fayette (pt) 7274 10319 40.84% 57.94%
Indiana 17065 19727 45.75% 52.88%
Jefferson 3068 6484 31.59% 66.77%
Somerset (pt) 7555 10213 41.71% 56.38%
Westmoreland (pt) 41679 61144 40.07% 58.79%
Total 123647 158544 43.17% 55.35%

15th District (parts of the old 3rd and 4th) R+13

“The Butler district”

Incumbent: Tim Murphy (R)

Tim Murphy (R) lives in the 17th and Jason Altmire (D) lives in the 15th. They should trade districts.

County #Obama #McCain %Obama %McCain
Allegheny (pt) 62879 80564 43.48% 55.71%
Armstrong 11138 18542 37.03% 61.64%
Butler 32260 57074 35.68% 63.12%
Clarion 6756 10737 38.03% 60.44%
Venango 9238 13718 39.64% 58.66%
Westmoreland (pt) 16670 22239 42.44% 56.62%
Total 138941 202874 40.22% 58.72%

16th District (old 14th) D+14

“The Pittsburgh district”

Incumbent: Mike Doyle (D)

The district gets bigger because the Pittsburgh area lost population. I shifted it east so the Altmire district could get some more Democratic towns along the Ohio River.

County #Obama #McCain %Obama %McCain
Allegheny (pt) 225371 107892 66.97% 32.06%

17th District (parts of the old 12th and 18th) R+3

“The southwest district”

Incumbent: Jason Altmire (D) [assuming Murtha retires, or gets indicted]

This southwestern PA district is compact and Obama wins it. Yes it’s possible.

County #Obama #McCain %Obama %McCain
Allegheny (pt) 84521 83501 49.84% 49.23%
Beaver (pt) 14587 12626 52.91% 45.80%
Fayette (pt) 18592 15762 53.50% 45.36%
Greene 7829 7889 49.00% 49.38%
Washington 46122 50752 47.04% 51.76%
Westmoreland (pt) 6285 4989 55.23% 43.84%
Total 177936 175519 49.80% 49.12%

18th District (old 3rd) R+1

“The Erie district”

Incumbent: Kathy Dahlkemper (D)

Now it’s a proper Democratic Northwest PA district.

County #Obama #McCain %Obama %McCain
Beaver (pt) 25912 30269 45.52% 53.18%
Crawford 16780 20750 44.00% 54.41%
Erie 75775 50351 59.34% 39.43%
Lawrence 19711 21851 46.82% 51.90%
Mercer 26411 26565 49.07% 49.36%
Total 164589 149786 51.65% 47.00%

A “Fair” map of Pennsylvania

So, with the caveat that I don’t really believe that neutral redistricting is possible, I’ve redistricted my own state of Pennsylvania as I think it might appear if the legislature deadlocks and a Federal district court has to appoint a special master to draw the lines. There are 18k “missing” people in this map, which I assume is a software bug in Dave’s app. Anyway, without further ado. . .

Delaware Valley:

Delaware Valley

Philly:

Philly

Eastern PA:

Eastern PA

Central PA:

Central PA

Western PA:

Western PA

Pittsburgh:

Pittsburgh

SSP Daily Digest: 6/16 II: Electric Boogaloo

MO-Sen: In an e-mail to local TV affiliate KY3, former Treasurer Sarah Steelman seems to be walking back her comments to the Hill yesterday, not wanting to appear to shut the door on a GOP primary bid against Rep. Roy Blunt. She says she’s still “very seriously considering” it.

PA-Sen: Here’s an interesting development: a state legislator in Pennsylvania has introduced a bill to switch Pennyslvania from closed to open primaries. This seems like a nakedly pro-Specter bill: it would have helped him survive his GOP primary against Pat Toomey, and now it would have the opposite effect, helping him survive a Democratic primary against Joe Sestak by opening the door to independents and moderate Republicans.

AK-AL: Unless the indictment fairy has a present for him soon, Rep. Don Young looks to have a much easier go of it in 2010 than last cycle. Not only is his Dem challenger ex-state House minority leader Ethan Berkowitz likely to run for governor instead, but now it sounds like his primary opponents, Lt. Gov. Sean Parnell and ex-state Rep. Gabrielle LeDoux, aren’t going to run again either. Unlike last time, Parnell would need to give up his LG job to run, and he may instead be running for Governor if Sarah Palin declines to run again. Businessman Andrew Halcro, who ran for Governor as an independent in 2006, also sounds likely to run for Governor rather than challenge Young. State Senator Hollis French, who sounded like a likely Governor candidate for the Dems until Berkowitz showed up, may be the Dems’ best bet.

AL-07: The field to replace Artur Davis got bigger, as Jefferson Co. Councilor Shelia Smoot officially launched her campaign. She joins lawyer Terri Sewell, state Rep. Earl Hilliard Jr., and former Selma mayor James Perkins in the primary (which is the only real race in this D+18 district).

CA-11: Contra Costa County Sheriff Warren Rupf turned down the chance to run as a Republican in the upcoming CA-10 special election, but that seemed to ignite his interest, as now he’s considering running in 2010 in next-door CA-11 against sophomore Rep. Jerry McNerney, at R+1 a more plausible race than the D+11 CA-10.

FL-08: Republican state Representative Steve Precourt is considering making the race against Rep. Alan Grayson in this R+2 Orlando-area seat. His strongest words seemed to be reserved for likely primary opponent Orange County Mayor Rich Crotty, who Precourt doesn’t see as a “fresh face” or viable, although Precourt said he’d stand down if former state Sen. Daniel Webster got in.

ID-01: The Republican field in ID-01 is filling up, as state House majority leader Ken Roberts announced he’s in. He’ll have to get past veteran and McCain ally Vaughn Ward before facing off against Rep. Walt Minnick, though. Ex-Rep. Bill Sali occasionally makes threatening noises about a rematch, but he hasn’t said anything definite.

NH-02: Former state Rep. Bob Giuda (not to be confused with Frank Guinta, running in NH-01) is the first GOPer to launch an exploratory committee in the race to fill Rep. Paul Hodes’ open seat. He may still be joined by the 2008 candidate, Jennifer Horn, and, more remotely, a return by ex-Rep. Charlie Bass.

NY-23: Douglas Hoffman, the head of a local accounting firm, has thrown his hat into the GOP nomination contest for the special election to replace Rep. John McHugh. Republicans also announced their schedule for picking a nominee, involving four regional meetings around the districts where candidates would speak to the Republican county committee members over a two- to four-week period once there’s an official vacancy.

PA-03: Freshman Rep. Kathy Dahlkemper, representing the swingy R+3 district based in Erie (won by John McCain by 62 votes), has managed to secure a hot ticket in view of its self-imposed membership cap: she joined the Blue Dog Coalition.

Redistricting: A petition drive is underway in Florida to get an initiative on the ballot for 2010 that, while not creating an independent redistricting campaign, would at least place some non-partisan limitations on the creation of House and legislative districts. Most of the money behind the petition drive is coming from Democrats, but two prominent Democrats aren’t on board with the drive: Reps. Alcee Hastings and Corrine Brown, both of whom stand to inherit more difficult districts if they’re made less convoluted.

9 Competitive Districts for Indiana

In a “now for something completely different” moment, I decided to redistrict a state in such away where all districts would be maximally competitive.  Indiana is ideal for this since it was extremely close in the last election and does not have large enough minority populations to invoke the VRA.

Without further ado:

I used the town totals from the back of this data set to split Lake and LaPorte counties. For the other split counties, notably Marion and Hamilton, I just came up with reasonable numbers for what I wanted the split to be, figuring it would be relatively easy to adjust the lines to make it a reality.

Estimates of margins of victory and political analysis

District 1 (Blue):  Obama by 3500.  Hammond and Terre Haute are balanced against some conservative Indianapolis suburbs. Open seat.

District 2 (Green): Obama by 4900. Loses Michigan City and gain some Conservative territory to the East, but retains its South Bend base assuring Donnelly’s relatively easy reelection.

District 3 (Purple): McCain by 700, the only one he wins. This Fort Wayne based district now gains some Democratic turf in Muncie and Anderson. Souder had challenging races in his old district, so would presumably draw even stronger challenges here.

District 4 (Red): Obama by 5800. Gary and Lake County weigh against a broad swath of conservative turf, setting up a battle royale of Visclosky verses Buyer.  Theoretically the most Democratic district, but the estimates are a bit sketchy for some of the splits.

District 5 (Gold): Obama 1400. Some Democratic turf near the lake and Tippecanoe County weigh against the conservative interior, most notably deep red Kosciuskco.  Open seat.

District 6 (Turquoise): Obama by 3300. Some of the more Democratic parts of Marion weigh against Republican rural areas and suburbs.  Carson will need to convince enough of those folks that it’s okay to send a Muslim to congress that Indianapolis can carry the day.

District 7 (Gray): Obama by 4200.  A good urban suburban mix.  Burton will need to convince those urban voters that his golf habit won’t prevent him from representing them.

District 8 (Lavender): Obama by 3400.  This district is slight more Democratic than the old Eighth, since it picks up Monroe county. Blue Dog Ellsworth should have no trouble.

District 9 (Cyan): Obama by 2600.  I would think that moderate Democrat Hill would have the advantage over the ultra conservative Pence, who may prefer to run in the Sixth, but Hill has never won by particularly large margins, so who knows.