Redistricting Georgia – Inside the Mind of a Republican

  I set out to draw what the post-census congressional districts of Georgia might look like if we fail to win the governorship or take back one of the houses of the state legislature. I get nauseous when I look at this map, so I think I did a decent job. After all is said and done, this map will probably elect four Democrats and ten Republicans.

 When the Republicans DeLaymandered Texas, they mainly targeted moderate, white Democrats, and I think the Republicans in Georgia will probably try the same thing, so Jim Marshall and John Barrow are toast under this map. The other two goals of the Republicans will most likely be to hog the new 14th district for themselves, and to make sure John Linder’s district won’t have trended out from under him by the year 2022, especially since he will most likely retire before then.

 Without further ado, here are the pictures.

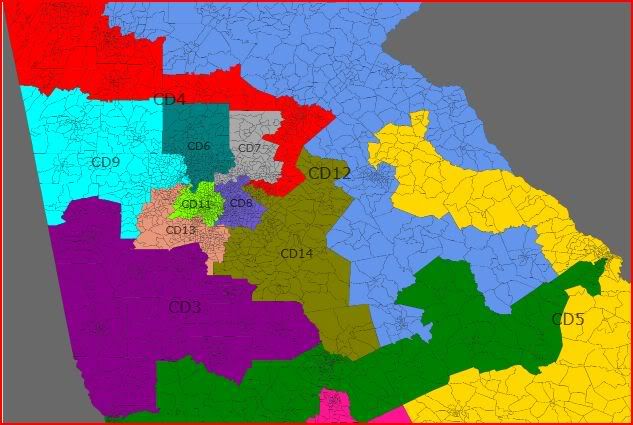
Northern Georgia:

Northern Georgia

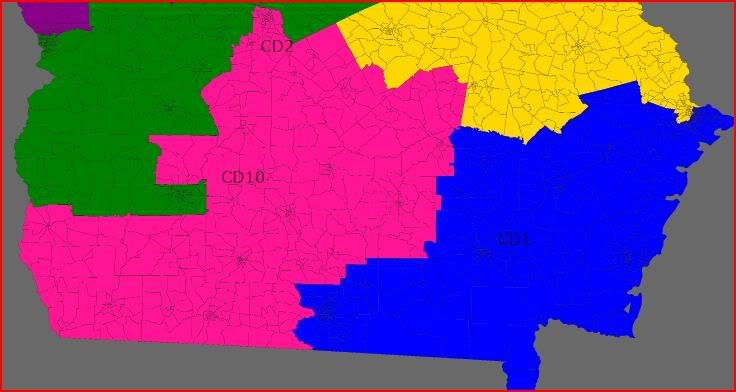
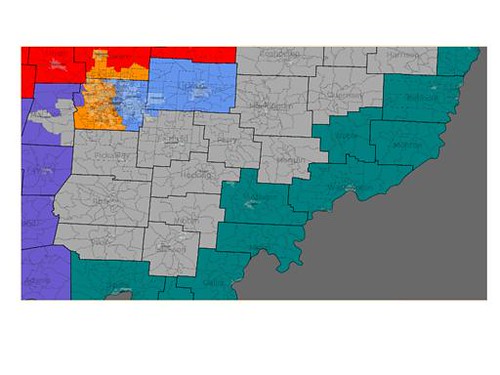
Southern Georgia:

Southern Georgia

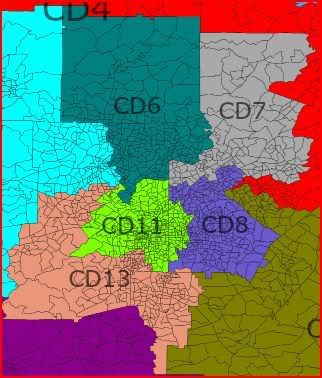
Greater Atlanta:

Greater ATL

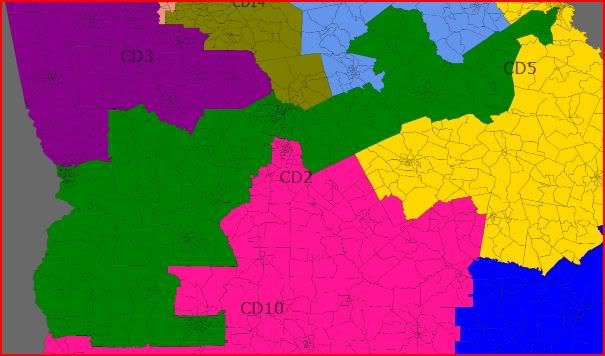
District 2 (Sanford Bishop vs. Jim Marshall):

Photobucket

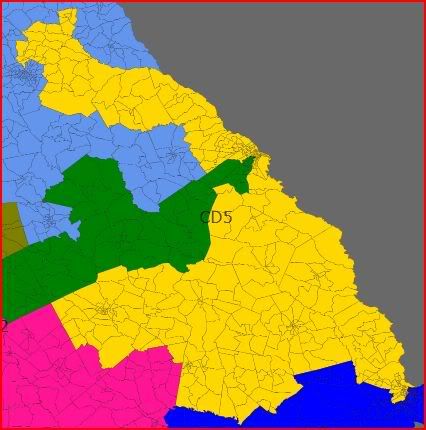
District 5 (John Barrow):

Barrow's district

District 1 – Jack Kingston (Light Blue) – Kingston’s district picks up some of Savannah’s African-American residents in order to remove them from Barrow’s district, and it shrinks somewhat in size, but this district should still be safe for him.

District 2 – Sanford Bishop vs. Jim Marshall (Dark Green) – While the old 2nd District was majority white and confined to Southwest Georgia, the new 2nd is majority-black and sprawls from Columbus to Augusta, and includes both Sanford Bishop’s home in Albany and Jim Marshall’s home in Macon. I think Bishop is an overwhelming favorite here, because it contains much more of his former territory than Marshall’s, and because he is African-American, which is always a plus when you’re running in a majority black district. If Marshall wants to stay in public life, he would probably want to either move to the 10th or 14th and run there, or retire and plan to either run for Senate or Governor in 2014.

District 3 – Lynn Westmoreland (Dark Purple) – Lynn Westmoreland’s loses Henry County and its portion of Douglas County, and picks up some territory near the Alabama border, as well as Monroe County. It is probably even more Republican than it is in its current form.

District 4 – TBD (Red) – With Nathan Deal running for Governor, I have no idea who this district’s representative will be, but unless hell freezes over, they will be a Republican who can stand to be weakened a bit, since Deal’s current district has a PVI of R+28! This district gets a new number (it used to be the 9th), and picks up part of Gwinnett County, while shedding some territory in the North Georgia Mountains. This district may look different, depending on where Deal’s replacement lives.

District 5 – John Barrow (Yellow) – This district is drawn for the sole purpose of defeating John Barrow. Barrow loses many of his African-American constituents to the 2nd, and to a lesser extent, the 1st. On top of that, there is a tendril that extends into some deeply conservative areas to the north of Augusta. Barrow will have a tough time holding this one.

District 6 – Tom Price (Teal) – This district, which was once represented by Newt Gingrich, changes very little, losing a small section of North Fulton, as well as Dunwoody, in DeKalb County, to the 7th district. Population growth is sufficient that it doesn’t take in any new territory.

District 7 – John Linder (Gray) – In an attempt to make sure Gwinnett County’s trend in our direction doesn’t imperil John Linder, this district loses much of Gwinnett to the 4th District (formerly the 9th), and to the new 14th. To compensate for this, it picks up small sections of North Fulton, as well as Dunwoody, from the 6th, and picks up Forsyth County, which gave McCain 79% of the vote.

District 8 – Hank Johnson (Periwinkle) – The only thing that really changes about this district, aside from the number,(it used to be the 4th), is that it no longer includes Rockdale County. Hank Johnson will be in congress for as long as he likes, assuming he learned a lesson from his predecessor and gives the Capitol Police their space.

District 9 – Phil Gingrey (Bright Blue) – This district contains a little bit more of Cobb County than it used to, and a little bit less rural territory along the Alabama border, but it is still a Republican stronghold. However, it is renumbered. (It used to be the 11th).

District 10 – OPEN (Hot Pink) – This district’s main population center is Warner Robins, a conservative city with a strong military presence. However, this district is mostly rural and is composed of Republican areas taken from the districts of Jack Kingston, Sanford Bishop, and Jim Marshall. Marshall might run here, but historically he hasn’t performed too well in the turf here that was formerly in his district. This is probably a likely pickup for the Republicans.

District 11 – John Lewis (Radioactive Green)- John Lewis’s district is still a majority-black Democratic stronghold, but it gets a new number, and some territory in Cobb County that was previously represented by David Scott.

District 12 – Paul Broun (Indigo) – Despite containing Athens, the 12th (formerly the 10th) is heavily Republican, thanks to its territory in North Georgia. Broun is safe here.

District 13 – David Scott (Salmon) – This district stays very similar in shape, but is now majority black as opposed to majority minority.

District 14 – OPEN (Greenish Brown) – This is the new district. Although it includes Rockdale County, which Obama won, and Henry County, which has been trending our way, as well as part of Gwinnett County, it also includes Walton and Barrow Counties, which are exurban and heavily Republican, as well as some heavily Republican rural areas. This district might be competitive someday, but for now it should go Republican. It wouldn’t surprise me to see former Rep. Mac Collins try and make a comeback here. Marshall could also conceivably run here, but he hasn’t done well in the section of his current district that is in this new district, and would be an underdog.

P.S. I don’t know as much about the Voting Rights Act as I should, so if you know how it might affect this map, be sure to let me know.

Minnesota Redistricting Maps

Here is another Democratic gerrymander. I chose Minnesota because the majority of the poll voters picked it. For those of you who voted for Georgia, that is my next state.  For Minnesota, a gerrymander like this is possible but it could be a long shot. This would only happen if the Democrats retain the State Legislature and capture the Governorship. I drew this map assuming that Minnesota would lose one electoral vote. I probably was able to create a 6-1 Democratic map even though there is a chance it might be a 5-2 Democratic map. My main objectives were to keep all Democrats safe while weakening Republican Erik Paulsen of the 3rd district and combining Republicans John Kline and Michelle Bachman. They are both so Conservative so at least we can knock away one of them. The pink lines are the boundaries of the old districts.  Here is the link to my maps http://frogandturtle.blogspot.com

District 1 Tim Walz (D) Blue

Even though I would have loved to strengthen Walz but I could do that because I needed enough Democratic counties to protect Collin Peterson (D) in the 6th district. Anyway, this district is pretty much the same as it is except I took in Democratic leaning Rice and Lincoln Counties as well Le Suer and part of Goodhue County. Le Suer and Goodhue are both marginal. I probably raised the Obama performance in the district by just a bit. I estimate that Obama won 52% to 53% of the vote here. The racial stats are 91% White. Status is Likely Democrat.

District 2 John Kline (R) vs. Michelle Bachman (R) Green

I have heard some talk from Republicans about combining Minneapolis and St. Paul into one district. I bet they did not consider that the Democrats could combine most of the Republican suburban areas into one district. I strengthened the 2nd district’s Republican performance by adding more Republican territory near St. Cloud and removing Rice County. McCain probably won only 55% of the vote here so a strong Democrat could possibly make it competitive. Michelle Bachman’s home Stillwater is in the district. The 2nd district contains part of her old 6th so she will probably choose to run here. John Kline is more entrenched so he will probably win, forcing Michelle Bachman to finally get out of Congress. Racial stats are 90% White. Status is Safe Republican if Kline wins, Likely Republican if Bachman wins.

District 3 Erik Paulsen (R) Purple

I know one thing about this district; Paulsen is in for a tough race with this district. He was elected in 2008 so he had almost no time to become entrenched into his district. To weaken him, I removed part of western Hennepin County, put in the most urban parts of Washington County and added some heavily Democratic areas in Minneapolis. Paulsen won by eight points in 2008 against Ashwin Maida, an impressive candidate. This definitely drops the chances of clearly knocking off Paulsen but with some new territory, it should be much easier. Obama won 56%-57% of the vote here. Racial stats are 8% African American, 6% Asian and 81% White. Status is Toss Up/Tilt Democratic.

District 4 Betty McCollum (D) Red

Her district looks very different from the one she has now. I had to unfortunately extend it out into the Republican suburbs because of population loss and the elimination of Michelle Bachman’s district. Her district extends all the way out to St. Cloud now. Ramsey County gave Obama a margin of 96,000 votes and the part McCollum has Obama probably pulled out a 75,000 vote margin there. The suburban part of the district probably gave McCain a 15,000 vote margin. A 60,000 Obama margin should be enough to protect McCollum. If Bachman decided to run here, she would probably not win. Obama probably won 59% of the vote here. The racial stats are 6% African American, 6% Asian, 6% Hispanic and 79% White. Status is Safe Democrat.

District 5 Keith Ellison (D) Yellow

Even though I slipped in part of the old 3rd district, Keith Ellison should have no worries. Minneapolis will keep him safe and sound. Obama probably won here with 68%-72% of the vote. Racial stats are 10% African American, 8% Hispanic, 5% Asian and 73% White. Status is Safe Democrat.

District 6 Collin Peterson (D) Teal

Even though I have tried to strengthen every Democrat here, I had to weaken Peterson a bit. I took away a few northern Counties that lean Democratic and added some of Stearns and Sherburne Counties which lean Republican. I may have compensated for those counties by adding a touch of Minneapolis. Weakening Peterson should not hurt him much. He is a moderate Democrat who is the chairman of the Agriculture Committee and has been representing the 7th district since 1991. He should be safe even though McCain probably won 51% of the vote here. Racial stats are 90% White. Status is Safe Democrat.

District 7 James Oberstar (D) Gray

This district has slow population growth so I had to extend it to the North Dakota border. The counties there lean Democratic so the new additions do not alter the 7th district’s political leanings much. It would not matter how many Republicans are here because Oberstar has represented this district since the 1970’s. He creamed former Senator Rod Grams when he ran for House in 2006. No question about it, Oberstar is safe. Obama probably received 56% of the vote here. Racial stats are 93% White. Status is Safe Democrat.

Redistricting Ohio (now with maps!)

This is my first diary, so please excuse my formatting and other technical ineptitudes.  I have maps, so if someone can tell me in the comments how to add them, I will add them.

I wanted to gerrymander Ohio (using Dave’s Redistricting App) for the likely 16 districts it will have after the 2010 census with the following goals in mind:

1) Make sure Republicans lose both seats lost to redistricting

2) Create(or maintain) strong Democratic districts in Southern Ohio in Cincinnati and Dayton

3) Eliminate Steve Latourette

4) Keep Ohio’s major cities and counties as intact as possible.

With that in mind, the following gerrymander would potentially create a 12-4 democratic split in Ohio (maybe even 13-3).

SW ohio

Southwest Ohio

District 1 (Royal Blue)- Steve Driehaus should love this new district as it now falls completely within Hamilton County and excludes the parts of more conservative Butler county were harder for him to win.  Although his home actually falls just outside of the district boundaries as drawn, the map could be tweaked to include his home while still strengthening the Democratic lean.

District 2 (Forest Green)- This district now becomes a suburban Cincinnati district, including Warren and Butler counties and parts of Hamilton and Clermont.  Although it is regionally much more compact, this district should still be one of three slam dunk Republican districts.

District 3 (Purple)- The new shape of this district should help to swing it to the Democratic column.  Including all of the urban parts of Montgomery County (Dayton), the suburban parts of Greene county, and Springfield in Clark county, Mike Turner’s days would be numbered.

District 4 (Red)- Another slam dunk Republican district that packs as many uber-red counties into one seat.  Now stretches from the Indiana border all the way through Holmes and Knox counties in east-central Ohio.  Would be even safer for Jim Jordan

NW ohio

Northwest Ohio

District 5 (Yellow)- This is where things start to get interesting.  This is Bob Latta’s district, and it still should stay Republican, but almost by accident, I have made this district significantly more swingy.  Giving its far western counties to the 9th in exchange for Sandusky county and big chunks of Lorain county (including Oberlin and Elyria) a moderate populist Democrat could surely compete here.  I haven’t yet figured out how to calculate the PVI of this new district…definitely closer to a toss-up than a Republican slam dunk.

District 6 (Teal Blue)- This district did not change very much for Charlie Wilson except that it had to get bigger because of the loss of seats statewide.  Adding in the rest of Athens county and Scioto county (Democratic areas) and a bit of Portage county (Republican) should basically leave the district with little change.

SE ohio

Southeast Ohio

District 7 (Grey)- This massive district in central and southern eastern Ohio is really a combination of the old 7th and 18th.  Because it still includes most of Zach Space’s old district (Tuscarawas, Muskingum, and Ross counties) as well as the Columbus exurbs, this should be a Democratic hold, although not being able to strengthen Zach Space is definitely one of the weaknesses of this map.

District 8 (Lavender) Just to screw with John Boehner, this district became the catch-all Southern Ohio republican district.  Still a deep shade of red, this district now stretches from the Indiana border all the way to Columbus and down to the Ohio River.  Making Boehner campaign in 3 media markets (Cincinnati, Columbus, and Dayton) sure would be fun, although this seat is just as safe as his old one.

District 9 (Aqua Blue) In the first of three pissed of Democratic incumbents, Marcy Kaptur probably would not love these changes to her district, although it really does not weaken her Democratic strength too much.  Having her pick up the four rural northwest Ohio counties while giving parts of Lorain and Sandusky county to the fifth should allow her to still cruise based on the strength of her base in Lucas county, while giving Democrats a legitimate change to knock of Bob Latta.

NE ohio

Northeast Ohio

District 10 (Hot Pink) Some big changes to Kucinich’s district, although it will remain heavily democratic.  In exchange for giving up a bit of his inner city west side of Cleveland territory, Dennis picks up the city of Lorain and the northern part of Elyria in Lorain county.  This district makes much more sense than the current lines which have this part of Lorain County lumped in with much more distant Akron (Betty Sutton’s district).  Should remain reliably Democratic (if this is what you can call Dennis).

District 11 (Lime Green) This district doesn’t change too much, although it had to get bigger to account for the loss of population in some of these Cleveland suburbs.  This district grows a bit further into the west side of Cleveland (to keep it majority-African American) and quite a bit into the eastern suburbs of Cuyahoga and Geauga county.  Steven Latourette would now live in this district, although he would have no chance to win it.

District 12 (Powder Blue) The first of the Columbus districts, these lines were changed to take out Delaware county in exchange for the rest of Licking and the rest of Southern Franklin county.  This district will remain a swing district, possibly with a slight Republican lean.  Hopefully it would give a strong Democratic candidate a chance to knock of Tiberi.

District 13 (Light Pink) In what could be pissed off incumbent Democrat number two, Betty Sutton’s district gets a major facelift, giving up parts of Lorain and Media counties in exchange for all of Summit county and some of the Republican parts of Geauga and Portage counties.  Since she lives outside Akron and has her base in Summit county, this should allow her to still get reelected easily, even though the district becomes slightly more Republican.  Should still be an easy Democratic hold.

District 14 (Olive Green) This district becomes the battle royale between the old 17th and 14th.  Because it includes all of Trumbull county and the city of Youngstown in Mahoning, Ryan should easily be able to end Steve Latourette’s political career (not a moment too soon!)  Including the Northeast corner of the state including swingy Lake county, Ryan could really build a political base for a future statewide run from this district.

District 15 (Orange) This district should hopefully strengthen Mary Jo Kilroy by giving her larger portions of Franklin county and the suburban areas of Delaware county.  Losing Union and Madison counties takes the most heavily Republican areas out of this district.

District 16 (Bright Green)  This district doesn’t change much, but the minor changes should help to strengthen John Boccieri.  The district gives up Republican Ashland county while picking up Kent in Portage County (university town) and the Cleveland suburbs in northern Medina county.

Precinct Data Files for 34 States

Jeffmd and I have started working with Dave to bring election data to Dave’s Redistricting App. In the meantime, some folks (like Nico, doing Arizona) have delved into precinct-level data to add all-important political information to their redistricting projects.

Some states make this information readily available; others force you to collect it county-by-county. Below is a list of states which have complete statewide precinct files (graciously hosted by another Dave – Dave Leip of the indispensable Atlas of U.S. Presidential Elections):

And, as always, you can find precinct data (that isn’t otherwise available on the web) for a whole bunch of individual counties at SSP’s Document Collection on Scribd. Hope you find these helpful!

Taking on Arizona

I decided to take on Arizona with its unique redistricting rules. Contrary to many states, Arizona focuses less on incumbent protection and even competitiveness, and more on “communities of interest” (though doesn’t really provide a clear definition for what this means). Additionally, as evidence by the 2000 map which sought unsuccessfully to make Arizona a 5R-3D state in line with its partisan leanings, they will very likely address the fact that the current 5D-3R doesn’t look like Arizona either and draw definitely one and likely both of the new districts so that they elect Republicans. On the same token I’d expect them to address the fact that there’s sort of a problem when Obama won 45% of the vote here yet he has the potential to only have won 2 of the 10 districts, so thus I chose to create a 3rd Obama district. As they do kinda take into consideration competitiveness, at least as an afterthought, 5 of the 8 old districts are now closer to 50-50 than they were before. I opted not to create a 3rd Hispanic-majority district, as I really don’t think that a third one will be mandated by the Justice Department. In fact, as best as I can tell, AZ-07 wasn’t required in 2000, either (remember, despite popular opinion whenever someone redistricts Louisiana here, the Justice Department doesn’t actually require that the percent of districts that a state has that are minority-majority must be equal to the percent of it’s population that is Hispanic (otherwise Texas would look much, much better for us)). However, they will likely require that there is a working Hispanic majority in a second district, thus AZ-07 should see a bit of an uptick in its Hispanic population. That being said, it’s still a very legitimate possibility that the redistricting commission opts to create a 3rd Hispanic-majority district anyway, though there probably isn’t a strong a “community of interest” argument for one this time around (as the two largest Hispanic communities, South Phoenix & the border, are already covered and the next largest, the southern part of the West Valley, doesn’t really have a large enough Hispanic community just yet.

I calculated political data based off these maps for the 2004 and 2008 presidential races to provide more depth to this map, as I’ve noticed that a lot of the recent maps rely on at best educated guesses for what the actual political realities are on the ground. While I’m confident enough in my data to post it, it likely isn’t perfect. Arizona doesn’t have townships or anything like that, so sometimes it’s difficult to figure out exactly where precincts belong. Additionally, I’d like to thank Dave and his awesome Redistrict Application, which made this possible.

Finally, I’m perfectly aware that the nature of the rules in Arizona means that someone could come in with the same basic goals that I have and come out with a very different map, so I’d love to here what other people have to think.

AZ-01 (Blue): Rep. Ann Kirkpatrick, R+3.4

-Flagstaff, Douglas, Payson

54% White, 23% American Indian, 19% Hispanic

More rural than ever (Flagstaff is the only town larger than 20K), the new AZ-01 drops the urban-suburban regions of Pinal County while maintaining its decidedly rural and Hispanic eastern edge, and pulls out of most of the rapidly urbanizing Prescott area, hanging on to only the more rural edges like Chino. Meanwhile, it picks up the ranching region of Cochise County (which like the rest of the Anglo population of eastern Arizona, has become quite conservative but remains somewhat Dem-friendly at the local level) along with some more liberal border towns; I’d argue that Cochise County outside SV makes a lot more sense in Kirkpatrick’s district than Giffords’ from the communities of interest POV.

The ditching of Evangelical-heavy Prescott does help to make this district somewhat more Democratic, but it also means that it’s trending Republican faster than ever as that corridor of Mormons, ranchers, and miners in Eastern AZ starting South of the Navajo Nation and ending somewhere immediately north of Douglas and Bisbee grow more Republican by the minute (and it won’t have the potentially Dem-trending suburbs of Pinal County to counteract that anymore). This may be a genuine Gore-Bush-McCain district, though, and the possibility is quite good that Obama wins it in 2012 if he carries AZ.

John McCain won 52% of the vote here in 2008.

Counties Obama McCain Others Total Kerry Bush Others Total
Apache 15390 8551 295 24236 15658 8384 156 24198
Cochise (part) 10534 13661 420 24615 10272 12096 285 22653
Coconino (part) 31248 22126 723 54097 29030 22465 383 51378
Gila 7884 14095 337 22316 8314 12343 186 20843
Graham 3487 8376 144 12007 3185 7467 68 10720
Greenlee 1165 1712 36 2913 1146 1899 22 3067
Maricopa (part) 1091 809 40 1940 1138 696 14 1848
Navajo (part) 14879 19592 455 34926 14035 17116 247 31398
Pinal (part) 4328 4512 116 8956 4420 3909 59 8388
Yavapai (part) 17885 27393 705 45983 16091 23516 329 39936
Total 107891 120827 3271 231989 103289 109891 1749 214929

AZ-02 (Red): Rep. Trent Franks, R+7.5

-Glendale, western Phoenix, Avondale

55% White, 33% Hispanic, 5% Black

While I ended up opting against drawing an Arizona map with a third Hispanic majority district (though there’s a good argument for one and that may be my next project), I did have to address the fact that there’s a relatively large and rapidly growing Hispanic population in Phoenix’s suburb’s southern West Valley that is currently mostly in 7th. I decided that a Phoenix district had to take them on to maximize their voice, and the Glendale-based 2nd district was the obvious choice. Additionally, as I ceded Peoria & the exburbs to the new 9th, this district had to go deeper into western Phoenix, now going clear east to I-17 though northern and much of central Phoenix and has to take in a few precincts in south western Phoenix for population purposes.

Trent Franks would find himself in a bit of pickle. On one hand this district is clearly Dem-trending (I could see it voting Democratic on the presidential level as early as 2012) and the growth of the Hispanic population will eventually drown him. Meanwhile, there’s an invitingly Republican district directly to the West and surely most of the conservative establishment, much of which was represented by Franks for the past 6 years anyway, will bow to this noted douchebag far-right luminary. That being said, Franks has a coveted seat on the Armed Services committee–a seat he may lose if he’s chooses not to represent Luke Air Force Base, which is still in the 2nd along with most of its employee. If Franks were to decide he only supports the troops when they’re in safe districts and bails, Republicans would still have a pretty good chance of holding this district with State Sen. Linda Gray or Glendale mayor Elaine Scruggs being potentially leading candidates, though we’d have a legitimate shot with someone like Avondale mayor Marie Lopez Rogers. Otherwise, look for Franks to be in the race of his life sometime around 2014.

John McCain won 54% of the vote here in 2008.

Counties Obama McCain Others Total Kerry Bush Others Total
Maricopa (part) 86328 103617 3250 193195 69754 94108 1050 164912

AZ-03 (Purple): Rep. John Shadegg, R+12.0

-Northern Phoenix, northern Scottsdale, New River

83% White, 11% Hispanic

Based around the tract homes and gated communities of McMansions that have popped up in northern Maricopa County here in the last 20 years, this is probably the wealthiest district in Arizona. It sheds much of the more culturely liberal neighborhoods in central Phoenix, now beginning north of Camelback and the North Mountains which gives it a decidedly suburban character despite the fact that the majority of its inhabitants live in the Phoenix city limits. Most people here commute to 4th and the 5th, though there is a substantial central business district in the 3rd’s new portion of Scottsdale–which I decided to include because there’s a division between the more middle-class southern and downtown Scottsdale and the disgustingly wealthy northern Scottsdale. In any event, Shadegg will fit here like a glove, as this district is safely Republican.

John McCain won 59% of the vote here in 2008.

Counties Obama McCain Others Total Kerry Bush Others Total
Maricopa (part) 115630 174838 4313 294781 95226 151454 1231 247911

AZ-04 (Grey): Rep. Ed Pastor, D+15.4

-Southern Phoenix, Guadalupe

71% Hispanic, 17% White, 8% Black

The southern Phoenix based 4th district doesn’t change that much, just shrinking because of population growth and becoming even more Hispanic. There are some upper class subdivisions in the Laveen area, but by in large this is working-class urban district that will continue to be the most Democratic district in Arizona.

Barack Obama won 68% of the vote here in 2008.

Counties Obama McCain Others Total Kerry Bush Others Total
Maricopa (part) 62390 27826 1398 91614 43697 24414 482 68593

AZ-05 (Yellow): Rep. Harry Mitchell, D+2.6

-Central Phoenix, Tempe, southern Scottsdale

58% White, 29% Hispanic

As I mentioned above, the fact that there is a big potential for this map to only have two districts out of ten that Obama won when he pulled off a respectable 45% of the vote is kind of a problem. If it took some kind of massive gerrymander to ameliorate that situation then it would be a problem, but I’d argue that this district is just as logical if not more so than the current AZ-05.

Essentially, I tried to create a “creative class” district that is well educated but more culturally liberal than the 3rd on the other side of the mountains. Starting in Tempe (home to ASU and several software companies) it moves up through several middle-class southern Scottsdale neighborhoods and then artsy downtown Scottsdale, then turns West into Phoenix to take in several historic middle-class neighborhoods such as Arcadia and Encanto before turning north again to end at the traditionally working-class but gentrifying Sunnyslope. One thing that occurred to me just as I was writing this up is that ASU’s Downtown Campus is a just a couple miles the south of Encanto area and ASU west is just a couple miles to the northwest of Sunnyslope, so if I were to redraw this map, adding those two campuses into this district would be one of my first priorities.

This would probably be pretty safe for Democrats (though Republicans do definitely have a base here) but the bigger threat to Harry Mitchell might be a primary challenge out of Phoenix and from the left. State Rep. (and de facto future State Sen.) Kyrsten Sinema, who represents much of the Phoenix portion of this district already and is seen as a major rising star in the liberal wing of the state party would probably take a look (incidentally, she’d be the first openly bisexual member of congress).

Barack Obama won 54% of the vote here in 2008.

Counties Obama McCain Others Total Kerry Bush Others Total
Maricopa (part) 96261 78728 3469 178458 88501 79006 1231 1687382

AZ-06 (Teal): Rep. Jeff Flake, R+13.5

-Mesa, Apache Junction, northern Gilbert

71% White, 22% Hispanic

The current version of this district has swelled to become the largest in Arizona, so it needed to shed quite a bit of territory. It now takes in the entirety of Mesa (picking up the westside that was shed by the 5th) but loses its portion of Chandler, almost of Gilbert, and all of Queen Creek & the San Tan Valley. Mesa, which has sizable Mormon and retired communities, is starting to become more diverse with a growing Hispanic minority, and may eventually be at the center of a swing district. In the short-term, however, it should continue to be one of the Republican strongholds in the interior West.

John McCain won 60% of the vote here in 2008.

Counties Obama McCain Others Total Kerry Bush Others Total
Maricopa (part) 72159 114697 3793 190649 64189 114338 1038 179565
Pinal (part) 8099 12268 257 20624 7633 11114 92 18839
Total 80258 126965 4050 211273 71822 125452 1130 198404

AZ-07 (Cyan): Rep. Raul Grijalva, D+8.9

-Western Tucson, most of Yuma, Nogales

57% Hispanic, 33% White

While from the best information I can gather, this district was not actually mandated by the Justice Department, thus the fact that it was only 50.6% Hispanic in 2000 and was basically reliant on White liberals in Tucson to ensure the election of a Hispanic. However, with Arizona pushing 30% Hispanic, only one district where Hispanics are decidedly in the drivers seat isn’t going to do it, thus making the 7th a little more Hispanic was a major priority. It pulls out of Maricopa County for population reasons (except for that small part on the Tohono O’odahm Rez) and Pinal County because, despite what DRA says, that region has swelled somewhere north 40K and is decidedly suburban, making the prospect that it is still majority Hispanic highly unlikely. Taking suburban Yuma out of the district goes a long way, and allows this district to become more Hispanic while only making minor alterations to the Tucson area. It should continue to be safely Democratic, especially if Republicans keep nominating that White supremacist.

Barack Obama won 59% of the vote here in 2008.

Counties Obama McCain Others Total Kerry Bush Others Total
Maricopa (part) 17 12 0 29 40 4 0 44
Pima (part) 73583 42308 1505 117396 70118 38064 721 108903
Pinal (part) 115 34 0 149 174 34 0 208
Santa Cruz (part) 7259 3222 65 10546 5637 3397 50 9084
Yuma (part) 16066 19428 334 35828 13762 18259 173 32194
Total 97040 65004 1904 163948 89731 59758 944 150433

AZ-08 (Pink): Rep. Gabrielle Giffords, R+4.3

-Eastern Tucson, Casas Adobes, Catalina Foothills

74% White, 17% Hispanic

Certainly the district that changes the least as far as presidential performance, though I did try to make it more urban-suburban based and more military-centric by dropping rural Cochise County to the 1st. This should be another district that Obama wins in 2012 if he manages to carry the state.

John McCain won 52% of the vote here in 2008.

Counties Obama McCain Others Total Kerry Bush Others Total
Cochise (part) 8409 15365 397 24171 7242 14460 128 21830
Pima (part) 132618 141801 3108 277527 122890 132694 1387 256971
Pinal (part) 2660 3953 40 6653 2014 3221 16 5251
Santa Cruz (part) 1424 1296 36 2756 1272 1271 30 2573
Total 145111 162415 3581 311107 133418 151646 1561 286625

AZ-09 (Green): NEW, R+14.3

-Peoria, Surprise, Prescott

77% White, 16% Hispanic

The fact that the Republican performance in several districts decreased should balance out the fact that this district will now be the most Republican in Arizona. If AZ-01 is the rural district, this is the medium-sized town district, encompassing most of the Prescott-Prescott Valley area, Bullhead City, Kingman, Lake Havasu City, and suburban Yuma. However, a little more than half of its population lives in the West Valley of Phoenix, as evidenced by the fact that rapidly growing Peoria and Suprise are the two largest cities. The Sun City area rounds out this heavily conservative district’s tilt and contributes to a large retired population along with Mohave County.

This district is pretty much impregnable for us. As I mentioned, Trent Franks would probably seriously consider running out here. If not, potential new representatives include current SOS and former State Senate President Ken Bennett, current State Senate President Bob Burns (though he’d be 74 on election day 2012, so that might not be realistic), State Sens. Steve Pierce and Jack Harper, though it would probably a five-ring frakus no matter what happens.

John McCain won 62% of the vote here in 2008.

Counties Obama McCain Others Total Kerry Bush Others Total
Coconino (part) 185 60 2 247 213 61 2 276
La Paz 1929 3509 114 5552 1849 3159 48 5055
Maricopa (part) 67007 109897 2865 179769 47540 77762 525 125827
Mohave 22092 44333 1180 67605 20503 36794 510 57807
Navajo (part) 704 169 5 878 780 161 4 945
Yavapai (part) 19011 33789 756 53556 17036 29952 283 47271
Yuma (part) 2493 5149 120 7762 2270 3925 34 6229
Total 113421 196906 5042 315369 90191 151813 1406 243410

AZ-10 (Indigo): NEW, R+10.1

-Chandler, most of Gilbert, Ahwatukee Foothills

62% White, 25% Hispanic

The second new district pairs the rapid growth in southeastern Maricopa County with the rapid growth in western Pinal County to create a district that had barely more than 100K residents 25 years ago. Their remains some agriculture (mainly in Pinal County) and some Native Americans (the awkward reentry of the district into Maricopa County west of the 4th district is so that it can take in the rest of the Gila River Indian Reservation; Indian Reservations cannot and will not be broken up, btw, so please don’t suggest that in your comments), but it’s identity is first and foremost suburban. The sizable Hispanic community and swing areas like Ahwatukee could help make this district competitive, but any Democratic candidate will have to struggle to not be absolutely demolished in Gilbert and the San Tan Valley.

Politically, it leans pretty strongly Republican and was drawn to elect one, but there is some potential that it could end up in a Democrat’s hands. Potential Republican candidates include State Senate President pro tempore Thayer Verschoor and State House Majority Leader John McCormish. Democratic State Senate Assistant Minority Leader Rebecca Rios, who represents the Pinal County portion of the district and will be term limited in 2012 anyway, may be able to make this a horse race.

John McCain won 57% of the vote here in 2008.

Counties Obama McCain Others Total Kerry Bush Others Total
Maricopa (part) 93790 126879 3301 223970 71363 108729 885 180976
Pinal (part) 29052 38652 795 68499 13011 18728 166 31905
Total 122842 165531 4096 292469 84374 127456 1051 212881

South Carolina Redistricting Maps

I made this map aiming for a 4-3 Republican delegation. Even though I strengthened shaky Republicans like Henry Brown and Joe Wilson from the 1st and 2nd districts, I was able to create a new safe Democratic district. This is assuming that South Carolina gets another district and that Joe Wilson and Henry Brown survive 2010. My main objectives were to keep John Spratt and James Clyburn safe and create a new Democratic district. The problem is that I wanted to create a new African American majority seat but I was unable to. Maybe the new district could be branded as a coalition district since Whites are a minority. This plan will probably not pass if Republicans control the legislature and the Governorship. Anyway, my next map will be Georgia or Minnesota. There will be no “different state” on the poll this time. Yes, I love giving polls and I have been asking the same question, I will admit. I guess I do not need to explain what the rankings mean. Well, here is the link to the maps http://frogandturtle.blogspot….

District 1 Henry Brown (R) Blue

Yes, I had to strengthen him even though I did not want to. He won by 4 points against openly lesbian Linda Ketner. In South Carolina, such a narrow win against an openly gay candidate is humiliating to Brown. I strengthened Brown by removing most of Charleston County (his district connects by water.) He should be safe with a strong base in Horry County and the Republican parts of Charleston County. I think McCain won this district with about 60% of the vote. Racial stats are 15% African American, a few points lower than the percentage for the current 1st and 78% White. Status is Safe Republican.

District 2 No Incumbent Green

This was my failed attempt at an African American majority district. It takes in most of Charleston County and Democratic parts of Berkeley and Dorchester Counties. I know I am going to get criticisms for not exchanging some parts of the 2nd district with the 1st. I wanted to make the White population a minority here so I could form a coalition district. I am not sure if I can do that with such a low Hispanic population. This district also takes in every Democratic area near the coast and even snakes up into heavily Republican Aiken in Central South Carolina. Even though I could have made this an African American majority district, I had to protect Clyburn without creating a district more convoluted than the old NC-12. Anyway, Obama probably won 58% of the vote here. Racial stats are 46% African American and 47% White. Status is Safe Democrat.

District 3 Gresham Barrett (R) Purple

I know that Wilson won by eight points in the last election but I needed to strengthen the 2nd district. I changed the look of this district a bit by extending it completely up the border of South Carolina and Georgia all the way up to the North Carolina border. I removed all of Richland County (Columbia) and almost all of Conservative Lexington County. Even though Gresham Barrett has his home here, Joe Wilson might take a run because it contains most of his old district. From the looks of the district, only a strong challenger could make this competitive. McCain probably won here with 63% of the vote. Racial stats are 20% African American and 74% White. Status is Likely Republican.

District 4 Bob Inglis (R) Red

Since the South Carolina Up Country is so Conservative Inglis should have no trouble here winning against a Democrat. I made the district even more Republican by removing the inner city of Spartanburg. This district is still based in Greenville and I had the district take in part of Pickens County. I think McCain won here with 64% of the vote. The racial stats are 16% African American (lower than the 20% African American population from the old 4th,) 6% Hispanic and 75% White. Status is Safe Republican.

District 5 Joe Wilson (R) Yellow

Joe Wilson should be strong in his Lexington County base but he should be wary of a challenge from the northern part of the district. An Up Country Republican may take a run at this district and looking at Wilson’s not so large 54% winning percentage from 2008, he may be in trouble in a primary. He should not worry about the general election because the territory the district includes is heavily Republican. McCain probably won here with 67% of the vote. The racial stats are 17% African American and 75% White. Status is Safe Republican.

District 6 John Spratt (D) Teal

Even though I needed to keep the African American percentage high for two other districts, the African American population of this one did not change much. It decreased by one point, to 31%. Since I kept most of the old territory in this district, I believe that Spratt should not worry about a challenge. He has been Congressman since 1982. I think that McCain won with 53% of the vote here. The racial stats are 31% African American and 64% White. Status is Safe Democrat.

District 7 James Clyburn (D) Gray

This district looks a bit convoluted. I had to make it this way to keep it an African American majority district so the Voting Rights Act can protect it and also protect Clyburn. I barely succeeded in keeping the African American population above 50%. I had to extend it all the way up to Spartanburg and I almost sent it into Greenville to take in African American precincts without endangering the 2nd or the 6th district. Clyburn should be safe even from a primary challenge. Obama probably received 62% of the vote here. Racial stats are 51% African American and 43% White. Status is Safe Democrat.

By what margin will Bob Shamansky win?

View Results

Loading ... Loading ...

A “Fair” Florida Map

Florida

The Scenario:

If Alex Sink or another Democrat were to capture the Governorship, I can easily see them letting a judge draw the maps-they can seldom get anything worse than what the map currently is and they would almost certainly gain more seats then they would in an incumbent protection map. I also assume that Florida only gains a single seat, rather than the 2 some are predicting (opinion is widely split on that).

So, here goes. I know my FL-4 will spark a lot of controversy.  

North Florida (Districts 1-6)

FL-1: A very conservative Pensacola based district and a cakewalk for Jeff Miller.

FL-2: A modestly more Democratic friendly version of the 2nd which Allen Boyd should have no problem with.

FL-3: Ander Crenshaw should love this heavily GOP district with its base in the Jacksonville suburbs and exurbs.

FL-4: Replaces the old Florida 3rd; entirely within Duval County and is 33.8% African American, compared to the 49% it is now. Would it trigger a lawsuit? Almost certainly. However, there is absolutely no way to draw a black majority district in North and Central Florida. I spent four hours trying and got something that was like 48% black and looked like an octopus. Since the Supreme Court has ruled in Bartlett v. Strickland that a district must be 50%+ minority to be protected under the VRA (unless I’m misreading the decision). Thus, I went for compactness while keeping the minority heavy parts of Duval together. It should be winnable for a black Democrat, as they would be favored in the primary, and I can’t imagine the GOP winning a 34% African American urban district (when you add in Latinos, minorities are 38% of the district).

FL-5: Similar to the current 5th, though more North and Central Florida than exurban Tampa. Should elect Ginny Brown-Waite or another GOPer easily.

FL-6: One of the more interesting new districts created out of parts of the current 3rd, 6th, and 7th. Its basically a battle of bases, with the GOP being strong in the St. Johns part of the district and Dems having all of Alachua County. The Marion County portion though, gives this district a slight GOP lean, though I can absolutely see a moderate to Blue Dog Dem winning this seat.

The I-4 Corridor

(FL-7 to FL-12 and FL-24)

FL-7: Suburban Orlando, taking in parts of Seminole and Osceola Counties. I would expect this to be something like a 53-47 Democratic district.

FL-8: Orlando’s downtown core and some suburbs. Allen Greyson will love it.

FL-9: Suburban Greater Tampa. Probably would elect Gus Bilrakis again.

FL-10: A significantly more Democratic version of the current district. If Charlie Justice gets elected next year, he’ll love this district.

FL-11: Tampa’s downtown core and some of suburban Hillsborough County. Probably less Dem than its current configuration but still plenty safe for Kathy Castor.

FL-12: A Hillsborough-Polk Tampa suburban district that looks like a tossup.

FL-24: A Volusia/Seminole based district that would elect Suzanne Kosmas.

South Central Florida

FL-13: A Sarasota County based seats with large hunks of Charlotte and Manatee Counties. Leans to likely Republican.

FL-14: The leftovers district. A Republican lock, though I’m pretty sure it has no incumbent.

FL-15: Republican Brevard and Indian River Counties plus the leftovers of Osceola. Bill Posey, with his wingnuttia could make it extremely interesting.

FL-16: Democratic St. Lucie plus marginally Republican Martin and a big chunk of north Palm Beach County. On paper, its Democratic leaning.

FL-17: Fort Myers based. Connie Mack is safe.

Southeast Florida (West Palm Beach, Broward, Miami-Dade)

FL-18: A Democratic South Palm Beach County seat. My guess is Robert Wexler runs here.

FL-19: A much safer district for Ron Klein.

FL-20: A Dem friendly district for Debbie Wasserman Schultz.

FL-21: A black majority district for Kendrick Meek’s successor, though I had to strip out some African American precients to get Alcee Hastings over the 50% hump in the 23rd.

FL-22: Cubans in Miami and down the coast, but wholly in Dade County. Possibly the safest of the 3 Cuban districts now.

FL-23: Basically the same as is now.

FL-25: Hialeah based, Joe Garcia stands a much better chance in this version of the district.

FL-26: What’s left of Dade and Collier plus the Florida Keys.

Results:

Dems hold everything they have now and probably pick up the Florida 7th, at least one of the Cuban Districts (I’d bet on the 25th), and maybe the 12th. A Dem will carry my new 10th as well.

The 6th is a tough GOP hold, and Bilrakis could have trouble in the new 9th. Posey is capable of turning a relatively safe 15th into a battleground.

SSP Daily Digest: 6/30

IL-Sen: Here’s a fairly big-name entrant to the Illinois Senate: Chicago Urban League President Cheryle Jackson, who just formed an exploratory committee. Jackson had occasionally been rumored to be interested (to the extent that Jan Schakowksy’s internal poll included her, where she got 17% when explicitly substituted for Burris) but hadn’t taken concrete steps. Jackson has two demographic positives: with Schakowsky out, she’d be the only female in the race (unless, of course, Lisa Madigan gets in, in which case the game would be over anyway), and she’d be the only African-American in the race who isn’t Roland Burris. However, she used to be Rod Blagojevich’s press secretary prior to taking over at the Urban League, so the Blago stench may be hard to wash off.

ND-Sen: All had seemed quiet on the midwestern front, especially after that R2K poll that showed him getting flattened by Byron Dorgan (57-35), but Gov. John Hoeven recently showed at least a peep of interest in running for Senate after all… even if it was just a statement that he was still making up his mind and would decide by September. GOP state chair Randy Emineth said that Hoeven “wants to” run against Dorgan, but we’ll need to actually hear from Hoeven.

NH-Sen: The swabbies at ARG! pointed their spyglasses toward the 2010 open Senate seat in New Hampshire, and find that Rep. Paul Hodes would defeat ex-Sen. John Sununu 40-36. No numbers for the much-hyped AG Kelly Ayotte.

NV-Sen, NV-Gov: In the face of relentless wooing from GOP Senators, Rep. Dean Heller has set a deadline of June 30 to make up his mind about whether he runs for Harry Reid’s Senate seat. (Wait a minute… that’s today!) Heller’s other options include staying in NV-02 or running a primary challenge in the governor’s race — where the younger Reid (Rory, the Clark County Commission chair) seems to be staffing up for the race on the Dem side.

PA-Sen: Joe Torsella, who briefly was running against post-party-switch Arlen Specter in the Democratic primary before dropping out, has endorsed Specter. Not surprising, since Torsella is a big ally of Gov. Ed Rendell, who has pledged his support to Specter.

CT-Gov: More indications that Ned Lamont is getting serious about running for Governor (probably against incumbent Jodi Rell) in 2010. Lamont is looking at an early-2010 deadline for deciding, but can get away with a shorter timeframe as he can self-fund and won’t need a long ramp-up for fundraising.

NJ-Gov (pdf): PPP takes their turn at polling the New Jersey Governor’s race and find about what everyone else has been finding: Chris Christie leads incumbent Jon Corzine 51-41, with Christie benefiting from a 60-26 lead among independent voters. Good news, relatively speaking, for Corzine, though, is that Christie’s negatives are rising quickly as he’s starting to get defined in the media, up to 43% favorable and 33% unfavorable.

SC-Gov: Lt. Gov. Andre Bauer has publicly floated the idea that he would stand down from running in 2010 if he got to be Governor now, if Mark Sanford would just go ahead and resign (please?). His potential 2010 rivals are looking at this as statesman-like grandstanding, especially since it looks like Sanford is digging in.

AK-AL: In case there was any doubt, the indestructible Rep. Don Young has announced that he’s running for re-election. Young is 76 and in perpetual danger of indictment, but with the state’s political talent gravitating toward the Governor’s race, may have an easier path in 2010 than in 2008.

CA-36: Los Angeles City Councilor Janice Hahn has been telling supporters that she’s interested in running for Rep. Jane Harman’s seat. She doesn’t seem to be thinking primary, though; Hahn, for some reason, believes Harman (still under a bit of a cloud from the wiretap incident) is up for appointment to something, maybe Ambassador to Israel, in the Obama administration.

FL-12: State Sen. Paula Dockery made clear that she won’t be running in the 12th; she endorsed former State Rep. Dennis Ross for the job. She seemed to leave the door open to the Governor’s race, saying in her statement that “my passion for public policy is in state government.”

IL-07: With Rep. Danny Davis looking to move over to the Presidency of the Cook County Board, Chicago-area Dems are already eyeing the super-safe open seat. Davis’s former chief of staff Richard Boykin (now a lobbyist for Cook County) seems to be the first to make his interest publicly known.

NH-01 (pdf): Manchester mayor (and NH-01 candidate) Frank Guinta is due for the Bad Samaritan Award, as he watched several of his friends (an alderman and a state Representative) beat up another acquaintance in a barroom brawl, ending with the man’s leg being broken in seven places, and then immediately left the scene without reporting it to the police. Guinta said he was unaware of the extent of the man’s injuries and contacted police at that point. No charges have been filed in the incident; still, not the kind of free publicity a political candidate likes to get.

NY-03, NY-Sen-B: Rep. Peter King is sounding even iffier than before about running for Senate against Kirsten Gillibrand, having scored a desired slot on the Intelligence Committee.

NY-23: Investment banker Matthew Doheny anted up with a lot of cash to jump into the Republican side of the race to replace Rep. John McHugh: $500,000 of his own money. Roll Call reports that he’ll need the ostentatious display of cash to get anywhere in the candidate-picking process, as Assemblypersons Dede Scozzafava and Will Barclay are both reaching out behind the scenes to party leaders.

Redistricting: Regardless of what nonsense happens in the New York Senate this session, it’s looking more and more like the GOP’s toehold on legislative power will be vanquished in post-2010 redistricting, regardless of who controls the legislative redistricting process. Because of growth in the city and declines upstate, 1.2 seats will need to be shifted from downstate to NYC (and, as an added bonus, an extra one-sixth of a seat will shift to the city if the Census Bureau goes ahead and starts counting prisoners according to where they’re actually from rather than where they’re incarcerated).

Fusion Voting: Here’s one way in which Oregon suddenly became a lot more like New York: the state legislature decided to allow “fusion voting,” in which a candidate can run on multiple party lines on one ballot. This will be a boost to minor parties in Oregon, by letting them form coalitions with the major parties instead of simply playing spoiler.

Fundraising: It’s June 30, and you know what that means… it’s the end of the 2nd fundraising quarter. If you want to give some momentum to your favored candidates, today’s the last day to do it.

Louisiana Redistricting Maps

Well, I checked the poll results from my New Jersey map and the most popular result was Louisiana. I next plan to do Minnesota or Georgia so you can help me decide by voting in the poll below. Mainly because of Katrina, Louisiana will lose one electoral vote. Unfortunately, most of the population loss comes from New Orleans, a Democratic stronghold. This means that I had to extend the 2nd district all the way out to Baton Rogue through some marginal territory. My main objectives were to keep the 2nd district at Black majority status, keep the 3rd district safe enough for a Democrat. Charlie Melancon, its current Representative is running for Senate so the district needs to be safe enough for him if he loses the Senate race and decides to return to the 3rd. It also needs to be safe for another Democrat who would replace him if Melancon beats Vitter. I was able to create the majority Black 4th district which is very convoluted. You will see it before I even tell you what color it is. I think the map will create a 3-3 delegation. Trust me, a Republican controlled Legislature and Governorship will never let this plan pass. Feel free to share your thoughts. The link to my maps is http://frogandturtle.blogspot….

District 1 Steve Scalise (R) Blue

This district contains St. Tammany and Livingston Parishes. It contains parts of Jefferson, Ascension, Tangipahoa, and Washington Parishes. I tried to make this district as Republican as possible and I think I got it to be somewhere in the low 70’s. I slightly increased the Black population to 14% and the white population is 77%. Since Bill Cassidy is losing his Baton Rogue based district, he might want to take a run at this one. He probably will lose to Scalise, the current 1st district congressman. This is definitely a safe Republican hold. Status is Solid Republican.

District 2 Joseph Cao (R) Green

Since New Orleans lost a lot of people through Katrina, I had to snake the district up into Baton Rouge. This was detrimental to my plan and may have inadvertently weakened a few Democrats. The district contains all of Orleans Parish, parts of Jefferson, St. Bernard, St. Charles, St. John the Baptist, St. James, Ascension, Iberville, West Baton Rouge and East Baton Rouge Parish. This district barely has an African American majority and I hope that a Democrat holds it instead of Cao by the time they redistrict. It looks to me like a safe hold for a Democrat so we should not worry. Well, the stats are 52% Black and 39% White. Obama’s numbers here were probably between 58% and 64%. Status is Solid Democrat if Cao loses in 2010 which will probably happen.

District 3 Charlie Melancon (D) Purple

Before I tell you more about this district, I just want to say to Charles Melancon that I wish I gave you more Democratic precincts. I removed a lot of the river ones when I gave them to Districts 2 and 4. Anyway, the district has been Conservative while Melancon had it and he has been able to win not by nail biters. Since its original form has not been altered much, he could probably find a way to hold on unless a strong Republican ran against Melancon. Unfortunately, I put in some Republican precincts in East Baton Rogue but I think they should not alter the district too much. They might encourage Bill Cassidy to run in this district. Since he is unfamiliar to the voters outside of the Baton Rogue area, he does not have a strong chance of winning. The stats for the district are 24% Black and 69% White. They are the same as the current demographics for the district so I think Melancon will hold it unless Boustany decides to bail out and not run in the 6th. This district should vote Democratic in statewide elections. Status: Likely Democrat if Melancon runs without the 6th district congressman, Lean Republican if he does not.

District 4 No Incumbent Red

Boy, did I try here to pull off one. I created it to connect precincts with African Americans from Baton Rouge to Shreveport! It meanders along the river then extending across the northern border into Shreveport. It snakes into Monroe to take in a few Black precincts. Still, the northern parishes are Conservative and they drastically reduced the Black percentage of the population. Also, I had to extend the district to the east a bit because the 1st had too many people. I did it reluctantly but the eastern areas should not offset the Democratic areas enough. I do not know who would run here but I think Dan Cazayoux might want to give it a go. Or the guy who almost won the Shreveport seat might try too and since the bases are equal, this could trigger a large primary on the Democratic side. The Black population is 51% and the White population is 44%. This means that the district is now protected under the Voting Rights Act. It resembles the Cleo Fields district from the 90’s but this district is now much more Democratic. I estimate Obama won in this district somewhere in the range of 53% to 57%. Unless the Republicans can find a credible challenger, this district appears to be headed for the Democratic column. Status is Likely Democratic.

District 5 Rodney Alexander vs. John Fleming Yellow

Stats are 26% African American, 70% white. You could say that this district is the leftovers from the 4th district. The 5th district is meant to be safe for whichever Republican wins it. It should be safe for him and McCain probably won it within the 65% range. It contains the northern part of the state except for most of Shreveport, the border with Arkansas and the Mississippi River. Alexander could have a competitive primary with John Fleming but Alexander should probably win because the new 5th contains more of his district. Status is safe Republican.

District 6 Charles Boustany (R) Teal

This district closely resembles the old one. It has a 24% Black population and a 70% white one. I estimate McCain won this in the neighborhood of 66% of the vote. It takes in part of Lafayette and goes up the Texas border almost to Shreveport. John Fleming might take a go at this district but would probably lose to Boustany. This district might be competitive in statewide elections but in national races, the Republican hold it. Status is Safe Republican.  

By what margin will Bob Shamansky win?

View Results

Loading ... Loading ...

Redistricting South Carolina: 2 Black-Majority Seats UPDATED

Ok, so this is my first redistricting diary not focused on Michigan.  I chose the state of South Carolina for several reasons, it’s relatively small, it will probably gain a seat, and that new seat may be a Majority-Minority seat.  I don’t know if the DOJ will require a new Min-Maj seat, or what the recent Supreme Court decision has to do with this.  

The rest of the map I drew with a Republican gerrymander in mind.  I tried to dislodge Rep. Spratt, and I think that I was probably successful.  I also made Rep. Brown and Rep. Wilson safer, in light of their recent competitive races last year.  

This map is incredibly gerrymandered.  I mean incredibly.  I don’t know much about SC, so let me know if I’ve done something wrong.

District 1- Henry Brown (R) Blue

72% White, 19% African American, 6% Hispanic

Drops all of Horry County (Myrtle Beach) in exchange for Beaufort, Hilton Head area.  Drops some heavily African American areas in exchange for more Republican Charleston areas.

District 2- Joe Wilson (R) Green

77% White, 17% African American, 3% Hispanic

This is the most gerrymandered non-VRA seat, mostly so that it can cede it’s black areas to the new 7th District.  It follows the SC-GA border, then winds down to the Columbia area and takes in almost all of Lexington County, where Wilson’s home is located. AA population drops almost 10% and this district is much safer for Wilson.

District 3- TBD (successor of Gresham Barrett) Purple

78% White, 14% African American, 5% Hispanic

Includes all of Oconee and Pickens as well as northern Greenville and Spartanburg Counties and winds down to pick up some conservative Columbia suburbs formerly in Wilson’s district.  This district includes Barretts home but may or may not contain the home of his successor, which could be problematic if he or she is from Anderson County. Black population drops 6%

District 4- Bob Inglis (R) Red

70% White, 22% African American, 5% Hispanic

Includes all of Anderson Couny and the cities of Greenville and Spartanburg.  By far this is the least gerrymandered district in the state.  Because it now grabs Aiken County and due to growing minority populations in North SC, the African American and Hispanic populations actually go up in this district slightly.

District 5- John Spratt (D) Yellow

75% White, 18% African American, 4% Hispanic

I drew this district with the intend of defeating John Spratt, because I doubt that South Carolina Republicans settle for a 3-4 Delegation, especially because 2 districts are VRA.  The African American vote here is nearly halved, and the district now stretches into Horry County and includes all of Myrtle Beach, a Republican stronghold.  I don’t know whether Spratt would win this district, but he may decide to retire rather than find out.

District 6- Jim Clyburn (D) Blue-Green

52% African American, 43% White, 2% Hispanic


This district takes in more of Columbia than before and stretches north into Fairfield, Chester, and Union Counties.  To stay majority African American, and to hurt Spratt, it has now grown several oogie tentacles that slither into some of the more rural African American areas, as well as a few small cities.  Don’t worry though, it remains contiguous.  Despite the additon of another majority Black district, the AA population only falls about 5%

District 7- NEW (D) Gray

54% African American, 41% White, 3% Hispanic


I’ll admit, this district is awfull, but maybe not as awful as it looks at first glance. It starts by taking in the Black neighborhoods of Charleston and North Charleston, the takes in as many black majority tracts as humanly posible without going into Columbia.  I tried to salvage some integrity for this map, so I made sure that there were no oogie tentacles like in the 6th, so give me credit for that at least.

What does everyone think? Are they legal?

Update– Based on comments and criticism, I’ve totally redrawn my map, this time giving Spratt the African American majority seat instead of creating a new one.  This district is  a thousand times less gerrymandered than the last, so I think you’ll all like it much better.

Spratt’s New District is exactly 50% Black

While Clyburn’s is about 55% Black.

To compensate for lost population, Clyburn’s district takes in more of both the Charleston and Columbia areas.


The  new 7th district follows the North Carolina border from Spartanburg to Myrtle Beach, taking up much of what was Spratt’s District.  The other districts remain almost unchanged, although the first and second become a few percentage points more white. I tried very hard to split as few counties as possible, and even though it may look bad, many counties remain compact in even the 5th and 6th Districts.