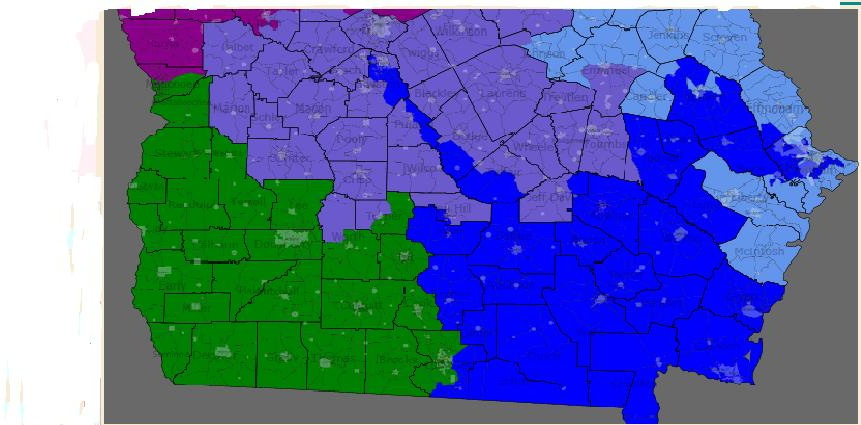
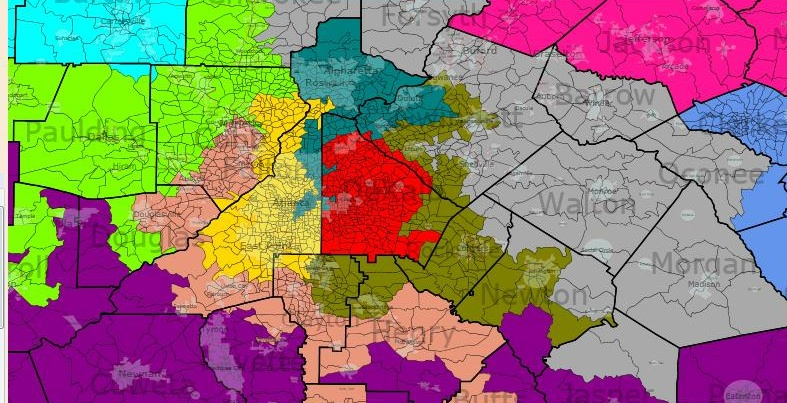
How To Stop the Embarrassment: MN Redistricting 8 Seat Map

Yeah, here’s another Minnesota redistricting…

My 7 seat map can be found here.

I did none of this with a computer program or anything like that.  i was fortunate that MN provides all the info I needed to do this with the MnSOS office providing all the vote totals and also precinct maps of every state house seat, which was the main way I broke down the districts by vote and population when I didnt need to break it down to city/township/precinct level.  The state legislature websites has excellent maps with the two I used constantly were a map of the all the state house seats that also showed city boundaries which made it my go to map for figuring out my planned geography.  More importantly though, a precinct map of the entire state showing election results from dark red to dark blue.  I found county population totals for 2007 and when they broke down beyond that point, I wikipediad it which sometimes included 2006 estimates but mainly for 2000 totals and then I used common sense for population movements, figured out the percentage of growth for that county/area, etc to figure out the 2007 population of said city/precinct.  There is certainly some error involved in this but nothing that would alter more than a couple precincts here or there and then my map accounts for current population movement as opposed to 2000, little bit of a trade off there.

Everything is recorded in excel spreadsheets, they look like a hot mess.


Photobucket

map with county lines can be found here

My CD4 is quite a gerrymander but none of that is essential to district make up.  This map could easily be changed to provide nice clean lines but I wanted to pack Dems and Reps to see what the best case scenarios could be.  Undoing any gerrymanders would still result in my intended goals.

This is map is either a 7/1 or 6/2 map. Bachmann can’t win her district but a more moderate Republican possibly could.  And Kline is now uber safe.  Paulsen is drawn out of his district and could possibly run there, but you’ll see later that the Obama margin for victory there is Philly/Chicago suburb like and he’d probably not bother moving. 7/1 at the best 6/2 at worst.

As for the tables, the first 08 is the new Obama vs McCain percentage for each of my districts, second 08 is what the current district got.  And then the following years are what the current districts got as well with them being the three-way vote.  Then next is population and what each county got in 08 and 04.

MN-1 Rep. Walz Pop. 2008 2008 2004 2004
Total 651557 50/45.5 51/47 48/52 47/51
Pop. Obama McCain Kerry Bush
Houston County 19515 54 44 48 51
Winona County 49802 58 39 52 46
Watonwan County 11022 49 48 45 53
Steele County 36378 46 51 56 43
Dodge County 19552 44 54 42 57
Wabasha County 21783 47 50 47 52
Olmsted County 76470 51 47 47 52
Mower County 38040 60 37 61 38
Freeborn County 31257 57 41 55 44
Waseca County 19528 45 53 43 56
Blue Earth County 59802 55 42 48 51
Nicollet County 31680 54 44 50 49
Martin County 20462 41 56 42 57
Brown County 26013 43 55 37 61
Murray County 8511 49 48 44 54
Jackson County 10883 47 51 46 52
Cottonwood County 11349 46 52 43 56
Nobles County 20128 48 50 42 56
Pipestone County 9305 42 55 38 61
Rock County 9498 42 56 39 60
Faribault County 14869 46 51 43 55
Fillmore County 21037 53 44 49 50
Lincoln County 5877 49 48 47 52
Redwood County 15519 42 55 38 62

This district changed very little, it took an extra county here and there but more or less, I didn’t want to change it.  Walz is already winning by large margins and he’s an excellent fit for the district.

MN-2 Rep. Kline Pop. 2008 2008 2004 2004
Total 651855 40/58 48/50 38/60.5 45/54
Pop. Obama McCain Kerry Bush
Wright County 117372 40 58 38 61
Scott County 62113 39 59 37.5 61.5
Carver County 88459 41.5 57 36 63
Dakota County 38718 44 54 39 60
Sherburne County 86287 39 58 39 60
Stearns County 86586 40 55 40 58
Benton County 5881 36 61 36 63
Hennepin County 72869 37 62 37 61
Anoka County 54649 40 58 40 59
Isanti County 38921 41 56 41 58

I decided to tie all the conservative exurban areas together along with Republican suburbs, putting all the republican counties into one congressional district instead of spread across two.  This makes it mainly a combination of CD2 and CD6, and takes out the main Republican-fundy base of Bachmann’s district.  It takes out the counties around the St. Cloud area, minus St. Cloud, keeps the former second’s GOP base of Carver and Scott county in the southwest (minus some of the suburbs that were 50/50’ish for Obama), also heavily conservative Wright county from CD6, and I threw in Isanti county from CD8 to shore up the GOP into one CD.  The district has a bit of a propeller as I need to pick up more population and those 4 townships in Benton were the most GOP areas to connect to CD2.  Kline lives in the portion of Dakota county that it includes and will be 100% safe in this district.  However, Bachmann will be looking for a seat as well. More on that later.

MN-3 OPEN Pop. 2008 2008 2004 2004
Total 650300 57/41 52/46 53/46.5 48/51
Pop. Obama McCain Kerry Bush
Hennepin County 487008 58 40.5 54 46
Anoka County 163292 53 43 51 48

This district shifts east and north as I cut out some of the traditional upper-to-upper middle class suburbs to take in more working class suburbs bordering Minneapolis to the west and north.  Eden Prairie, Bloomington, and most of Edina now are in CD5 (I kept some of Edina in CD3 for population and gerrymandering as some precincts went 2-1 for Obama while the city as a whole went about 55-45.)  The district then picked up Hopkins, Golden Valley, St. Louis Park, Fridley, Columbia Heights, and a few others in that area.  These areas also have a much higher proportion of minority voters so the district gets a bit less white and without Edina and Eden Prarie, probably drops pretty far in average income.

Paulsen lives in Eden Prairie so technically this district is open.  He could move to run here which he may to give it a shot but it voted for Obama by 16%, an increase of 10% from the current district lines.  We have a HUGE bench in this district to make that happen as there are roughly 25 state reps and senators per CD and the GOP only has about 6-7 of those seats in this CD.  I want to give Paulsen somewhat of a chance of retaining this seat (PA6, IL10) but I really dont know how he could.

Please tell me someone watched Mighty Ducks recently and these cities all sound familiar….  Cake eater is from Edina, Goldburg I believe is Bloomington.

MN-4 Rep. McCollum Pop. 2008 2008 2004 2004
Total 651475 61/38 64/34 58.5/40 62/37
Pop. Obama McCain Kerry Bush
Ramsey County 468147 66 31.5 63.5 35
Washington County 79263 47 51 44.5 55
Anoka County 104065 43 55 42 57

This is the district I gerrymandered the most as I wanted to pack as many Democrats into CD6 as possible.  The northern part of the district is represented by Anoka County exurbs that vote 2-1 GOP in some parts and the north third of Washington County which is exurban but not quite as Republican, maybe 60-40 at worst.  There really isn’t even much population up there as the main source is Ramsey county, which gets a little bit cut up.  The three blobs of gerrymander are as follows.  The main one is St. Paul, to the east, the district picks up the Republican precincts of Woodbury and then in the south it picks up Inver Grove Heights, a swingy suburb.  Safe for McCollum still.

MN-5 Rep. Ellison Pop. 2008 2008 2004 2004
Total 647577 69/29 74/24 65/33 71/28
Pop. Obama McCain Kerry Bush
Hennepin County 583048 71 27 67 31
Scott County 64259 48 50 42 57

As said previously, this district now picks up the south/southwest burbs in exchange for the very liberal first ring suburbs.  All the suburbs have been trending D quite rapidly and most voted for Obama.  The suburbs in Hennepin county, Edina, Eden Prairie, and Bloomington have trended pretty quickly while the two suburbs in Scott County, Shakopee and Savage, were once brutally Republican but population growth has exploded here and has brought them to suburban voting trends instead of exurban voting trends.  This is still extremely safe for Ellison.

MN-6 OPEN Pop. 2008 2008 2004 2004
Total 648958 53/45 45/53 49.5/49.3 42/57
Pop. Obama McCain Kerry Bush
Washington County 181743 54 44 49.5 49.4
Dakota County 327677 52 45.5 49 50
Ramsey County 31744 59 39 57 42
Goodhue County 45839 48 50 47 51
Rice County 17381 55 43 53 45

This is where I began this project as the main goal was how to get rid of Bachmann and make a Dem district.  It starts up in Washington county, takes in the Dem areas like Oakdale and Stillwater, cuts into Ramsey county to take in Maplewood, and then includes most of Dakota county where the northern portion is heavily populated suburbs that have heavily trended Democratic (hold all but one state house seat, which we picked up in 06 but lost in 08) while the rest of the county is townships and Republicanism.  It takes in swing Goodhue county and blue Rice county, where the colleges of Carleton and St. Olaf rack up margins for the Dems.  (Not to be confused with the St. Olaf Rose from Golden Girls is from, there is a St. Olaf township up north in Otter Tail county.)

Bachmann may no longer live in this district as I may have put her in CD4.  I know she recently moved to Woodbury, which is the city I gerrymandered.  So not sure which part of Woodbury carries that witch but regardless, she wouldn’t be a viable candidate in either CD.  I figure her and Kline could have an excellent face off in CD2 in an endorsement and primary.  Both have large constituencies in that district, almost 50/50, with maybe a slight edge to Bachmann in amount of former district.  So I’d consider this an open seat and it is a total swing district so it could go either Democrat or Republican, with the Dems being a slight favorite, especially in 2012 if Obama can manage another 8% win here.

I first had this district extremely gerrymandered to take in more Democrats but I decided to strengthen the Dems in CD3 in exchange for this CD as there is no way Bachmann can win this district, regardless. Here is a map of what I had before.

MN-7 Rep. Peterson Pop. 2008 2008 2004 2004
Total 648519 47/50 47/50 43/55.5 43/55.4
Pop. Obama McCain Kerry Bush
Kittson County 4505 58 40 50 49
Traverse County 3712 51 46 48 50
Stevens County 9624 49 48 47 51
Swift County 11192 55 42 55 43
Todd County 24029 43 54 41 57
Yellow Medicine County 10000 51 46 49 50
Lake of the Woods County 4095 42 60 38 60
Marshall County 9618 49 48 42 57
Becker County 31964 45 52 40 58
Polk County 30708 51 47 43 56
Pope County 11065 51 47 49 49
Clearwater County 8245 44 54 43 56
Red Lake County 4118 51 45 44 54
Mahnomen County 5129 61 36 53 45
Pennington County 13756 50 48 44 54
Clay County 54835 57 41 47 52
Otter Tail County 57031 42 55 37 61
Douglas County 36075 44 54 44 54
Grant County 6021 51 46 49 50
Big Stone County 5385 52 46 50 48
Lac qui Parle County 7258 52 46 53 46
Renville County 16132 48 49 45 53
Lyon County 24695 48 50 42 57
Beltrami County 43609 54 44 50 48
Roseau County 15946 40 58 31 68
Chippewa County 12465 52 46 52 47
Wilkin County 6418 45 52 33 65
Sibley County 15007 45 52 39 59
McLeod County 37220 38 58 37 62
Meeker County 23211 43 54 43 56
Kandiyohi County 40784 46 52 44 55
Norman County 6685 62 35 47 51
Hubbard County 18376 42 56 42 57
Wadena County 13382 40 58 39 59
Le Seur County 28034 47 51 45 54
Stearns County 7785 36 62 35.5 63

I left CD7 pretty much alone.  It’s GOP leaning and always will be, but the DFL is still quite powerful in most of the areas at the local level and it currently has a DFL incumbent, whose got a good decade if not more left until we should expect retirement.  

MN-8 Rep. Oberstar Pop. 2008 2008 2004 2004
Total 649780 54/44 53/45 53/45 53/46
Pop. Obama McCain Kerry Bush
Cook County 5398 60 37 53 45
Lake County 10741 60 38 60 39
St. Louis County 200528 65 33 65 34
Carlton County 33893 62 35 63 36
Pine County 228164 49 48 50 49
Koochiching County 13459 54 44 50 48
Itasca County 44542 55 42 55 44
Cass County 28723 45 53 43 56
Crow Wing County 61648 45 53 42 57
Morrison County 32733 39 58 41 58
Mille Lacs County 26354 45 52 43 55
Kanabec County 16090 44 53 44 55
Aitkin County 15910 48.7 48.8 48 51
Chisago County 50128 44 54 43 56
Benton County 33623 45 52 45 53
Stearns County 51680 53 45 51 48

My biggest question was, what should I do with St. Cloud?  It’s literally in the middle of extremely conservative Stearns, Benton, and Sherburne counties, it’s Dem but the vote margin is only 2,000, thus not making it worth much in votes considering the county I’d have to attach with it.  Benton county provided the smallest GOP margin and CD8 always goes Dem if by a smallish margin at the presidential, so I decided to include it here.  By adding this and eliminating Isanti county, it does get a nice Dem bump. Oberstar is safe until retirement and then it will still be safe DFL when open.

Pennsylvania Democratic Gerrymander

Here is another Democratic gerrymander, this time in Pennsylvania. I am not sure if we can pick up the entire legislature and retain the governorship. If we did, they would probably try to protect new Democrats instead of heading for an all out gerrymander. In my opinion, my map is not too realistic but just in case the Democrats have total control…. This map protects new Democrats while eliminating one Republican seat and endangering the incumbents of two others. I eliminated Charlie Dent’s seat assuming he survives 2010.I am aiming for a 14-4 Democratic delegation as a revenge for the planned 13-6 Republican delegation. My only worry for the Democrats is the 11th district with Paul Kanjorski but even there he should be safe. Here are the maps.

East Pennsylvania

East Pennsylvania

West Pennsylvania

West Pennsylvania

Philadelphia Area

Philadelphia Area

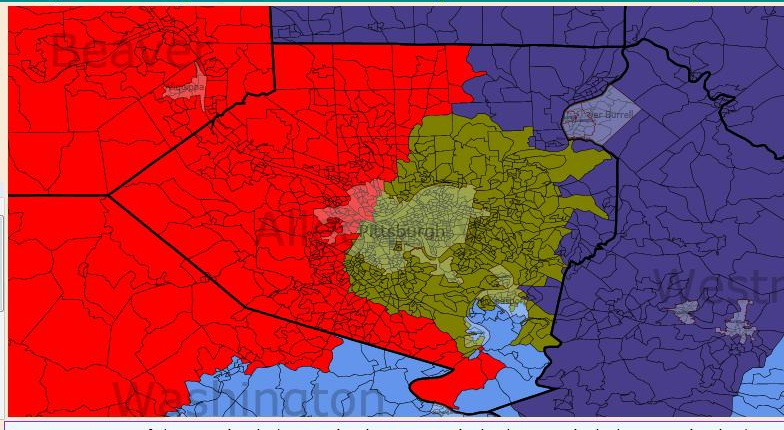
Pittsburgh Area

Pittsburgh Area

District 1 Robert Brady (D) Dark Blue

Robert Brady’s district was safe with the old map and will remain safe this time, even though his district is less safe. I removed some African American areas in western Philadelphia and Delaware County. I added some white parts of Delaware County but they should not affect the voting habits of this district much. Obama probably won 73% of the vote here. Racial stats are 19% African American, 18% Hispanic, 6% Asian and 53% White. Status is Safe Democrat.

District 2 Chaka Fattah (D) Dark Green

For population purposes, I had to send this district up into some white parts of Montgomery County but that should not alter the voting of this district. It stays mostly the same. Obama probably won 85% of the vote here. Racial stats are 58% African American and 32% White. Status is Safe Democrat.

District 3 Kathy Dahlkemper (D) Dark Purple

I was worried about her because she is a freshman. To protect her, I removed all of heavily Republican Butler County and substituted it with some marginal territory along the border. I extended it into the middle of the state to pick up Elk County which Obama barely won. I probably raised Obama’s performance to 53%. She should be safe without a strong challenge. Racial stats are 92% White. Status is Likely Democrat.

District 4 Jason Altmire (D) vs. Tim Murphy (R) Red

To strengthen Altmire, I removed all of Butler County and added some of marginal Washington County. I slipped in some precincts in Pittsburgh as well. He appeared safe in 2008 and he should be even safer. Murphy will probably run in the heavily Republican 17th district so Altmire should not worry. McCain probably won 50% of the vote here. Racial stats are 5% African American and 91% White. Status is Likely Democrat.

District 5 G.T Thompson (R) Yellow

I made this district more Republican to strengthen Democrats in the 3rd and 10th districts. This district basically goes further east, loses Penn State and stays heavily Republican. McCain probably won 63% of the vote here. Racial stats are 95% White, the whitest district in Pennsylvania. Status is Safe Republican.

District 6 Open (Gerleach) (R) Teal

Trust me; this district is not electing a Republican anytime soon. With Gerleach out, this new district would oust any Republican who might have won in 2010. That will probably not be necessary because the Democrats have some good candidates here. The changes I made were removing most of Chester County while giving the district more of Montgomery County. For good measure, 9% of the district is in Philadelphia. The part it has is 75% African American. I see almost no way for a Republican to win here. Obama probably won 64% of the vote here. Racial stats are 13% African American and 78% White. Status is Safe Democrat.

District 7 Open Joe Sestak (D) Gray

I’m a bit worried about this district because I had to extend it all the way out into Republican areas in Lancaster County. I definitely offset Republican margins from Lancaster by putting in heavily African American parts of Philadelphia in this district. Since Chester County is trending Democratic, this district should stay with the Democrats. Obama probably won 57% of the vote here. Racial stats are 14% African American and 77% White. Status is Safe/Likely Democrat.

District 8 Patrick Murphy (D) Light Purple

All I did here was help shore up Murphy by putting in more of Philadelphia which is now 22% of the district’s population. I also removed part of northern Bucks County. Murphy should be fine now. Obama probably won 57% of the vote here. Racial stats are 86% White. Status is Safe Democrat.

District 9 Bill Shuster (R) Bright Blue

I kept the district pretty much the way it is. All I did was move it east so that it is only a few miles away from Harrisburg. I took in Snyder and Union Counties to help strengthen Chris Carney. Anyway, Shuster is safe in the most Republican district in Pennsylvania. McCain probably won 65% of the vote here. Racial stats are 94% White. Status is Safe Republican.

District 10 Chris Carney (D) Pink

If Chris Carney does not represent this district, he probably lost in a primary, retired or the Republicans found the strongest candidate possible. I took out all the heavily Republican western counties and snaked the district into Northampton County (Bethlehem) and Monroe County which voted for Bush but McCain lost it by 17 points. The rural counties to the north lean Republican but they only gave McCain a combined 6,000 vote margin. The only worry I have is that Dent will run but the Democratic margins from Lackawanna, Luzerne and Monroe Counties should offset Dent’s margins from his old district. With the inclusion of most of Lackawanna County are more of Luzerne, Carney is safe. Obama probably won 55% of the vote here. Racial stats are 87% White and 5% Hispanic. Status is Safe Democrat, Likely Democrat if Dent runs.

District 11 Paul Kanjorski (D) Light Green

I am a bit worried about Kanjorski. I had to shore up other Democrats so he lost a few Democratic areas. I tried to help him by sending his district into Lehigh County (Allentown) which Obama won by 15 points. Republican Charlie Dent who represents the 15th district in Allentown may want to run here. Kanjorski had a tight race in 2008 but if he loses, a strong Democrat will probably beat the Republican who won it. Obama probably won 56% of the vote here. Racial stats are 84% White and 9% Hispanic. Status is Lean Democrat.

District 12 John Murtha (D) Indigo

Due to calling his constituents “racists,” Murtha had a ‘tough’ race in 2008 but won by 16 points. The Republicans probably will challenge him again. I’m not the biggest fan of John Murtha myself but we need as many Democrats as possible and a safe district when he retires. To shore him up, I removed all of Armstrong County and part of Westmoreland County. I added in a slice of Alleghany County, all of marginal Fayette County and Penn State. Murtha should be happy. Obama probably won 52% of the vote here. Racial stats are 92% White. Status is Safe Democrat.

District 13 Allyson Schwartz (D) Tan

I had to change Schwartz’s district quite a bit. First, I took out much of Philadelphia and replaced it with part of Bucks and Northumberland Counties. Since those areas both voted Democratic, Schwartz should be safe. She should worry about a primary challenge from the Bethlehem area but her Philadelphia base should probably keep her in Congress. Obama probably won 58-59% of the vote here. Racial stats are 7% African American, 6% Hispanic and 80% White. Status is Safe Democrat.

District 14 Mike Doyle (D) Algae Green

To help protect Altmire, I had to remove the western part of Pittsburgh from this district and substitute it with more Conservative suburbs to the north and south. They should not be nearly enough to endanger Doyle, he appears safe. Obama probably won 65% of the vote here. Racial stats are 19% African American and 74% White. Status is Safe Democrat.

District 15 Tim Holden (D) Orange

Even though Holden seems pretty safe (he won by 28 points in 2008,) I figured that the Republicans would eventually field a strong candidate against him. To help Holden, I added part of Allentown and removed part of Republican Lebanon County. Holden should have no problem at all now that his district is more Democratic. If Charlie Dent ran here, he would probably lose. Obama probably won 51%-52% of the vote here. Racial stats are 7% African American and 5% Hispanic. Status is Safe Democrat.

District 16 Joe Pitts (R) Light green (in Lancaster County)

I am not completely sure if we can knock off Pitts but we definitely have a good shot at it. I removed some of the rural areas in Lancaster County making the district more centered on the city Lancaster. Even though I included part of Republican Lebanon County, I added more of Democratic Reading. The final blow to Pitts is that even though he loses part of Democratic leaning Chester County, he gets heavily Democratic areas in Delaware County and even a couple of precincts in Philadelphia. This should attract some Delaware County Democrats to run. It should be a tight race because Pitts is pretty entrenched yet his margins are dropping. Obama probably won 52% of the vote here. Racial stats are 9% African American, 14% Hispanic and 73% White. Status is Toss Up.

District 17 No Incumbent (R) Dark Purple

If I were Tim Murphy, I would move to this district and run here. It contains part of his old district and takes in the heavily Republican areas of Butler and Armstrong Counties. Other Republicans will probably aim for this seat but Murphy should probably beat them. McCain probably won 61% of the vote here. Racial stats are 95% White. Status is Safe Republican.

District 18 Todd Platts (R) Yellow (on the southern border)

This district stays basically the same. All I changed was that I shrank the district and added some rural areas in Lancaster. Platts is fine. McCain probably won 59% of the vote here. Racial stats are 89% White. Status is Safe Republican.

By what margin will Bob Shamansky win?

View Results

Loading ... Loading ...

Redistricting Washington and Oregon – hope we get those extra districts

According to census estimates, both Washington and Oregon are on the cusp of gaining another district. Hopefully both states will gain a district because they will be Democratic districts.

My goals are:

– Make the new districts Democratic.

– Make Dave Reichert’s district too Democratic.

– Cross the Cascades only once per state.

– Make the districts look compact and look fair.

The state maps are thumbnails. Click on it to link to a full-size map.

10 District Washington:


District 1: Rick Larsen (D) (blue) (Old 2nd)

Rural-and-small-cities Western Washington

The old 2nd district loses some territory in southwestern Snohomish County, including Everett and Marysville, and gainst territory in eastern King and Pierce Counties. Its population does not change much.

Population Per county:

County New 1st Old 2nd
San Juan 96718 96718
Whatcom 196529 196529
Skagit 118000 118000
Snohomish 139664 332734
King 65772 656
Pierce 38591 0

It is probably more Republican than before, but still Democratic enough.

District 2: Jay Inslee (D) (green) (Old 1st)

Cities/Suburbs North of Seattle

The old 2nd district loses its territory west of the Puget Sound and gains more territory in Snohomish County. Now it’s contiguous, and compact, and still safe for Democrats.

District 3: Jim McDermott (D) (purple) (Old 7th)

Seattle

The entire city of Seattle, plus a very small area directly south of the city. Because the suburbs are also very Democratic, there is nothing to gain by splitting the city among several districts. Seattle is 94% of the district’s population.

District 4: Dave Reichert (R) (red) (Old 8th)

Cities/Suburbs East of Seattle

This district is smaller than the old 8th, and more Democratic. Dave Reichert won’t be able to get reelected here.

District 5: Adam Smith (D) (yellow) (Old 9th)

Cities/Suburbs South of Seattle

There must have been a lot of growth here because this district is a lot smaller than the old 9th. It fills the corridor between Seattle and Tacoma without entering either city.

District 6: Norm Dicks (D) (turquoise) (Old 6th)

Cities/Suburbs West of Seattle

The 6th currently takes consists of the entire western peninsula. The new 6th is a compact urban district along the shore of the Puget Sound from Tacoma to Bremerton.

District 7: No Incumbent (gray)

Western Peninsula

This is the new district. It is everything west of the Puget Sound and north of the mouth of the Columbia, except the urban area around Seattle/Tacoma. Its largest city is Olympia. Finally Olympia dominates a congressional district; 37% of the district’s population is in Thurston County. It should be safely Democratic.

District 8: Brian Baird (D) (light purple) (Old 3rd)

Southern Washington

This district is dominated by Vancouver. Clark County is 65% of the district. This is the only district to cross the Cascades. It takes southern Yakima County and eastern Yakima city. Yakima will be the only county in Washington split between a Democratic and Republican district. I don’t have voting data, but here is the demographic data:

Yakima County 8th 9th Total
Population 132430 102134 234564
%White 29% 78% 51%
%Hispanic 60% 16% 41%
%Native 6% 1% 4%

Southern Yakima is a welcome addition to a Democratic district.

District 9: Doc Hastings (R) (cyan) (Old 4th)

Western Eastern Washington

Strongly Republican.

District 10: Cathy McMorris Rodgers (R) (magenta) (Old 5th)

Eastern Eastern Washington

Republican enough.

9 District Washington:


The obvious differences between the 9 District map and the 10 district map are: there are only 4 urban Seattle-area districts, and this time one of the eastern districts has an appendage west of the Cascades.

District 1:

Extends further into the (probably Republican) suburbs of King and Pierce Counties. Now they make up nearly a quarter of the district’s population. So the district is still dominated by its northern counties, still safe for its Democratic incumbent, and should be safe for Democrats in the future.

District 2:

Takes more territory in northern King County.

District 3:

Takes more territory south of Seattle. But Seattle is still 85% of the district’s population.

District 4:

Still a more Democratic version of the existing 8th.

District 5:

Now it includes Tacoma.

District 6:

Similar to the existing 6th, but it trades Tacoma for Olympia.

District 7:

The Baird district loses Olympia and eastern Lewis County, and gains Grays Harbor County. This probably makes the district shift more Republican because even though Grays Harbor is Democratic, it has less population than Olympia.

District 8:

In addition to Eastern Washington, it takes 13000 residents in Lewis County. Lewis County is the only western county that voted for McCain.

District 9:

Just like the existing 5th, but a little bigger.

6 District Oregon:

District 1: Earl Blumenaur (D) (blue) (Old 3rd)

Portland

90% of its population is in the city of Portland. I recommend doing this as long as it doesn’t weaken the other districts too much.

District 2: David Wu (D) (green) (Old 1st)

Portland suburbs

A small suburban Portland district is a good idea, as long as it doesn’t pack in too much Democratic voting strength, weakening the other districts.

District 3: No Incumbent (purple)

Western Willamette Valley and Coast

The several small left-leaning counties in northwestern Oregon usually get split up and attached to urban districts. Now I’m putting them together in their own district. Its largest cities are Hillsboro and Corvallis.

District 4: Kurt Schrader (D) (red) (Old 5th)

Eastern Willamette Valley

I would only recommend creating a district like this if its portion of Clackamas County voted at least 52% for Obama. It includes Salem, Albany, and eastern Gresham.

District 5: Peter Defazio (D) (yellow) (Old 4th)

Southern Oregon

This is an interesting shape, mean to avoid the most rural conservative parts of Western Oregon. It starts in Lane County, including Eugene and Springfield, goes through northwest Douglas County, avoiding as much of the county as possible. It takes in all of Coos and Curry Counties. It takes southern Josephine, including Grants Pass, and southwest Jackson, including Medford and Ashland. It should be more Democratic than the existing 4th.

District 6: Greg Walden (R) (turquoise) (Old 2nd)

Eastern Oregon

All of eastern Oregon plus the rural conservative parts of southwestern Oregon.

5 District Oregon:


If Oregon only gets 5 districts, then at least they will be 4 safe Democratic districts. However it doesn’t preserve the “communities of interest” I created in the 2nd and 3rd districts of the 6 district version.

District 1:

Multnomah County and most of Columbia County.

District 2:

Portland’s western suburbs combined with the rural northwestern part of the state.

District 3:

Nearly all of Clackamas, all of Marion, all of Polk, and the northwest corner of Linn (Albany). Safe Democratic.

District 4:

I’m proud of this one. It starts in Lincoln County (60% Obama) and follows the coast. It takes Eugene and Springfield, as well as Grants Pass, Medford and Ashland.

District 5:

Eastern Oregon and a lot of rural conservative territory in Western Oregon.

Conclusion:

No matter what happens in the census, Republicans should get no more than 2 seats in Washington and 1 in Oregon. Putting Seattle in a single district is a good idea, while putting Portland in a single district could be risky. The idea that a Washington 8-2 plan makes stronger Democratic districts than a 7-2 plan is counterintuitive but it seems to be true.

Redistricting MN: An on the ground perspective

Since I live here in Minneapolis, MN and am addicted to Dave’s Redistricting App, I decided to try my hand at redistricting MN two different ways, first, assuming we lose a district and second, assuming we do not lose a district. The 7 district plan is below and should produce a 6-1 DFL map, or at worst a 5-2. The 8 District Map could be 7-1, but will be 6-2 once Peterson retires I think.

I’m very much a compactness kind of guy, but that doesn’t mean you can’t get a good Democratic Gerrymander with a compact map. The Maps and district descriptions are below the fold:

Here’s the seven district map:

District 1: Tim Walz (DFL) Blue

I originally forgot to include Mankato, Walz’s home, in this district and had to do some fancy work with MN-7 to make in in the district, but it worked. This district has three main bases Mankato, Rochester and then the motherload, Dakota County and the suburbs it contains. This should be a significantly more DFL friendly district than the 1st as it exists now.


District 2: John Kline (R)
Green

Kline should be the lone GOP Representative in MN under this map; I seriously packed GOP votes in here, though I almost forgot to include his home in Lakeville. Carver, Scott and Wright Counties house the GOP leaning exurbs that are the backbone of this district. It encompasses about half of the old 2nd and half of the old 6th. I took a couple of the GOP leaning portions of the 7th as well. Obama definitely lost this district, probably by about 10 points.


District 3: OPEN (formerly Erik Paulson (R))
Purple

I took Paulson’s home in Eden Prairie out of this district and gave all the GOP parts of Hennepin over to the 2nd. This district is based in Anoka County and will be a fairly 50-50 district I think, but will lean DFL over the next few years if it does not already lean that way. I considered including Bloomington in it, but it just got too messy.

District 4: Betty McCollum (DFL) vs Michelle Bachmann (R) Red

Placing Bachmann’s residence here was accidental at first, but too amusing not to go ahead with. This will be a walk in the park for McCollum, and Bachmann may move to run in the 2nd, but she might be crazy enough to think she can beat McCollum. This is essentially the old 4th plus a chunk of Washington County

District 5: Keith Ellison (DFL) vs Erik Paulson (R) Yellow

Now, some of you may be scared that Ellison won’t win this district. That’s ridiculous. Ellison did better in the 5th in 2008 than did his predecessor Martin Sabo who help the district for decades. Paulson may move to run in the new 3rd rather than go up against Ellison, but The addition of Eden Prairie and Edina to the true blue 5th helps spread some of the DFL love around.

District 6: Jim Obrestar (DFL) Teal?

The old 8th becomes the 6th and essentially stays the same. I reddened it a litle to help the 7th blue up a bit, but it still leans DFL.


District 7: Collin Peterson (DFL)
Grey

Peterson’s district added a LOT considering its low population growth. It expanded to include much of the old 1st district and I had the 6th take some of the more red parts of the old 7th. It essentially is a R+2-4 district I think, but competative for the right Democrat when Peterson retires. He’ll hold it until he leaves though.

Now for the 8 District Map

District 1: Tim Walz (DFL)

I didn’t strengthen it much, but some of the GOP leaning rural areas went to the 7th. Walz will be fine here and Obama won the district.


District 2: OPEN (formerly John Kline(R) )

Kline might move here, as this is the heavy GOP seat, but then again, Paulson and Bachman may move here too, since I drew all 3 GOP reps out of their districts. Whoever represents the 2nd could be the lone GOP Representative in MN under this map; I seriously packed GOP votes in here. Carver, Scott and Wright Counties house the GOP leaning exurbs that are the backbone of this district, as well as St. Cloud. It encompasses about half of the old 2nd and half of the old 6th. I took a couple of the GOP leaning portions of the 7th as well. Obama definitely lost this district, probably by about 10 points.


District 3: John Kline (R)


Kline lives in this new version of the 3rd which is based around Bloomington, MN and Dakota County. Obama won this district by a few points and its prolly around D+1. Kline may run here or he may move to the 2nd but this is a lean DFL district.

District 4: Betty McCollum (DFL) vs Michelle Bachmann (R)

This will be a walk in the park for McCollum, and Bachmann may move to run in the 2nd or the 6th, but she might be crazy enough to think she can beat McCollum. This is essentially the old 4th plus a chunk of Washington County

District 5: Keith Ellison (DFL) vs Erik Paulson (R)

Now, some of you may be scared that Ellison won’t win this district. That’s ridiculous. Ellison did better in the 5th in 2008 than did his predecessor Martin Sabo who help the district for decades. Paulson may move to run in the new 2nd rather than go up against Ellison, but The addition of Eden Prairie and Edina to the true blue 5th helps spread some of the DFL love around.

District 6: OPEN (formerly Michelle Bachmann (R) )

This is a new incarnation of the 6th, based in Anoka county, but much more suburban than the old 6th. This leans DFL and it would be an easy win for Tinklenberg or another Mainstream DFLer.


District 7: Collin Peterson (DFL)

Peterson’s district added a bit considering its low population growth. It expanded to include some of the old 1st district and I had the 2nd take some of the more red parts of the old 7th. It essentially is a R+4-6 district I think, but could competative for the right Democrat when Peterson retires. He’ll hold it until he leaves though.

District 8: Jim Obrestar (DFL) Purple

The 8th essentially stays the same. I reddened it a little to help the 7th blue up a bit, but it still leans DFL.

South Carolina Redistricting with Republicans in Control

I finally decided to create a map that is realistic. Since Republicans seem to be in control of South Carolina, I think they will aim for a map like this one. It is 5-2 Republican even though some of the Republicans should have shaky holds on their districts. I decided to think like a Republican would to draw this map. My main objectives were to strengthen Republicans Henry Brown and Joe Wilson while creating a new Republican district. I also strengthened John Spratt because it is almost impossible to weaken him enough to beat him while protecting the other Republicans. Anyway, Spratt is heavily entrenched. Also, I want to say thanks to Dave of Dave’s Redistricting App for enhancing the feature. Now here are the maps.

South South Carolina

Southern South Carolina

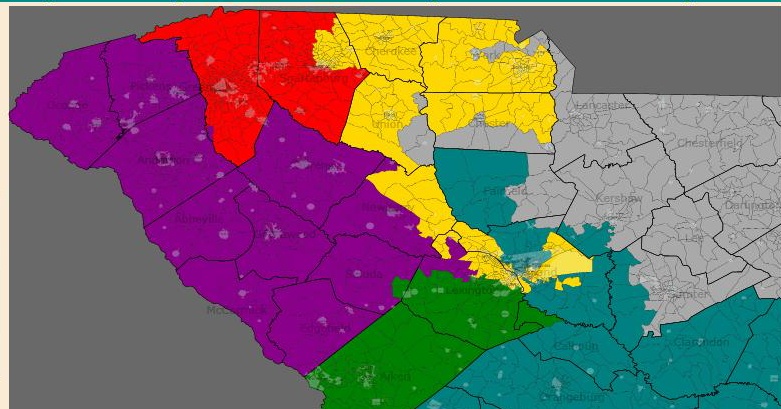
Up Country

Up Country

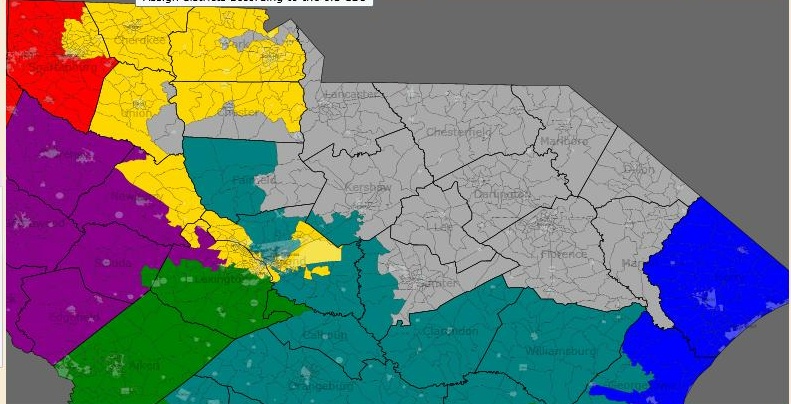
Eastern South Carolina

Eastern South Carolina

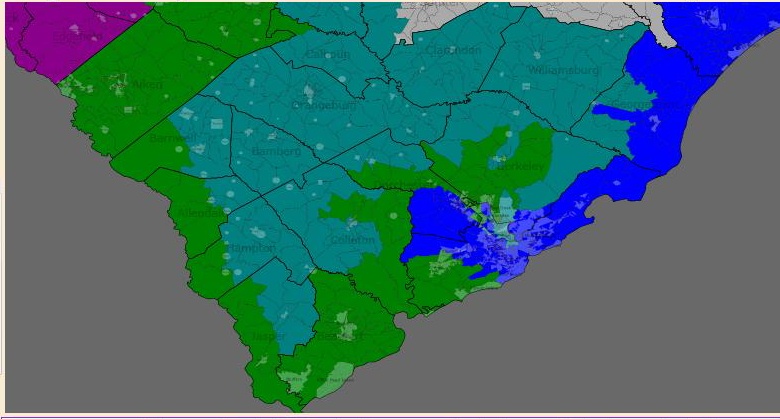
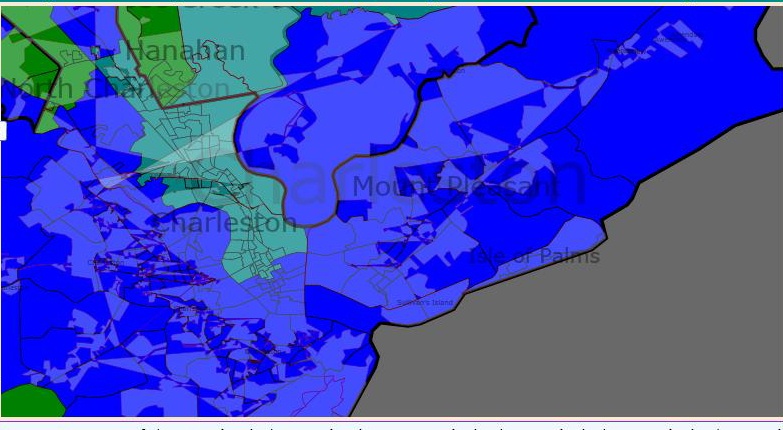
Charleston Area

Charleston Area

District 1 Henry Brown (R) Blue

The Republicans biggest worry should be that Brown has not been strengthened enough by redistricting. Yes, he does have most of Charleston County but the parts he has are mostly Republican. I did not alter the old district boundaries there much. Also, he has Republican Horry County to offset Democratic margins. I am not sure if I strengthened Brown enough. McCain probably won 55%-57% of the vote here. The racial stats are 17% African American and 75% White. Status is Likely Republican.

District 2 Joe Wilson (R) Green

Wilson also had a surprisingly competitive race even though he won by 10 points. I helped shore him up and reduced the African American percentage of the population by three points. I removed most of the Democratic rural counties and the parts I included were only to connect the coastline to Aiken and Lexington Counties. I strengthened Wilson even more by putting in Republican parts of Berkeley and Dorchester Counties. McCain probably won 56% of the vote here. Racial stats are 23% African American, 5% Hispanic and 68% White. Status is Likely Republican if Democrats want to challenge this district.

District 3 Gresham Barrett (R) Purple

There is not much difference here. Barrett is pretty safe with heavy Republican margins from Oconee and Pickens Counties. Even with McCormick County which leans Democratic, Barrett has no worries. I even reduced the African American population by two points. McCain probably won 64%-65% of the vote here. Racial stats are 18% African American and 76% White. Status is Safe Republican.

District 4 Bob Inglis (R) Red

I did not alter this district much either. Inglis is pretty safe without any worries. The only changes I made were removing Union County and part of Spartanburg County, mostly for population purposes. McCain still probably won about 60% of the vote here. Racial stats are 18% African American, 6% Hispanic and 71% White. Status is Safe Republican.

District 5 No Incumbent (R) Yellow

This is the new district I created for the Republicans. It basically contains Republican areas in the Up Country, Conservative Lexington County and some white parts of Richland County. I slipped in part of Chester County which Obama barely carried but this should still be Republican. I do not know who the new Republican congressman might be here. I found the names Jeff Duncan and Mac Toole, Republican members of the South Carolina State House whose districts contain part of the 5th. I have no idea if they are potential candidates or not. It would be great if someone who knows South Carolina better could elaborate on it. McCain probably won 62% of the vote here. Racial stats are 21% African American and 71% White. Status is Safe Republican.

District 6 James Clyburn (D) Teal

Since Clyburn is pretty safe, I left him alone pretty much. All I did was remove some northeastern precincts to strengthen John Spratt. All I can really say about this district is that it is still African American majority and Republicans have no shot at winning it. Obama probably won 67% of the vote here. Racial stats are 57% African American and 37% White. Status is Safe Democrat.

District 7 John Spratt (D) Gray

Since the Republicans would be pushing all the Republican areas into other districts, they had to leave behind some Democratic areas and many of them went here. Spratt is strengthened by the removal of most of York County and the inclusion of some African American precincts from the old 6th district. This increases the African American population from 32% to 39%. The changes do not matter much because Spratt is pretty safe. They do help elect a Democrat when he retires. Obama probably won 53% of the vote here. Racial stats are 39% African American and 56% White. Status is Safe Democrat.

By what margin will Bob Shamansky win?

View Results

Loading ... Loading ...

Most Gerrymandered District

Get a load of this beaut:

This is one of the iterations that Rep. Cleo Fields‘ district went through during the 1990s. LA-04 was a masterwork of racial gerrymandering, starting off life with a 63% black voting-age population. It was repeatedly struck down by the courts (full story here), which ultimately ordered the creation of a very different-looking 27% black district. After it was renumbered as the 5th CD, Republican John Cooksey won the seat in 1996.

I’m not opining on the merits of gerrymandering here (though I do think some folks make too much of a fetish out of “compactness”). Rather, I’d love to see other examples of excellence in district-drawing. So please post links to your favorite examples of creative (or crazy) gerrymandering. Districts can be federal, state, local, what have you. The only rule is that someone, somewhere has to have implemented or tried to implement `em (so, nothing you’ve created yourself on Dave’s app).

Note: If you post a pic in the comments, please make sure it’s a maximum of 590 pixels wide. Otherwise, the site’s layout will get messed up on many browsers.

Have fun!

(Thanks to Rupper for the LA-04 district map.)

DavesRedistricting New Features

First, let me say that I’m impressed by the many redistricting maps many of you have created recently. I’m happy that you have found my application useful. It’s been fun working on it and it makes it so worthwhile to see what you all are doing with it.

Today I uploaded an updated application with these new features, all of which are requests from those of you who have emailed me. They are…

— A button to assign all blocks according to the old CDs, so you can start your map with the current map and save time.

— Up to 500 CDs, so you can use the app for legislative districts, too. (Although there are no old LD polygons…yet.) The selection of #CDs is now a slider instead of a dropdown.

— Demographic info bar (at the bottom of the app’s screen) now has percentages, as well as the number of persons in each demographic group. Also, hover on the state population text block and get the demographics for the state.

Also, Pennsylvania is officially there now. (Actually the data has been there for a month; my apologies for not announcing sooner.)

Next up: adding NY and IL; and figuring out how to add partisan data. (DavidNYC has been assisting. Thanks!)

Map for Redistricting Arizona

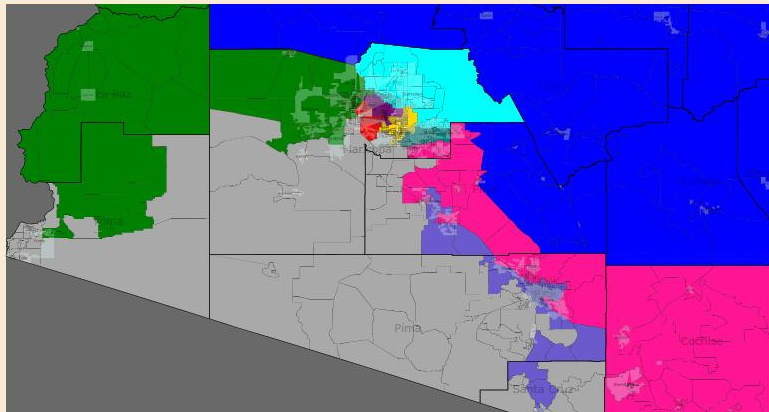
Yes, I have created another Democratic gerrymander. I think the redistrictors in Arizona  must create competitive districts. I was able to create some competitive ones. My main objectives were to strengthen Gabrielle Giffords, Ann Kirkpatrick and Harry Mitchell. They are all Democrats elected to the U.S House in 2006 and 2008 in districts that McCain won in the single digits. Except maybe for Kirkpatrick, I probably strengthened those Democrats. I was able to weaken John Shadegg enough to attract strong competition. As for the other Republicans, I kept their district safely Republican while creating two new Republican districts. I had to do that because all those Republicans had to go somewhere. It is pretty difficult to aim for a 5-5 or 6-4 Democratic delegation in a state McCain won with 53% of the vote. Now here are the maps.

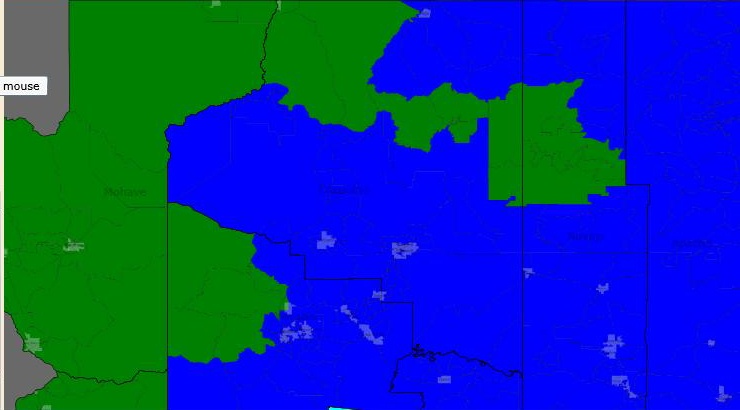
northern Arizona

Northern Arizona

southern Arizona

Southern Arizona

Phoenix area

Phoenix area

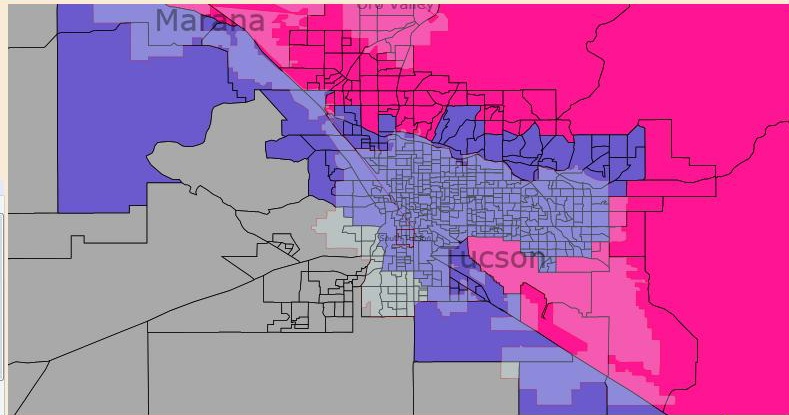
Tucson area

Tucson area

District 1 Ann Kirkpatrick (D) Blue

I am sorry I could not strengthen Kirkpatrick much. The best I could do was to remove only a small slice of Conservative Yavapai County. Also, I wish I could include the Hopi Reservation to allow more Democrats but because of a rivalry with the Navajo, I am unable to put both tribes in the same districts. Except for taking out a bit of Yavapai County, the district pretty much remains the same. Since Kirkpatrick easily won here by 16 points, she should be safe enough. McCain probably won 53% of the vote here. Racial stats are 16% Hispanic, 21% Native American and 60% White. Status is Likely Democratic.

District 2 Trent Franks (R) Green

This district stays pretty much the same except I moved a bit of eastern Glendale and western Phoenix out of the district. I took in some White parts of Yuma County and a bit more of Coconino County which totals to about only 7,000 people. This district probably voted about 60% for McCain. Racial stats are 17% Hispanic and 73% White. Status is Safe Republican.

District 3 John Shadegg (R) Bright Purple

Shadegg should be in for a tough race with this map. I removed the more Conservative northern part of his district. Even though I slipped in part of the current Republican 2nd district, this should not alter the political leanings of this district enough. To weaken Shadegg tremendously, I added in parts of the heavily Hispanic 4th district. This increases the Hispanic population from 14% to 30%. In 2008, Shadegg said he wanted to retire and then retracted the statement. Such a shaky district would probably propel him to retire. With Shadegg gone, this district is a prime pickup for the Democrats. The redistricting panel will like it because it is competitive enough. Obama probably won 51% of the vote here and he certainly would have won more voters if McCain were not from Arizona. The racial stats are 30% Hispanic and 59% White. Status is Toss Up if Shadegg stays, Lean Democrat if he retires.

District 4 Ed Pastor (D) Red

I had to move this district into some Republican areas to strengthen Obama’s performance in other districts. I remember Michael Barone in the Almanac of American Politics 2006 said that Republicans can dominate because they win fast growing areas. Well Michael, did you know that the fastest growing Arizona district is the heavily Hispanic 4th? The growth of Hispanics has been useful in shoring up other districts. Still, Ed Pastor should be fine in this majority Hispanic district. Obama probably won 64% of the vote here. Racial stats are 6% African American, 58% Hispanic and 31% White. Status is Safe Democrat.

District 5 Harry Mitchell (D) Yellow

I removed most of northern Scottsdale from the district and part of Tempe. I substituted that by adding part of the current 4th district to boost the Hispanic population here. Mitchell is in his late 60’s and he may retire soon. This district should be safe for him or any other Democrat who represents it. Minorities should become the majority here in a few years. Obama probably won 54% of the vote here. Racial stats are 5% African American, 34% Hispanic and 53% White. Status is Likely Democrat if Mitchell retires, Safe Democrat while he represents it.

District 6 Jeff Flake (R) Teal

I kept Flake’s district pretty much the way it used to be. I removed all of Pinal County and kept the district centered on Mesa (just for trivia, Mesa is larger than Cleveland, OH but most people in the East have never heard of it.)  There are a few Hispanic neighborhoods in Mesa but they should not be nearly enough to offset the Republican majorities in the rest of the city. McCain probably won 60% of the vote here. Racial stats are 23% Hispanic and 68% White. Status is Safe Republican.

District 7 Raul Griljava (D) Gray

This district is about the same except I moved most of the Tucson area and substituted it with heavily Hispanic areas in Phoenix. I took out some Republican areas in Yuma as well as La Paz County. The Pinal County portion stays the same except I added a few Hispanic precincts. Since this district has a Hispanic majority, Griljava should not worry. Obama probably won 55% of the vote here. That should be safe enough. Racial stats are 5% African American, 5% Native American, 54% Hispanic and 34% White. Status is Safe Democrat.

District 8 Gabrielle Giffords (D) Purple

One of my priorities was to protect Giffords from a strong challenge even though she seems pretty safe in her district. To protect her, I removed every inch of Cochise County from this district and replaced it with almost all of Tucson and some Hispanic areas in Pinal County. With Republican battles for the 10th district over in Cochise County, Giffords should have no strong opponent. Obama probably won 54% of the vote here. Racial stats are 35% Hispanic and 55% White. Status is Safe Democrat.

District 9 No Incumbent (R) Light blue

If a Republican does not win here, I am shocked. I removed the whitest areas I could find from the 3rd and 5th districts and slipped in parts of the 6th district due to population growth. It would be great if someone could tell me about state legislators who might run here but former Congressman J.D Hayworth might take a run at this seat. I imagine there will be a big Republican battle for the seat but Democrats will have token opposition. McCain probably received 62% of the vote here. Racial stats are 12% Hispanic (the lowest amount for any of my districts) and 81% White (the highest for any of my districts.) Status is Safe Republican.

District 10 No Incumbent (R) Pink

This district basically takes in Republican parts of the old 8th, 7th and 1st districts. With the more Democratic areas in those districts, the 10th should stay heavily Republican. The only possible problem is growth of Hispanics but that should not be an issue for awhile. The competition in this district will be in the Republican primary. The candidates could be Randy Graf from the southern part of the district or someone from Maricopa/Pinal County. McCain probably won 59%-60% of the vote here. Racial stats are 22% Hispanic and 69% White. Status is Safe Republican.

By what margin will Bob Shamansky win?

View Results

Loading ... Loading ...

Early look at Competitive 2010 Michigan State Senate Races Updated

We all know how important it is that Democrats re-capture the Michigan State Senate next year.  If they take the Senate and hold the Governorship, they will have complete control over the redistricting process. Bill Ballenger, editor of Inside Michigan Politics, says “Democrats look poised to pick up at least 3 seats” next year.  To take control, we only need to win 4 Republican seats.  Democrats have not controlled the State Senate since 1982.  Below I have all 38 Senate seats listed, with the name of its Senator, the party, whether or not it will be OPEN next year, and a brief description of the district.  I also give a brief preliminary paragraph handicapping the race.  

Then I give the 2008 Presidential Result in that District. Remember that the 2008 resutl is sort of a “High Water Mark” here.  Note that I didn’t calculate the Presidential Vote for the 5 Detroit districts because this would require going precinct by precinct which would have taken days.  They are all at least 80% Obama, many are more than 90% Obama.

I then included all of the announced candidates for the races, with links to their websites or sources.  I then list potential candidates for each race, usually State Representatives or other local officeholders.  Finally, I offer a Charlie Cook style rating: Safe, Likely, Leans or Tossup.  The Senator’s name links to their website, where you can find a map of his or her district.

I realize that this is a lot of text, so for those who don’t want to read the entire thing, I added all my ratings seperately at the bottom of the diary.

Updated to include the announced Candidacies of Fmr. Rep. John Stewart (D) in the 7th (h/t Sean Fitzpatrick) and Rep. Mary Valentine (D) in the 34th.

District 1Hansen Clarke (D) OPEN Easten Detroit; Downtown

Hansen Clarke (AKA “The man who kicked Ann Coulter’s Ass”) is term limited next year.  It’s a shame, because Clark has been one of my favorite Senators, and even one of my favorite politicians.  He recently donated his hair to a nine year old burn victim http://www.myfoxdetroit.com/dp… and is a tireless advocate for under-represented and underpriveledged Americans.  

Announced Candidates:

Potential Candidates:

Coleman Young II (D), State Rep. (2006- ) 2009 Candidate for Detroit Mayor

Fred Durhal, Jr. (D)  State Rep. (2002-2003, 2008-  )

Betty Cook Scott (D) State Rep. (2004-   )

Rating: Safe Democrat

District 2 Martha G. Scott (D) OPEN North Detroit, Hamtrack, Grosse Cities.  

Martha Scott, who was one of Carolyn Cheeks Kilpatrick’s 2008 primary challengers, is term limited.

Announced Candidates:

Potential Candidates:

LaMar Lemmons (D) State Rep. (2004-  )

Bill McConico (D) State Rep. (2000-2006), 2006 Candidate

Virgil Smith (D) State Rep. (2002-2008)

Bert Johnson (D) State Rep. (2006-  )

Rating: Safe Democrat

District 3 Irma Clark-Coleman (D) OPEN Central Detroit, Dearborn

This district includes Dearborn, so there is the potential for this district to elect an Arab-American to the Senate.

Announced Candidates:

Potential Candidates:

Morris Hood, Jr. State Rep. (2002-2008)

Keith Williams (D) Wayne County Commission (2003-  )

Rating: Safe Democrat

District 4 Buzz Thomas (D) OPEN North and Central Detroit

Another very good legislator who is term limited this year, although I’m keeping my fingers crossed that John Conyers will retire so that Thomas can replace him in Congress.

Announced Candidates:

Potential Candidates:

George Cushingberry (D) State Rep. (2004-  )

Virgil Smith (D) State Rep. (2002-2008)

Keith Williams (D) Wayne County Commission (2003-  )

Rating: Safe Democrat

District 5 Tupac Hunter (D) West Detroit, Dearborn Heights, Inkster

Hunter will be fine in this majority black district, however term limited State Rep. Gabe Leland may challenge Hunter.  Leland’s father, Burt, represented this district prior to Hunter for decades.  

Rating: Safe Democrat

District 6 Glenn Anderson (D) Livonia, Westland, Redford, Garden City

Senator Anderson won this historically Republican suburban Wayne County district in 2006, defeating Republican Sen. Laura Toy.  He is favored to win re election, but former Rep. John Pastor (R) of Livonia could make it competitive.

Presidential Results: 57.8 – 40.4 Obama

Rating: Likely Democrat

District 7 Bruce Patterson (R) OPEN Canton, Northville, Plymouth, Trenton

Republican Pruce Patterson barely held on in 2006 against Democrat Mark Slavens in 2006 in this L-shaped suburban Wayne County district.  Democrats now hold every State House District that is wholly or partially in this district.  Mark Slaven’s wife Dian won the last remaining Republican held district last year, and Obama won this district comfortably.  This district will be one of the most competitive and expensive districts in the state.  If Democrats want to retake the Senate, this is a district that they almost have to win.  Former Republican-turned Democrat State Representative John Stewart, who served was an R while serving in the State House from 2000-2006 and who switched parties in 2007, is running.  The fact that he represented a 3rd of this district, and was a Republican, makes him a top tier candidate. h/t Sean Fitzpatrick

Presidential Results: 54.7 – 43.7 Obama

Announced Candidates:

John Stewart (D) Former Republican State Rep. (2000-2006) bin/cfr/com_det.cgi?com_id=514363

Potential Candidates:

Marc Corriveau (D) State Rep. (2006-  )

Kathleen Law (D) State Rep. (2002-2008)

Mark Slavens (D) 2006 Candidate

Phillip LaJoy (R) State Rep. (2002-2008)

Rating: Tossup

District 8 Ray Basham (D) OPEN

Romulus, Taylor, Lincoln Park, Allen Park, Riverview, Wyandotte

The Democrat will be strongly favored in this suburban Wayne County district that is located south of Detroit.

Presidential Results: 64.6 – 33.4 Obama

Announced Candidates:

Potential Candidates:

Hoon Yung-Hopgood (D) State Rep. (2002-2008)

Barbarah Farrah (D) State Rep. (2002-2008)

Ed Clemente (D) State Rep. (2004-  )

Rating: Safe Dem

District 9 Dennis Olshove (D) OPEN  Warren, Eastpointe, Fraser, St. Clair Shores

This district is Democratic but mostly socially conservative one located in southern Macomb County.  It is, along with the 10th District, the home of the “Reagan Democrats,” who also voted strongly for Obama.  The Democrat is favored here.

Presidential Results: 58.3 – 39.6 Obama

Announced Candidates:

Potential Candidates: Lisa Wojno (D) State Rep. (2002-2008)

Frank Accavitti (D) State Rep. (2002-2008)

Jack Brandenburg (R) State Rep. (2002-2008)

Rating: Likely Dem

District 10 Mickey Switalksi (D) OPEN

Sterling Heights, Utica, Roseville, Clinton, Mount Clemens

Although slightly less Democratic than the 9th, this district still favors Democrats. And like the 9th, a conservative Democrat should have no problem winning this district.  Switalski announced earlier this year that he would challenge Rep. Sandy Levin in the 12th Congressional district.

Presidential Results: 55.5 – 42.7 Obama

Announced Candidates:

Potential Candidates:

Steve Bieda (D) State Rep. (2002-2008)

Fred Miller (D) State Rep. (2004-   )

Tory Rocca (R) State Rep. (2004-   )

Rating: Leans Democrat

District 11 Alan Sanborn (R) OPEN

Northern Macomb County

This district is very conservative, but if nutjob crazy Leon Drolet gets the Republican nomination, a Democrat would have a chance here. Still, the Republican should be favored.

Presidential Results: 50.6 – 47.7 McCain

Announced Candidates: Leon Drolet

Potential Candidates:

Kim Meltzer (R) State Rep. (2004-   )

Brian Palmer (R) State Rep. (2002-2008)

Rating: Likely Republican

District 12 Mike Bishop (R) OPEN

Pontiac, Rochester, Auburn Hills, North East Oakland County

Majority leader Bishop is term limited in this swing district in Oakland County.  Although President Obama won this district, I’m not extremely optimistic about picking this one up because Obama’s margin of victory was almost entirely from majority black Pontiac, where turnout won’t be as high next year.

Presidential Results: 52.5 – 46.0 Obama

Announced Candidates:

Potential Candidates:

Tim Melton (D) State Rep. (2006 –  )

Tom McMillan (R) State Rep. (2008-   )

Rating: Leans Republican

District 13 John Pappageorge (R)

Royal Oak, Madison Heights, Berkley, Troy, Bloomfield, Birmingham

In 2006, State Rep. John Pappageorge beat Andy Levin (son of Sandy Levin) by less than 1,000 votes.  Many Democrats blamed Levin’s loss on Kyle McBee, the Green Party candidate who took 3,129 votes, more than 3 times Pappageorge’s margin of victory.  Democrats will challenge Pappageorge again, although it isn’t clear whether Levin will try again, or a State Representative like Marie Donigan will give it a shot.

Presidential Results: 53.7 – 44.8 Obama

Announced Challengers:

Potential Challengers:

Andy Levin (D) 2006 nominee

Marie Donigan (D) State Rep. (2002-   )

Rating: Tossup

District 14 Gilda Jacobs (D) OPEN

Farmington Hills, Southfield, Huntington Woods, Oak Park, Ferndale

This district is probably the most liberal district in Michigan, although not the most Democratic.  Rep. Gilda Jacobs is term limited, and while the all three of the State Reps. in the district are freshmen, whoever wins the Dem nomination will win.

Presidential Results: 74.6 – 24.3 Obama

Announced Candidates:

Potential Candidates:

Rep. Ellen Cogen Lipton (D) (2008-   )

David Coulter (D) Oakland County Commission (2002-  )

Helaine Zack (D) Oakland County Commission (2002-  )

Rating: Safe Democrat

District 15 Nancy Cassis (R) OPEN

Novi, South Lyon, West Bloomfield Township, Northville

I was shocked when I calculated the results for this district.  A decade ago, this was at least one of, if not the most Republican area in Michigan.  Western Oakland County being so Republican is the reason that we have Thad McCotter and Craig DeRoche, and yet this district voted for Barack Obama.  Even the city of Novi voted for him.  And better yet, he won by more than 3,000 votes!  Still, locally we have a while to go before a Democrat can represent Western Oakland County in the State Legislature.  I’m not very keen on this district as a possible pickup in ’10.

Presidential Results: 50.3 – 48.2 Obama

Announced Candidates:

Potential Candidates:

Craig DeRoche (R) State Rep. (2000-2006)

David Law (R) State Rep. (2004-2008)

Rating: Likely Republican

District 16 Cameron Brown (R) OPEN, Lenawee, Branch, Hillsdale, and St. Joseph Counties

I doubt this district will be competitive, unless State Rep. Dudley Spade (D) runs, but even then a Republican like Bruce Caswell starts off with an advantage.

Presidential Results: 49.8 – 48.3 McCain

Announced Candidates:

Potential Candidates:

Dudley Spade (D) State Rep. (2004-  )

Bruce Caswell (R) State Rep. (2002-2008)

Rick Schaffer (R) State Rep. (2002-2008)

Rating: Likely Republican

District 17 Randy Richardville (R) Monroe County, South Washtenaw, East Jackson

Not only the most gerrymandered, but also one of the most closely divided districts in Michigan, this one will likely be home to another competitive race in 2010.  The Washtenaw County portion of this district favors Dems, while the Jackson county portion favors Republicans and Monroe county is a swing region.  In fact, the Presidential results here are almost exactly what President Obama got nationwide, giving it a 2008 PVI of EVEN.  Unfortunately, our bench in this district isn’t the greatest, with our strongest possible candidate running for Secretary of State.  Still, State Rep. Kate Ebli might be able to beat Richardville.

Presidential Results: 52.7 – 45.6 Obama

Announced Challengers:

Potential Challengers:

Kate Ebli (D) State Rep. (2005-   )

Rating: Leans Republican

District 18 Liz Brater (D) Open Washtenaw County, Ann Arbor

One of the most Democratic districts in Michigan and the home of the University of Michigan.  The Democratic bench in this district is quite deep.  Any Democrat is safe here.

Presidential Results: 73.7 – 26.2 Obama

Announced Candidates:

Potential Candidates:

John Hieftje (D) Mayor of Ann Arbor

Rebekah Warren (D) State Rep. (2006-  )

Pam Byrnes (D) State Rep. (2004-  )

Chris Kolb (D) State Rep. (2000-2006)

Rating: Safe Democrat

District 19 VACANT (D)  Calhoun County (Battle Creek) and most of Jackson County

This is the Senate seat that Mark Schauer left vacant when he moved up to Congress last year.  It is usually a swing district, although President Obama won it with votes to spare.  Because this seat is vacant, there will be a special election to fill it later this year.  The Primary will be August 4th and the General on November 9th.

The Democratic candidates are State Rep. Martin Griffin of Jackson, and Sharon Reiner, who ran for congress in 2006 and 2008, narrowly losing to Tim Walberg and then losing badly in the primary to Mark Schauer.  Griffin is backed by the State Democratic Party and should win the Primary.  The Republican candidates are State Rep. Mike Nofs of Battle Creek and Sandstone Township Supervisor C. James Wellman.  Nofs, who is a moderate and popular in the Battle Creek area, should win the primary.  

The fact that 1. Nofs is very moderate 2. He’s very well known and liked in the Battle Creek area and 3. This will be a low turnout special election makes this a tough race for us.  Both parties with certainly spend a lot of money here.  Martin Griffin is from the Jackson area, which is an advantage, as Mark Schauer lost Jackson County in 2002 when he first ran for the State Senate.  If we lose this race it will make it that much more difficult to retake the Senate, so in some ways, whether or not Democrats can gain the trifecta and control redistricting depends on this race.

Presidential Results: 52.7 – 45.6 Obama

Candidates:  

Martin Griffin (D) State Rep. (2006-  )

Sharon Reiner (D)

Mike Nofs (R) State Rep. (2002-2008)

C. James Wellman (R) Sandstone Township Board Memeber

Rating: Tossup

District 20 Thomas George (R) OPEN Kalamazoo County, part of Van Buren County

Tom George, who is running for Governor, will be vacating the 2nd most Democratic seat currently held by a Republican, going by Obama’s winning percentage.  The Republican field is already starting to shape up, with former State Rep. Lawrence Wenke, who’s district included part of Western Kalamazoo County, and current State Rep. Tonya Schuitamaker are both running.  Schuitamaker’s base is Van Buren County, which she represents.  This district only includes two townships in Van Buren, so she would probably be at a disadvantage against Wenke in the primary.  Still, Republicans would do well to nominate someone from the city of Kalamazoo or it’s suburbs, and both Wenke and Schuitamaker are from the rural parts of the district.

Democrats have a few good potential candidates.  Former state Rep. and 2006 candidate Alex Lipsey, State Rep. Robert Jones, or Kalamazoo County Commission Chairman David Buskirk.

Presidential Results: 58.6 – 39.7 Obama

Announced Candidates:

Lawrence Wenke (R) State Rep. (2002-2008)

Tonya Schuitamaker (R) State Rep. (2004-   )

Potential Candidates:

Alex Lipsey (D) State Rep. (2000-2006)

Robert Jones (D) State Rep. (2006-  )

David Buskirk (D) Kalamazoo County Commissioner; Chairman

Rating: Tossup

District 21 Ron Jelinek (R) OPEN Berrien, Cass and Van Buren Counties

A historically Republican area, President Obama did very well here.  This area is home to a lot of moderate Republicans (Fred Upton is from this area), and Berrien County is home to a lot of African-Americans.  Democrats have a very weak bench here, so don’t expect a win here.

Presidential Results: 52.1 – 46.3 Obama

Announced Candidates:

Potential Candidates:

Judy Truesdell (D) 2006 and 2008 Candidate for State House

John Proos (R) State Rep. (2002-   )

Rating: Leans Republican

District 22 Valde Garcia (R) OPEN Livingston, Shiawassee, and Southern Ingham Counties

Livingston County is one of the most Republican Counties in Michigan.  You can be sure that another conservative “family values” Republican will be elected to replace Senator Garcia.

Presidential Results: 52.4 – 45.8 McCain

Announced Candidates:

Potential Candidates:

Joe Hune (R) State Rep. (2002-2008)

Chris Ward (R) State Rep. (2002-2008)

Rating: Safe Republican

District 23 Gretchen Whitmer (D) Ingham County (Lansing)

Gretchen Whitmer will be safe if she runs for re-election.  If she runs for Attorney General, as many expect her to, there is a strong bench of Democrats in the lansing area to take her place.

Presidential Results: 67.2 – 31.3 Obama

Rating: Safe Democrat

District 24 Patricia Birkholz (R) OPEN Allegan, Barry, and Eaton Counties

Although Eaton county showed an impressive swing towards President Obama, the rest of this district, especially heavily Dutch Allegan, is still strongly Republican.

Presidential Results: 50.5 – 47.6 McCain

Announced Candidates:

Potential Candidates:

Brian Calley (R) State Rep. (2006-   )

Rick Jones (R) State Rep. (2004-   )

Fulton Sheen (R) State Rep. (2002-2008)

Rating: Safe Republican

District 25 Judson Gilbert (R) OPEN Lapeer and St. Clair Counties

Lapeer and St. Clair Counties are mostly suburban/exurban areas north of Detroit.  There is also quite a bit of rural farmland and the medium sized city of Port Huron.  A democrat could win here, expecially moderate like John Espinoza, although he doesn’t actually live in the district.  The Republicans have a deep bench here, and I’m not sure whether or not the State Democratic party will decide to put money here.

Presidential Results: 49.2 – 48.6

Announced Candidates:

Potential Candidates:

John Espinoza (D) State Rep. (2004-  )

Phillip Pavlov (R) State Rep. (2004-  )

John Stahl (R) State Rep. (2002-2008)

Rating: Leans Republican

District 26 Deb Cherry (D) OPEN North and East Genesee County, Central Oakland County, Waterford

I don’t know why, but for some reason Republicans gave this suburban Flint area district an arm that reaches into central Oakland County, and they actually used touch-point contiguity to connect it to Waterford Township.  Maybe it was to make this district more Republican, although Waterford voted easily for Obama.  This district was held by Lt. Gov. John Cherry, and is now held by his sister, Deb.  It’s comfortably Democratic, but rising star, moderate African-American Republican Paul Scott could concievably give a Democrat a run for their money.

Presidential Results: 55.8 – 42.4 Obama

Announced Candidates:

Potential Candidates:

Richard Hammel (D) State Rep. (2006-  )

Jim Slezak (D) State Rep. (2008-   )

Ted Hammon (D) State Rep. (2006-2008)

Fran Amos (R) State Rep. (2002-2008)

Paul Scott (R) State Rep. (2008-  )

Rating: Leans Democrat

District 27 John Gleason (D) Flint, South-West Genesee County

The other Genessee County District, this one is much more Democratic.  It includes the city of Flint and other very Democratic areas west of the city.  If Gleason primaries Dale Kildee, there is a big Democratic bench here.

Presidential Results: 68.8 – 29.7 Obama

Rating: Safe Democrat

District 28 Mark Jansen (R) Kent County, suburban Grand Rapids

The 28th District is very strangely shaped.  It skirts around the city of Grand Rapids but includes conservative suburbs like Wyoming.  Mark Jansen should have not trouble winning re-election.

Presidential Results: 55.9 – 42.5 McCain

Rating: Safe Republican

District 29 Bill Hardiman (R) OPEN Grand Rapids, Kentwood

This is another district that we almost must win if we want to retake the senate.  It is the most Democratic district currently held by a Republican, going by Barack Obama’s winning margin.  It is basically all of the city of Grand Rapids plus a few suburbs.  Both Republicans and Democrats have decent benches here, but Democrats have been making gains lately (we won a state house seat in 2006).  I think that at the end of the day, the Democrat will win this district.

Presidential Results: 59.1 – 39.3 Obama

Announced Candidates:

Potential Candidates:

Michael Sak (D) State Rep. (2002-2008)

David LaGrand (D) Grand Rapids City Commissioner and 2006 Candidate

George Heartwell (D) Grand Rapids Mayor

Carol Hennessy (D) Minority Vice-Chair, Kent County Commission

Dave Hildenbrand (R) State Rep. (2004-  )

Glenn Steil (R) State Rep. (2002-2008)

Justin Amash (R) State Rep. (2008-   )

Jerry Kooiman (R) State Rep. (2000-2006)

Rating: Tossup

District 30 Wayne Kuipers (R) OPEN Ottawa County

This district is home to Ottawa County, one of the fastest growing and most Republican counties in Michigan.  Although, like with the South, as the population grows, so does the Democratic performance.  I’d estimate we may start winning this district by the 2020’s, but until then it will remain safely in Republican hands.

Presidential Results: 61.0 – 37.4 McCain

Announced Candidates:

Potential Candidates:

David Agema (R) State Rep. (2006-  )

Arlan Meekhof (R) State Rep. (2006-  )

Rating: Safe Republican

District 31 James Barcia (D) OPEN Sanilac, Huron, Tuscola, Bay, and Arenac Counties

Former Congressman James Barcia is term limited in this big district which includes the “Thumb” region and wraps around Saginaw Bay, including Bay City.  It’s relatively Democratic, although not overwhelmingly.  Democrats have a good bench, and State Rep. Jeff Mayes would be a big improvement over the moderate to conservative Barcia.

Presidential Results: 51.8 – 46.3 Obama

Announced Candidates:

Potential Candidates:

Jeff Mayes (D) State Rep. (2004-  )

Terry Brown (D) State Rep. (2006-  )

John Espinoza (D) State Rep. (2004-  )

Rating: Leans Democrat

District 32 Roger Kahn (R) Saginaw and Gratiot Counties

In 2006, Roger Kahn (AKA Kaaahn!!) won this seat by only 450 votes.  He’s had sort of a rough first term, alledgedly getting into a physical altercation with a 72 year old female Senator Irma Clark-Coleman (D) of Detroit.  The incident was so bizarre that I think that I should post here excerpts from Clark-Coleman’s letter to Majority leader Bishop:

I submit this letter as a formal complaint against the State Senator

from the 32nd District who is a menace to the state legislature. He

perpetrated petulant and violent behavior toward me following a Senate

Appropriation committee meeting yesterday afternoon in the Capitol

building. I ask that you sanction him for conduct unbecoming of an

elected official. I am fearful that given the opportunity, this

legislator would continue to use physical intimidation to reinforce his

policy positions.

He accosted me inside of the main elevator. He rushed at me as if he

were going to strike me in the face after I expressed my great

displeasure with the committee’s approval of the Senate substitute for

HB 4436, which decimates Wayne County’s and Detroit’s ability to provide

mental and medical treatment for poor and uninsured residents…

The Senator from Saginaw charged at me like a bull while we were both

confined in a 6 x 6 elevator. His hysterical behavior startled

citizens who like me were simply trying to leave the Capitol building.

Everyone looked on in horror until the good Senator from the 13th

District blocked his advance to my side of the elevator car.

As the doors opened on the ground floor, the Senator from Troy took me

by the elbow and escorted me out of harm’s way. Despite my exit, the

legislator from the 32nd District continued his verbal assault. His

bellowing startled the Kentwood Senator and the state Budget Director

who were conversing at the visitor’s desk. Both gentlemen looked up in

utter amazement.

Never, in my twelve years as a state legislator, seven years as a member

of the Detroit Board of Education, and thirty years as a Wayne County

employee have I been attacked for my policy positions. I commend Troy’s

best for his quick action to shield me from my aggressor who had lost

control of his temper and his ability to reason.

Senator Kahn denies this, although it’s pretty crazy if true.  That, plus the Democratic nature of this district means he should be in for a tough race next year.

Presidential Results: 56.9 – 41.5 Obama

Announced Challengers:

Potential Challengers:

Andy Colouris (D) State Rep. (2006-   )

Carl Williams (D) State Rep. (2000-2006) and 2006 Candidate

Rating: Tossup

District 33 Alan Cropsey (R) OPEN Clinton, Montcalm, Isabella, and Ionia Counties

Cropsey, who has always been to conservative for his district, is term limited.  Based mostly on his strength in Isabella County (home to CMU), Barack Obama won this district.  We also picked up a State House seat within this district last year, and we will probably pick up another one next year.  Still, our bench is not very strong here.  Democratic turnout may not be a strong next year, either, so I’m cautious about this district.

Presidential Results: 50.7 – 47.4 Obama

Announced Candidates:

Potential Candidates:

Mike Huckleberry (D) State Rep. (2008-  ), 2004 and 2006 candidate for Congress

Bill Caul (R) State Rep. (2004-   )

Paul Opsommer (R) State Rep. (2006-  )

Rating: Leans Republican

District 34 Gerald VanWoerkom (R) OPEN Muskegon, Oceana, Newaygo, and Mason Counties

It’s difficult to tell this far out, but I think that if we win any seats next year, this is our best shot.  Moderate Muskegon Republican Gerald VanWoerkom is retiring, and the Republican candidate to replace him looks to be State Rep. Geoff Hansen, although former State Rep. David Farhat it “thinking about it.”

Either way, we start out with an advantage.  Unlike VanWoerkom, who represented Muskegon County in the House, Hansen hails from the rural Northern portion of the district.  David Farhat, on the other hand, represented the same district as VanWoerkom.  That is, until he was spanked in 2006 by Dem Mary Valentine (he lost 56-44).  Mary Valentine has announced that she is running. Her popularity in the more suburban and rural part of the district and the fact that Farhat is thought to be somewhat corrupt, and Hansen has no base in Muskegon tells me that this one looks like a pickup.

Presidential Results: 58.3 – 40.0 Obama

Announced Candidates:

Mary Valentine (D) State Rep. (2006-   )

Geoff Hansen (R) State Rep. (2004-   )

Potential Candidates:

Mary Valentine (D) State Rep. (2006-   )

Doug Bennett (D) State Rep. (2004-  )

Julie Dennis (D) State Rep. (1998-2004) and 2006 Candidate

David Farhat (R) State Rep. (2002-2006)

Rating: Leans Democrat

District 35 Michelle McManus (R) OPEN Leelanau, Benzie, Manistee, Kalkaska, Wexford, Missaukee, Roscommon, Lake, Osceola, Clare, and Mecosta Counties

I consider Michelle McManus to be Michigan’s version of Michelle Bachmann.  She’s crazy, loud, and extremely conservative.  Luckily, she’s term limited.  Unluckily, she’s running for Secretary of State.  I doubt, however, that she’ll make it out of the Primary.  Obama won her district, and we picked up a State House seat, but our bench is weak in the North-Western Lower Peninsula area.  

Presidential Results: 49.3 – 49.0 Obama

Announced Candidates:

Potential Candidates:

Darwin Booher (R) State Rep. (2004-   )

David Palsrok (R) State Rep. (2002-2008)

Rating: Leans Republican

District 36 Tony Stamas (R) OPEN Alpena, Alcona, Iosco, Ogemaw, Midland, Gladwin, Crawford, Montmorency, Oscoda, and Otsego Counties

Although Republican leaning nationally, this is a swing district in local in statewide races.  The southernmost county, Midland, favors Republicans.  In fact, the Republicans intetionally drew the Democratic northern Counties, especially Alpena, with Midland to create a Republican district.  In 2002, Alpena Democrat Andy Neumann ran against Midland Republican Tony Stamas, with Stamas prevailing narrowly.  Stamas in now term limited and Neumann, who is a State Representative, is “Strongly Leaning Towards running,” also likely to run is State Rep. Joel Sheltrown (D), who is more moderate than Neumann, and also not from the Alpena area, but Iosco County in the center of the district.  I think that Sheltrown would be a stronger candidate, but the primary will be nasty.  The Republican candidate will probably be former State Rep. John Moolenaar of Midland.

Presidential Results: 49.9 – 48.1 McCain

Announced Candidates:

Potential Candidates:

Andy Neumann (D) State Rep. (1998-2002, 2008-   )

Joel Sheltrown (D) State Rep. (2004-  )

John Moolenaar (R) State Rep. (2002-2008)

Rating: Tossup

District 37 Jason Allen (R) OPEN Grand Traverse, Antrim, Charlevoix, Emmett, Cheboygan, Presque Isle, Mackinac, and Chippewa Counties

This is the most Republican Northern Michigan District.  I starts at Traverse City, then jumps the Straits of Mackinac and takes in Mackinac and Chippewa Counties in the U.P., including Sault Ste. Marie.  The Traverse City area has quite a few Republicans to replace Senator Allen, but Emmett, Mackinac, and Chippewa Counties, also a Republican area, are represented by State Rep. Gary McDowell (D).  McDowell is term limited and I could concievably see him winning this district, although it would be an uphill climb.

Presidential Results: 50.8 – 47.5

Announced Candidates:

Potential Candidates:

Gary McDowell (D) State Rep. (2004-   )

Howard Walker (R) State Rep. (2002-2008)

Rating: Leans Republican

District 38 Mike Prusi (D) OPEN Keweenaw, Houghton, Ontonagon, Gogebic, Baraga, Iron, Dickinson, Marquette, Menominee, Delta, Alger, Schoolcraft, and Luce Counties.

My home district! I’ll be sad to see Prusi go, but it’s more important that we get a progressive Dem like him to take his place.  The Democratic bench is deep, the Republican one, not so much.  The Presidential results are a bit misleading, as the Democratic baseline here is far higher than President Obama’s total (which was still a comfortable win).  The most likely candidate is probably former State Rep. Tom Casperson, although the spanking he received at the Hands of Bart Stupak last year make keep him out of politics forever.  If he doesn’t run, it’s likely Dem.  If he does, it’s leans Dem.  Democrats hold every house seat in this district, and other than Casperson, we have for years, so we’ve got a very strong bench.  The two progressive Dems, Steve Lindberg and fmr. Rep. Steve Adamini are from Marquette, while the more conservative Reps are Mike Lahti of Houghton County and Judy Nerat of Menominee County.  

Presidential Results: 52.5 – 45.5

Announced Candidates:

Potential Candidates:

Steve Lindberg (D) State Rep. (2006-   )

Mike Lahti (D) State Rep. (2006-   )

Steve Adamini (D) State Rep. (2000-2006), 2008 Candidate for Marquette County Prosecutor, Northern Michigan University Board of Trustees

Judy Nerat (D) State Rep. (2008-   )

Tom Casperson (R) State Rep. (2002-2008) and 2008 Candidate for Congress

Joel Westrom (R) First District GOP chairman and 2006 Candidate for State House

Rating: Leans Democrat

And for those who skipped some of that, here’s my summary.  Republican seats are bold and italic

Safe Democrat Seats

District 1 (OPEN)

District 2 (OPEN)

District 3 (OPEN)

District 4 (OPEN)

District 5 Hunter

District 8 (OPEN)

District 14 (OPEN)

District 23 (OPEN)

District 27 Gleason

Likely Democrat Seats

District 6 Anderson

District 9 (OPEN)

Leans Democrat Seats

District 10 (OPEN)

District 26 (OPEN)

District 31 (OPEN)

District 34 (OPEN)

District 38 (OPEN)

Tossup Seats

District 7 (OPEN)

District 13 Pappageorge


District 19 VACANT

District 20 (OPEN)

District 29 (OPEN)

District 32 Kahn

District 36 (OPEN)

Lean Republican Seats

District 12 (OPEN)

District 17 Richardville

District 21 (OPEN)

District 25 (OPEN)

District 33 (OPEN)

District 35 (OPEN)

District 37 (OPEN)

Likely Republican Seats

District 11 (OPEN)

District 15 (OPEN)

District 16 (OPEN)

Safe Republican Seats

District 22 (OPEN)

District 24 (OPEN)

District 28 Jansen

District 30 (OPEN)

Maps for Georgia Redistricting

I think the map is just not realistic enough to pass. Even if we can elect Democrat Roy Barnes as Governor, the best we could do is probably a bipartisan redistricting. Anyway, this is the map I would draw if I could decide what the Georgia map would be. I planned to try for an 8-6 Democratic map with creating a new Democratic district and weakening one Republican. If I tried really hard, I might have created a new Democratic district in the Atlanta metropolitan area. I did not want to weaken new Democrats and Obama turnout may have overestimated the Democratic Party strength around Atlanta. However, the minority population around Atlanta is growing quickly. This will make the Democrats stronger there. Just so people know, Safe Democrat/Republican means that the district is solidly for one party. Likely Democrat/Republican means that the district appears safe but could become competitive. Lean Democrat/Republican means that the district will be competitive but one party is ahead. Toss Up means that the district could go either way. Now here are the maps (Yes, I finally did not use a camera to get these shots.)

north georgia

North Georgia

South Georgia 2

South Georgia

atlanta area (2)

Atlanta area

District 1 Jack Kingston (R) Blue

I kept this district mostly the way it is. It contains most of southern Georgia but Democratic areas are taken into the 2nd, 3rd and 12th district. I took out some counties that were in the 12th to get them into here. I also extended this district to take in some Conservative parts of Warner Robins. Jack Kingston and any Republican should have no trouble here. It probably voted 69% for McCain.

Stats are 21% African American and 71% White. Status is Safe Republican.

District 2 Sanford Bishop (D) Green

Unfortunately, I had to weaken Bishop a bit to strengthen Democrat Jim Marshall in the 8th district. I put in some Republican counties that were originally part of the 8th. The district contains the southwestern part of the state which leans Democratic but extends east a bit to take in Republican counties that were in the 8th. Basically, I made the map of southern Georgia look like the map it used to be. Still, Bishop has been winning easily and unless he faces a big challenge, he should continue to win. I think that McCain won here with 51% of the vote.

Stats are 43% African American and 49% White. Status is Safe Democrat.

District 3 Lynn Westermoreland (R) Purple

Not much change to this district. All I did was remove some African American areas in the Republican counties this district contained. Since many African Americans are moving out of the Atlanta core, the African American population is growing here. Still, it should not be enough to affect the leaning of this district. I was also surprised that this district is more rural than suburban. Its growth was below the Georgia average. I think McCain won about 68% of the vote here.

Stats are 19% African American and 75% White. Status is Safe Republican

District 4 Hank Johnson (D) Red

This is one of the African American majority districts. It is centered in De Kalb County and for population purposes; I gave it a slice of Gwinnett County. I had to reduce the African American percentage a bit to strengthen other districts. Still, the only threat to Hank Johnson is a primary challenge. Obama probably won about 77% of the vote here.

Stats are 52% African American, 12% Hispanic and 29% White. Status is Safe Democrat.

District 5 John Lewis (D) Yellow

I kept this district mostly where it used to be and it should stay safe. It is another African American majority district. Even though I took out a few Atlanta precincts and extended the district into Cobb County, it is still very safe for John Lewis. This is a solid district and since Lewis is very popular, he does not even have to worry about a primary challenge. Obama probably won with 75% of the vote here.

Racial stats are 52% African American, 7% Hispanic and 36% White. Status is Safe Democrat.

District 6 Tom Price (R) Teal

I hope I put enough Democrats in this district to knock out Tom Price. Even though I kept some areas of the old 6th district in such as Roswell, this should not be much of a threat to a Democratic takeover. I removed all of Cherokee which gave McCain a margin of 48,000 votes. The rest of the old district probably gave a 20,000 vote margin to McCain. I removed all of Cobb County too and added part of Gwinnett County. I even sent a little finger down into Atlanta to pick up some heavily African American precincts. In parts of the South, the electorate is almost completely racially polarized. That means that race almost completely determines the party. In this district, the percentage of White Democrats is much higher than the percentage of minority Republicans. With the inclusion of a bit of Atlanta, this will weaken Price and he may want to run in another district even though he lives in Roswell. He was elected in 2004 so he is not as entrenched as he could be. I believe that Obama won about 52% of the vote here.

The racial stats are 18% African American, 14% Hispanic, 8% Asian and 58% White. Status is Toss Up/Lean Democrat depending on the competition.

District 7 John Linder (R) Gray

This district mostly contains the leftovers from other districts in Gwinnet County. I designed this to take in all the Republican parts of Gwinnet County and other Republican suburbs. If the minority growth in the Atlanta area does not slow down, this district might be more competitive in about ten years. For now, it is safe for John Linder. McCain probably won here with about 67% of the vote.

The racial stats are 10% African American, 7% Hispanic and 79% White. Status is Safe Republican.

District 8 Jim Marshall (D) Light Purple

Marshall recently has had a few close races in a district that voted 56% for McCain. This is why I decided to focus on strengthening his district. I extended it further east to pick up heavily Democratic Hancock County and Washington County. I sent this district further west to pick up Talbot, Macon and a few other Democratic counties. I had to remove the swing county Newton because Mac Collins (R) lives in it and he gave Marshall a very tough race in 2006. Most of the southern Republican counties in this district went to the 2nd and 1st districts. With the addition of Democratic counties and the exclusion of more Republican ones, I was able to increase the African American percentage from 32% to 41%. That should be high enough to protect Marshall. I estimate that Obama won about 51% of the vote in this district.

The racial stats are 41% African American and 53% White. Status is Likely Democrat.

District 9 Nathan Deal (R) Bright Turquoise

I did not change this district much. What is there to change anyway? The district was pretty Conservative before and it is still heavily Republican. If the growth in Atlanta continues, the counties closest to Atlanta in this district will start filling up with people. That should be the only change to this district. Either way, it is Republican for the foreseeable future. McCain probably won 72% to 77% of the vote here.

Racial stats are 6% African American, 10% Hispanic and 82% White. Status is Safe Republican.

District 10 Paul Broun (R) Bright Pink

I should say what I said about the 9th district. No Democratic will win here anytime soon. It will be even harder for one because I removed Athens from this district. I put it back into the 12th. The only bit of worry Broun should have is that Gainesville in Hall County has a fast growing Hispanic population. It should not be enough to alter the politics of the district too much. I estimate that McCain got about 70% of the vote here

. The racial stats are 10% African American, 10% Hispanic and 77% White. Status is Safe Republican.

District 11 Phil Gingerly (R) Light Green

Due to large population growth, this district just shrunk down to size. Also, I extended it into Cobb County which is more densely populated so that was another reason for the shrinking of this district. Even though Gingerly had a weak district when the Democrats drew the 2002 map, I gave him a strong one now. The reason I could not give him a weaker district was that I had to protect the 13th. Anyway, I do not believe Gingerly would be weakened enough if I gave him the Democratic parts of Cobb County. Cobb County voted 55% for McCain and the Republican suburbs make the Republican percentage increase. I estimate that McCain won here somewhere in the neighborhood of 65% of the vote.

The racial stats are 14% African American, 7% Hispanic and 75% White. Status is Safe Republican.

District 12 John Barrow (D) Light Blue

Again, I tried to make the lines resemble the 2002 Democratic redistricting. I gave Barrow all the Democratic parts of Savannah, Augusta and extended the district up to Athens. Whites are now a minority so I do not see the Republicans winning here. Even if Max Burns, the former Congressman from this district runs, he should not beat Barrow. I estimate that Obama won with 58%-60% of the vote here. Barrow is safe with the inclusion of Athens and the exclusion of Republican counties.

The racial stats are 43% African American and 49% White. Status is Safe Democrat.

District 13 David Scott (D) Tan

I kept his district pretty much the same except that I moved out the eastern part of his district. This district looks a bit gerrymandered because I moved it everywhere I could to pick up African American areas. Even though this district includes less of Clayton County than it used to, this district should still be heavily Democratic. I did not include enough African American areas to make their population go above 50% so this is not protected by the Voting Rights Act. Still, David Scott should have no problem getting elected here. Obama probably won here with about 70% of the vote.

The racial stats are 46% African American, 11% Hispanic and 39% White. Status is Safe Democrat.

District 14 No Incumbent Algae Green

This is really an eastern extension of the 2002 redistricted 13th. I send this district up into Gwinnet County to take in some heavily African American and Hispanic precincts. It also goes into Democratic trending Rockdale and Newton Counties. They are trending Democratic so quickly. Kerry won 40% of the vote in Rockdale County and Obama won 54%. Even though Whites are a plurality here, this district should have no trouble going for a Democrat. I estimate that Obama won here somewhere in the mid 60’s.

Racial stats are 38% African American, 13% Hispanic, 6% Asian and 41% White. Status is Safe Democrat.

By what margin will Bob Shamansky win?

View Results

Loading ... Loading ...