SSP Daily Digest: 6/15

PA-Sen: Ex-Rep. Pat Toomey says that he raised $1 million in 60 days toward his Senate run, with more than 11,000 donors. It’s still a drop in the bucket compared with the bankrolls of Arlen Specter and Joe Sestak, but it ought to help dissuade anyone else from jumping into the GOP primary. Another tidbit that ought to discourage any Republican line-crashers: $5,000 of that money came from John Cornyn‘s PAC, suggesting that he’s done looking for another candidate and is bringing establishment power to bear behind Toomey.

FL-Sen: It’s not much of a surprise, considering they’re close neighbors, but Rep. Kendrick Meek nailed down the endorsements of two key members of Florida’s House delegation — Debbie Wasserman Schultz and Ron Klein — which will come in handy if he does wind up facing off against Corrine Brown in the primary.

LA-Sen: Democratic New Orleans city councilor Arnie Fielkow decided, after some speculation, not to wade into the Louisiana Senate race. More plausible would be a challenge to Rep. Anh Cao in LA-02, as Fielkow is well-known in NoLa but has no statewide presence, but Fielkow also declined that, leading to speculation he may be eyeing the next mayor’s race instead.

GA-Gov:  With an eye on Roy Barnes, Ed Kilgore takes aim at the claim that Georgia governors have a long track record of failure when it comes to comebacks. It turns out that past probably isn’t prologue. (D)

TX-Gov: We’re reluctant to ascribe a whole lotta meaning to the phrasing of this particular letter, but Kay Bailey Hutchison seems to be moving pretty explicitly toward making official her run for Governor. Glenn Thrush points to a letter sent to potential donors saying “I am running for Governor.”

AZ-05: Is Congress ready for its first gamer (or at least its first out-of-the-closet gamer)? Jim Ward, the former president of video game maker LucasArts, announced that he’ll be running for the GOP nomination to go up against Rep. Harry Mitchell. Ward brings a lot of wealth to the table, but he’ll have an uphill fight against former Maricopa County Treasurer David Schweikert, who lost the 2008 election to Mitchell by 9 points and is looking for a rematch.

TX-32: Dems have landed a good candidate in TX-32 to go up against Rep. Pete Sessions: Grieg Raggio, an attorney and husband to Judge Lorraine Raggio. The 32nd, in north Dallas, is still a red district but has seen rapidly declining GOP numbers, both for Sessions and at the presidential level, and is down to R+8.

NY-AG: Nassau Co. Exec Tom Suozzi published an editorial in the New York Times where he publicly discusses having changed his mind on the gay marriage issue (he’s now for it). With New York one of the few states where gay marriage has become an issue with majority support, Suozzi looks to be repositioning himself for, well, something (probably, as often rumored, Attorney General, but maybe Governor if Andrew Cuomo continues to dither).

Redistricting: The Hill has an interesting piece about redistricting; while it doesn’t delve into too many specifics, it does shed some light on what districts the GOP is rushing to try to take back before they get strengthened for the Dems (like Bobby Bright’s AL-02), and what districts are unlikely to draw top tier challengers because everyone is willing to sit back and wait for new open districts to pop up in 2012 (like Dina Titus’s NV-03).

Race Tracker: Benawu is already back doing what he does best: chronicling the Dems’ efforts to field candidates in all 435 districts. Right now, we’re still looking in 124 GOP-held districts (although, of course, it’s still early in the cycle). Check out the RaceTracker 2010 wiki for more.

Redistricting Maryland: 8 Democrats (Version 2.0)

(This diary is cross-posted on the Daily Kos)

Two months ago, I posted a diary here, “Redistricting Maryland: 8 Democratic Seats”

http://www.swingstateproject.c…

I have since then worked with the map to design a plan which will make it even more likely that eight Democrats can be elected in 2012.  I must admit that the resulting map is quite gerrymandered (though not more so than the existing Maryland map).  I am opposed to highly gerrymandered redistricting in principle.  Even though the Supreme Court has clearly ruled that political gerrymandering (as opposed to gerrymandering where race is the predominant factor) is permissible, I just think that it ultimately lets some politicians decide who their voters are going to be, instead of the other way around.  However, as long as the Republicans continue to do it, there is no reason why Democrats should disarm unilaterally.  

I tried to make the new map reflective of 2010 population estimates, as different parts of Maryland have experienced varying population growth levels.  For example, the population of Baltimore City is expected to decline slightly between the 2000 and 2010 Censuses, while some outer exurban areas of Baltimore and Washington are expected to show increases of 20% or more.  The new map reflects this reality.  The map keeps intact much of the territory of the current seven Democratic representatives, while still creating an additional eighth Democratic seat.

As in my April post, the map below demonstrates that it is very possible to redistrict Maryland in a manner in which eight Democrats can be elected to Congress from the state.  I have refined the map whereby seven Democratic districts (Districts 2, 3, 4, 5, 6, 7 and 8) voted for Obama by at least a 22.5 point margin.  Districts 4 and 7 remain African-American majority, as is necessary per the VRA.  (Both districts are ensured to elect an African-American Democrat, as 70% or more of the Democratic primary vote in each district is expected to be comprised of African-Americans.)  The proposed District 1 goes from one which McCain won by 18.5 points to one which Obama wins by 6.4 points; if Kratovil makes it through 2010, he will be more than safe in the new MD-1.  The proposed District 6 goes from one which McCain won by 17.5 points to one which Obama wins by 22.6 points.  In the discussion of each district (below the map) I also discuss how these new districts performed in other recent Maryland political races (2004, 2006 and 2008 elections).

Maryland Map:

Photobucket

Central Maryland Map:

Photobucket

Central Maryland Maps with precincts:

Photobucket

Photobucket

Photobucket

Note:  Additional supplemental maps can be found at bottom of diary.

Discussion of Individual Districts:

YELLOW – District 1:  Frank Kratovil (home: Queen Anne’s County)

Current District:  Obama 39.8%; McCain 58.3% (McCain + 18.5)

Proposed District:  Obama 52.3%; McCain 45.9% (Obama + 6.4)

Proposed District:  Kerry 47.9%; Bush 51.1%

Proposed District:  Cardin 45.6%; Steele 52.7%

Proposed District:  O’Malley 44.5%; Ehrlich 54.4%

This district continues to encompass the entire Eastern Shore.  The new district proceeds through parts of northern Harford and Baltimore Counties (although it completely excludes the State Senate District of 2008 GOP Candidate Andy Harris) and into very Democratic territory on the western side of Baltimore County.   The district also includes the Annapolis area in Anne Arundel County.  Interestingly, both the Obama-McCain and Kerry-Bush percentages of the new district correspond very closely to the national average.

Major communities in proposed MD-1 district: all of Eastern Shore; Harford County – Bel Air (part); Baltimore County – Randallstown, Lochearn, Milford Mill, Owings Mills, Reisterstown, Woodlawn (part); Anne Arundel County – Annapolis.

GRAY – District 2:  Dutch Ruppersberger (home: Cockeysville)

Current District:  Obama 59.8%; McCain 38.3% (Obama + 21.5)

Proposed District:  Obama 60.8%; McCain 37.5% (Obama + 23.3)

Proposed District:  Kerry 55.3%; Bush 43.8%

Proposed District:  Cardin 52.3%; Steele 45.9%

Proposed District:  O’Malley 51.0%; Ehrlich 47.8%

The new district continues to include most of the communities currently in MD-2, including parts of Anne Arundel, Harford and Baltimore Counties, as well as Baltimore City (the proposed district includes all areas of Baltimore City currently in MD-2 and also adds the area around Hopkins/Bayview Hospital on the eastern side of the city.)  The new district expands into parts of Prince George’s and Howard Counties.

Major communities in proposed MD-2 district: Baltimore City (part); Anne Arundel County – Brooklyn Park, Glen Burnie (part), Severn, Fort Meade, Odenton, Maryland City; Harford County – Bel Air (part), Fallston, Joppatowne, Edgewood, Aberdeen, Havre de Grace; Baltimore County – Cockeysville, Towson (part), Rosedale, Middle River (part), Essex (part), Dundalk (part); Prince George’s County – Laurel; Howard County – Savage-Guilford.

ORANGE – District 3:  John Sarbanes (home: Towson)

Current District:  Obama 58.8%; McCain 39.2% (Obama + 19.6)

Proposed District:  Obama 60.5%; McCain 38.0% (Obama + 22.5)

Proposed District:  Kerry 55.4%; Bush 43.8%

Proposed District:  Cardin 57.3%; Steele 40.9%

Proposed District:  O’Malley 52.4%; Ehrlich 46.2%

Like MD-2, the new MD-3 remains quite similar to the current district.  Most of the Baltimore City, Baltimore County and Howard County areas remain intact.  Additional territory in Baltimore Co., Howard County and Montgomery County is added.  The Anne Arundel County part of the current district is detached.

Major communities in proposed MD-3 district: Baltimore City (part); Baltimore County Towson (part), ParkvilleCarney, Pikesville, Timonium-Lutherville, Perry Hall, White Marsh, Arbutus, Lansdowne; Howard County – Elkridge, Ellicott City (part), Columbia, North Laurel; Montgomery County – Burtonsville, Colesville, Aspen Hill (part), Olney, Laytonsville.

RED – District 4:  Donna Edwards (home: Fort Washington)

Current District:  Obama 85.1%; McCain 14.2% (Obama + 70.9)

Proposed District:  Obama 70.7%; McCain 28.0% (Obama + 42.7)

Proposed District:  Kerry 64.0%; Bush 34.8%

Proposed District:  Cardin 60.7%; Steele 37.9%

Proposed District:  O’Malley 61.7%; Ehrlich 37.3%

Proposed District African-American: 51%

The new MD-4 continues to encompass much of the same Prince George’s County communities currently in the district.  The Montgomery County part of the current district is detached and is substituted by parts of Anne Arundel and Baltimore Counties; very Republican precincts from both counties are added, and the overall Democratic percentage of the district goes down a lot, but still stays at over 70% Obama (there is completely no need to have a district with an Obama advantage of 85-14 !).

Major communities in proposed MD-4 district: Prince Goerge’s County – Fort Washington (part), Oxon Hill, Temple Hills, Andrews AFB, Forestville, Largo-Kettering, Mitchelville, Glenarden, Bladensburg, Riverdale, Hyattsville (part), College Park (part), Langley Park, Adelphi, Beltsville; Anne Arundel County – Crownsville, Gambrills, Davidsonville (part), Millersville, Severna Park, Pasadena-Lake Shore, Riviera Beach, Glen Burnie (part), Ferndale, Linthicum; Baltimore County – Sparrows Point/Edgemere, Dundalk (part), Essex (part), Middle River (part).

PURPLE – District 5:  Steny Hoyer (home: Mechanicsville)

Current District:  Obama 65.4%; McCain 33.3% (Obama + 32.1)

Proposed District:  Obama 62.7%; McCain 36.0% (Obama + 26.7)

Proposed District:  Kerry 54.7%; Bush 44.5%

Proposed District:  Cardin 53.7%; Steele 45.0%

Proposed District:  O’Malley 54.3%; Ehrlich 44.7%

This district changes relatively very little.  It continues to encompass all of the three Southern Maryland counties, south Anne Arundel Co. and “outer” Prince George’s Co.  Parts of Upper Marlboro as well as Crofton and parts of the Annapolis and Broadneck peninsulas are added, while Laurel and adjoining parts of northern Prince George’s are taken out of the district.  The district becomes slightly less Democratic, but it still has a very healthy 26.7 point Obama advantage over McCain.

Major communities in proposed MD-5 district: All of Southern Maryland – Calvert County, Charles County, St. Mary’s County; Prince Goerge’s County – Fort Washington (part), Clinton, Upper Marlboro, Bowie, Glenn Dale, Greenbelt; Anne Arundel County – Riva, Edgewater, Davidsonville (part), Mayo, Shady Side, Deale, Parole/Annapolis, Arnold, Cape St. Claire, Crofton.

GREEN – District 6:  Roscoe Bartlett (home: Frederick)

Current District:  Obama 40.2%; McCain 57.7% (McCain + 17.5)

Proposed District:  Obama 60.3%; McCain 37.7% (Obama + 22.6)

Proposed District:  Kerry 54.3%; Bush 44.7%

Proposed District:  Cardin 54.5%; Steele 44.1%

Proposed District:  O’Malley 51.6%; Ehrlich 47.3%

The new district includes most of Frederick County, parts of Carroll County, as well as a good chunk of Montgomery County.  The new territory in Montgomery is the factor that dramatically changes the political composition of this district, as some of the most Democratic parts of the county are added to MD-6.

Major communities in proposed MD-6 district:  Frederick County – Frederick, Middletown, Thurmont, Emmitsburg, New Market, Mt. Airy; Carroll County – Taneytown, Manchester; Montgomery County – Damascus, Clarksburg, Germantown, Montgomery Village, Aspen Hill (part), Wheaton-Glenmont, White Oak, Silver Spring (part), Takoma Park (part).

BLUE – District 7:  Elijah Cummings (home: Baltimore City)

Current District:  Obama 78.8%; McCain 19.9% (Obama + 58.9)

Proposed District:  Obama 67.0%; McCain 31.5% (Obama + 35.5)

Proposed District:  Kerry 60.8%; Bush 37.9%

Proposed District:  Cardin 55.2%; Steele 42.8%

Proposed District:  O’Malley 55.2%; Ehrlich 43.1%

Proposed District African-American: 51%

The new MD-7 is not that different from the current district.  The Baltimore City portion of the district remains wholly intact, and, in fact, is expanded to include a few additional African-American majority neighborhoods (including the Pimlico and Coldspring areas in the northwestern part of the city).  The Catonsville and Woodlawn areas in western Baltimore County as well as a good portion of Howard County also remain with MD-7. New, more Republican areas in northern Baltimore County, and parts of Carroll and Harford Counties are added to the district.

Major communities in proposed MD-7 district:  Baltimore City (part); Baltimore County – Catonsville, Woodlawn (part); Harford County – Jarretsville; Carroll County – Westminster, Hampstead, Eldersburg, Sykesville; Howard County – Ellicott City (part).

PINK – District 8:  Chris Van Hollen (home: Kensington)

Current District:  Obama 73.9%; McCain 24.7% (Obama + 49.2)

Proposed District:  Obama 62.0%; McCain 36.2% (Obama + 25.8)

Proposed District:  Kerry 56.9%; Bush 41.6%

Proposed District:  Cardin 58.3%; Steele 40.4%

Proposed District:  O’Malley 55.0%; Ehrlich 44.0%

The new district includes most of Montgomery County, parts of Frederick and Prince George’s Counties, as well as all of the three Western Maryland counties.  The district becomes somewhat less Democratic, but the new MD-8 still has some of the state’s best partisan stats (4th best Obama percentage, after the two African-American majority districts, and just behind MD-5; 3rd best Kerry percentage; 3rd best O’Malley percentage – just slightly behind MD-7; and 2nd best Cardin percentage – behind only MD-4 and ahead of both MD-3, Cardin’s home district, and the new MD-7 !).

Major communities in proposed MD-8 district:  All of Western Maryland (Garrett County, Allegany County, Washington County); Frederick County – Brunswick; Montgomery County – Silver Spring (part), Takoma Park (part), Kensington, Chevy Chase, Bethesda, Potomac, Rockville, Gaithersburg, Poolesville; Prince George’s County – Hyattsville (part), Mt. Rainier, Cheverly, Seat Pleasant, Landover.  

Note:  for the entire plan above, the boundaries of only three precincts had to be changed slightly in order to make the map work: 26-7 and 26-11 in Baltimore City, and 4-11 in Baltimore County.

So that’s my Maryland Redistricting Plan – Version 2.  I welcome comments and discussion (if possible, could someone calculate the “PVI’s” for my “new” districts based on the numbers above; I’m not being lazy, just not exactly sure what the current definition is).

Maps of Presidential Performance 2008:

Photobucket

Photobucket

Baltimore City:

Photobucket

Btw, the Baltimore City precinct from the map above that voted 100% for Obama is 15-12, part of the Walbrook neighborhood !  (close-up map is below).  In addition, 47 other precincts in Baltimore City had Obama percentages of 99.0 to 99.9, while 48 voted for Obama at a 98.0 to 98.9% rate (there were also 32 precincts in Prince George’s County that had Obama percentages of between 98.0 and 98.9, and five that voted 99.0 to 99.9% for Obama).  I grew up in Baltimore and currently reside in Silver Spring, and am very proud to live in the great state of Maryland !

Photobucket

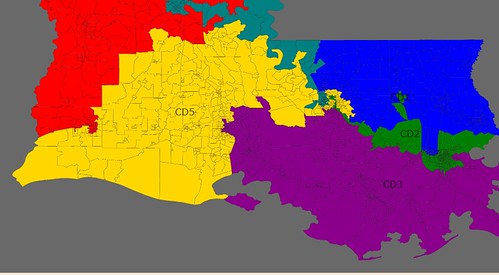
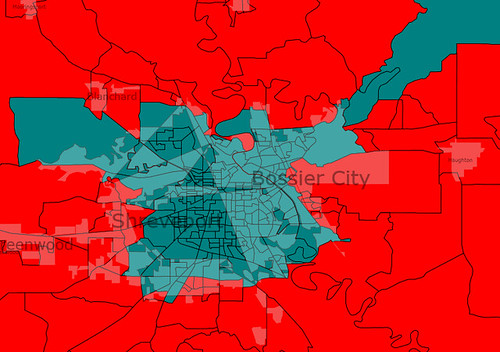
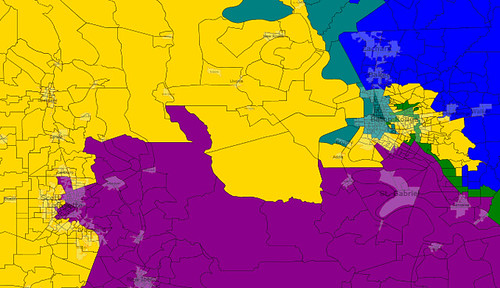
Louisiana Redistricting: Party like it’s 1992!

So the images are pretty self-explanatory. I’ve created two minority-majority districts and protected (I think) Charlie Melancon. My working assumption is that we’re at the end of the road for electing white Democrats in the deep south. Of course, the final map will not look like this: I’ve recreated the Cleo Fields’s illegal “Z” district. So what I have in mind is what a Democratic gerrymander might look at. Enjoy….

North Louisiana:

N Louisiana

South Louisiana:

South Louisiana

Shreveport:

Shreveport

Baton Rouge and Lafayette:

Baton Rouge and Lafayette

New Orleans:

NO

Redistricting Nevada – Si Se Puede!

The consensus is Nevada will have 4 congressional districts after 2010. Here is what it may look like:

Las Vegas area:

# map incumbent White Hispanic Black Asian Native Other
1 Blue no incumbent 29.50% 49.22% 13.74% 5.94% 0.52% 2.08%
2 Green Shelley Berkley 61.75% 17.47% 8.19% 9.23% 0.59% 2.76%
3 Purple Dina Titus 67.84% 16.42% 5.40% 6.82% 1.01% 2.51%
4 Red Dean Heller 70.47% 19.72% 1.89% 3.92% 2.08% 1.91%

A VRA-Hispanic district in Nevada would have been unthinkable 20 years ago but it looks likely in 2010. The fastest-growing demographic in America will almost certainly reach 50% of the 1st district in time for the 2010 census. (hence the title)

The 3rd district, despite its appearance, is mostly an urban-suburban district surrounding Las Vegas. 87% of its population is in Clark County. Most of the existing 3rd district (the propeller, represented by Dina Titus) is in the proposed 3rd district.


The propeller does lose some of its inner parts, possibly its most liberal parts, to the new 2nd district. But by then Dina Titus will have had 4 years to become popular and entrenched, and the Las Vegas region will have had 4 years to become even more liberal. Dina Titus, or whoever represents this district, will have to make some occasional obligatory appearances in the far-flung parts of this district.

Why Chruchill County? Because it had the right number of people. It was the only way to get population equality without dividing any northern counties. Churchill looks like it belongs in the 4th district. In order to do that I could either put part of Elko in the 3rd, or put all of Elko in the 3rd and part of Nye in the 4th.

Any information about what features are in what district (casinos, brothels, Yucca Mountain, Area 51, etc) is welcome in the comments.

DOJ to the Black Courtesy Telephone (South Carolina)

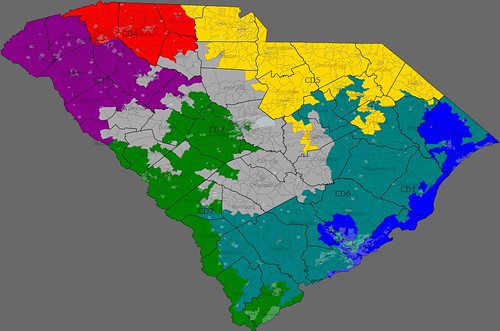
If South Carolina does gain a district, as projected, it will be possible to make that new district a second majority African American one.

Here’s one such map that does this:


(Full Resolution)

Charleston:

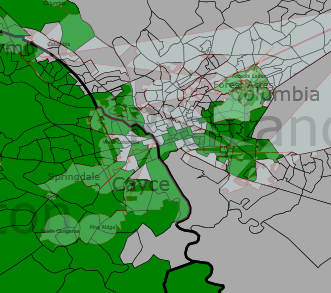
Columbia:

The racial demographics of the two districts are:

District 6 (Charleston based):

Black: 341,718 (53.4%)

White: 263,579 (41.2%)

Other (inc. Hispanic): 34,797 (5.4%)

District 7 (Columbia based):

Black: 357,623 (55.9%)

White: 242,185 (37.9%)

Other: 39,613 (6.2%)

Even if the DOJ doesn’t mandate the creation of new African American district, the Republican controlled legislature may want to create one anyway, since it would shore up the 1st and 2nd districts, both of which had strong challenges last year, and take some Black voters out of the 5th, which would go from 32 to 25 percent Black, though it would remain unlikely that they will be competitive there until Spratt retires.

Redistricting New Jersey

I drew my map with the goal of getting as many Democratic seats as possible. This was before I knew New Jersey has a commision draw its seats so it is probably unrealistic. I looked up the politcal data and caculated the presidential results for each district. I managed to get 11 districts at 54% or better and one Republican seat.  

Northeast New Jersey

Image Hosted by ImageShack.us

North New jersey

Image Hosted by ImageShack.us

South New Jersey

Image Hosted by ImageShack.us

District 1 – Frank LoBiondo(R-Ventnor)

Stays Pretty much the same loses its area in Burlington and Camden Counties for more democratic areas in Gloucester County

Voted 55.3-43.5 Obama

District 2 – Robert Andrews(D-Haddon Heights)

Andrews current district went 65% for Obama so I gave some of its democratic areas to the 1st and 3rd and picked up republican areas in Burlington and Ocean Counties.

Voted 58-40.7 Obama

District 3 – John Adler(D-Cherry Hill)

Adlers old district went 52% for Obama so I swaped some areas with Andrews gave it the rest of Norther Burlington County and gave it less of Ocean County

Voted 56.1-42.8 Obama

District 4 – Christoper Smith(R-Hamiliton) vs Rush Holt(D-Hopewell)

Since I took Burlington out of the old 4th I needed more democratic areas so I gave it all of Mercer County where both Smith and Holt live and to balance it out I gave it the rest of Ocean Coutny

Voted 55.8-42.9 Obama

District 5 – Frank Pallone(D-Long Branch)

Loses New Brunswick and Plainfield picks up Linden and picks up some republican areas of Monmouth County

Voted 54.3-44.6 Obama

District 6 – No Incumbent

Since I was trying to avoid a republican district in the south. When I put all of Mercer County in the 4th it left me with no incumbent near my 6th. Takes in New Brunswick and other Democratic areas in Middlesex County and Republican areas of Monmouth County.

Voted 55.4-43.6 Obama

District 7 – Lenoard Lance(R-Lebanon)

The old 7th barely went for Obama so I gave it more of Union County

Voted 54.1-45.1 Obama

District 8 – Donald Payne(D-Newark)

Lost its areas of Elizabeth and gained area in Essex and Morris counties. Is only 45% Black and 37% White

District 9 – Albio Sires(D-West New York)

Loses its finger to the south and picks up areas in Hudson and Bergen counties. Only 44% Hispanic and 37% White

District 10 – Bill Pascrell Jr(D-Patterson) Takes in almost all of Passaic County and some of Essex and some republican areas in Bergen County.

Voted 57.3-41.9 Obama

District 11 – Steven Rothman(D-Fair Lawn)

Loses area in Passaic and Hudson Counties picks up more area in Bergen County and Passaic City.

Voted 58.7-40.5 Obama

District 12 – Scott Garrett(R-Wantage) vs Rodney Frelinghuysen(R-Harding)

The 12th is left with Republican areas in the north.

I didnt have political data of Morris County but this district went about 56-43 McCain

New Districts for Washington State

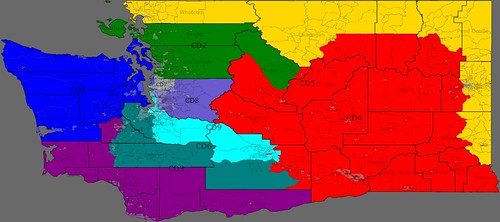
The goal of this was to draw 8 districts capable of electing Democrats.  Without detailed political data it’s difficult to know whether this is ridiculously overreaching or just “aggressive”, but I though I’d give it a shot.

The Whole State:


(Larger Resolution)

Blow up of Seattle-Tacoma:

District 1:

This district is now centered on the Olympia Peninsula, but still retails a portion of Seattle and it’s Northern suburbs.

District 2:

Loses Whatcom and Island counties in exchange for some suburban areas South of Everett and a small area East of the Cascades.

District 3:

This district (which in it’s old configuration went narrowly for Bush twice) has been shored up slightly by replacing most of conservative Lewis county with a larger portion of Olympia and Dem trending Klickitat County.

District 4:

Heart of Conservative Eastern Washington.  Yakima, which was the population center of the old district has been removed in exchange for the reddest areas of the old 5th.

District 5:

Politically competitive district in Northern and far Eastern Washington.  While it went for Obama in 2008, it probably supported Bush in 2004.  A strong Dem from Spokane could wrest the seat from McMorris Rodgers.

District 6:

This seat has been changed fairly substantially. While, still anchored in Tacoma, it no longer contains the Olympia Peninsula, but instead has portions of Thuston, most of Lewis and a small part of Yakima counties.  Current Congressman Norm Disks would be unhappy, as his Bremerton home is now outside of the district.

District 7:

To help out some of the neighboring districts the 7th now has less of Seattle and gained some suburban regions that were in the 1st and 8th.  It still should be very Democratic.

District 8:

The new 8th is now entirely in King County, gaining Renton, Kent and a healthy portion of Seattle.  Hopefully enough to send Sheriff Dave riding off into the sunset.

District 9:

This is the district I am the most apprehensive about.  While I did give it a portion of Seattle I also added some conservative parts of Pierce County and the City of Yakima.  I would want to look at more detailed political data to make sure I didn’t push it too far right.


Taking Another Swing at New Jersey

The last time I redistricted NJ, I started from the north. That made for a messy 12th district that I wasn’t happy with. This time I started in the south, and came up with what I feel is a better map, especially because it isolates Ocean County in a Republican district.

District numbers are again the same, with the old 13th renumbered the 11th.

On to the maps!  

Newark Enlargement:

Image Hosted by ImageShack.us

North Jersey:

Image Hosted by ImageShack.us

Central Jersey:

Image Hosted by ImageShack.us

South Jersey 1:

Image Hosted by ImageShack.us

South Jersey 2:

Image Hosted by ImageShack.us

FL and GA on Dave’s App.

Having mapped most of the country in my absurdly low-tech fashion, the release of Dave’s redistricting application (and bandwagon appeal) compels me to revisit some of these states with better data. I’ll start with Florida and Georgia, two states covered by recent diaries but for which my approach is decidedly different.

These maps resemble what I drew on Paint, but not exactly.

Below the fold…

Florida

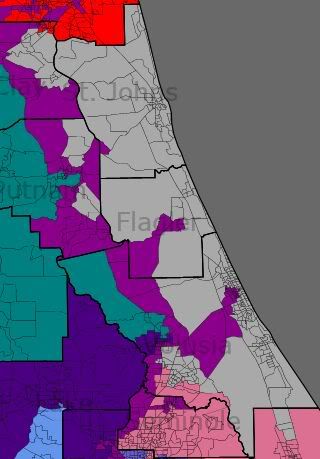
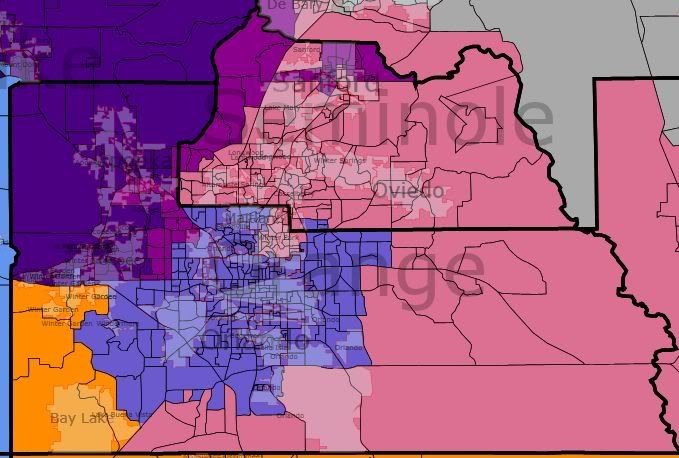
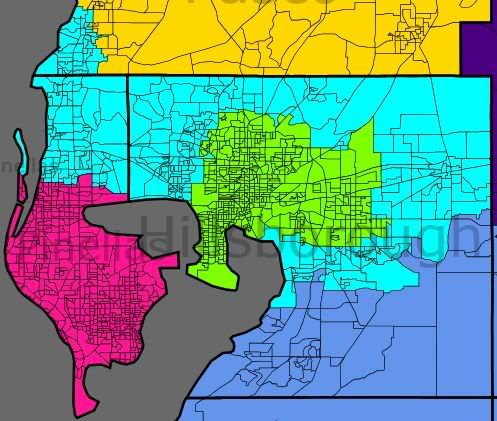
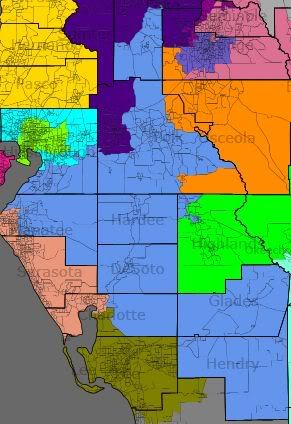
Like my Paint-generated Florida map, this is based on the assumption of a Republican plan, and more or less consists of incumbent protection with few exceptions (since it does generally protect incumbents, the map wouldn’t be dramatically different if Alex Sink was elected). Re: the Voting Rights Act, I was not able to preserve a black majority in Corrine Brown’s district; 47% was as close as I could seem to get, but with the white population at 40%, other minority groups would seem to make FL-3 VRA-protected.

The new 26th, as in my original iteration, is a modestly GOP-leaning Central Florida seat between the Ocala area and Lake Okeechobee.

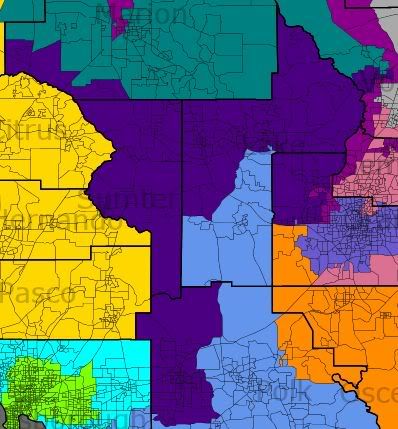
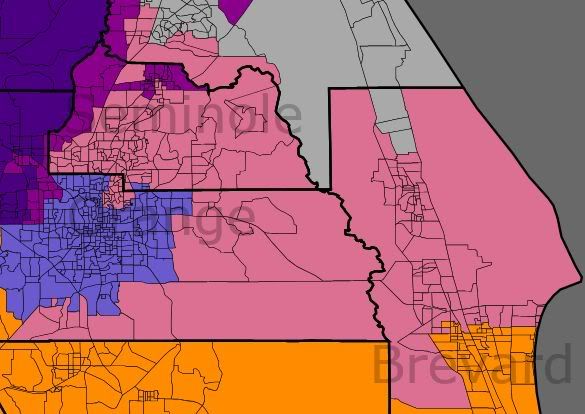
The northern half of the state:

Photobucket

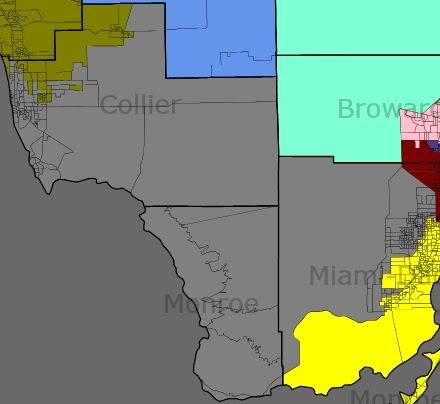
The southern half of the state:

Photobucket

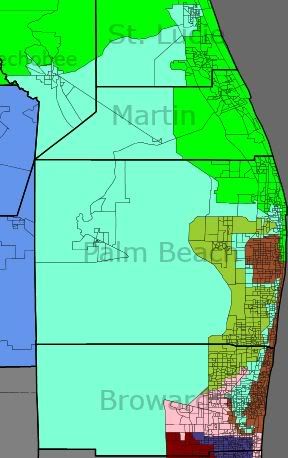
Focus on South Florida:

Photobucket

District 1 (blue) – Jeff Miller (R-Chumuckla)

Counties: Escambia, Holmes, Okaloosa, Santa Rosa, Walton

Large minorities: 14% black

Politics: strong Republican

District 2 (dark green) – Allen Boyd (D-Monticello)

Counties: Bay, Calhoun, Dixie, Franklin, Gadsden, Gulf, Jackson, Jefferson, Lafayette, Leon, Liberty, Madison, Taylor, Wakulla, Washington

Large minorities: 25% black

Politics: Republican-leaning when Boyd retires

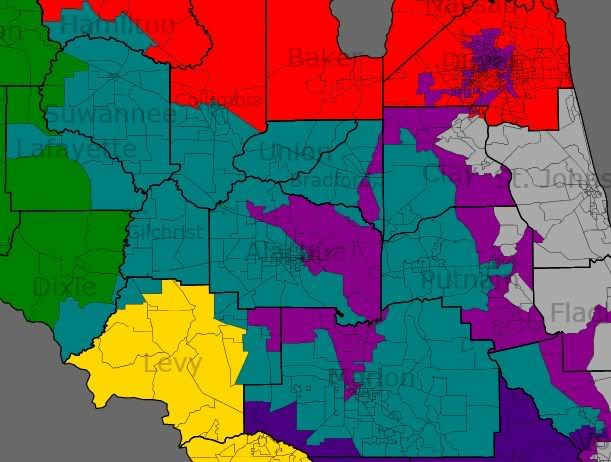
District 3 (purple) – Corrine Brown (D-Jacksonville)

Counties: Alachua, Clay, Duval, Lake, Orange, Putnam

Large minorities: 47% black (just 40% white)

Politics: strong Democratic

District 4 (red) – Ander Crenshaw (R-Jacksonville)

Counties: Baker, Columbia, Duval, Hamilton, Nassau

Large minorities: 15% black

Politics: strong Republican

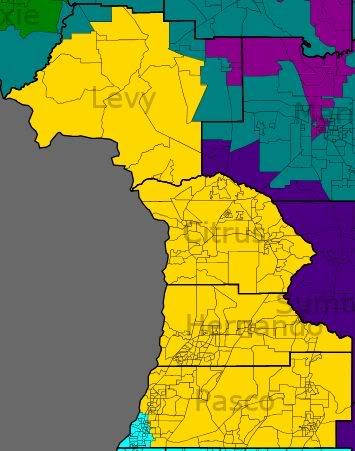
District 5 (yellow) – Ginny Brown-Waite (R-Brooksville)

Counties: Citrus, Dixie, Gilchrist, Hernando, Levy, Pasco

Large minorities: none

Politics: strong Republican

District 6 (aquamarine) – Cliff Stearns (R-Ocala)

Counties: Alachua, Baker, Bradford, Clay, Columbia, Hamilton, Marion, Suwannee, Union

Large minorities: 11% black

Politics: strong Republican

District 7 (gray) – John Mica (R-Winter Park)

Counties: Flagler, Lake, Putnam, Seminole, St. Johns, Volusia

Large minorities: 12% Hispanic, 11% black

Politics: generally Republican

District 8 (lavender) – Alan Grayson (D-Orlando)

Counties: Orange

Large minorities: 27% Hispanic, 10% black

Politics: tilting/trending Democratic

District 9 (turquoize) – Gus Bilirakis (R-Palm Harbor)

Counties: Hillsborough, Pasco, Pinellas

Large minorities: 14% Hispanic

Politics: tilting Republican

District 10 (fuchsia) – Bill Young (R-Indian Shores)

Counties: Pinellas

Large minorities: none

Politics: swing/leaning Republican

District 11 (yellow-green) – Kathy Castor (D-Tampa)

Counties: Hillsborough, Pinellas

Large minorities: 28% black, 24% Hispanic

Politics: strong Democratic

District 12 (sky blue) – Adam Putnam (R-Bartow)

Counties: Hardee, Hillsborough, Marion, Polk, Sumter

Large minorities: 15% Hispanic, 12% black

Politics: generally Republican

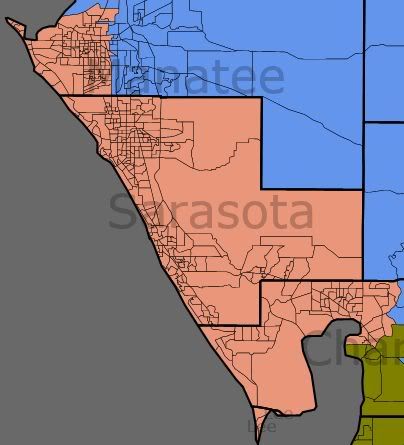
District 13 (pink) – Vern Buchanan (R-Sarasota)

Counties: DeSoto, Hardee, Manatee, Sarasota

Large minorities: 11% Hispanic

Politics: generally Republican

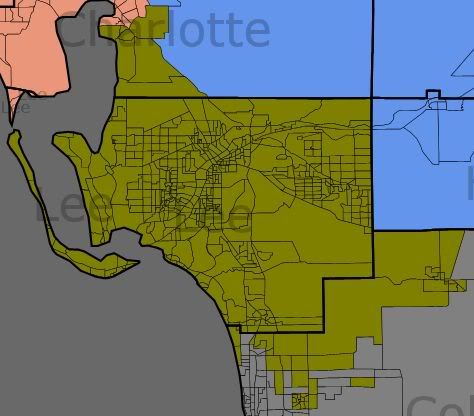
District 14 (olive) – Connie Mack (R-Fort Myers)

Counties: Charlotte, Collier, Lee

Large minorities: 16% Hispanic

Politics: strong Republican

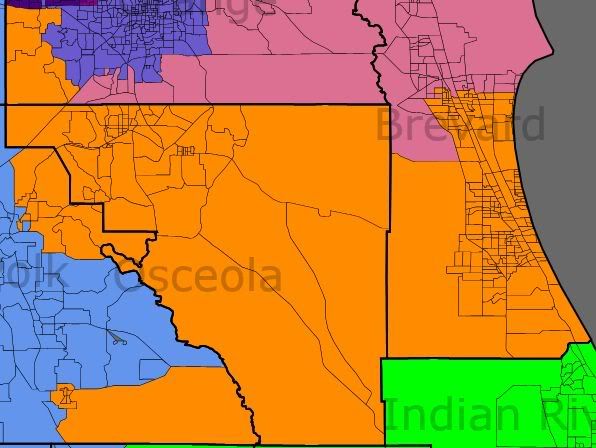
District 15 (orange) – Bill Posey (R-Rockledge)

Counties: Brevard, Indian River, St. Lucie

Large minorities: 11% black

Politics: generally Republican

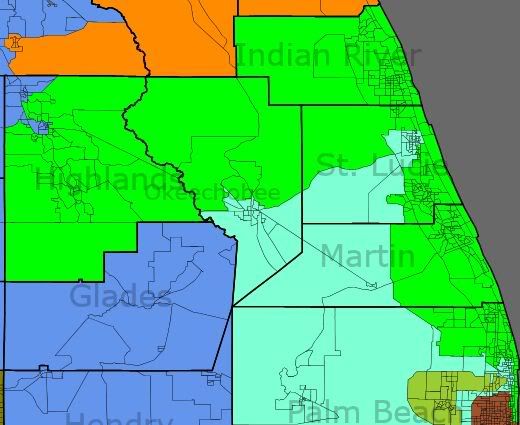
District 16 (green) – Tom Rooney (R-Tequesta)

Counties: Charlotte, DeSoto, Glades, Hendry, Highland, Martin, Palm Beach, Okeechobee, St. Lucie

Large minorities: 16% Hispanic

Politics: tilting Republican

District 17 (ash purple) – Kendrick Meek (D-Miami)

Counties: Broward, Miami-Dade

Large minorities: 52% black, 28% Hispanic

Politics: strong Democratic

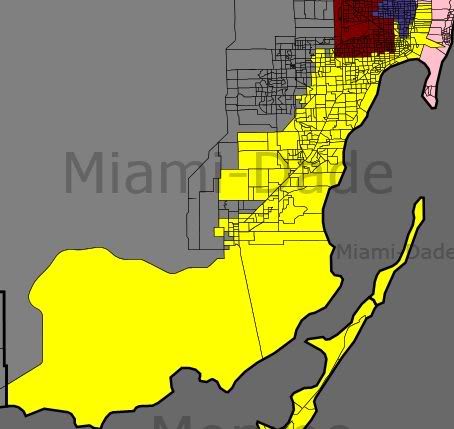
District 18 (yellow) – Ileana Ros-Lehtinen (R-Miami)

Counties: Miami-Dade, Monroe

Large minorities: 63% Hispanic

Politics: swing/leaning Republican

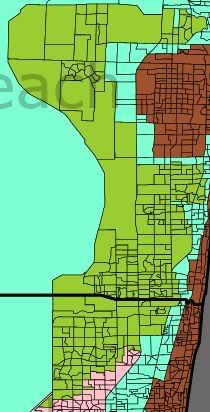
District 19 (chartreux) – Robert Wexler (D-Boca Raton)

Counties: Broward, Palm Beach

Large minorities: 22% Hispanic

Politics: strong Democratic

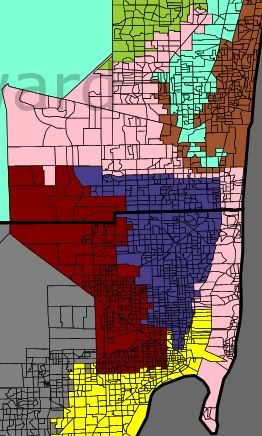
District 20 (light pink) – Debbie Wasserman Schultz (D-Weston)

Counties: Broward, Miami-Dade

Large minorities: 31% Hispanic, 11% black

Politics: strong Democratic

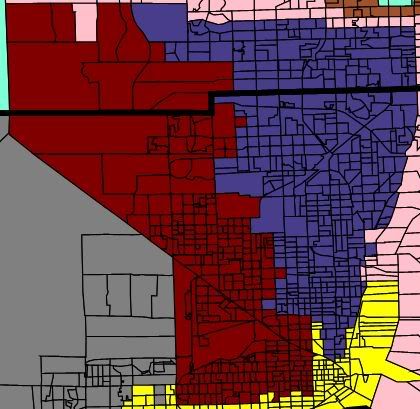
District 21 (maroon) – Lincoln Diaz-Balart (R-Miami)

Counties: Miami-Dade

Large minorities: 72% Hispanic

Politics: swing/leaning Republican

District 22 (brown) – Ron Klein (D-Boca Raton)

Counties: Broward, Palm Beach

Large minorities: 15% Hispanic

Politics: tilting Democratic

District 23 (mint green) – Alcee Hastings (D-Miramar)

Counties: Broward, Palm Beach

Large minorities: 52% black, 18% Hispanic

Politics: strong Democratic

District 24 (violet) – Suzanne Kosmas (D-New Smyrna Beach)

Counties: Brevard, Flagler, Orange, Seminole, Volusia

Large minorities: 13% Hispanic

Politics: swing

District 25 (salmon) – Mario Diaz-Balart (R-Miami)

Counties: Collier, Miami-Dade, Monroe

Large minorities: 65% Hispanic

Politics: swing/leaning Republican

District 26 (charcoal) – New

Counties: Highland, Lake, Marion, Okeechobee, Osceola, Polk

Large minorities: 25% Hispanic

Politics: tilting Republican

Georgia

While it’s possible Roy Barnes or another Democrat will win the open governor’s mansion (a possibility in Florida too), I’m tentatively betting on a GOP gerrymander that finally cracks Jim Marshall’s district and makes the districts of Sanford Bishop and John Barrow majority-minority at last (Bishop’s would have an outright black majority, Barrow’s being 48% black and 46% white).

The most controversial choice I made was to kill those two birds with one stone by dividing Marshall’s Macon base, giving most of urban Macon (which is heavily black) to Bishop (thereby forcing Marshall against the more entrenched Bishop in a majority-black district based in Southwest Georgia that Bishop would be clearly favored to win) and rendering the 8th even more rural and white.

I kept all three black-majority Atlanta districts over 50%, did my best to protect GOP incumbents in the suburbs, and created a new GOP-leaning suburban seat. In short, the quintessential Republican map. The only part I may have seriously screwed up was Linder’s district…it’s getting harder and harder to keep his portion of Gwinnett County solidly in GOP hands, and the 7th is now the most diverse district in the state.

Photobucket

Photobucket

District 1 (blue) – Jack Kingston (R-Savannah)

Description: entire coastline, rural South Georgia, white areas of Savannah, Valdosta, Vidalia

VRA stats: 72% white, 21% black

Politics: strong Republican

District 2 (dark green) – Sanford Bishop (D-Albany) vs. Jim Marshall (D-Macon) [Bishop would likely win primary in mostly intact but newly black-majority district despite Marshall’s Macon base)

Description: rural Southwest Georgia, Columbus, Albany, most of Macon and Valdosta

VRA stats: 52% black, 42% white

Politics: generally Democratic

District 3 (purple) – Lynn Westmoreland (R-Grantville)

Description: Atlanta exurbs to the south

VRA stats: 68% white, 25% black

Politics: strong Republican

District 4 (red) – Hank Johnson (D-Lithonia)

Description: most of DeKalb County

VRA stats: 51% black, 32% white, 11% Hispanic

Politics: strong Democratic

District 5 (yellow) – John Lewis (D-Atlanta)

Description: heart of Atlanta, remainder of DeKalb County

VRA stats: 54% black, 34% white

Politics: strong Democratic

District 6 (aquamarine) – Tom Price (R-Roswell)

Description: north Atlanta suburbs — Cherokee County, portions of Bartow and Cobb, north Fulton

VRA stats: 78% white

Politics: strong Republican

District 7 (gray) – John Linder (R-Duluth)

Description: most of Gwinnett County, small portion of Forsyth

VRA stats: 47% white, 22% black, 18% Hispanic, 11% Asian [most diverse, and rapidly diversifying, district in the state; this could be serious trouble for the Republicans by the mid-to-late 2010s]

Politics: tilting Republican but trending Democratic

District 8 (lavender) – open/not Jim Marshall

Description: far southern outskirts of Atlanta MSA, Warner Robins, rural Middle Georgia, down to Thomasville and Quitman

VRA stats: 66% white, 27% black

Politics: fairly strong Republican

District 9 (turquoise) – Nathan Deal (R-Gainesville)

Description: Appalachian North Georgia, Dalton, Gainesville, far north exurban Atlanta

VRA stats: 80% white, 13% Hispanic

Politics: strong Republican

District 10 (fuchsia) – Paul Broun (R-Athens)

Description: Northeast Georgia, Athens, north and west Augusta

VRA stats: 77% white, 15% black

Politics: strong Republican

District 11 (yellow-green) – Phil Gingrey (R-Marietta)

Description: northwest Atlanta suburbs/exurbs, much of Cobb County

VRA stats: 67% white, 19% black

Politics: strong Republican

District 12 (sky blue) – John Barrow (D-Savannah)

Description: southeast Augusta, northwest Savannah, rural eastern Georgia [meant to concentrate black population]

VRA stats: 48% black, 46% white [not quite a majority but closer than before]

Politics: generally Democratic

District 13 (pink) – David Scott (D-Atlanta)

Description: south Fulton County, all of Clayton and Douglas, southeast Cobb

VRA stats: 52% black, 33% white, 10% Hispanic

Politics: strong Democratic

District 14 (olive) – New

Description: east Atlanta suburbs/exurbs — most of Forsyth County, remainders of Gwinnett and Hall, stretching south through Barrow, Walton, Rockdale, Newton, and Butts

VRA stats: 71% white, 18% black [I should definitely have weakened Republican strength here for Linder’s benefit…live and learn, I guess!]

Politics: strong Republican [again, split the difference between this and the 7th and you have two fairly strong GOP districts]

So there you are, computer-generated equivalents of two of my maps. I’ve also done Texas and Missouri on Dave’s app and will post those at a later date.

Florida Redistricting using the DRA

Dave’s Redistricting Application brought us this fun.

A summary of the districts

FL-1 (Incumbent Jeff Miller [R], pop. 704958, 76% white/14% African-American): This district removes the coastal tail in Okaloosa/Walton Counties and it shrinks overall (except some tracts in Jackson County). Overall, it should be Republican as usual.

FL-2 (Incumbent Allen Boyd [D], pop. 704923, 67% white/25% African-American): This district was previously 72/22 white. It adds CD4 in Madison County westward and Washington County. It loses Suwanee County and parts of Taylor and Dixie Counties. It should be fine for Boyd and likeminded Moderate Dems.
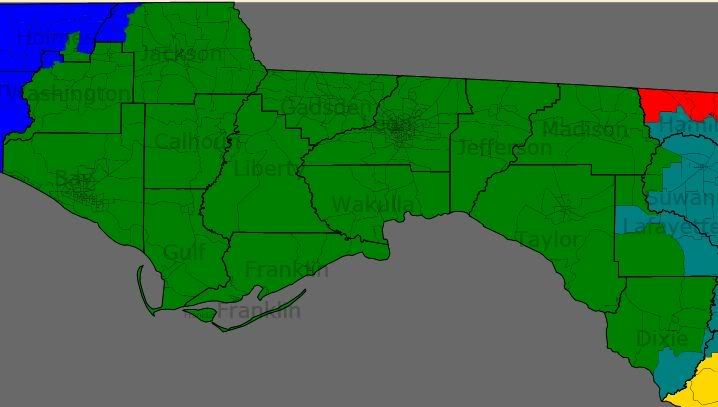
FL-3 (Incumbent Corrine Brown [D] pop 704874, 45% African-American/43% White): This district resembles the 1992 version of this district, which is probably not ideal since the 1992 version of this district got struck down by the Supreme Court. The district starts in Ocala, moves north, takes in part of Williston, includes parts of Gainesville, includes a slice of Starke, then it moves north to include parts of Jacksonville, it goes back south through Clay County, then it goes to Palatka, then includes part of Palm Coast, it goes farther south, takes in part of Daytona Beach, DeLand, Sanford, and ends with part in Apopka, and some tracts near Orlando. Overall, I’m not satisfied with the final product in regards to VRA. But the 2000 district was 49/38 African-American.

FL-4 (Incumbent Ander Crenshaw [R], pop. 704958, 75% White/14% African-American): This district is actually not as white as the 2000 district, despite losing random appendages and taking in more of Jacksonville.
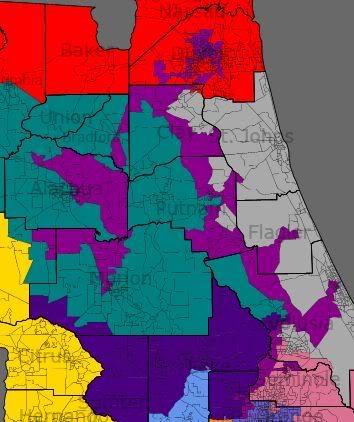
FL-5 (Incumbent Ginny Brown-Waite [R], pop. 704953, 83% White/5% African-American): This district gains coastal parts of Pasco County. It loses Sumter County and anything east of Citrus/Hernando/Pasco.
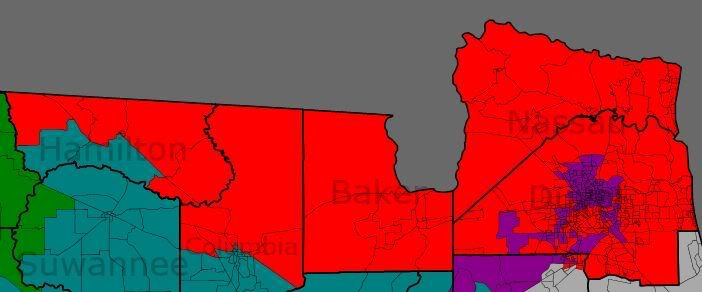
FL-6 (Incumbent Cliff Stearns [R], pop. 704932, 78% White/9% African-American): This district changes shape quite a bit and wraps around the 3rd.

FL-7 (Incumbent Suzanne Kosmas [D], pop. 704882, 82% White, 6% African-American): Kosmas current district [the 24th] is also whiter than this district. Since putting Mica’s house in the 7th wasn’t as practical as putting Kosmas’ house in the 7th, this arrangement was decided upon.

FL-8 (Incumbent Alan Grayson [D], pop. 704986, 48% White, 26% Hispanic, 20% African-American): Not only is this a total gift of a district for Grayson, it’s also not a horrendous gerrymander. The district unites Orlando in one district.

FL-9 (Incumbent Gus Bilirakis [R], pop. 704968, 75% White, 15% Hispanic, 5% African-American): Gus gives up parts of the coast on Pasco, and his district wraps around FL-11 now. And the White percentage drops here while the Hispanic percentage surges upwards.

FL-10 (Incumbent Bill Young [R], pop. 705002, 76% White, 12% African-American, 8% Hispanic): Here, the White percentage also drops, and we get a logical looking district including St. Petersburg.

FL-11 (Incumbent Kathy Castor [D], pop. 704964, 50% White, 23% Hispanic, 21% African-American): Despite making this district look logical, the demographics don’t particularly change.

FL-12 (No known incumbent, pop. 704768, 66% White, 20% Hispanic, 11% African-American): This district basically meandered since it was one of the last ones I did and it took in a lot of extras from everybody else. Depending on who wins the FL-12 election, this district may or may not have an incumbent.

FL-13 (Incumbent Vern Buchanan [R], pop. 704933, 82% White, 9% Hispanic, 6% African-American): The district shrinks, and actually includes African-American majority areas in Bradenton.

FL-14 (Incumbent Connie Mack [R], pop. 704899, 70% White, 21% Hispanic, 7% African-American): Adios Naples, Hola parts of Punta Gorda. Also, Hola giant surge in Hispanic percentage.

FL-15 (Incumbent Bill Posey [R], pop. 704991, 64% White, 23% Hispanic, 10% African-American): Well, hey… the minority population almost doubles. Posey loses Cape and gains Bay Lake/LBV.

FL-16 (Incumbent Tom Rooney [R], pop. 704935, 80% White, 11% Hispanic, 6% African-American): This district is one of the few to not have a higher minority population. It also looks a bit more normal now. It loses anything south/southwest of Highlands County, it gains Jupiter going down the beach.

And let’s go out of sequence for a one moment.


FL-21 is in red, FL-17 is in blue

FL-17 (Incumbent [fill in blank] Meek [D], pop. 704893, 52% African-American, 27% Hispanic, 17% White): The Hispanic population goes up, the African-American population goes down, and the representative is named Meek.

FL-21 (Incumbent Lincoln Diaz-Balart [R], pop. 704902, 82% Hispanic, 12% White, 5% African-American): Lawsuit bait, as serious packing is being undertaken here (from 69% to 82% Hispanic). If you don’t know your Miami-Dade, this district is now more compact around Hialeah.

And now back to sequence.


not pictured: Key West

FL-18 (Incumbent Ilena Ros-Lehtinen [R], pop. 704887, 55% Hispanic, 30% White, 13% African-American): Also a bit of lawsuit bait, as the Hispanic percentage goes down by 7 points.

FL-19 (Incumbent Robert Wexler [D], pop. 705015, 72% White, 16% Hispanic, 8% African-American): This district is being smoothed out a bit due to other changes around, and it keeps the same basic shape.

FL-20 (Incumbent Debbie Wasserman Schultz [D], pop. 704927, 53% White, 33% Hispanic, 10% African-American pop. 704872, 50% White, 32% Hispanic, 14% African-American): I probably drew this wrong (and it is a lot more Hispanic than the current district). It moves from Miami Beach up to Weston and Davie.

FL-22 (Incumbent Ron Klein [D], pop. 704918, 58% White, 24% Hispanic, 14% African-American, pop. 704996, 60% White, 24% Hispanic, 12% African-American): The district looks normal, the Hispanic percentage doubles, the African-American percentage triples.

FL-23 (Incumbent Alcee Hastings [D], pop. 704982, 49% African-American, 32% White, 16% Hispanic pop. 704959, 47% African-American, 33% White, 17% Hispanic): Travelogue time. The district starts in Hollywood, goes north to Fort Lauderdale, Deerfield Beach, Delray Beach, Boynton Beach, then west, then north, then east, then there’s West Palm Beach, then a bunch of underpopulated large tracts are included, along with Fort Pierce and Okeechobee.

FL-24 (No Incumbent, maybe, Pop. 704976, 74% White, 12% Hispanic, 11% African-American): This was the northern part of the unallocated lands covered by FL-12. If Dennis Ross is the next Rep in FL-12, then this would be his district.

FL-25 (Incumbent John Mica [R], Pop. 704957, 70% White, 17% Hispanic, 8% African-American): This district is a lot more Hispanic than Mica’s current district, and I think it includes a lot of the current FL-24.

FL-26 (Incumbent Mario Diaz-Balart [R], Pop. 704957, 60% Hispanic, 35% White): The only huge difference is that the African-American population dropped from 10% to 3% as unincorporated Miami-Dade (West Perrine) was put in FL-18. The district gains Naples, drops Homestead, gains some areas that were in FL-21.

In this first attempt of a map, several things occur.

1) Alan Grayson’s electoral hopes are probably improved and he won’t run up as much mileage going from event to event.

2) FL-3 is the target of several lawsuits.

3) FL-21 is the target of several lawsuits.

4) FL-22 is made bluer, FL-10 is made bluer, and FL-6 is confused.

So. Any thoughts at this first attempt at a map?