Georgia on my Mind (redistricting)

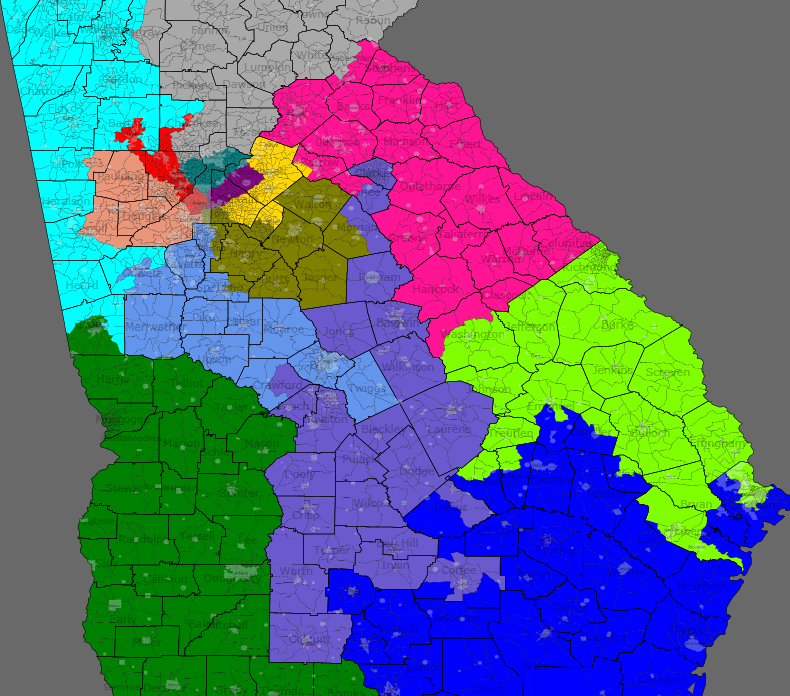
The following is a bit of a thought experiment. Imagine a Democratic Gerrymander of Georgia that could more or less ignore the VRA, or at least go with the standard of “majority minority” rather than striving for 50%+ Black.  I used Dave’s Redistricting App, with the new population estimates, creating 14 districts.  I was not as aggressive as fitchfan28 and focused my efforts on the Atlanta area leaving South Georgia largely unchanged.

District 1 (Dark Blue):

Not much different from before. Jack “Pelosi is destroying families by making us work Mondays” Kingston will have no trouble here.

District 2 (Dark Green):

Also not much change.  Sanford Bishop’s district continues to be racially mixed, with a narrow White majority.  Perfect for a Black Blue Dog.

District 3 (Salmon):

First of several of the majority minority districts. Southern parts of Fulton County balance out some more conservative suburbs.  Contains some of the Black suburbs as well.

District 4 (Red):

Heart of Atlanta and much of Cobb county.  At little more White than some of the others, but still not a majority.

District 5 (Purple):

The most diverse of all the districts.  Large populations of Whites, Blacks, Hispanics and Asians.

District 6 (Aquamarine):

This district is about 2/3rds White.  It might be more Liberal, being located largely in Fulton and Dekalb counties, it might not be.  I didn’t have political data.  (Anyone familiar with Georgia care to comment?)

District 7 (Gold):

A fairly equal mix of Whites from  and Blacks. Some other minorities, but not as many as the 5th.

District 8 (Light Purple):

I took away Macon, but made it up with Athens.  Only after I drew the lines did I realize that Jim Marshall lives in Macon and may choose to run in the new 13th.  The district is just over 60% White, so there’s enough minorities and Liberals (in Clark County) the Dems might do okay.

District 9 (Cyan):

Very Conservative and White.

District 10 (Pink):

See district 9.

District 11 (Grey):

Conservative Atlanta Exurbs and North Georgia district.  Would be a good landing spot for Tom Pierce, if the 6th is too urbanized now.

District 12 (Light Green):

Not too different from the old 12th, though a little bit blacker. (Now Majority Minority)

District 13 (Periwinkle):

Whites are just under to a majority in this rural and exurban district.

District 14 (Mustard):

Another majority minority district with whites and blacks in close numbers.

Overall, 6 minority districts, which should all go to the Dems, plus Bishop’s Second, which is an easy hold.  The new 8th will be a bit of a struggle but doable and potential pickup in the 6th, depending on how the numbers run.  So a total of 7 – 9 districts out of 14, without any aggressive Gerrymandering.

Redistricting MO with Dave’s redistricting App

This time, we’ve got an internet application to play with.

The task of dividing Missouri into 8 districts with the population estimates is still a nightmare.

When it comes down to it, the best possible deal for an 8 district map is a 4/4 delegation split. Best possible, without a gerrymander. Currently the delegation is 5 Republicans/4 Democrats.

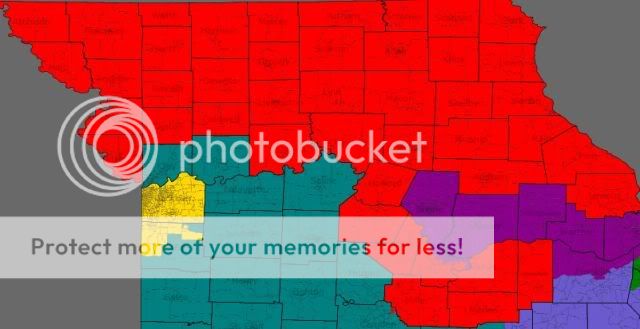
With all the momentum of under two hours of work, here’s an attempt to split the state into 8 districts with a 4/4 split.

First, the STL districts.

The 1st district (Blue): 738926 people, 45% white, 49% African-American

The 2nd district (Green): 738908 people

The 1st district walks a balance between helping the 2nd, and also keeping the legislators in that area happy enough to actually approve such a map. The 1st moves west into Maryland Heights and south in the city of St. Louis. Ideally, the district would still go 2 to 1 for Democrats, at the very least. A drop from 3 to 1, but still a good solid district. Here’s a before/after of the lines. Most of the tracts moving from the 1st to 2nd were coincidences from the tractpoking that was done to form the district.

The 2nd district includes the homes of Todd Akin and Russ Carnahan. The district also includes a chunk of Akin’s STL county district (except for Chesterfield). As well, a part of Jefferson County, and Russ’ South County district are in the district unsplit. Ideally the district would be 50/50.

As for the third district (pop. 738910)

Officially, this district is open. It combines Boone County, one of the emerging Democratic votegetting counties, with the rapidly blueing St. Charles county. Along with the I70 corridor and some other counties in the area.

Cole County is split with Jeff City in the 3rd and the rest of the county in the new 4th district. Franklin County’s split puts the northern part of the county in the 3rd and the southern in the 8th.

As for the 4th district.. it’s a sign of the ridiculous nature of the 4th that you can’t fit it into an image on the minimum zoom.

Yes, really. The realities of the corridor district kind of makes this district ridiculous. As well, Sam Graves and Blaine Luetkemeyer both live in this district. The population in the new 4th is 738858. The only split in it not already covered is two tracts in Camden County near Osage Beach (which are in the 9th district, instead of the 4th). Unfortunately for candidates, this district is huge, covers multiple TV markets. As well, we can only break it down by region. Buchanan and Platte should be Dem friendly, the Northwest Corner is more Republican, North Central Missouri is a fusion of co-ops and Republican voting, the Northeast corner of Missouri could be a good Dem area. The Northeast part of the district between Kirksville and Moberly could also produce a good showing for Dems. But a lot of this depends on who the candidates are, and if they’re great at exhaustive campaigning. 44 counties in one Congressional district might be a record for this state.

The 5th district (pop. 739048) is slightly more compact.

The temptation to put some of the Republican parts of Jackson County somewhere else is still there. But when the county is 60/40 blue, then it’s not a huge pain to have to put up with parts of EJC, or with Cass County. Cass County kind of got cut up in the quest to get within 100 of the ideal district population.

As for the 6th district (pop. 738852), it’ll be more competitive when it’s opened up by retirement. But it’s a challenge.

The district obviously adds Clay County. It loses a sliver of Jackson County, along with Webster County and parts of Cass County. The district also gains ground in Polk, Camden and Phelps Counties. Ideally, the combination of traditionally Democratic areas in West Central Missouri and Clay County could outmuscle the traditionally Republican lean of the rest of the district.

My apologies to Phelps Countians for the splitting of their county.

The 4th and 6th could switch numbers on this map so that Ike Skelton is the incumbent in the 4th, Sam Graves is the incumbent in the 6th, and they won’t have to order cards with new district numbers on them.

As for the 7th (pop. 738989).. it is what you think it is

It picks up the rest of Taney County, Webster County, a tract in Wright county, and Ozark County. It loses part of Polk County. It’s still very Republican.

How about the 8th district (pop. 739114)?

The eighth loses it’s portion of Taney County, loses part of Phelps and Wright counties, loses Ozark County. It picks up Southern Franklin and Southern Jefferson Counties, along with Crawford and Ste. Genevieve counties. As to how the 8th splits when a non-Emerson is on the ballot, i’m not particularly sure. But when the two biggest counties in the 8th are strong Republican (Cape and Butler), then that’s a lot of votes to start with.

When it comes to redistricting, barring a great compromise, the map will be drawn or approved by a panel of Federal Judges. But the Republican plan will be closer to 6/2 if they act as how they usually act. They’ll keep the 4th as is and wait. They’ll put Southern Clay County in the 5th. They’ll stack Democrats in the 1st. Russ Carnahan’s house will end up in a Republican 2nd or the 8th.

Basically.. redistricting will be very unpleasant this year unless something unexpected occurs.

But until we get the real numbers, we’re left to mess with an online application in an attempt to see how many counties can fit into one Congressional district. When the real numbers come out, then the computers hidden in the basement of the Capital will be put to work with all the electoral and socioeconomic stats to form the ‘perfect map’

Which will then be exposed within several cycles.

But it’s raining in the KC area. So why not have a diversion for a bit?

Redistricting GA with Dave’s Redistricting App

This is my Democratically friendly redistricting plan for GA, assuming Democrats are able to win back both the Governor and the State House. Basically what I did was recreate a lot of what the GA Democrats in the legislature did in the 2002 redistricting while compensating for population growth. The end result is what appears to be a 7-7 delegation but unfortunately I cannot seem to place 22 thousand people who are somewhere on my map unaccounted for but for a state of 10 million I think that’s alright for now. Further analysis below the jump.

North GA:


Middle GA:


South GA:


Metro Atlanta:


1st district:

Nearly 71 percent white, contains much of what it does now but takes in a good bit of GOP friendly territory in South Central GA and in order to shore up Barrow’s district loses Democratically friendly Liberty county to Barrow’s new district the 14th (basically the 12th from 2002-05).

2nd district:

Majority minority district in SW GA very similar to what it is now but takes a little friendly Democratic territory from the 3rd and 1st that wasn’t doing those Republicans any good.

3rd district:

A Republican district in Central/ South GA that stretches beyond the metro ATL boundaries in existence now to take in Republican areas of the 2nd and 8th as well as packing in Republicans in south Metro ATL to help out Marshall.

4th District:

Pretty similar to what we see now, dominated by Dekalb yet taking in some white GOP areas of SE Gwinnett to help out the newly Democratically friendly 7th district. Majority black but not as much as the current 4th.

5th District:

Majority black, yet like the 4th gentrification efforts are somewhat cutting down the margins once seen here as well but the new voters moving in are similarly friendly to Democrats. May elect a white Representative in a decade or less but very safe for John Lewis (D-Atlanta).

6th District:

As much as I wanted to mess with Tom “Obama hates bailout bankers” Price I decided to just shore up his GOP friendly north Metro Atlanta district. Close to 74 percent white and basically taking in all his familiar Ned Flander’s territory.

7th District:

This and the 14th are probably my most ambitious districts. Only 41.6 percent white making this now longer Linder territory. This would be a new open seat with significant numbers of blacks (33 percent) and also Hispanics and Asians (collectively equaling around 23 percent). This might seem unfeasible but eventually these growing minority groups in Gwinnett will be placed in a Democratic district.

8th District:

Oh man this would drive Republicans wanting to get rid of Marshall crazy. Only 50.5 white (this area of South Metro ATL is becoming much more minority concentrated). Some touch point continuity going on here but it had to be done to reach down into the black belt around Columbus and to connect the Metro and Middle GA parts of the district.

9th District:

Pretty much the same as before yet a tad bit whiter and more GOP friendly. I did by giving Barrow’s 14th highly Hispanic areas in downtown Gainesville. I think both Representatives in the 9th and 14th would appreciate this as this area will eventually be competitive for Democrats as the Hispanic population increases. Also had to give some territory to the 10th which is not growing as fast and without Athens needed some more territory.

10th District:

Basically take everything Democrats hate about the current 10th, 12th and to a lesser extent the 8th and put them into this district and voila, you’ve got yourself a very safe GOP district for Paul Broun. Takes out NE GA to give to the new 9th representative and most importantly gives Athens back to John Barrow in the 14th.

11th District:

Due to popular demand, a Cobb County resident will no longer represent NW GA as these areas are very different (metro versus rural). As far as making this any more Democratically friendly though that’s a negative as this district takes in basically half of west GA. My most contiguous district with no tentacles so enjoy you good government folks!

12th District:

Probably where Linder would wind up (this could be the 7th for all I care), 66 percent white, dominated by north Gwinnett and western Cobb county as well as fast growing South Forsyth county.

13th District:

A higher black percentage than today (49 percent versus 41 percent) this district is probably too safe and could stand to trade a little more territory with the new Democratic 7th but I am sure this would make David Scott happy.

14th district:

I probably messed up by making this district majority minority (46.4 percent white) but with the current white percentage at 52% that is easy to do. However, with a little more careful work this district could be majority white again by taking out the Hispanic majority precincts in Gainesville which was probably a result of my overly ambitious efforts.

Well that’s it. I am sure this wouldn’t pass mustard as is but a look at what could be if Democrats gained some major ground in 2010.

Thoughts? Questions? Sorry for the formatting errors.

Redistricting New Jersey with Dave’s App

So, Dave’s redistricting app now supports New Jersey. Keeping in mind that no political data is available, I stuck to the current district lines as much as possible. The biggest changes are in north and central Jersey, which had to lose a district. Merged are the two GOP members from the old 11th and 7th. Now both can attempt to run in the new 7th.

The old 13th was renumbered 11, and retains a healthy hispanic plurality (if not quite majority). The Black majority of the 10th is also protected.

With the exception of Rush Holt, who may have a slightly more difficult district (with some more work I may have been able to avoid this), I believe that the entire Democratic delegation is protected.  

North Jersey:

Image Hosted by ImageShack.us

Newark:

Image Hosted by ImageShack.us

Central Jersey:

Image Hosted by ImageShack.us

South Jersey:

Image Hosted by ImageShack.us

This is all supposedly based on 2008 estimates, but I think Dave would have to tell you exactly how he aggregated the numbers.

Redistricting Michigan: Take 2

Lately there has been a lot of Debate over the number of Democratic Congressional Districts that Democrats could gerrymander out of the state of Michigan if they had complete control (right now they hold the Governorship and State House.  They stand a good chance at taking control of the State Senate while the Governor’s race is a tossup).  A few people, namely IHateBush, have said that it is possible to succesfully draw a map that would yield 12 Democratic seats and only 2 Republican seats.  I’ve been trying for several weeks to draw a 12-2 map, meanwhile protecting endangered incumbents (specifically Schauer) and I’ve determined that a 12-2 map would be far overeaching and in a neutral or Republican leaning year might end up 9-5 or worse. I think the best Michigan Democrats could do is create 11 safe or Democrat leaning districts and 3 strongly Republican districts.  I’ve drawn a map that I think does just that, although I still am not entirely confident that we could hold both of my “Thumb” districts in a Republican year.  But without further ado, here’s my map.

District 1 (Bart Stupak D):  Since this is my home district, and I couldn’t face the specter of Tom Casperson or some other Republican becoming my Congressman when Bart Stupak retires, I’ve gone to pretty great lengths to make this one safer.  I added the remainder of Bay County, Isabella County (home to CMU) Clare County, and Roscommon County, all counties that President Obama won.  I took out the Republican leaning counties of Charlevoix, Antrim, Crawford, Oscoda, Otsego, and Montmorency.  Overall Obama’s performance in this district goes from about 50% to about 53%.

District 2 (Vern Ehlers R) this is probably the most gerrymandered looking of all of my new districts, but it has to be if we are going to have a Democrat leaning district in Western Michigan.  It takes in the Dem leaning Counties of Leelanau, Benzie, Manistee, Lake, Mason, and Oceana along the Lake Michigan shore, the Strongly Democratic County of Muskegon, and then tentacles into Kent County and picks up the cities of Grand Rapids, Kentwood, East Grand Rapids, and Wyoming.  Barack Obama won this district 57.2-41.1 giving it a nice, healthy PVI of D+4.3. Vern Ehlers likely would not be reelected to this district.

District 3 (Fred Upton R + TBD [successor to Pete Hoekstra] R) I’ve combined the old 2nd and 6th districts to form this heavily Republican District.  It takes in Ottawa, Allegan, Van Buren, Northern Berrien, and suburban Kent Counties.  Whoever succeeds Pete Hoekstra next year would probably be favored in a Primary against Upton, who is somewhat too moderate for this very conservative district.

District 4 (Dave Camp R) another one of my heavily Republican districts, this one takes in some of the rural and conservative Counties in Northern and Central Lower Peninsula, but it is based in Midland and Traverse City (Grand Traverse County) Barack Obama only won 2 counties in this new district, Gratiot and Clinton.  Dave Camp’s home in Midland is preserved in the new 4th.

District 5 (Open, leans D)  The new 5th district is the one that I would be least confident of us holding in a Republican year, but still in a neutral year it favors us. It has a PVI of about D+2-3 and it includes the Democratic County of Saginaw, about 2/3 of staunchly Democratic Genesee county (minus the city of flint) the Dem leaning Shiawassee County, sparsely populated Republican Counties in “the Thumb” and Tossup St. Clair County. Luckily former Democratic Congressman James Barcia’s home in Bay City is not in this district, for we really could get a more progressive Congressperson from this district. (State Sen. John Gleason, perhaps?)

District 6 (Mark Schauer D) I increased the Democratic performance in this district by drawing strongly Democratic Kalamazoo County out of Upton’s district and into this one.  I also added tossup county Cass and the Democrat leaning portions of Berrien County.  I took out Jackson and Lenawee County as well as the portion of Washtenaw that was in this district.

District 7 (Open, Democrat) It’s high time that Lansing is put into a Democratic district again, and that’s just what I’ve done.  This new district is L shaped and contains Ingham, Jackson, Hillsdale, Lenawee, and Monroe Counties.  Barack Obama won all these counties, except Hillsdale. Obama won the district 56.4-41.9 giving it a 2008 PVI of D+3.5.  If I had to guess what Democrat might win this district, I’d say State Rep. Barb Byrum (daughter of 2000 candidate Diane Byrum), State Sen. Gretchen Whitmer (distinction of being the “most liberal” Senator), or Lansing mayor and Former state Senator Virg Bernero.

District 8 (Gary Peters D) I’ve made this one a bit more Democratic by removing the cities of Rochester and Troy while adding Berkley, Southfield, and the rest of Waterford Township.  Removing the city of Troy also removes a potential future challenger to Peters, State Rep. Marty Knollenberg (son of Joe Knollenberg).  This district should be safe for Peters or a future Democrat if he runs for higher office.

District 9 (Candice Miller R + Dale Kildee D)  In 2002, Republicans drew David Bonior’s (D) Congressional District http://factfinder.census.gov/s… much more Republican, forcing him to retire or face certain defeat at the hands of their preffered candidate, Secretary of State Candice Miller.  It’s payback time.  I’ve drawn the most Democratic parts of Macomb County, including Miller’s home, into a district with exurban Republican Lapeer County, as well as the 90-10 Obama city of Flint, and other staunchly Democratic portions of Genesse County.  This includes Dale Kildee’s home, but he’ll be in his eightees by 2012 so he probably won’t be the one running against Miller, if Miller runs at all.

District 10 (Mike Rogers R) The last Republican district that I drew, the 10th includes fast growing and largely Republican Livingston County (home to Mike Rogers), Northern and Western Oakland County, and Shelby township in Macomb County. I considered drawing Livonia (Thad McCotter’s home) into this district as well, but I don’t want there to be any chance that he returns to Congress

District 11 (Sander Levin D) This distric largely reverts to it’s pre-2002 boundaries.  It now would contain all of Sterling Heights, Warren, Troy, Clawson, and Royal Oak, along with the most Democratic south Oakland Suburbs.  This district would be safe for Levin’s successor (hopefully state Rep. Ellen Cogen Lipton).

District 12 (Carolyn Cheeks Kilpatrict D) Doesn’t change much except that it moves farther south and includes all of Dearborn.  It’s still majority African American and very strongly Democrat.  The only problem with the configuration of this district is that John Dingell lives in Dearborn.  If he is still serving in 2012 (which I doubt) a tendril can be drawn from the 14th District to pick up his home so that he wouldn’t be drawn into Kilpatrick’s district.

District 13 (John Conyers D + Thad McCotter R) Contains all of Northern Detroit and also reaches all the was west to include Redford Township, Livonia, Northville and Plymouth.  There’s no way Thad McCotter could win this majority African American Detroit District.  Safe for Conyers and his successors.

District 14 (Open D) This one looks very much like Lynn River’s old district http://factfinder.census.gov/l… and would probably elect an Ann Arbor Democrat (State Sen. Liz Brater, fmr. State Rep. Chris Kolb, who would be the first openly gay congressman from Michigan, or maybe even Rivers if she wants to get back into politics.) Also includes a large portion of Suburban Wayne County taking in the Democratic cities of Canton and Westland. If John Dingell is still serving and runs for re-election in 2012, then a tendril will have to be drawn to include his home in Dearborn, but when he finally retires it will probably elect someone more progressive.  Obama won this district 64.5-32.6.

What does everyone think of my map? Suggestions, corrections, questions, comments? I want to hear them.

Redistricting 2011: Oklahoma & Wisconsin

This is now Episode 12 of my seemingly never-ending redistricting series. (In reality, it has a definite end — after this diary, there are only 9 states I’m planning to address: California, Washington, New Mexico, Maryland, West Virginia, Virginia, North Carolina, Kansas, and Tennessee. The other 15 states are either at-large states, or are unlikely to see substantive boundary changes.)

Today comes Oklahoma and Wisconsin. I struggled with whether to include Oklahoma at all, since my Oklahoma effort is barely different from the current map. But given the fluid partisan dynamics in Sooner State politics, and the potential issue over how to handle the “conservative Democratic” 2nd District, I thought it might be worth a look. On the other hand, I drew two maps for Wisconsin based on the highly changeable atmosphere in that state’s 2010 elections.

Previous efforts:

Diary 1: Massachusetts and Texas

Diary 2: Michigan and Nevada

Diary 3: Iowa and Ohio

Diary 4: Georgia and New Jersey

Diary 5: Florida and Louisiana

Diary 6: Pennsylvania and Utah

Diary 7: Illinois and South Carolina

Diary 8: Indiana, Missouri, and Oregon

Diary 9: Alabama, Arizona, and Kentucky

Diary 10: Colorado and Minnesota

Diary 11: Mississippi and New York

Hark, to the extended text!

Oklahoma

In a few short years, the legislature has gone from an eye-poppingly enduring history of Democratic reign as of 2004 to full GOP takeover by 2008. The governor’s mansion will be open in 2010 as popular Democratic Gov. Brad Henry is term-limited. Fortunately, the Democrats have two strong candidates to retain that office, but Republicans are still even odds at worst for a pickup. So what would GOP control of redistricting mean in 2011? There is only one Democrat in the delegation, the rebellious Dan Boren of the rural (and Native American-heavy) 2nd District. But my gamble is that, even with Republican control, district lines will only be adjusted, and no real effort will be made to dismantle Boren’s territory.

I can’t say my confidence in this prediction is exceedingly high, but look at the signs: even though Tom Coburn won this heavily evangelical, highly socially conservative district for the Republicans as recently as the late 1990s, the GOP has made no effort to target the seat, even when it was open in 2004 (their sacrificial lamb back then lost to Boren 66-34%, and Boren’s two reelections have both topped 70%). Considering Boren racks up urban New England-like Democratic margins in a district that broke 2-to-1 for McCain, and that Oklahoma redistricting has historically revolved around the preservation of culturally cohesive regions, it would seem a dangerous overreach for the GOP to aim its fire at Boren at the risk of softening up less conservative turf around Tulsa and Oklahoma City. Other than completely breaking the traditional boundaries around Eastern Oklahoma, how would they crack his constituency, anyway? And how much worse would it be for Boren to compete for votes in Tulsa than to compete for them in Little Dixie?

So that’s my gamble. And as a result, the differences between this map and the current one are scarcely visible:

Photobucket

There’s not much to even describe here, except that the Oklahoma City-based 5th is contracting in area as the two most rural districts (especially the 3rd) expand.

Wisconsin

As in neighboring Minnesota, circumstances of state politics pushed me to draw two possible maps for America’s Dairyland. The Democrats currently enjoy a redistricting monopoly here, but a tenuous one, with a narrow 52-47 edge in the Assembly, 18-15 in the Senate, and a controversial governor in Jim Doyle. Given the high possibility/probability that any one of these pillars of state power could flip to the Republicans in 2010 (the most likely loss being the governor’s mansion, Doyle’s approval rating hovering in the 30s), it seemed logical to draw a bipartisan compromise map to accompany a hypothetical Democratic gerrymander. Since it would be an incredible feat for the GOP to pick up all three levers in one election cycle, I thought it unnecessary to draw a Republican gerrymander map.

Democratic gerrymander first: this map creates two or three solid Democratic seats, just one solid Republican seat, and as many as five swing seats, all of which would have voted for Obama. Most importantly, it concentrates GOP areas in the 5th and pits two veteran Republican incumbents, Tom Petri of Fond du Lac and Jim Sensenbrenner of Menomonee Falls, against each other. Petri’s 6th is then opened up for Democratic poaching, as is Paul Ryan’s 1st south of Milwaukee. It’s possible Petri could move north and run for the 6th, but when he retired, this iteration would be a prime pickup opportunity. Meanwhile, all five Democratic incumbents are kept about as solid as they were (Kagen gets a very slight boost, though none are pointedly shored up). In toto, a good year under this map might produce a 7-1 Democratic majority; an average year would result in 6-2, and a bad year might retain the standing 5-3 edge, either with the status quo remaining, or with Kagen’s seat traded for Ryan’s.

Photobucket

District 1 – Paul Ryan (R-Janesville) — with all of Kenosha and Racine Counties along with 36% of Milwaukee County, Ryan would face his first truly difficult race in 2012 under these lines (though many think he’ll bail for a gubernatorial try in 2010), and as an open seat this district would be likely to elect a moderate suburban Democrat.

District 2 – Tammy Baldwin (D-Madison) — made only slightly less Democratic to help Dems in the 1st and 3rd.

District 3 – Ron Kind (D-La Crosse) — still somewhat Dem-leaning, as before. The three Dem seats in small town Wisconsin (Kind, Kagen, and Obey) are all only modest Obama districts, but seem to be a bit stronger for their incumbents.

District 4 – Gwen Moore (D-Milwaukee) — the other 64% of Milwaukee, plus 24% of GOP-friendly Waukesha County; a strong urban Rust Belt Democratic seat.

District 5 – Jim Sensenbrenner (R-Menomonee Falls) vs. Tom Petri (R-Fond du Lac) — geography would seem to favor former Judiciary Chairman Sensenbrenner, and Petri might choose to move north in this scenario, but muddying the waters was clearly my goal. This packs Republican votes as well as can be expected anywhere in Wisconsin.

District 6 (open) — without Petri, this would be a fairly good shot to elect a Democrat, with Obama having performed somewhere in the neighborhood of 51-53%. But much like the current 6th, if Petri ran, it would be on loan to the GOP until his retirement.

District 7 – Dave Obey (D-Wausau) — as chairman of the Appropriations Committee, Obey obviously has nothing to worry about, though Democrats have long noted the fairly marginal nature of the 7th. When he does retire, this will still probably be a somewhat Dem-leaning/Obama-friendly rural seat, but a slam dunk? No.

District 8 – Steve Kagen (D-Appleton) — I only had minimal room to strengthen his district, since most rural Wisconsin counties are competitively balanced, but made the necessary trades to up his chances a bit.

Now the bipartisan compromise map: this adhered to clean, simple, aesthetic district lines and made superficial efforts to help incumbents without going out of its way to do so. The reason I didn’t make an aggressive “incumbent protection” map is that the current lines are fairly incumbent-friendly, especially as Democratic strength has increased in the once-Republican 8th. So my primary goal for this scenario was pretty boundaries, with a dash of Petri, Ryan, and Kagen protection thrown in (for Petri, I had no concerns about his ability to be reelected, but rather about the GOP’s chances of holding the open seat). Needless to say, I’d rather see the Democrats retain control, but at least this map appeases my “good government” instincts.

Photobucket

SSP Daily Digest: 5/19

AL-07: Former Selma Mayor James Perkins (who was defeated in his attempt to seek a third term in 2008) is jumping into the open seat race here. He is likely to draw support away from Terri Sewell, Artur Davis’s preferred successor, also a Selma native.

AL-Gov: Speaking of good ol’ Artur, he’s released an internal poll which shows him up 56-26 over Ron Sparks and 54-25 over Sue Bell in the Dem primary. He also purports to lead Republican Bradley Byrne by a 43-38 margin. I’m finding it hard to believe that a congressman has such high name rec (59-6 for Davis among Dems statewide!). But the best checksum: This survey has Obama’s favorables at 58%. Last month, SUSA had them at just 48%. Which do you think is more likely? In other AL-Gov news, state Sen. Roger Bedford (D) says he won’t run.

IA-Gov: State Auditor David Vaudt, one of only two Republicans holding statewide office in Iowa, has declined to challenge incumbent Gov. Chet Culver next year.

NC-Sen: Both Reps. Bob Etheridge and Mike McIntyre are leaving the door open to a Senate bid, with McIntyre sounding more enthused. Meanwhile, Lt. Gov. Walter Dalton is “not considering” the race, Raleigh Mayor Charles Meeker is “not looking at running,” and state Rep. Grier Martin claims his “decision to decline a chance to run against Elizabeth Dole was also not to run in 2010.”

NV-Gov: Jim Gibbons’ poll numbers are just horrendous – in a new Mason-Dixon survey for the Las Vegas Review-Journal, 54% say they would “definitely vote to replace” him. Gibbons’ campaign manager claims things are lookin’ up, because his boss’s approvals were 25-69 in a January Reno Gazette poll but are an awesome 17-52 in this one.

NV-Sen: Meanwhile, the same poll finds pretty lousy numbers for Harry Reid as well, but better than Gibbons’. Reid gets 45% “definitely replace,” but his approvals are “only” 38-50. The big difference, of course, is that the GOP doesn’t really have any strong candidates to challenge Reid, while plenty of folks are lining up to take a whack at Gibbons.

FL-CFO: Checking in with an old friend, it looks like Annette Taddeo is considering a run to replace Alex Sink as Florida’s Chief Financial Officer.

Redistricting: CQ has a story on five key races that could affect congressional redistricting. Roll Call has published the second half of its two-part series on the same subject (part one here). And finally, the National Conference of State Legislatures is holding the first in a series of training seminars on redistricting in San Francisco, June 11-14.

SSP Daily Digest: 5/18

NY-Sen-B: Steve Israel might have backed down from a primary challenge to appointed Senator Kirsten Gillibrand, thanks to last Friday’s iron-fist-in-a-velvet-glove moment from Barack Obama… but fellow Rep. Carolyn Maloney isn’t cowed. “I respect the choices that every member makes about their future. Steve Israel’s decision to not run for the U.S. Senate was his choice to make, but it doesn’t affect my decision-making process,” says Maloney. She has reportedly told colleagues of her plans to run, but nothing is official yet.

KY-Sen: Mitch McConnell was tap-dancing like crazy when Chris Wallace asked him point blank on Fox News Sunday whether or not he endorsed Jim Bunning for re-election, restating endless variations on the theme that the race is unfolding and it’s not clear who the players are yet.

CT-Sen: Another random primary challenger to Chris Dodd has surfaced: Merrick Alpert, a former Air Force officer, aide to Al Gore, and software company executive. Although his online statement about his candidacy attacked Dodd’s “corporate campaign contributors,” Merrick’s previous track record in the leadership of Democratic Leadership for the 21st Century (or DL21C for short), a group for centrist pro-business young Democrats, suggests he may be running to Dodd’s right.

WV-Sen: Best wishes to 91-year-old Sen. Robert Byrd, who was hospitalized over the weekend as a “precautionary measure” after he developed a fever from a minor infection.

NY-Gov: Tom Golisano, wealthy gadfly who lost three gubernatorial runs on the Independence Party line, will not be running in 2010, despite some speculation he might run for the GOP nod this time. He’s changing his legal residence from New York to Florida, saying he wants to avoid New York’s high taxes.

ID-Gov: Weirdo conservative Rex Rammell, who spend a lot his own money to run as an Independent in last year’s Idaho Senate race because of his disdain for Jim Risch (and ultimately had little impact on the race), has caught the political bug and been casting about for a new race. After considering primarying Rep. Mike Simpson in ID-02, he’s now planning to run in the 2010 Governor’s race. He seems to think current Gov. Butch Otter will retire after only one term (although he freely admits, “I could be totally wrong”).

Redistricting: Roll Call has an interesting piece detailing organizational steps the Democrats are undertaking for the 2010-12 redistricting process. Apparently many felt caught flat-footed for the 2000 round of redistricting, and are wisely revving up years in advance this time.

Redistricting North Carolina

(From the diaries – promoted by DavidNYC)

So you all know the drill by now – take some VTDs, consolidate them to reflect updated population stats, then piece them together. I couldn’t think of a witty title today either. Oh well.

My goals for North Carolina were to:

  • strengthen Kissell (8th) and Shuler (11th)
  • draw Foxx (5th) out of her district
  • obey the VRA – that is, a majority-black district for Butterfield (1st) and a majority-minority district for Watt (12th)
  • maintain percentages for the other Democrats: Etheridge (2nd), Price (4th), McIntyre (7th), and Miller (13th)
  • get rid of that touch-point continuity in Guilford County between the 6th (Coble) and the 13th

Update: Many of you have correctly pointed out that NC may be gaining a 14th seat. There’s a plan for that in the works too.

Here’s the new map (yes, everything is contiguous!):

So here are two useful pieces of info that I had:

Here’s average Democratic performance, by consolidated VTD, across 10 contests (US President, US Senate, Governor, Lieutenant Governor, State Treasurer, State Auditor, Commissioners of Agriculture, Insurance, and Labor, and State Superintendent of Education). Average performance in 2008 was 51% Democratic.

Here’s also a map of the minority population of each VTD:

Stats here are: Population, Black Population, Latino Population, Average Democratic and Republican performance, Obama%, McCain%, the number of Democratic and Republican VTDs. SQL is getting angry at me for putting too much data in, so if you want the county breakdown, you’ll have to look here.

So district-by-district:


01 708,845 354,742 22,994 66.73% 32.51% 62.03% 37.50% 260 43

One of the hardest districts I’ve had to draw. The problem is, with NC’s population growth, each district has to contain more people. Additionally, the majority-minority areas of Northeastern NC have also lost population. Thus, the far reaching tentacles that hit so many counties, including Pitt (Greenville), Lenoir (Kinston), Wayne (Goldsboro), Wilson, Nash (Rocky Mount), Beaufort (Washington), and the list goes on. I like to think of this as the Petey Pablo district (listen to ‘Raise Up’ if you have any questions.) As you can see, we barely cross the threshold at 50.04% African-American. Average Democratic performance is 66.7% – Butterfield’s not in any danger. Obama and Hagan underperformed at 62.0% and 64.5% respectively; Bev Perdue crusied here with 69.3%.


02 708,383 203,577 51,146 54.85% 43.96% 51.35% 47.92% 76 50

Bob Etheridge’s district has never been that Democratic on a presidential level – Obama winning was a big surprise – but still quite Democratic on a local level. This district reflects that reality as well, but shifted somewhat further south. Etheridge’s home in Lillington (Harnett County) isn’t moved, and Harnett and Lee Counties remain in this district entirely. A large chunk of Republican leaning Johnston County is cut out in the north, replaced by Anson, Hoke, and Richmond counties along the SC border. Instead of anchoring Democratic performance in Raleigh, an updated 2nd finds its strength in Fayetteville.  Average Democratic performance is 54.9%. Obama got 51.4%, Hagan 54.9% and Perdue 55.0%.


03 709,086 103,074 34,867 41.25% 57.37% 36.01% 63.15% 33 173

This district contains 33 Democratic precincts, which in my mind is 33 too many. However, the 3rd has to accommodate all the parts that would dilute the minority-concentrated 1st district too much, and many of those urban precincts do lean left. This is most evident in Pitt County, where average Democratic performance was 49%. Given the polarized voting often evident in the South though, the rest of this district scores 41.3% overall. Obama severely underperformed, getting 36%.  Hagan and Perdue did better, getting 40% and 47% respectively. This has potential, but it simply isn’t possible to satisfy the VRA and make this district Democratic at the same time.


07 708,733 176,916 29,459 54.74% 43.74% 49.71% 49.46% 128 69

Mike McIntyre’s district is pretty much like Etheridge’s, more Democratic at the local level than nationally. This district stays with Wilmington and Lumberton, along with a part of Fayetteville not in the 2nd. This district really doesn’t change all that much, other than some traded precincts with the 3rd to make this more Democratic. Obama nudged out a win with 49.7%, 5 points below the average of 54.7%. Hagan and Perdue both did well here at 55.4% and 56.4% respectively.


04 709,502 168,493 37,358 59.17% 39.34% 60.65% 38.43% 99 59

David Price, we seem to forget, actually lost in the Republican tide of 1994 before reclaiming his district in 1996. The Triangle, of course, has changed quite a bit since then. This district remains centered on Durham and Chapel Hill (52% of the population), with some Republican-leaning sections of Wake County thrown in for another 22%. This district does expand eastward to grab some rural areas that couldn’t fit into the first 3 districts, but Price need not be concerned. It’s 59% Democratic, but this is one of those districts where Obama overperformed (60.7%). A 60.6% showing for Hagan is a testament to the Democratic nature of this district; Perdue did underperform at 57.1%.


13 708,616 153,464 41,474 57.07% 41.40% 59.86% 39.17% 83 32

Even in the most gerrymandered of states, you still have some examples of compactness. This is this map’s token compact district, if you will. It consists of Wake County only, losing a good chunk of border territory along the Virginia border and an arm into Greensboro (and that touch-point!). It contains all of Raleigh and Cary, along with some suburbs. Another strong Democratic district; average performance is a bit low at 57%, but this is where Obama excelled with 59.9%, an improvement over Brad Miller’s current district, actually.


05 708,588 142,544 30,781 53.80% 44.77% 52.85% 46.21% 130 85

This is the other half of Brad Miller’s district, featuring the Northern border counties – Person, Caswell, Rockingham, and Stokes. That’s not where the population is though, and to compensate, this district has a southern arm that hits parts of Orange, Alamance, Guilford, and Forsyth counties, including significant parts of Greensboro and Winston-Salem not drawn into Mel Watt’s 12th. Virginia Foxx doesn’t even live in this district, and I have a hard time seeing her winning this 53.8% Democratic district. Obama scored a respectable 52.9%, and Perdue 54.0%. Hagan, being from Greensboro, stomped here with 56.4%.


06 708,652 37,671 24,307 33.30% 65.21% 33.11% 65.90% 3 187

All the Republicans in central NC have to go somewhere, and this district is it. I think the packing of Republicans is especially evident, given that there are 3 Democratic precincts out of 190. With the Democrats in Alamance, Guilford, Union, and Mecklenburg drawn into other districts, all the Republicans are left here. At 33.3%, this is the most Republican district in NC on average. Obama scored 33.11%. Hagan did comparatively well at 37.3%, and Perdue absolutely bombed here, netting 29.2%. Sue Myrick may have less incentive to retire now.


12 709,069 306,416 48,281 65.15% 33.77% 65.35% 33.99% 122 58

Mel Watt’s VRA district was significantly easier to draw than Butterfield’s, partially because of the looser requirement. In essence, you have to have the majority-black precincts of Charlotte (Mecklenburg) and the Triad (Greensboro, High Point, and Winston-Salem) along with some connecting precincts. Much like the current 12th, I chose to run this district through Cabarrus, Rowan and Davidson Counties, roughly paralleling I-85. New is an arm into Statesville in Iredell County. In the interest of leaving more high-performing Democratic precincts for the 5th and 8th districts, this district also barely makes the cut at 50.02% minority. Watt’s still in no danger though, at 65.2% Democratic, 65.4% Obama, 66.7% Hagan, and 61.9% Perdue.


08 708,785 163,472 55,333 57.16% 41.60% 58.96% 40.24% 99 58

Larry Kissell gets a significant boost out of this district, though it becomes much more Charlotte-centric. His home in Montgomery County remains, although with a connecting strip through Stanly and Union counties into Mecklenburg. 72.6% of this district is now in Mecklenburg County, which is nice for Kissell since this district’s part of Charlotte was on average 63.3% Democratic (Obama did better at 66.3%). Overall, this makes for a 57.2% Democratic district; Obama did better at 59.0% and Hagan better still at 59.7%. Even Bev Perdue, who underperformed heavily in Charlotte (where Pat McCrory is Mayor) won, eking out a 400-vote win. This, I think, is a testament to the Democratic nature of this district, which should be safe for Kissell.


09 708,310 32,978 22,045 35.74% 62.55% 32.14% 66.53% 14 250

This district sets the stage for a Foxx-Coble showdown. I know the core of Coble’s district is actually in the new 6th, but Sue Myrick lives in the Mecklenburg part. Coble also lives in the Guilford part of this district. Funny how that works. (Foxx lives in the Avery County section.) More of this district is Foxx’s, but Coble’s also actually sane. I’ll leave you to decide how a primary between the two works out. The college town of Boone (Appalachian State) is removed, replaced by an arm into the Republican sections of Greensboro and Alamance County. Again, packing Republicans is at work here, with 14 out of 264 precincts being Democratic for an average of 35.8%. Obama got 32.1% (this is Appalachia, after all); Hagan 38.2%, and Perdue 36.9%.


10 708,675 50,090 26,779 37.10% 61.41% 35.10% 63.89% 15 162

Patrick McHenry’s district doesn’t change too much – he and Heath Shuler trade some precincts in the South to make Shuler’s district more Democratic by removing the vast majority of Republican Henderson County. I had originally wanted to draw a good district for 2008 candidate Daniel Johnson, but another Democratic district in Western NC was simply unrealistic. 15 out of 177 precincts are Democratic, leaving it at 37.1% Democratic, 35.1% Obama, 39.6% Hagan, and 33.0% Perdue.


11 708,808 62,133 17,174 52.09% 46.21% 48.89% 49.78% 120 127

I really tried to get Heath Shuler a district that Obama won, but it simply wasn’t possible without the district hitting Charlotte. Thus, we’re left with an Asheville-centered district that takes all of WNC to the west, and then sprouts two arms. One arm reaches northeast to grab Boone, and the other goes sawtooth along the SC border to get Forest City (Rutherford County), Shelby (Columbus), and finally, Gastonia (Gaston). This makes a 52.1% Democratic district, with Hagan and Perdue overperforming at 52.7% and 52.4% each. Obama came closer, falling 3,000 votes or 0.9% short, at 48.9%.

And there you have it, a 9-4 map of North Carolina. Without the VRA, it would be possible to squeeze at least one more Democrat out, but you can’t have everything. Questions, comments, and witty remarks about what these districts actually look like welcome.

By what margin will Bob Shamansky win?

View Results

Loading ... Loading ...

SSP Daily Digest: 5/15

PA-Sen: It looks like the threat of a primary from the left may be having some of the desired effect on Arlen Specter. He’s engaged in negotiations on a compromise version of EFCA, and said yesterday that “prospects are pretty good” for such a bill (although it remains unclear what exactly would get cut from the bill).

NY-Sen-B: Kirsten Gillibrand will receive an important endorsement tomorrow: from NARAL. This may help solidify Gillibrand’s pro-choice credentials in the face of possible Senate primary challenges from Reps. Steve Israel or Carolyn Maloney.

DE-Sen: Rep. Mike Castle, the one guy who can make the open Delaware Senate race interesting, isn’t promising anything right now. Castle set a decision-making deadline of “the next two months,” though. (Unclear whether that’s two real months or two Mark Kirk months.)

AR-Sen: In the wake of state Senator Kim Hendren’s comments about Chuck Schumer yesterday, a more competent sounding Republican has surfaced to take on Sen. Blanche Lincoln. Curtis Coleman, the CEO of SafeFoods (a “food-safety services company,” whatever that is) and a close friend of Mike Huckabee, announced formation of his exploratory committee this week. Former US Attorney and Rove protege Tim Griffin may also get in; he’s announced a June 1 deadline for deciding.

KY-Sen: Rand Paul, the son of Rep. Ron Paul, moved one step closer to running in the Republican Senate primary (theoretically against Jim Bunning), launching his exploratory committee.

NY-Gov: Observers are noting that Rudy Giuliani is definitely not looking like a candidate for next year’s gubernatorial race. The tipoff is the recent departure of at least three key staff members, including former chief of staff Tony Carbonetti.

MN-Gov: This should be something of a red flag to Tim Pawlenty: 57% of Minnesotans, according to SurveyUSA, don’t want him to run for a third term as Governor. A lost gubernatorial race would basically doom his 2012 presidential aspirations, so this may up the chances of an open seat instead.

KS-Gov: New Democratic Governor Mark Parkinson appointed a new Lt. Gov., Troy Findley. Unfortunately, Findley promptly announced that, like Parkinson, he won’t be running for Governor in 2010, leaving Kansas Democrats with bare shelves in both the open senate and governor’s races.

CA-36: Earlier this week, Marcy Winograd (who got 38% of the vote against Jane Harman in the 2006 Democratic primary) officially kicked off her campaign for a rematch.

Gay marriage: We’re on the precipice of gay marriage in one more state, as New Hampshire Gov. John Lynch confirmed that he was willing to sign it into law. One catch: Lynch wants a slightly different bill, that includes additional language stating that churches aren’t compelled to marry anyone they don’t want. The legislature is expected to move quickly to add the new language.

Demographics: Hispanics and Asians are still the fastest-growing groups in America, but their growth rates have slowed down in recent years as the economic downturn has cut into immigration. In particular, Hispanic growth in the Southeast slowed down. This pushes back projections of when the U.S. becomes a minority-majority country, to the 2040s. In other census news, Orange County, Florida (Orlando) became a minority-majority county in the last year (good news for Alan Grayson as he attempts to hold FL-08).

Redistricting: Utah has an initiative on the table for the 2010 election, proposing an independent redistricting commission (instead of letting the overwhelmingly GOP legislature draw the boundaries). Interestingly, the idea just got a prominent Republican backer: former 11-term Rep. Jim Hansen.