Analyzing Swing States: Colorado, Part 2

This is the second part of a series of posts analyzing the swing state Colorado. It will focus on the Republican base in Colorado. The third part can be found here.

Photobucket

History

Once upon a time, Colorado was a loyally Democratic state. Influenced by prairie populism and anger against powerful Republican businessmen in the East Coast, the state usually voted further left than the country at large. The trend continued for seven straight presidential elections.

More below.

This ended at around 1924. Colorado voted twice against President Franklin Delano Roosevelt, and throughout the remainder of the twentieth century remained a mainstay of Rocky Mountain conservatism. As late as 2005, a Republican politician might have good reason to see this as a permanent condition.

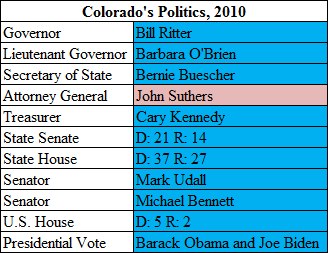
Said politician would have been shocked to see Colorado three years later, after a massive Democratic wave. In 2008, the state voted more Democratic than the national average for the first time in ten presidential elections. And as of September 2010, Attorney General John Suthers is the only statewide Republican officeholder.

Republican Colorado

For a long time, the Republican base in Colorado really was the entire state, minus Denver and a few thinly populated Hispanic counties in the south. Almost all of Colorado voted Republican; there was little that hinted it would ever be more than a solidly Republican state.

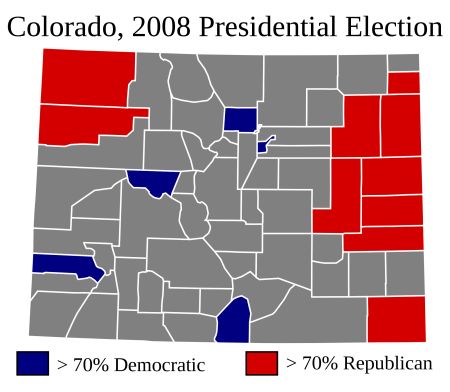
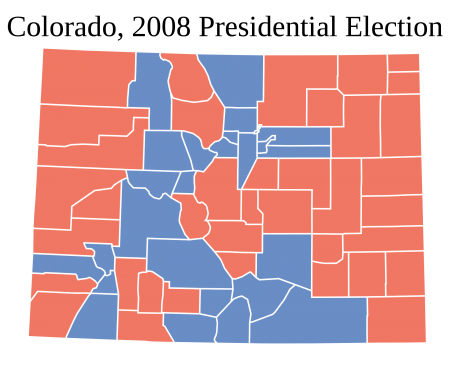
That this has changed is fairly obvious; it is why Colorado is now a swing state. The modern Republican base in Colorado consists of two entities. To get a look at the first, let’s take a look at the counties which gave Senator John McCain his strongest support.

Photobucket

The counties highlighted in red are quite representative of the first part of the Republican base: rural Colorado. This description must be qualified a bit further, since some parts of rural Colorado vote fairly Democratic. The first part of Republican Colorado actually constitutes white rural Colorado, minus those parts whose main industry consists of skiing resorts (Hispanic rural Colorado is fairly Democratic, as are the parts of rural Colorado home to massive skiing resorts).

This region has quite a lot in common with other Republican-voting rural counties in the Great Plains and Mountain West. The people are generally white and poorer than the national median. They have been also voting Republican ever since the days of President Woodrow Wilson. Democrats often bemoan the loss of poor whites in places like West Virginia who once voted faithfully Democratic. But in much of rural Colorado, the white working class was never Democratic in the first place.

There is one last distinguishing characteristic of this region: it is extremely thinly populated. Indeed, in 2008 a total of 28,159 votes were cast in the highlighted counties above – about 1.2% of Colorado’s total electorate.

Thus, Republican strength in rural Colorado is a secondary force the Republican coalition:

Photobucket

(Note: Edited NYT Image.)

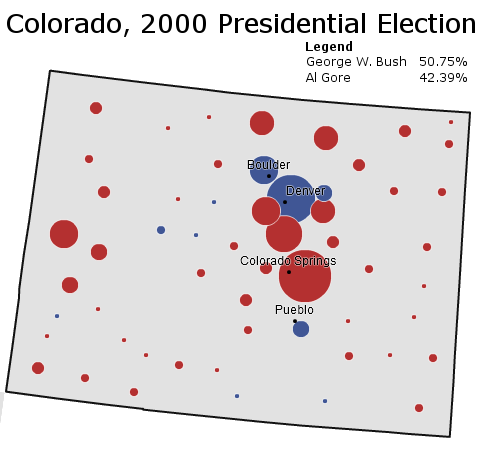
The second wing of Colorado’s Republican base is different. As the above map indicates, it can be seen in the Republican margins in the counties radiating around Denver, and especially in Colorado Springs.

These suburbs and exurbs constitute the second part of the Republican base in Colorado. Like most suburbs, they are generally wealthy, well-off places. Another distinguishing factor of Republican-leaning suburbs is their ethnicity: the reddest Republican suburbs tend to be the whitest.

Colorado Springs provides of typical example what makes a Republican suburb in Colorado. The largest red circle in the map, the city is famous as being the headquarters of a number of evangelical groups (such as James Dobson’s Focus on the Family). It also contains a substantial military population, which generally votes Republican.

The map above provides an example of Republican Colorado at a strong point. In 2000 neither party competed for Colorado, and the state went predictably and strongly Republican – as it had for decades beforehand. Republican strength in rural and suburban Colorado more than overwhelmed the Democratic-voting areas.

The next post will examine how much of Republican-voting suburban Colorado turned into swing territory.

–Inoljt, http://mypolitikal.com/
Analyzing Swing States: Colorado, Part 1

This is the first part of a series of posts analyzing the swing state Colorado. The second part can be found here.

Analyzing Swing States: Colorado,Part 1

Starting six years ago, a massive Democratic wave swept through the state of Colorado. Starting with the election of former Senator Ken Salazar, the Democratic Party took control of almost every state office there was to take. The results of this transformation are pictured in the table above.

More below.

At the time, Democrats crowed that Colorado was undergoing a fundamental political transformation. A flood of liberal migrants from California, along with steady growth in Colorado’s Latino population, was supposedly moving the state left from its decades-old conservative roots.

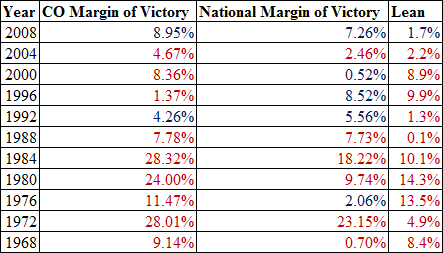
These conservative roots can be seen by taking a look at Colorado’s electoral history:

Analyzing Swing States: Colorado,Part 1

Six years later, however, Democrats are not so confident. Polls show that Colorado has swung as quickly Republican as it went Democratic after 2004. Democrats are facing tough elections in Colorado’s senatorial and house races; until the Republican candidate became engulfed in scandal, they were also polling weakly in the gubernatorial race.

Whatever the future of Colorado, for the past decade the state has done a perfect job of reflecting the national mood. This is perhaps the ultimate attribute of a swing state.

–Inoljt, http://mypolitikal.com/
The White Vote in Washington D.C.

By: Inoljt, http://mypolitikal.com/

When Republicans attack American liberalism, they prefer to use San Francisco as a punch bag. Indeed, San Francisco does constitute quite a liberal city; in the 2008 presidential election, 84.0% of the good folk of San Francisco preferred Democratic candidate Barack Obama over Senator John McCain.

San Francisco was far from the most Democratic-voting city in 2008, however. Mr. Obama’s percentage total was greater in several places; Washington D.C., for instance, pummeled San Francisco in the contest of who votes more loyally Democratic. In the capital of America, an astonishing 92.5% of voters supported the Illinois senator.

Most people who will hear this will probably start thinking something quite politically incorrect. The line of thought goes that “Washington is full of black people, all the blacks voted for Obama, so of course it voted that way.”

This is half true and half false.

More below.

It is true that the capital’s black population voted uniformly for the president – something that occurs with almost all Democratic candidates. The census, however, estimates that blacks compose only 54.4% of Washington’s overall population. This may surprise a lot of Americans who think the city is all-black. Even if every single black person in Washington voted Democratic, Mr. Obama still is quite a ways off from 92.5%.

Let’s look at another place with similar demographics to Washington D.C. – Montgomery County, Alabama where the Civil Rights movement started. Like Washington, Montgomery’s population is 52.9% black. Unlike Washington (where Mr. Obama won 92.5% of the vote), however, Montgomery only gave Mr. Obama 59.3% of the vote. Blacks are not responsible for this 33% difference; there is not much variation in how African-Americans voted in both cities.

The trick is with the white population. According to exit polls, Mr. Obama won 10% of whites in the state of Alabama. The results from Montgomery County reflect this low level of support.

In Washington, however, Mr. Obama won an astounding 86% of the white vote, according to exit polls. This is how the Illinois senator was able to get up to 92.5% of the vote in Washington, which is about one-third white. If white people alone had voted in Washington, Mr. Obama would still have done better than he did in San Francisco.

It would be quite interesting to explore why whites in the capital vote so loyally Democratic. Washington, of course, constitutes the center of the federal government; it would not be unusual for much of the white population to work for the government and thus vote more Democratic. But what type of work do they do – do they deliver the mail for the Post Office, or do they run the Post Office? Is Washington’s white population composed of  mostly working-class, union-type Democrats? Or is it composed mostly of  “wine-track” liberals, the type that populate cities like San  Francisco and Seattle?

Whatever the answer, this statistic remains one of the most curious and interesting ones to come out of the 2008 presidential election. Indeed, until now this blogger  was unaware that such one-sided Democratic voting patterns existed among  whites anywhere in the nation. To get 86% of the vote anywhere is a burdensome feat. For a Democrat to get that support from whites is something that one does not see often in the United States.

Comparing the White Vote and the General Vote

By: Inoljt, http://mypolitikal.com/

On November 4, 2008 Senator Barack Obama was elected president, winning a substantial margin over Republican candidate John McCain. In the popular vote, Mr. Obama won 52.9% of the electorate to Mr. McCain’s 45.7%; he thus took a 7.2% margin.

Mr. Obama, however, did not do so well with white, non-Hispanic voters. According to exit polls, the newly elected president lost whites by double-digits; taking 43% of the white vote to Mr. McCain’s 55% support.

This is not anything new; for decades now, the Democratic Party has been losing the white vote. Indeed, the last time a Democratic presidential candidate actually won whites was in 1964, when Texan Lyndon Johnson delivered a landslide pummeling to Senator Barry Goldwater.

Ever since then Democrats have been in a bad way with whites:

Comparing the White Vote and the General Vote

More below.

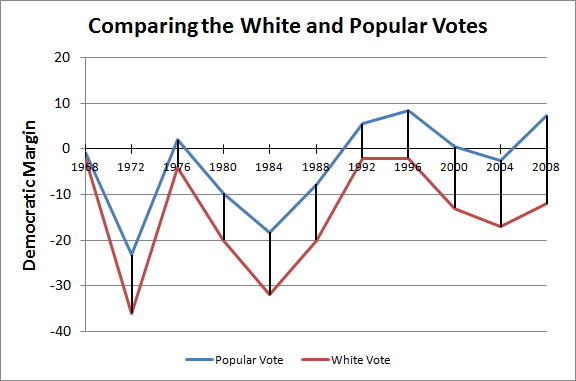
This graph compares the Democratic share of the white vote (as found by exit polls) to their share of the total vote. The top line indicates the former; the bottom indicates the latter. The three Democrats who did relatively well with whites were Democratic  candidates Hubert Humphrey, Jimmy Carter, and Bill Clinton.

As the graph shows, the white vote generally follows the popular vote (not a surprise, given that it composes the majority of the popular vote). Nevertheless the gap between the two has been steadily widening; in the past three elections, Democrats lost whites by double-digits yet still remained competitive in the general election.

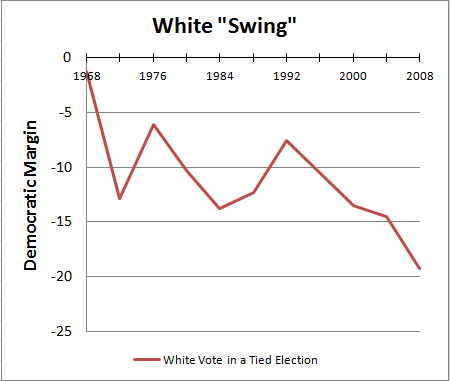
This trend can be more accurately pictured by graphing the relative “swing” of the white vote compared to the overall election:

Comparing the White Vote and the General Vote

This measurement indicates how the white electorate would have voted if an election had been tied; it is more useful than looking at the absolute vote. A candidate who lost the white vote by 40%, for instance, would generally be said to have done poorly with whites. If, however, we found out that the candidate had done even worse with the general electorate – say, losing by 45% – one could very well say that he or she did relatively well with whites.

In the last presidential election, for instance, Mr. Obama lost whites by twelve points, according to exit polls. However, Mr. Obama also won the overall electorate by seven points. Whites were therefore nineteen points more Republican than the average voter – as the graph indicates. In a hypothetically tied election, they would have voted Republican by nineteen percentage points (or a Democratic margin of negative nineteen points, according to the graph.)

This graph paints a slightly different picture of Democratic performances amongst whites. The adjustment makes Mr. Clinton and Mr. Obama look less impressive (Mr. Obama, especially), while making Mr. Humphrey look really good. To be fair, the 2008 election probably constitutes more of an outlier than the start of a trend for Democrats, given Mr. Obama’s unique strength amongst minorities. Expect the white “swing” to return to a more Kerryesque point in 2016.

Finally, one must note the degree to which the white vote is influenced by patterns in the South. Mr. Obama took less than 30% of the white vote in seven states: Alabama, Georgia, Louisiana, Mississippi, Oklahoma, South Carolina, and Texas. This low degree of white support is not unusual for Democrats. One-sided, racialized voting patterns in this region undoubtedly skew the overall white vote to be more Republican than would otherwise be the case.

P.S. For those interested, here is a table of the white vote over time, according to exit polls.

Previewing Senate Elections: California, Section 2

This is the last part of a series of posts analyzing competitive Senate  elections in blue states. It is the second section of two posts focusing on the greatest state in the union (otherwise known as California). The first part of the series can be found here.

Previewing Senate Elections: California,Section 1

Suburban SoCal

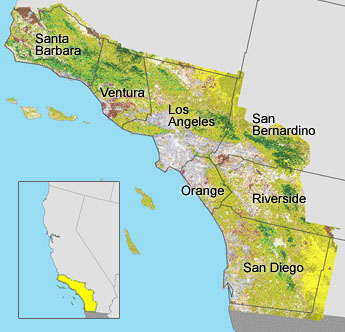
Southern California (SoCal, in short) is where the battle for California will be won or lost. Ms. Fiorina must accomplish two tasks in the region.

First, she must clean the clock in the suburban counties outside Los Angeles.

More below.

It is in places like Orange County, San Diego, and the Inland Empire that the votes to counter the Democratic bases in the Bay Area can be found. In the 2008 presidential election, there were one million more votes cast in the six SoCal counties above (excluding Los Angeles) than in the entire Bay Area.

This task is not too difficult. Unlike liberal NorCal, the suburbs in this region are more like the rest of the United States in their political leanings; in fact, they are probably more conservative than the median. Orange County and San Diego County are nationally known as conservative bastions (although they are not as red as in the past). Ms. Fioina probably needs to win above 60% of the vote in both counties. Historically, Republicans have often done this. The trouble is with Los Angeles.

Los Angeles

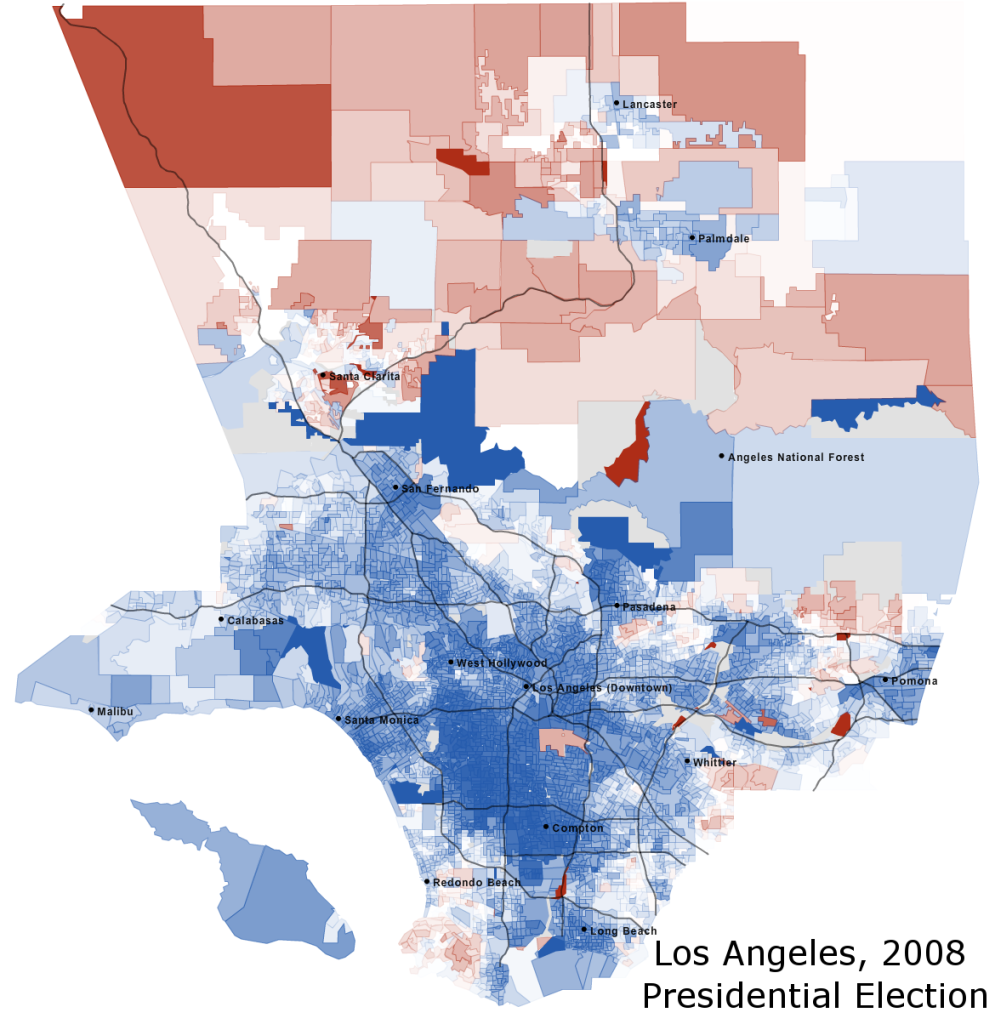
Ms. Fiorina’s second task is to run closely in Los Angeles. It is here that Republicans face their greatest challenge. Los Angeles – sprawled, extremely populous, and arguably more diverse than even the Bay Area – constitutes a Democratic stronghold. President Barack Obama ran off with 69.2% of the vote here; Senator John Kerry took 63.1%. Ms. Fiorina must reduce this Democratic margin to within the single-digits.

Previewing Senate Elections: California,Section 2

The math here is simple.  There are just not enough Republican votes in Central Valley, the Orange County-San Diego metropolis, and the Inland Empire to offset the Democratic bastions of the Bay Area and Los Angeles. Republicans must therefore break one of the two strongholds. It is impossible to do this in the Bay. So the choice must be Los Angeles.

The key are the outer, wealthier suburbs within Los Angeles county. Some are liberal Hollywood areas, typified by Congressman Henry Waxman’s 30th congressional district. Republicans probably cannot win these. Others are more conservative and even voted for Senator John McCain (see, for instance, the patches of red north of Pomona and south of Redondo Beach). Ms. Fiorina will have to expand upon this core and win places like the San Fernando Valley and Pasadena – suburbs which rarely vote Republican.

Conclusion

When the voting booths close and the precinct results start pouring in, look at Los Angeles County. Ms. Fiorina’s performance there will be most indicative of her overall strength. If Democrats are winning the county by double-digits, then she is in trouble. Conversely, if their margin is less than five percent – or if Republicans are winning the county – then Republicans are in good shape. A Democratic margin between five and ten percent signifies that a long night is ahead.

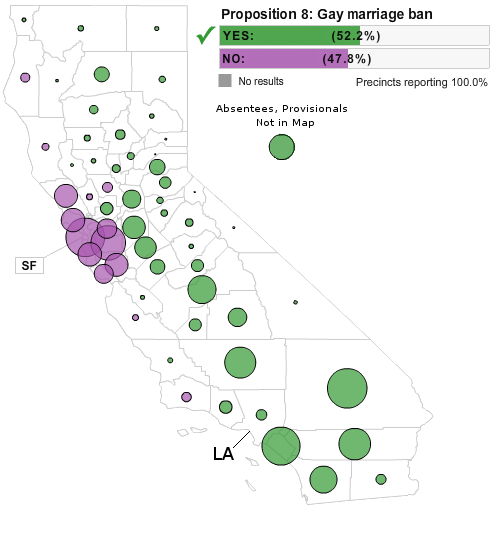
On a state-level basis, modeling a close Republican victory is somewhat difficult; Republican candidates haven’t won a close race for a long time in California. There is, however, a substitute that fits well:

Previewing Senate Elections: California,Section 2

These are the results of the famous Proposition 8, which passed by a 4.5% margin. On a county-by-county basis, a Fiorina victory will probably look quite similar to this. There are minor differences; the margins in Orange and San Diego Counties would probably be greater; Republicans probably wouldn’t win Los Angeles County.

Overall, however, the picture would not be too different. Heavy margins from the SoCal suburbs and Central Valley counter Democratic strength in NorCal, while a strong Republican performance in Los Angeles dilutes Democratic margins there.

There is one final complication for Republicans. California constitutes the most diverse state in the country; winning minorities is a must. The Republican Party is not very good at this, which why California is a blue state today. It must change this, if candidates like Ms. Fiorina are to win the state.

Some minorities are easier to win than others. Blacks are most loyal to the Democratic Party, but they number only 6.2% of the state’s population. While more numerous Asians and Latinos do not vote their numbers (their share in the voting electorate is slightly more than half their share of the overall population), their votes are easier to get.

Here Proposition 8 is less useful as a guide. In Los Angeles County, for instance, all of South Central voted for the proposition. Unless Republicans start winning Compton and Watts, they will have to find support from a different section of California’s majority-minorities.

Winning minorities constitutes a novel challenge to the Republican Party; until now it has drawn an ever-increasing percentage of the white vote to offset increasing numbers of minorities. This is no longer possible in places like California. If Republican candidates like Carly Fiorina and Meg Whitman are to win the state, they will need to envision a new strategy.

(Note: Credit for several edited images goes to the LA Times).

–Inoljt, http://mypolitikal.com/
Previewing Senate Elections: California, Section 1

This is the third part of a series of posts analyzing competitive Senate elections in blue states. It will focus on California. Because California is such a big and complicated state, it will have two sections – of which this is the first. The second part can be found here.

California, Section 1

In the greatest state of the union, a fierce senatorial battle is brewing. Former HP executive Carly Fiorina is mounting a tough challenge to incumbent Democrat Barbara Boxer. In an anti-Democratic national environment, polls show the race close and competitive. This post will examine the obstacles Ms. Fiorina will face as she seeks to overcome California’s formidable Democratic geography.

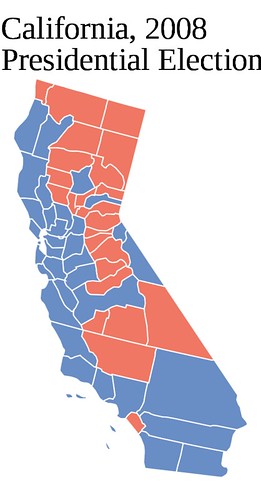
CA 2008

As America’s most populous state, California contains a number of distinct regions. This post, and the one following, will examine each.

More below.

Upper California and the Sierra Nevada

When people think of California, the northern forests and year-round snow of the Sierra Nevada generally do not come into mind. These regions, geographically expansive yet thinly populated, tend to vote loyally Republican (although until the 1970s Democrats had a base of support in several northeastern counties).

Not all of this region is Republican-voting, unpopulated wilderness. Exurban Placer County, for instance, contained 173,812 voters in 2008. Other parts – especially the liberal coast – tend to vote Democratic, eating in to Republican strength.

Ms. Fiorina will probably need something like 70% of the vote in places like Placer County to win. Strong margins from this Republican stronghold constitute the first, easiest step to a Republican victory.

The Bay Area

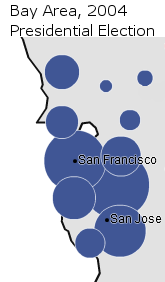
In many ways, the Bay Area is what makes California a blue state. Without the Bay Area, for instance, President George W. Bush would – almost – have won California in 2004, losing by a mere 0.7%.

Previewing Senate Elections: California,Section 1

Unfortunately for Republicans, the Bay Area – one of the richest, most diverse, and most liberal places in the country – does indeed exist, and it votes strongly Democratic. A popular attack against Senator Boxer is to call her a San Francisco liberal; this generally works less well in San Francisco.

In addition, voting habits in the Bay Area tend to be “sticky.” If the rest of California moves ten points more Republican, the Bay Area will tend to move only five points right. San Francisco and Alameda counties are sometimes the last two counties standing during Republican landslides.

There is a glimmer of hope for Republicans, however. The counties surrounding San Francisco and Berkeley tend to be one degree less intense in their liberalism. Ms. Fiorina will not win them, but a well-run campaign can reduce Democratic margins somewhat.

Central Valley

Home to some of the richest farmland in America, the counties composing Central Valley once leaned Democratic but now vote Republican in all but Democratic landslides. Conservative and heavily populated – although not by California standards – Central Valley provides somewhat of a reservoir to offset the enormous Democratic margins radiating from the Bay Area.

There is, however, one important exception: Sacramento, a populous county whose Democratic leanings deny Republicans a vast store of potential votes.

In the long run, Central Valley is a ticking time bomb. Democratic-voting Latinos compose 30-50% of the population in many of these counties, and their numbers will only increase. For now Ms. Fiorina is safe – Latinos do not vote their numbers, especially in mid-terms – but future Republicans cannot take Central Valley for granted.

The Challenge of Southern California

Previewing Senate Elections: California,Section 1

It is in the urban sprawl of SoCal, however, where Republicans face their greatest challenge. Ms. Fiorina has two tasks here. The first is to win the counties outside Los Angeles, and win them big. The second is to keep Los Angeles itself within single digits.

The next post will expand upon SoCal and offer a conclusion on Republican prospects of winning California.

–Inoljt, http://mypolitikal.com/
Analyzing Swing States: Virginia, Conclusions

This is the last part of a series of posts analyzing the swing state Virginia, which aims to offer some concluding thoughts. The previous parts can be found starting here.

Conclusions

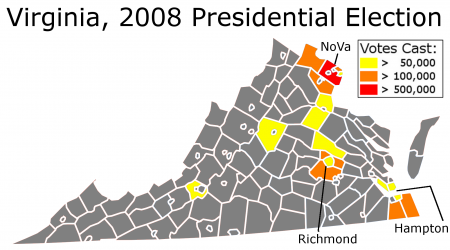
As a state, Virginia’s population has always been located in three metropolitan areas: the Northern Virginia suburbs south of Washington D.C., Richmond and its suburbs, and the communities surrounding Hampton Roads. Together these three places compose more than half of Virginia’s electorate:

Analyzing Swing States: Virginia,Conclusions

In all three metropolitan areas, Democrats have been improving their margins.

More below.

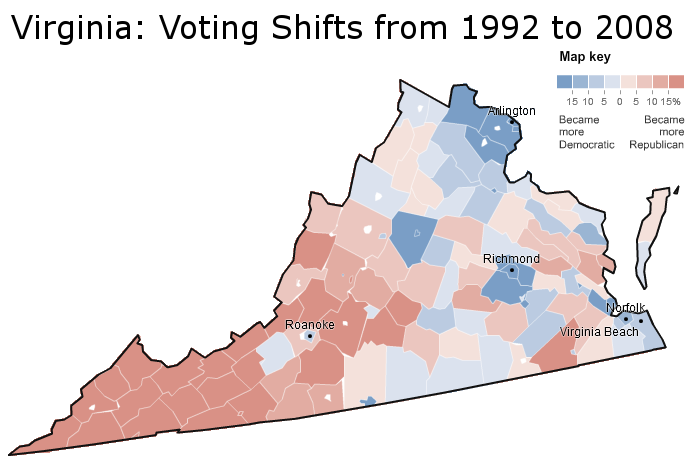
Virginia’s suburbs, expansive and traditionally Republican, have shifted leftwards with startling quickness. This movement has been most apparent in the largest of its suburbs, rich and diverse Northern Virginia. The addition of NoVa to Virginia’s heavily Democratic, heavily black cities has given the Democratic Party a coalition that has won a number of recent elections.

Not everything has gone badly for the Republican Party. They have captured a formerly loyal Democratic constituency – the Appalachian west, which voted Democratic based on economic appeals. Moreover, they still dominate the rural whites who in bygone days voted Democratic:

Analyzing Swing States: Virginia,Conclusions

Thus, Virginia today is a state in change, like most states. Parts of it are shifting left and parts of it are shifting right; in aggregate, the effect has been to change it from a solidly Republican to swing state. Undoubtedly, other states will and are moving in the opposite direction.

Colorado, the next state in this series, is probably not one of those Republican-shifting states.

–Inoljt, http://mypolitikal.com/
Bobby Jindal’s Strange 2003 Coalition, Part 1

By: Inoljt, http://mypolitikal.com/
This is the first part of two posts analyzing Louisiana’s 2003 gubernatorial election, in which Republican candidate Bobby Jindal narrowly lost to lieutenant governor Kathleen Blanco. The second part can be found here.

Bobby Jindal’s Strange Coalition

In 2003, an ambitious Bobby Jindal ran for Louisiana governor against Democratic candidate Kathleen Blanco. Despite holding a narrow polling lead throughout most of the campaign, Mr. Jindal ended up losing by a three-point margin.

The story of the coalition that voted for Mr. Jindal constitutes quite the interesting tale. It is much different from the Republican base as commonly envisioned in the Deep South.

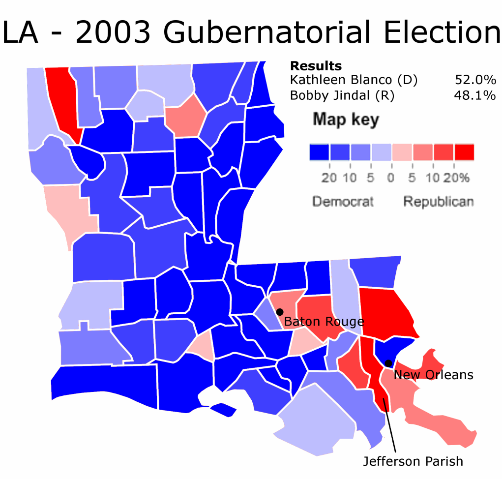
To begin, let’s take a look at a map of the election – which is substantially different from most modern electoral maps. Here it is:

Bobby Jindal's Strange 2003 Coalition,Part 1

More below.

The first thing that strikes the eye is the sheer number of parishes Mr. Jindal lost. He was absolutely crushed in rural Louisiana.

This is a remarkable thing. In the United States of today, it is usually an accomplishment for a Democrat to win a state’s rural counties, even in a landslide. Democrats almost never win the rural vote when the election is close.

Mr. Jindal, of course, got 48% of the vote somewhere. As it turns out, these votes came mainly from the state’s most populous parishes. The state’s most populous parish – Jefferson Parish – voted for Mr. Jindal by more than a 3-to-2 margin. In New Orleans, with the endorsement of Mayor Ray Nagin, Mr. Jindal did as well as possible for a Republican, winning almost one-third of the vote.

In other words, Mr. Jindal used strong margins from metropolitan, suburban Louisiana to counter Ms. Blanco’s rural strength and New Orleans – a strategy more familiar to Democrats than Republicans.

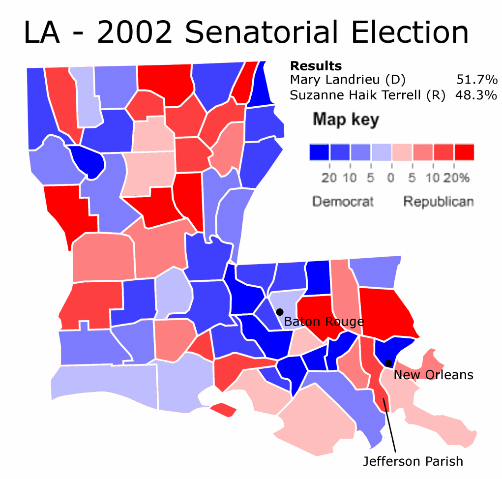
Here is a more “normal” election in Louisiana:

Bobby Jindal's Strange 2003 Coalition,Part 1

Although it does not look like it, Republican candidate Suzanne Terrell did only one point better than Mr. Jindal.

There are substantial differences in their coalitions, however. Ms. Terrell did worse in the populous southeast, although the map does not show it well. She lost Baton Rouge (which Mr. Jindal won) and took only one-fifth of the vote in New Orleans, compared to the one-third Mr. Jindall racked up.

On the other hand, Ms. Terrell performed far better in rural, northern Louisiana – winning a number of thinly populated, poor parishes that Mr. Jindal lost. It was Mr. Jindal’s performance that constituted the aberration; deeply conservative, these parishes are a core part of the Republican base.

The next section will focus on the racial dynamics that caused this effect.

What to watch for from now until Labor Day

These are the dog days of summer as far as politics go, when the polls are many but the insight they offer is fleeting, because it’s too damn early to know anything, and when campaigns are coming up with their grand strategies that will unleash victory once people start paying attention, which right now, they mostly aren’t.

Nonetheless, I thought it might be instructive to chronicle what I think political junkies should be paying attention to right now, seperating the wheat from the chaff. This is my opinion and by no means comprehensive, so give your own thoughts on this as well.

Right now, the year is battling between 1994 (an all out disaster for the governing Democratic party) and 1982 (where the losses were small and manageable for the ruling Republicans). I don’t see much of a sign it’s going to be 2002 (where the dominant Republicans actually picked up seats), but who knows. Anything can happen in the next three months.

So here’s what I’m paying attention to:

Unemployment: Not the weekly unemployment numbers, which can fluctuate, but the monthly unemployment reports. We have two of these coming out before Labor Day, and while both are important the September 3rd one will set the narrative for the remainder of the fall. I think we will see some growth in jobs and a either a small fall or rise in the unemployment rate, which will not be good news for the Dems, but not the worst news either. If job creation goes negative for either month, however, or their is a more than 3 percent rise in unemployment, it’s very bad news for the Dems. Conversely, a big rise in job creation or drop in unemployment could mitigate some losses for Dems in November. Keep in mind that while unemployment didn’t seem to matter in 1982 or 1994 in predicting election results, there are reasons to expect it might play a more outsize role in the coming election (in 1982, Reagan had began to tame inflation, which made people feel better about the rise in unemployment, and 1994 was more about Clinton’s failed health care plan, his stance on gun control and perceived mistakes then the economy).  

Obama’s approval rating: Obama is right now about where Clinton was at this time in 1994 and Reagan in 1982 (Reagan actually may have been slightly less popular). Clinton dropped further, of course, and the result was a disaster for Democrats. Conversely, Reagan also dropped throughout 1982, and the results were not a catastrophe for the Republicans. What was the difference? I think it was this: while Reagan was not popular in 1982, he was not as polarizing as Clinton was in 1994 (remember this was after the gays in the military mess, the haircut on Air Force One, the consistent advocacy of gun control and other culture war situations). In other words, where Democrats did not successfully make the election about Reagan in 1982, Republicans made it about Clinton in 1994 (just as Dems made it about Bush in 2006 and 2008). So, it’s not just Obama’s approval rating, but the intensity of opposition to him. Right now, it’s pretty intense, but with most of the big ticket items (HCR, the financial bill) out of the way, there is reason to hope it may drop down to Reagan 1982 levels. That could be a big factor.

Money, money, money Right now, we know the Dems will have a financial advantage headed into fall, but how much is the question. Pay attention to a couple of things: 1). What’s happening with the RNC, which could determine how far behind the Republicans will be this year 2). Whether Karl Rove’s new group or any of the other shadowy advocacy organizations will make a difference in the Republican’s cash deficit and 3). Any snippet of information you can get on some of the Republican candidates who were outraised by the their Democratic counterparts (like the ones in Pennsylvania), that indicate they might be catching up.

Races to watch

While we’re going to see lots of polls about the close Senate and Governor races (and even some House races), many of those polls aren’t going to break either way until the fall. Here are the races I’m watching the closest this summer:

Marshall vs. Burr Marshall just came out with an internal poll indicated she was two points ahead. Great, but here’s the thing: she needs some independent proof of this. The DSCC and DNC are not far enough ahead of their Republican counterparts they are going to be able to do for her what they did for Kay Hagen against Dole two years ago. She’s going to need some evidence she can actually win this thing, because she doesn’t have enough money right now to beat Burr without an influx of funds. This summer will tell all.

Vitter vs. Melancon Given it looks like Vitter will likely survive his primary, see Marshall above. Melancon needs more than an internal poll to show he can win this thing against Vitter. He won’t be as financially disadvantaged as Marshall, but Louisiana is not a Democrat-friendly state right now, and if by Labor Day Melancon is still down by seven points or more, prepare to write him off. (even five might be too much)

Grassley vs. Conlin This one isn’t really on anyones radar, but it could show whether the national mood is anti-Republican or anti-incumbent. Grassley is running a lackadasical campaign, and Conlin is a great fundraiser. But if Grassley is up by double digits as of Labor Day, it’s probably over.

I think these three races will be indicative of where were heading. If by the time Labor Day rolls around, we are writing all of them off, it’s not going to be a good year for the Dems. If even one of them is competitive, it may be better than anyone expects.

Things not to pay attention to

The stock market, the weekly first-time unemployment numbers (unless they drop below 400,000), or housing starts. All of these fluctuate way too much to have much impact on the way the election will go

Party preference numbers People pay too much attention to these. Not only do they bounce all around (this week see Gallup vs. Quinnipiac vs CNN) but it’s still too early for them to tell us anything about how the races will shape up in the fall. The national mood now won’t neccesarily be the national mood three months from now (when the party preference numbers WILL matter)

Commntators either on Red State or to Steve Singiser on Kos (not Singiser himself, who’s great) The former are constantly predicing 90 seat House gains and 11 seat Senate gains for the Republicans, the latter seem to think Dems will be at 64 or 65 seats because they will win all of the toss ups in the fall, and even some seats that are currently leaning Republican. For relief, go to Nate Silver and 538.com. He’s not always right, but he’s always realistic (and when he has that occasional slip-up, like with his commentary on WV-Senate, he corrects it pretty quickly).  


Previewing Senate Elections: New York

This is the first part of a series of posts analyzing competitive Senate elections in blue states. The first part, which analyzes Illinois can be found here.

Out of the three heavily Democratic states being analyzed, Republicans probably have the least chance of winning New York. A serious Republican challenger to Senator Kristen Gillibrand has yet to emerge. Moreover, Ms. Gillibrand has proven an adept politician willing to campaign hard.

Nevertheless, in a bad national environment with low name recognition, victory for Democrats is not assured. Under the right circumstances (perhaps a Gillibrand scandal), Republicans may be able to pull off a shocker.

Previewing Senate Elections: New York

Like Illinois, New York can be divided into three sections: upstate, the suburbs downstate, and New York City. A New York Republican must win upstate and the suburbs by substantial margins – and perform extremely well in New York City.

More below.

Upstate New York

Like Illinois, the first step on the Republican road to victory lies with here. A Republican candidate must win strong margins upstate; a strong performance here is embedded with a double-digit loss.

Unfortunately for Republicans, upstate New York and downstate Illinois are not the same. Unlike Illinois, upstate New York is home to four major cities: Buffalo, Rochester, Albany, and Syracuse. In a normal election – i.e. a double-digit Democratic victory – these cities will vote Democratic, some by substantial margins.

There are several more wrinkles for a Republican candidate. Like much of the rural northeast, upstate New York has been trending Democratic. Despite the conservative national mood, Democrats last year won two special elections upstate. Moreover, Senator Kristen Gillibrand has roots there; she represented an upstate congressional district before becoming Senator.

Nevertheless, the majority of this region still votes loyally Republican; a competitive candidate can rely upon it to help counter New York City. In a close election a Republican ought to win almost every county in upstate New York.


The Suburbs Downstate

This region can be defined as the suburbs surrounding New York City: Long Island and the communities around Yonkers. A Republican’s task here is similar to that upstate: win, and win big.

Historically this was not too difficult; New York City’s suburbs regularly voted Republican, although never by enough to overcome Democratic margins in the city itself. Like many other suburbs, this changed with President Bill Clinton: since his time they have generally voted Democratic.

Today things are changing once more. Since the events of 9/11, downstate’s suburbs (especially Long Island) have been trending Republican. This was one of the few regions Senator John McCain did well in (as opposed to President Barack Obama doing poorly in); his national security credentials appealed to a number of downstate suburban voters.

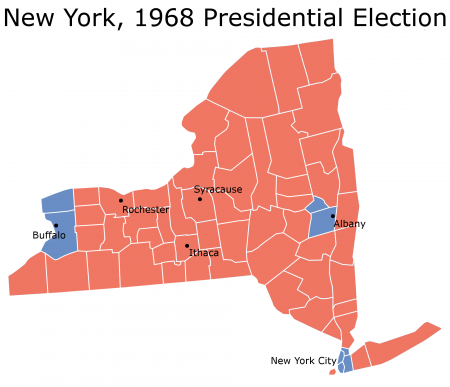
A strong Republican must capitalize on this trend, changing New York’s suburbs back into Republican territory. This strength, added to margins from upstate, makes for a 5% Republican loss. Republican candidates have achieved this combination many times in the state’s electoral history. Take 1968, when President Richard Nixon lost New York by 5.46%:

Previewing Senate Elections: New York

The problem is the last 5%, to  which a Republican must look to New York City for.


New York City

To make up the last 5%, a Republican candidate must do well in New York City, that great metropolis of the United States. The Big Apple composes an astounding 43% of the state’s population, the largest proportion in the country. It also votes extremely Democratic; in 2008 four out of five voters turned the lever for President Barack Obama.

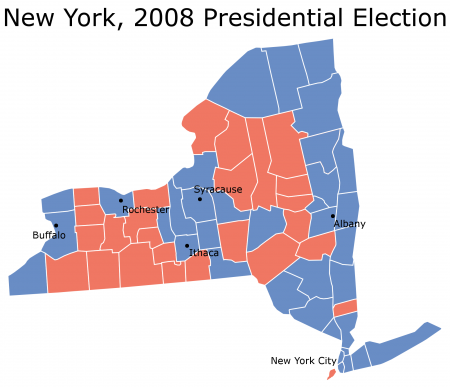
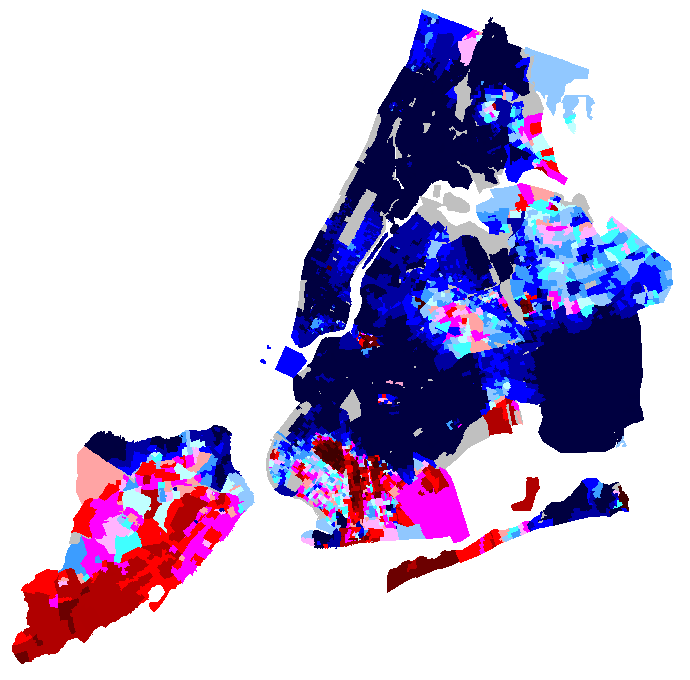
The Republican facing Ms. Gillibrand will have to substantially improve upon this number. This is not as hard as it first sounds. New York City, after all, has had a non-Democratic mayor for more than a decade. Low minority turn-out looks likely to bedevil Democrats during this off-year election. Moreover, Republicans retain a base in Staten Island and southern Brooklyn. Even in 2008 these places voted Republican:

Previewing Senate Elections: New York

(Note: Image courtesy of a very old post from jeffmd.)

Finally, some regional complexities come into play. Although almost all of New York City voted for Mr. Obama, some parts are more less loyally Democratic than others (as was the case in Massachusetts). White liberals and impoverished minorities in Manhattan and the Bronx almost never vote Republican; suburbanites in Brooklyn and Queens, on the other hand, are more perceptible to Republican appeals. Winning Republicans generally tie or win the Queens borough and hold Democrats below 60% in the Kings borough.


Conclusions

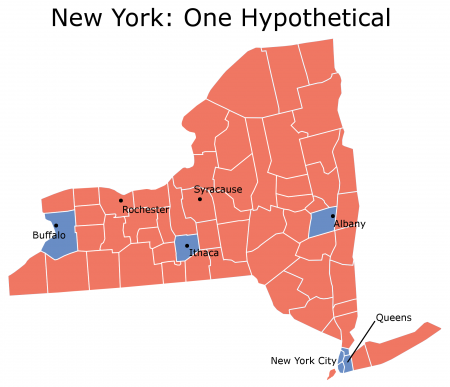
If New York is close next November, it will probably look something like this:

Previewing Senate Elections: New York

This map can indicate anything from a 5% Democratic victory to a 5% Republican victory, depending on turn-out. Perhaps the best barometer will be the Queens borough in New York City. Look to it next November – it might literally determine the fate of the Democratic Senate majority.