Democratic Gerrymander of VA Senate

Democratic control of the Virginia Senate gives Democrats the possibility of some leverage in drawing the lines for Congress.  Retaining control of the Senate is very important if Republicans put off redrawing the Congressional lines until after November, but the majority is fairly narrow at 22D-18R, and the entire body is up for re-election this fall.  

I’ve attempted to create a map that balances the interests of current senators in reelection and the national interests of the party in maintaining control by any means necessary.  I think I’ve been able to sufficiently protect all incumbents while maximizing the number of Democratic districts, and the map is a large improvement over the current Republican gerrymander.  Although conventional wisdom holds that each chamber will draw its own lines, I’m not sure the House of Delegates would approve something like this map.

Photobucket

Western Virginia:

Photobucket

District 15: Open

Obama 53.9%

Democratic 51.1%

District 19: Ralph Smith (R)

Obama 38.3%

Democratic 40.1%

District 20: Roscoe Reynolds (D)

Obama 52.2%

Democratic 49.5%

District 21: John Edwards (D)

Obama 52.6%

Democratic 51.8%

District 22: Open

Obama 34.4%

Democratic 38.7%

District 23: Steve Neuman (R), Bill Stanley (R)

Obama 33.5%

Democratic 35.3%

Note: Making a last minute change with the 21st, I accidentally cut this district in half, but it would only require shifting one precinct to make the district contiguous.

District 24: Emmett Hanger (R)

Obama 34.7%

Democratic 33.0%

District 25 Creigh Deeds (D)

Obama 58.4%

Democratic 56.3%

District 38: Phil Puckett (D)

Obama 50.2%

Democratic 52.1%

District 40: William Wampler (R)

Obama 34.1%

Democratic 38.1%

Eastern Virginia:

Photobucket

District 1: Tommy Norment (R)

Obama 41.1%

Democratic 41.2%

District 2: Mamie Locke (D), John Miller (D) (maybe)

Obama 72.3%

Democratic 66.3%

Black VAP 51.1%

District 3: Ryan McDougal (R), Walter Stosch (R)

Obama 35.8%

Democratic 35.2%

District 4: Richard Stuart (R)

Obama 45.1%

Democratic 42.5%

District 5: Yvonne Miller (D)

Obama 72.7%

Democratic 67.9%

Black VAP 51.3%

District 6: Ralph Northam (D)

Obama 56.7%

Democratic 52.5%

District 7: Frank Wagner (R)

Obama 55.1%

Democratic 49.5%

District 8: Jeff McWaters (R)

Obama 53.1%

Democratic 52.2%

District 9: Donald McEachin (D)

Obama 74.7%

Democratic 70.5%

Black VAP 56.7%

District 10: John Watkins (R)

Obama 42.2%

Democratic 39.0%

District 11: Steve Martin (R), Frank Ruff (R)

Obama 37.8%

Democratic 35.6%

District 12: Open

Obama 64.1%

Democratic 59.0%

District 13: Fred Quayle (R), John Miller (D) (maybe)

Obama 50.3%

Democratic 49.5%

District 14: Harry Blevins (R)

Obama 39.7%

Democratic 39.0%

District 16: Henry Marsh (D)

Obama 72.1%

Democratic 65.0%

Black VAP 51.0%

District 17: Edd Houck (D)

Obama 51.2%

Democratic 45.2%

District 18: Louise Lucas (D)

Obama 65.1%

Democratic 61.3%

Black VAP 52.3%

Northern Virginia:

Photobucket

District 26: Mark Obenshain (R)

Obama 41.6%

Democratic 37.9%

District 27: Jill Vogel (R)

Obama 37.9%

Democratic 40.6%

District 28: Open

Obama 43.9%

Democratic 41.0%

District 29: Chuck Colgan (D)

Obama 58.9%

Democratic 50.0%

District 30: Patsy Ticer (D)

Obama 68.6%

Democratic 66.2%

District 31: Mary Margaret Whipple (D)

Obama 68.1%

Democratic 70.3%

District 32: Janet Howell (D)

Obama 59.0%

Democratic 57.2%

District 33: Mark Herring (D)

Obama 54.6%

Democratic 49.2%

District 34: Chap Peterson (D)

Obama 58.8%

Democratic 54.7%

District 35: Dick Saslaw (D)

Obama 61.9%

Democratic 58.9%

District 36: Toddy Puller (D)

Obama 68.4%

Democratic 61.5%

District 37: Dave Marsden (D)

Obama 59.4%

Democratic 54.6%

District 39: George Barker (D)

Obama 56.2%

Democratic 53.0%

I would rate the lean of the seats as follows:

Safe Democratic (Obama and Democratic vote percentage both above 50%): 22

Toss-up (Obama percentage or Democratic vote percentage above 50%): 5

Safe Republican (Everything else): 13

Thoughts?

Another Virginia Court-Drawn Map

Here is my spin on Virginia with the 2010 Census and political data in Dave’s App.  Because of Democratic control of the Senate and Republican control of everything else, a court-drawn map is a reasonable possibility in Virginia. I attempted to prioritize the same goals a court would.  These goals were:

1. Preserve a majority-black voter district

2. Avoid county splitting

3. Keep each district limited to one region of the state

4. Compactness

Photobucket

Hampton Roads:

Photobucket

Northern Virginia:

Photobucket

District 1: Tidewater

Incumbent: Rob Wittman (R)

Population: 726,817

Two-Party Partisan Performance:

New District: 45.5% Obama, 43.4% Democratic

Old District: 48.4% Obama, 44.8% Democratic

Racial/Ethnic Demographics:

71.3% White

18.8% Black

04.6% Hispanic

02.2% Asian

This district takes a portion of the northern peninsula in the Hampton Roads area, the rest of the Tidewater area to the north, and ultra-conservative Hanover County north of Richmond. It becomes less Democratic and safely Republican.

District 2: Hampton Roads

Incumbent: Scott Rigell (R), Randy Forbes (R)

Population: 727,545

Two-Party Partisan Performance:

New District: 49.1% Obama, 46.8% Democratic

Old District: 52.4% Obama, 49.1% Democratic

Racial/Ethnic Demographics:

66.3% White

19.1% Black

06.3% Hispanic

04.9% Asian

The district takes in all of Virginia Beach and the Delmarva Peninsula plus the whiter portions of Chesapeake, Portsmouth, and Norfolk.  The district becomes slightly more Republican. It would be tough, but not impossible, for a Democrat to win here. Randy Forbes and Scott Rigell both live in the district, but because this contains much more of Rigell’s territory, I think he’d have the edge.

District 3: Hampton Roads (VRA District)

Incumbent: Bobby Scott (D)

Population: 726,624

Two-Party Partisan Performance:

New District: 69.2% Obama, 65.1% Democratic

Old District: 75.7% Obama, 71.3% Democratic

Racial/Ethnic Demographics:

38.3% White

53.2% Black

04.0% Hispanic

01.8% Asian

This district becomes much more compact, leaving the Richmond area. It is still has a majority of black voters, though that majority is a few percentage points smaller. This district is very safe for Democrats.

District 4: Southside

Incumbent: Robert Hurt (R)

Population: 727,567

Two-Party Partisan Performance:

New District: 42.2% Obama, 43.2% Democratic

Old District: 51.0% Obama, 49.0% Democratic

Racial/Ethnic Demographics:

68.0% White

28.0% Black

03.0% Hispanic

01.1% Asian

This district shifts west, taking in Virginia’s Southside region. It becomes much more Republican and is probably unwinnable for Democrats.

District 5: Piedmont

Incumbent: None

Population: 728,108

Two-Party Partisan Performance:

New District: 49.7% Obama, 46.2% Democratic

Old District: 48.5% Obama, 47.3% Democratic

Racial/Ethnic Demographics:

73.6% White

14.4% Black

06.2% Hispanic

03.0% Asian

This district shifts north, still containing Charlottesvile but trading Southside for Virginia wine country and portions of the Northern Virginia exurbs. It becomes slightly more Democratic and is winnable with the right candidate. Eric Cantor would probably run here, since it contains a fair amount of his old turf.

District 6: Shenandoah Valley

Incumbent: Bob Goodlatte

Population: 728,381

Two-Party Partisan Performance:

New District: 42.4% Obama, 40.5% Democratic

Old District: 41.9% Obama, 57.9% Democratic

Racial/Ethnic Demographics:

83.9% White

07.9% Black

05.1% Hispanic

01.2% Asian

This is still a Shenandoah Valley district and very, very Republican.

District 7: Richmond

Incumbent: Eric Cantor (R)

Population: 726,869

Two-Party Partisan Performance:

New District: 61.8% Obama, 57.0% Democratic

Old District: 46.6% Obama, 42.1% Democratic

Racial/Ethnic Demographics:

54.0% White

32.7% Black

06.4% Hispanic

04.5% Asian

This district has undergone a huge change, going from a safe Republican to safe Democratic seat.  Eric Cantor would stand little chance of victory here. Sen. Donald McEachin and Del. Jennifer McClellan would be the likely Democratic candidates.

District 8: Northern Virginia

Incumbent: Jim Moran (D)

Population: 727,201

Partisan Performance:

New District: 68.2% Obama*, 54.9% Democratic

Old District: 69.3% Obama*, 57.9% Democratic

Racial/Ethnic Demographics:

52.4% White

14.1% Black

18.9% Hispanic

11.3% Asian

This district contains all of Arlington County and Alexandria City, plus other close-in suburbs in Fairfax County. It becomse slightly less Democratic, but remains safe.

*Note that President Obama’s performance is slightly understated due to an error in the data.

District 9: Southwest Virginia

Incumbent: Morgan Griffith (R)

Population: 728,247

Partisan Performance:

New District: 40.1% Obama, 43.2% Democratic

Old District: 40.3% Obama, 43.7% Democratic

Racial/Ethnic Demographics:

92.2% White

03.4% Black

01.8% Hispanic

01.3% Asian

This district contains Southwest Virginia. Its partisan makeup is unchanged and post-Rick Boucher is probably unwinnable for Democrats.

District 10: Northern Virginia

Incumbent: Frank Wolf (R)

Population: 726,837

Two-Party Partisan Performance:

New District: 54.7% Obama*, 53.6% Democratic

Old District: 50.2% Obama*, 47.2% Democratic

Racial/Ethnic Demographics:

62.8% White

06.0% Black

12.6% Hispanic

16.9% Asian

This district shrinks dramatically, dropping its territory outside Northern Virginia. It contains Loudoun County, the City of Falls Church, and northern Fairfax County. The district becomes significantly more Democratic, which might actually encourage a credible challenger to run against Frank Wolf. My guess would be state Sen. Mark Herring.  

*Note that due data errors, this President Obama performed about 2 percentage points better than it appears.

District 11: Northern Virginia

Incumbent: Gerry Connolly (D)

Population: 726,807

Two-Party Partisan Performance:

New District: 57.6% Obama, 51.1% Democratic

Old District: 56.6% Obama, 52.3% Democratic

Racial/Ethnic Demographics:

51.8% White

13.9% Black

17.9% Hispanic

12.6% Asian

This district takes in the remainder of Fairfax County and all of Fairfax City, Mannassas, Manassas Park, and Prince William County.  The partisan composition doesn’t change much.  Since Conolly survived 2010, I have to beleive he’ll be fine in the future.

This map would probably produce 5 Democrats and 6 Republicans.

Fair redistricting in VA

Now that Dave’s app has updated data for Virginia, I figured I would see what a map drawn by courts or a commission would look like. I had the basic idea for this map for a while, but now I updated it with the new population estimates to see what the partisanship would look like.


Nova:

Districts:

VA-08:Arlington, Alexandria, Falls Church, inner Fairfax county

18+Pop: 56W/12B/18H/13A

2008:67O/33M

Avg Dem performance: 66D/35R

Representative: Jim Moran (D)

VA-11: Outer Fairfax county

61W/8B/11H/18A

57O/43M

54D/46R

Representative: Probably Gerry Connolly (D), but Frank Wolf (R) also lives in this district. I suspect Connolly is favored to win, but Wolf has substantial crossover appeal and would definitely have a chance. My initial guess is that Connolly would be the 60% or so favorite. It would almost certainly go D within the next decade, however.

VA-10: Prince William county (except Quantico Marine Corps base), inner Loudoun county

55W/15B/17H/11A

55O/45M (One caveat-many precincts in this district show 3-4K McCain votes but no Obama votes, so Obama total is probably somewhat higher)

49D/51R

Representative: None live in this district. The election for this new district will be a pure tossup.

VA-01: Far NoVA exurbs and the Shenandoah valley

78W/11B/7H

56M/44O

60R/40D

Representative: Unknown, but definitely a Republican

VA-06: Charlottesville area, Southern Shenandoah valley, Appalachian areas, Roanoke area

84W/10B

48O/52M

47D/53R

Representative: Probably Bob Goodlatte (R), however this district has gotten significantly more Democratic so it might be worth it to find a challenger to him. Tom Perriello could do it if he doesn’t run for senate. Also, Creigh Deeds lives in this district. Maybe we’ll see a Representative Creigh Deeds from here soon, something I’m sure SSpers are excited about. Also, Morgan Griffith lives in Salem, which I put in this district because there is no good reason to have Salem and Roanoke in separate districts. I suspect he moves to the 9th, however

VA-09: Southwest VA

90W/6B

59M/41O

44D/56R

Representative: I believe Morgan Griffith (R) would probably move here and win

VA-05: Piedmont area

69W/27B

45O/55M

44D/56R

Representative: Robert Hurt (R) would run here and be even safer than he is now

VA-04: Similar to what it is now, stretches from Chesapeake/VA Beach up to far-flung exurbs of Richmond

65W/25B

47O/53M

45D/55R

Representative: Randy Forbes (R), possibly Scott Rigell (R) depending on where he lives in VA Beach (anybody know?). If they are in a district together, Forbes would probably win the primary because Rigell is a freshman. Regardless, this district was no longer carried by Obama

VA-03: The most African-American parts of the Newport News area

44W/45B

71O/29M

66D/34R

Representative: Unknown, but likely an African-American Democrat. I decided to draw this as the VRA district for this map. Drawing districts more compactly is terrible for minority representation in Virginia, as the best I could do is a plurality-AA district here. African-Americans still make up a majority of the Democratic primary, and the district is safely Democratic so it would probably elect an AA Democrat. Interestingly, Obama significantly overperformed the average Democrat in this district, probably because of high African-American turnout.

VA-07: All the areas inside the Richmond beltway were 50K short of a district, so I added some areas just outside the beltway, regardless it’s basically a Richmond district

57W/31B/6H/5A

62O/34M

57D/43R

Representative: Maybe Bobby Scott (D), Eric Cantor (R) also lives here. Cantor probably couldn’t win this district, but Scott is also probably a bit to the left of this district. I have to give Scott the advantage, but he might have to actually contest a campaign every now and then.

VA-02:Tidewater area

74W/16B

Dave’s app kind of crapped out on me here and gave me -2,000,000 votes for both candidates, so I don’t know what the numbers are, but regardless it’s safe R

Representative: Rob Wittman (R) would probably win this district. Scott Rigell either lives here or in the 4th, but I suspect he loses the primary either way.

So you have 2 Safe D seats (8th, 3rd), 1 Likely D seat (7th), 1 Lean D seat (11th), 1 Tossup seat(10th), 1 Likely R seat (6th), and 5 Safe R seats (1st, 5th, 9th, 4th, 2nd). I could see the split being anywhere from 8R-3D to 6D-5R. Realistically I think the default standing for the parties is 4D-6R, with the 10th a pure tossup.  

2010 Virginia & Majority-Minority Districts

This is just a quick diary playing around the new version of Dave’s App and the new 2010 Census data for Virginia.

My first interest in playing with the new Census data was to figure out if two African-American-majority districts are possible, as most recent estimates have indicated. They are:

Here are the stats for those districts:

As you can see, it was just possible to make those two districts majority African American.

Here are close-ups of those two districts:

I found NoVA interesting too. In my ACS version of this map, which I don’t think I ever posted, VA-08 and VA-11 both fit entirely within the confines of Fairfax County and the closer-in localities, with a small amount of population left over. This ended up being true in the Census data as well.

What was different was VA-10. The ACS version took up the remainder of Fairfax County, along with all of Prince William, Loudoun, Manassas, and Manassas Park, and then also needed to go into Fauquier. The Census version not only doesn’t go into Fauquier, it takes in only about half of Loudoun (geographically.)

I also thought it was interesting that of the three NoVa districts, it was actually the exurban Prince William-Loudoun hybrid that was closest to being majority-minority.

Here’s a map of a true majority-minority district in NoVa — which doesn’t go into either Arlington or Alexandria(!):

The lime green district has a VRA breakdown of

41 white/18 black/25 hispanic/12 asian/0 native/4 other

The other two districts are 60% white. Obama won all three districts, even with the Loudoun County bug.

Here’s a map with two majority-minority districts:

VA-08 (blue) is 46/10/21/18/0/3. VA-11 (green) is 48/18/19/11/0/4. Pink is 69% white, with Asians as the next largest group at 12%. Obama won all three of these districts as well — interestingly, this is actual a better configuration for him. He won the pink district by about three points more in the 2 majority-minority configuration than in the single. This is primarily because much of Arlington ended up in the pink district.

Other configurations are certainly possible. I suspect, although I haven’t been able to construct it yet, that a majority-minority district where Asians are the second largest group after whites is possible. So far, the best I’ve done puts Hispanics five points ahead of Asians.

Census 2010 Quick Cuts: A 5-5-1 Virginia

As David posted earlier, Census data for the first four states has been released.

Democrats don’t control redistricting in Virginia…but that doesn’t mean it wouldn’t be interesting to see what could happen.

Here’s one proposal, a 5-5-1 map, with the swing district being perfect for a Tom Perriello comeback.

Greetings, loved ones.  Let’s take a journey…

We’ll start out in Hampton Roads:


County Pop Black% Hisp% Asian% Obama% McCain% Deeds% McD%
1 727,092 14.63% 4.50% 3.69% 40.87% 58.15% 30.98% 68.93%
Accomack 33,164 28.05% 8.59% 0.55% 48.69% 50.14% 37.56% 62.42%
Chesapeake City 142,972 19.74% 3.66% 3.08% 40.39% 58.73% 31.76% 68.16%
Gloucester 36,858 8.67% 2.54% 0.78% 35.98% 62.89% 27.77% 72.09%
Hanover 61,394 7.67% 2.06% 1.54% 29.98% 69.24% 20.95% 78.94%
James City 56,095 11.96% 4.01% 2.26% 44.34% 54.78% 33.85% 66.03%
Mathews 8,978 9.17% 1.16% 0.35% 35.55% 63.53% 29.96% 69.92%
Middlesex 10,959 18.05% 1.51% 0.34% 39.81% 59.02% 30.43% 69.52%
New Kent 18,429 13.48% 2.12% 0.88% 34.96% 63.91% 25.47% 74.43%
Northampton 12,389 36.55% 7.05% 0.67% 57.70% 41.19% 48.86% 51.03%
Poquoson City 12,150 0.64% 1.82% 2.14% 24.74% 74.01% 19.78% 80.16%
Virginia Beach City 301,190 14.05% 5.77% 5.97% 44.17% 54.80% 33.24% 66.67%
York 32,514 6.34% 3.29% 3.56% 35.23% 63.69% 27.26% 72.65%

Rob Wittman’s 1st district shifts eastward, now taking in part of the Northern Neck, the Virginia section of the Delmarva, and parts of Virginia Beach and Chesapeake City. A side consequence of this would be the turf war between Wittman and Scott Rigell, as this district is 22% from the old 1st and 48% from the old 2nd. Nothing much else to see here, Obama lost by 17, Deeds by 38, Steve Shannon (2009 Dem AG nominee) by 35, and Jody Wagner (2009 Dem LG nominee) by 29.


County Pop Black% Hisp% Asian% Obama% McCain% Deeds% McD%
2 727,700 38.14% 7.08% 3.93% 64.62% 34.46% 51.85% 48.03%
Chesapeake City 79,237 47.98% 5.64% 2.50% 69.76% 29.49% 59.19% 40.73%
Hampton City 96,757 42.01% 4.83% 2.51% 63.23% 35.91% 50.30% 49.57%
James City 10,914 19.20% 7.07% 2.19% 48.64% 50.46% 36.88% 63.09%
Newport News City 114,167 34.85% 9.71% 3.75% 60.62% 38.53% 46.36% 53.53%
Norfolk City 242,803 43.11% 6.65% 3.29% 71.03% 28.06% 60.08% 39.79%
Virginia Beach City 136,804 31.89% 8.49% 6.42% 62.03% 37.00% 46.33% 53.57%
Williamsburg City 14,068 13.99% 6.69% 5.74% 63.77% 34.67% 54.60% 45.26%
York 32,950 20.30% 5.53% 6.21% 47.38% 51.55% 35.25% 64.58%

Bobby Scott’s current 3rd is clearly overpacked, with the choicest parts of Hampton, Norfolk, Newport News, and Portsmouth dumped into his district. We unpack the 3rd a bit, lending some of its Democratic strength here.  This new district contains the entirety of Norfolk, parts of Newport News, Chesapeake, and VA Beach.  There’s also an arm to grab Williamsburg,  one of the few instances in this area of relatively white precincts voting Dem.  19% old 1st, 37% old 2nd, and 33% old 3rd, we get a district that Obama won by 30% (!!), and was even carried by all three Dems in 2009.


County Pop Black% Hisp% Asian% Obama% McCain% Deeds% McD%
3 727,246 50.91% 5.89% 1.84% 71.40% 27.79% 60.71% 39.13%
Charles City 7,256 48.42% 1.21% 0.34% 68.34% 31.01% 58.53% 41.38%
Chesterfield 56,895 42.34% 17.85% 2.96% 66.34% 32.93% 54.21% 45.58%
Hampton City 40,679 67.49% 3.84% 1.38% 82.45% 16.87% 74.80% 25.03%
Henrico 145,098 51.47% 5.37% 2.45% 70.10% 29.14% 60.91% 38.95%
Hopewell City 22,591 37.04% 6.55% 0.80% 55.49% 43.56% 37.38% 62.39%
Isle Of Wight 22,515 26.29% 1.91% 0.95% 44.01% 55.21% 34.97% 64.94%
Newport News City 66,552 50.67% 3.76% 1.01% 68.96% 30.31% 55.37% 44.52%
Petersburg City 32,420 79.11% 3.75% 0.82% 88.64% 10.19% 80.99% 18.97%
Portsmouth City 95,535 53.26% 3.06% 1.07% 69.27% 29.97% 59.76% 40.18%
Prince George 26,433 35.43% 6.87% 1.67% 47.60% 51.60% 31.72% 68.17%
Richmond City 204,214 50.60% 6.27% 2.33% 79.09% 20.03% 69.23% 30.55%
Surry 7,058 46.10% 1.22% 0.34% 60.72% 38.45% 53.61% 46.18%

The 3rd, having been unpacked, sees its black percentage drop from 56% to 51%. However, the VAP also remains over 50% African-American. In what would be a relief to Randy Forbes, Petersburg is removed from this district, which becomes more Richmond-centric. 59% old 3rd, 20% old 7th, and 15% old 4th. Obama dominated here (no surprise), and all three Dems in 09 scored 20%+ wins.


County Pop Black% Hisp% Asian% Obama% McCain% Deeds% McD%
4 727,955 17.68% 3.79% 3.88% 42.13% 56.97% 30.93% 68.95%
Amelia 12,690 23.10% 2.29% 0.21% 38.11% 60.81% 28.85% 71.10%
Chesterfield 259,341 17.48% 4.90% 3.32% 42.25% 56.88% 30.45% 69.38%
Colonial Heights City 17,411 10.24% 3.87% 3.32% 28.95% 69.63% 16.83% 83.14%
Dinwiddie 28,001 32.87% 2.41% 0.44% 48.45% 50.62% 37.34% 62.60%
Fluvanna 25,691 15.33% 2.96% 0.57% 48.57% 50.41% 36.48% 63.39%
Franklin City 4,422 25.28% 2.53% 1.40% 38.99% 60.08% 32.73% 67.27%
Goochland 21,717 19.25% 2.10% 1.04% 38.31% 60.84% 29.11% 70.77%
Hanover 38,469 11.95% 2.21% 1.05% 37.48% 61.65% 28.09% 71.75%
Henrico 161,837 9.88% 4.46% 10.20% 43.75% 55.40% 31.29% 68.58%
Isle Of Wight 12,755 21.90% 1.79% 0.53% 40.77% 58.29% 32.36% 67.61%
Louisa 33,153 17.71% 2.30% 0.48% 45.45% 53.29% 34.58% 65.34%
Nottoway 15,853 39.28% 3.84% 0.32% 48.84% 50.07% 41.58% 58.28%
Powhatan 28,046 13.63% 1.79% 0.47% 29.31% 69.78% 20.03% 79.85%
Prince George 9,292 22.22% 2.60% 1.10% 38.52% 60.75% 29.86% 70.09%
Southampton 8,698 24.88% 0.86% 0.39% 39.95% 59.19% 33.08% 66.89%
Suffolk City 41,589 27.77% 2.93% 2.29% 44.48% 54.73% 35.79% 64.17%
Sussex 8,990 57.33% 2.49% 0.46% 57.72% 41.49% 42.28% 57.72%

With the eastward shift of the 1st, the 4th and 7th also rotate accordingly along the Richmond-Norfolk axis created by the 2nd and 3rd. Nothing to see here, other than we’ve cut out part of Forbes base and drew in much of the old 7th (53% is from the old 7th, compared to 43% old 4th). But Cantor could clearly run in the new 7th and Forbes in the new 4th.  Dems in 09 lost by 30%+.


County Pop Black% Hisp% Asian% Obama% McCain% Deeds% McD%
5 727,351 29.89% 3.43% 2.03% 57.47% 41.45% 47.35% 52.54%
Albemarle 98,970 9.70% 5.47% 4.67% 58.43% 40.36% 49.41% 50.48%
Amherst 12,637 22.50% 1.75% 0.51% 47.46% 51.77% 38.61% 61.39%
Brunswick 17,434 57.31% 1.71% 0.28% 62.84% 36.35% 49.41% 50.49%
Buckingham 17,146 35.08% 1.68% 0.37% 49.89% 49.01% 36.60% 63.40%
Charlotte 12,586 29.80% 1.91% 0.21% 43.93% 54.77% 33.24% 66.62%
Charlottesville City 43,475 19.41% 5.11% 6.37% 78.35% 20.35% 73.65% 26.21%
Cumberland 10,052 32.61% 1.80% 0.35% 47.73% 51.19% 35.87% 64.09%
Danville City 43,055 48.30% 2.89% 0.94% 59.13% 40.02% 44.93% 54.96%
Emporia City 5,927 62.53% 4.42% 0.73% 65.04% 34.28% 47.57% 52.35%
Franklin 38,514 8.83% 2.68% 0.49% 39.06% 59.55% 31.66% 68.25%
Franklin City 4,160 90.53% 0.70% 0.05% 94.65% 4.88% 91.81% 8.06%
Greensville 12,243 59.80% 1.41% 0.29% 63.88% 35.38% 52.64% 47.36%
Halifax 36,241 36.68% 1.62% 0.37% 48.23% 51.04% 38.25% 61.53%
Henry 11,930 39.81% 5.58% 0.45% 57.61% 41.49% 51.27% 48.73%
Lunenburg 12,914 34.75% 3.64% 0.19% 47.84% 51.33% 37.45% 62.52%
Lynchburg City 25,110 53.21% 2.53% 0.67% 71.04% 27.58% 61.07% 38.72%
Martinsville City 13,821 44.95% 3.99% 0.93% 63.48% 35.44% 51.66% 48.18%
Mecklenburg 32,727 36.82% 2.46% 0.67% 47.26% 51.83% 32.32% 67.67%
Montgomery 46,128 3.37% 2.88% 7.02% 58.99% 39.52% 53.93% 45.87%
Nelson 15,020 13.10% 3.06% 0.45% 53.99% 44.84% 46.23% 53.67%
Pittsylvania 37,893 26.92% 1.56% 0.19% 42.81% 56.26% 32.76% 67.24%
Prince Edward 23,368 33.19% 2.25% 0.88% 54.34% 44.46% 44.95% 54.97%
Roanoke 3,003 3.13% 0.93% 0.27% 40.93% 57.70% 31.39% 68.51%
Roanoke City 97,032 28.46% 5.51% 1.76% 61.15% 37.76% 51.89% 48.01%
Southampton 9,872 48.14% 1.30% 0.12% 57.84% 41.21% 48.82% 51.13%
Suffolk City 42,996 57.15% 2.78% 0.92% 69.00% 30.31% 55.41% 44.47%
Sussex 3,097 60.35% 1.42% 0.23% 69.11% 30.45% 57.34% 42.66%

A leaner, meaner 5th for Tom Perriello.  We could have also tried to bring back Rick Boucher, but when you’re forced to decide between a young up-and-coming progressive vs. a career Blue Dog in a more hostile district, the choice is obvious. This is a pretty blatant gerrymander, meant to string together all the Dems in Southside and to connect them to Dems in Charlottesville, Roanoke, … and even Blacksburg. The result is a district Obama won by 16%, a massive improvement from the 3% loss he earned in the old 5th.  63% of the population is retained, along with 19% of the old 6th. Deeds kept it respectable, losing by 5; Shannon lost by 6 and Wagner by 3.


County Pop Black% Hisp% Asian% Obama% McCain% Deeds% McD%
9 727,482 4.65% 1.92% 0.90% 37.28% 61.12% 30.64% 69.28%
Bland 6,824 3.34% 0.57% 0.26% 29.20% 68.64% 24.06% 75.88%
Bristol City 17,835 5.66% 1.24% 0.68% 36.21% 62.22% 27.48% 72.44%
Buchanan 24,098 2.56% 0.39% 0.22% 46.52% 51.99% 36.74% 63.22%
Carroll 30,042 0.59% 2.58% 0.18% 32.67% 65.08% 26.96% 72.97%
Craig 5,190 0.10% 0.69% 0.15% 33.46% 64.67% 32.17% 67.76%
Dickenson 15,903 0.32% 0.54% 0.11% 48.54% 49.22% 39.46% 60.46%
Floyd 15,279 1.83% 2.70% 0.23% 39.08% 59.09% 34.08% 65.77%
Franklin 17,645 6.66% 2.23% 0.35% 34.81% 63.58% 29.69% 70.26%
Galax City 7,042 6.23% 14.04% 0.53% 43.80% 54.83% 37.38% 62.40%
Giles 17,286 1.51% 1.21% 0.32% 40.95% 57.24% 36.56% 63.35%
Grayson 15,533 2.06% 2.68% 0.10% 34.35% 62.88% 29.71% 70.29%
Henry 42,221 16.80% 4.45% 0.43% 39.85% 58.67% 32.38% 67.61%
Lee 25,587 3.70% 1.59% 0.22% 34.89% 63.13% 25.71% 74.27%
Montgomery 48,264 4.48% 2.50% 3.89% 41.25% 57.32% 35.04% 64.83%
Norton City 3,958 6.32% 1.72% 1.41% 49.14% 49.21% 39.34% 60.55%
Patrick 18,490 5.87% 2.40% 0.23% 33.75% 64.37% 29.86% 70.04%
Pittsylvania 25,613 14.91% 2.89% 0.42% 30.51% 68.54% 23.11% 76.89%
Pulaski 34,872 5.04% 1.24% 0.51% 39.32% 58.85% 34.84% 65.12%
Radford City 16,408 7.79% 2.35% 1.56% 53.97% 44.54% 45.33% 54.56%
Roanoke 59,667 5.22% 2.27% 3.29% 39.92% 58.89% 32.83% 67.01%
Russell 28,897 0.81% 0.95% 0.18% 42.91% 55.59% 37.55% 62.42%
Salem City 24,802 7.11% 2.42% 1.62% 41.63% 57.13% 33.39% 66.45%
Scott 23,177 0.58% 1.01% 0.16% 27.59% 70.68% 21.14% 78.81%
Smyth 32,208 1.99% 1.64% 0.25% 34.46% 63.54% 26.38% 73.53%
Tazewell 45,078 2.96% 0.66% 0.64% 32.80% 65.65% 26.58% 73.36%
Washington 54,876 1.26% 1.32% 0.37% 32.91% 65.62% 25.10% 74.87%
Wise 41,452 5.16% 1.14% 0.34% 35.33% 63.05% 29.55% 70.33%
Wythe 29,235 2.80% 0.96% 0.44% 32.88% 65.70% 27.24% 72.63%

There simply isn’t enough Democratic strength down here to support both Perriello and Boucher, and protecting Boucher would likely be a poor investment given the political trends.  We cede this district to Morgan Griffith, who retains 81% of his current territory.  With the adjustments to help Perriello, we see a bit of a shift rightward, with Obama losing by 24. Again, all the 09 Dems lost by 35%+.


County Pop Black% Hisp% Asian% Obama% McCain% Deeds% McD%
6 726,966 7.04% 3.79% 1.10% 36.94% 61.83% 29.18% 70.72%
Alleghany 16,250 4.68% 1.08% 0.23% 48.22% 50.41% 61.23% 38.71%
Amherst 19,716 16.76% 2.05% 0.46% 38.06% 60.93% 28.68% 71.25%
Appomattox 14,973 20.08% 1.12% 0.23% 34.61% 64.26% 25.65% 74.33%
Augusta 73,750 3.97% 2.07% 0.50% 29.47% 69.35% 22.53% 77.40%
Bath 4,731 4.69% 2.13% 0.15% 42.89% 55.47% 63.47% 36.47%
Bedford 68,676 5.74% 1.59% 1.03% 30.75% 68.16% 22.87% 77.07%
Bedford City 6,222 20.19% 2.15% 0.66% 44.18% 54.75% 35.25% 64.75%
Botetourt 33,148 3.03% 1.07% 0.53% 32.71% 65.90% 28.56% 71.26%
Buena Vista City 6,650 5.22% 1.55% 0.44% 45.73% 52.91% 39.05% 60.95%
Campbell 54,842 14.16% 1.67% 1.00% 31.34% 67.58% 22.90% 76.92%
Covington City 5,961 12.51% 1.54% 0.57% 55.40% 43.33% 65.79% 34.07%
Frederick 42,487 2.93% 4.92% 0.80% 36.23% 62.27% 23.78% 76.07%
Greene 18,403 6.34% 4.24% 1.40% 38.43% 60.29% 27.37% 72.53%
Harrisonburg City 48,914 6.36% 15.67% 3.51% 57.54% 41.21% 42.16% 57.67%
Highland 2,321 0.26% 0.78% 0.17% 37.97% 59.85% 44.93% 55.07%
Lexington City 7,042 9.66% 3.85% 2.20% 62.24% 36.87% 60.53% 39.34%
Lynchburg City 50,458 17.40% 3.30% 3.37% 37.43% 61.36% 30.31% 69.59%
Madison 13,308 9.78% 1.77% 0.56% 42.72% 56.10% 30.46% 69.47%
Page 24,042 1.94% 1.55% 0.30% 40.76% 58.16% 29.73% 70.15%
Roanoke 29,706 4.84% 1.92% 1.67% 36.46% 62.48% 29.68% 70.19%
Rockbridge 22,307 2.66% 1.33% 0.47% 42.64% 56.22% 41.88% 58.07%
Rockingham 76,314 1.67% 5.34% 0.60% 31.36% 67.40% 21.75% 78.14%
Shenandoah 41,993 1.75% 6.14% 0.52% 35.96% 62.45% 25.00% 74.85%
Staunton City 23,746 12.15% 2.16% 0.78% 50.56% 48.39% 41.40% 58.54%
Waynesboro City 21,006 10.61% 6.36% 0.73% 44.09% 54.35% 30.97% 68.91%

Again, nothing to see here. Goodlatte retains 68% of his old territory, a strip along the Blue Ridge. The 2009 Dems lost by 40%+; Warner only won by 10 here in 2008.


County Pop Black% Hisp% Asian% Obama% McCain% Deeds% McD%
7 727,428 15.09% 7.03% 1.94% 46.08% 52.82% 33.13% 66.74%
Caroline 28,545 29.34% 3.36% 0.62% 55.45% 43.48% 43.47% 56.47%
Clarke 14,034 5.32% 3.49% 0.90% 46.52% 51.68% 36.59% 63.31%
Culpeper 46,689 15.78% 8.90% 1.30% 44.59% 54.26% 29.61% 70.25%
Essex 11,151 38.09% 3.13% 0.77% 54.70% 44.35% 39.19% 60.81%
Fauquier 65,203 8.16% 6.41% 1.28% 42.71% 56.19% 31.10% 68.77%
Frederick 35,818 5.39% 8.59% 1.76% 41.35% 57.16% 26.68% 73.19%
Fredericksburg City 24,286 22.64% 10.73% 2.84% 63.60% 35.27% 50.84% 48.94%
King & Queen 6,945 28.44% 2.65% 0.24% 51.77% 47.58% 41.03% 58.87%
King George 23,584 17.87% 3.35% 1.16% 42.71% 56.22% 29.69% 70.18%
King William 15,935 17.69% 2.03% 0.74% 39.87% 59.20% 28.40% 71.54%
Lancaster 11,391 27.95% 1.04% 0.57% 46.63% 52.57% 35.16% 64.59%
Northumberland 12,330 25.33% 3.10% 0.30% 44.72% 54.56% 34.39% 65.41%
Orange 33,481 12.71% 3.40% 0.73% 44.98% 53.83% 32.66% 67.28%
Prince William 48,819 7.26% 8.41% 5.35% 40.63% 58.36% 29.10% 70.79%
Rappahannock 7,373 4.35% 3.09% 0.53% 47.79% 50.56% 42.20% 57.70%
Richmond 9,254 30.30% 5.51% 0.43% 43.20% 55.86% 31.69% 68.26%
Spotsylvania 122,397 15.25% 7.58% 2.31% 46.05% 52.91% 31.51% 68.35%
Stafford 128,961 16.97% 9.21% 2.81% 46.37% 52.69% 32.44% 67.39%
Warren 37,575 4.62% 3.51% 0.96% 43.39% 55.06% 31.32% 68.58%
Westmoreland 17,454 28.02% 5.74% 0.57% 54.64% 44.40% 41.38% 58.57%
Winchester City 26,203 10.93% 15.42% 2.33% 52.02% 46.66% 39.18% 60.67%

We could try to screw Eric Cantor out of a district, but again, that wouldn’t necessarily be successful. Democratic voters(which would have likely had to come from NoVA) are better kept in the three decently solidly Dem NoVA districts. Without touching the Dems in NoVA though, we still try to draw as Democratic a district as possible, taking in various parts of the Northern Neck and the DC exurbs.  Hopefully, those areas – Fauquier, Culpeper, Winchester, etc. – will keep drifing left as DC’s influence grows. While Obama lost by 7 here, there are still miles to go, with the 09 Dems having lost by 30% or more.  56% of this district is from the old 1st, 17% from the old 7th, and 21% from the old 10th (showing some of the growth it’s experienced).


County Pop Black% Hisp% Asian% Obama% McCain% Deeds% McD%
8 727,839 9.84% 13.29% 11.17% 63.39% 35.60% 53.71% 46.10%
Alexandria City 139,966 21.78% 16.09% 6.02% 71.73% 27.26% 62.76% 37.04%
Arlington 207,627 8.49% 15.11% 9.60% 71.71% 27.12% 65.49% 34.26%
Fairfax 82,317 2.50% 6.38% 16.70% 56.50% 42.63% 48.79% 51.06%
Falls Church City 12,332 4.31% 8.99% 9.42% 69.56% 29.19% 64.92% 34.94%
Loudoun 285,597 7.31% 12.76% 13.32% 53.59% 45.48% 38.92% 60.94%

Again, a shameless gerrymander.  But, we did manage to keep Alexandria and Arlington intact. Jim Moran probably needs a little more support than most Dems, which also factored into this decision. He keeps 52% of his old territory, with the balance coming from the 10th. Obama romped with a 28% victory, and Deeds even scored an 8% win here.


County Pop Black% Hisp% Asian% Obama% McCain% Deeds% McD%
10 726,728 6.69% 14.60% 20.33% 59.46% 39.56% 48.16% 51.68%
Fairfax 677,449 6.75% 14.82% 20.12% 59.69% 39.33% 48.49% 51.34%
Fairfax City 22,565 4.75% 15.76% 15.21% 57.69% 41.16% 46.91% 52.98%
Loudoun 26,714 6.85% 7.98% 29.86% 54.50% 44.69% 37.43% 62.46%

The 10th has grown massively, and accordingly, needed to contract. This iteration of the 10th becomes an almost all-Fairfax affair, with a slight section of Loudoun added. This would have swingy-ish characteristics in bad years, but Obama won by 20 and Deeds only lost by 3.5; both Shannon and Wagner won here as well.  Only 30%, though, is from the old 10th (30%), with more being from the old 11th (54%); this district is probably a bit more inner suburban than outer (think Annandale v. Sterling).


County Pop Black% Hisp% Asian% Obama% McCain% Deeds% McD%
11 727,237 18.72% 21.55% 9.69% 61.05% 38.08% 46.98% 52.89%
Fairfax 321,960 15.98% 19.52% 12.30% 62.16% 36.93% 50.62% 49.23%
Manassas City 37,821 13.72% 31.40% 4.98% 55.17% 43.85% 38.00% 61.92%
Manassas Park City 14,273 12.98% 32.54% 8.97% 59.49% 39.47% 39.83% 60.17%
Prince William 353,183 21.99% 21.90% 7.84% 60.51% 38.66% 43.76% 56.10%

Gerry Connolly’s district shifts southward a bit, taking in more of Prince William County.  But unlike before, this district takes in the southern (and Democratic) part of PW.  Connolly retains 47% of his old territory, but the parts he sheds he won’t necessarily miss.  Interestingly, Obama did better here than in the new 10th (23 point win), but this area swung harder against the Dems in 09, with Shannon and Wagner losing by 1 and Deeds by 6. This, of course, is still an improvement over the 10-point loss Deeds suffered in the current 11th.

LA, MS, NJ, VA: Population by CD for First Four States

As devoted Swingnuts are aware by now, the Census Bureau has produced its first batch of redistricting-level data. Because Louisiana, Mississippi, New Jersey and Virginia all have state-level elections this year, they get bumped to the head of the line. So that means we now know the current population of each congressional district as presently drawn. While the Census Bureau didn’t exactly make this data available in the most accessible format, the greasemonkeys down in the Skunkworks at SSP Labs have crunched the numbers, and here’s what they look like. Note that the “Deviation” column means how far off each current district is from the new ideal (and in the case of LA and NJ, we divided by their new seat totals of 6 and 12 respectively):


District Population Deviation
LA-01 686,961 (68,601)
LA-02 493,352 (262,210)
LA-03 637,371 (118,191)
LA-04 667,109 (88,453)
LA-05 644,296 (111,266)
LA-06 727,498 (28,064)
LA-07 676,785 (78,777)
Total: 4,533,372


District Population Deviation
MS-01 788,095 46,271
MS-02 668,263 (73,561)
MS-03 756,924 15,100
MS-04 754,015 12,191
Total: 2,967,297


District Population Deviation
NJ-01 669,169 (63,489)
NJ-02 692,205 (40,453)
NJ-03 680,341 (52,317)
NJ-04 724,596 (8,062)
NJ-05 666,551 (66,107)
NJ-06 668,806 (63,852)
NJ-07 672,885 (59,773)
NJ-08 660,424 (72,234)
NJ-09 661,379 (71,279)
NJ-10 634,343 (98,315)
NJ-11 674,349 (58,309)
NJ-12 701,881 (30,777)
NJ-13 684,965 (47,693)
Total: 8,791,894


District Population Deviation
VA-01 786,237 58,871
VA-02 646,184 (81,182)
VA-03 663,390 (63,976)
VA-04 738,639 11,273
VA-05 685,859 (41,507)
VA-06 704,056 (23,310)
VA-07 757,917 30,551
VA-08 701,010 (26,356)
VA-09 656,200 (71,166)
VA-10 869,437 142,071
VA-11 792,095 64,729
Total: 8,001,024

Redistricting the Virginia State Senate: Can Democrats Maintain a Majority?

The problem: Democrats are going into redistricting with a 22-18 advantage in the Virginia State Senate. They have to either hold on to 21 of those seats or carve out new seats that they can win. The question is, can they succeed? I’ve tried my best to come up with a map that gives Democrats a good chance at holding their majority.
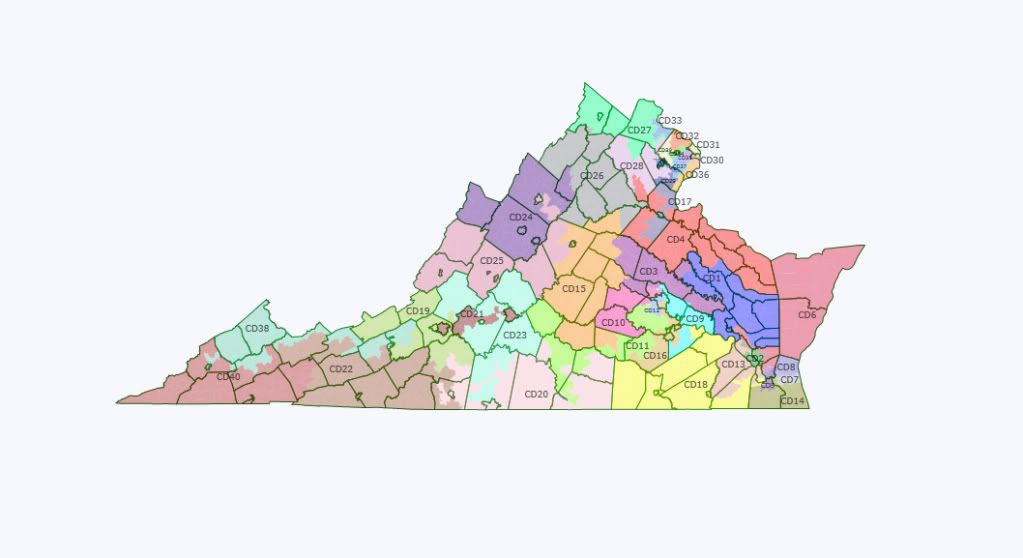
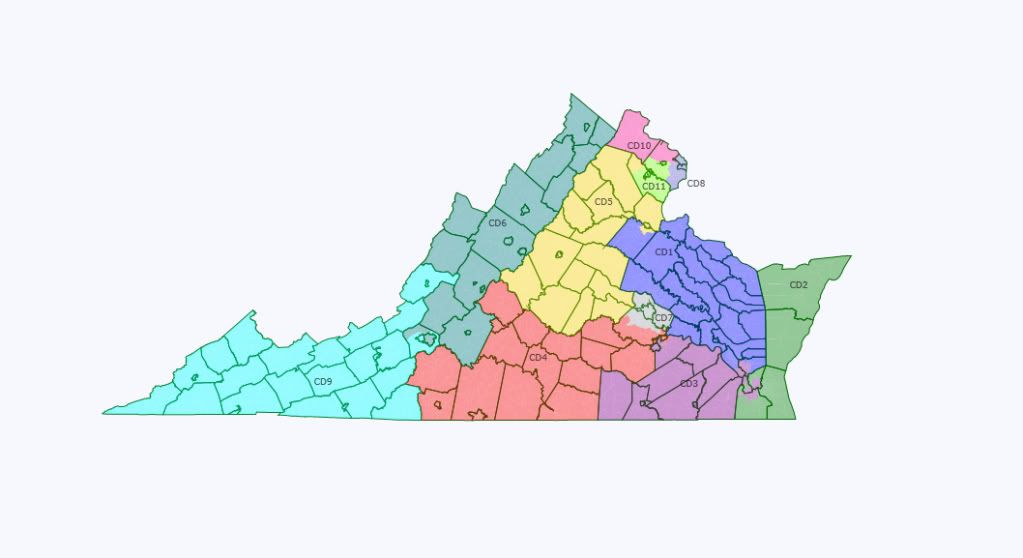
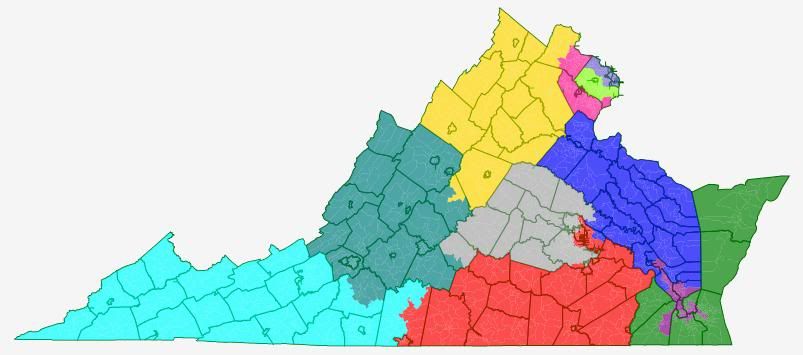
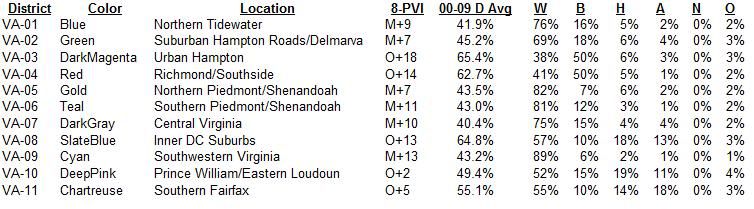
State Map


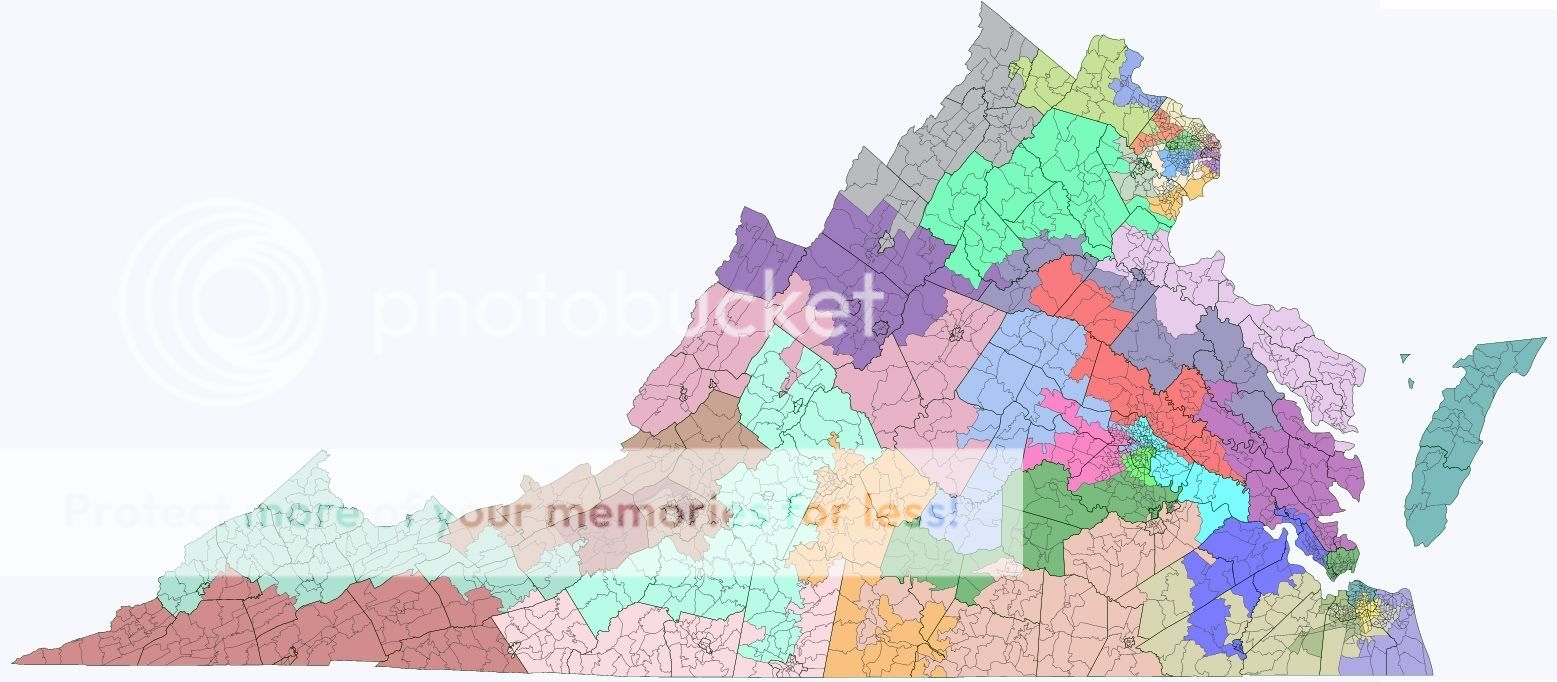
Click for bigger view.

As you can see, it ain’t pretty. I attempted to maintain as much population equality as possible, trying to keep districts under 1,000 population variance; with districts that are targeted around 194,000 people, this is well within the normal variance allowed for state legislative districts. The Democrats may be able to massage the numbers some more than I was willing to try. To compare, you can see the 2007 results and existing Senate districts at the Virginia Public Access Project.

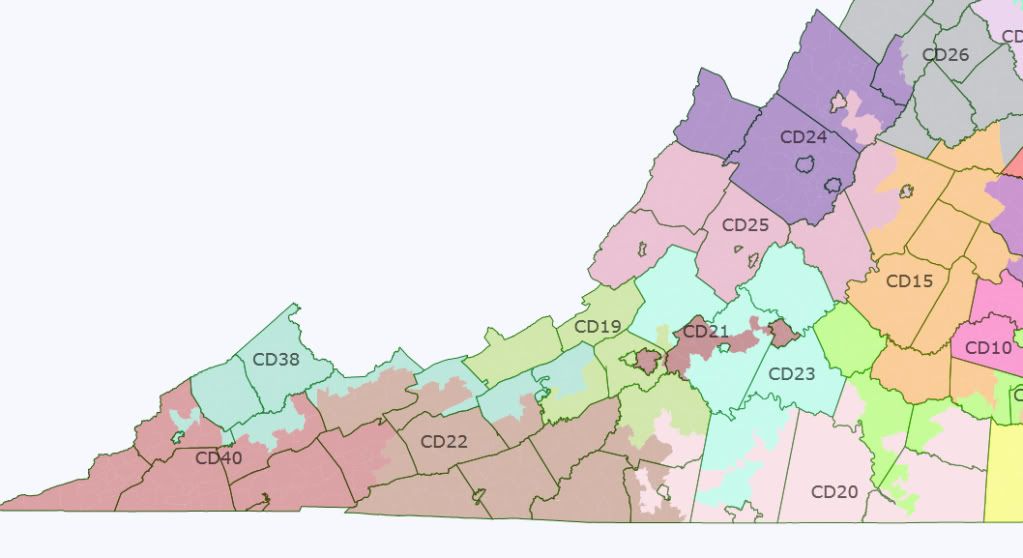
We’ll start in Southwestern Virginia and work our way around the state.

SD-40, incumbent: William Wampler Jr. (R)

Not much you can do with this part of the state. It’s pretty much the same as the existing district, except expanded a bit to the east to up the population.

SD-38, incumbent: Phil Puckett (D)

Believe it or not, Puckett went unopposed in 2007. Given the extreme shift away from the Democrats that this part of the state has undergone in the past couple years, I can’t imagine that will be the case this year. Again, there’s not much you can do here; the best I could do was stretch the district out to pull in Radford from SD-22.

SD-20, incumbent: Roscoe Reynolds (D)

Reynolds did have an opponent in 2007, but trounced him. I tried to help him out by putting Danville into the district, along with some parts of Pittsylvania County that have a high African-American population. The district’s black population is 25%.

SD-21, incumbent: John Edwards (D)

No, not that John Edwards. This is the one safe Democratic district this far south, as it contains Montgomery County, Roanoke, and not much else.

SD-22, incumbent: Ralph Smith (R)

Smith knocked off the incumbent in a primary in 2007, then barely beat the Democratic candidate. Rather than try to replicate that feat (because, quite frankly, if they couldn’t win it in 2007, they’re not going to win it in 2011), I just dumped all of the Roanoke suburbs into the district, so it will be safe for the Republicans.

SD-23, incumbents: Steve Newman (R), William Stanley (R)

A district had to be eliminated and spirited off to Northern Virginia, and the obvious choice is the existing 19th, as it has some Dem-friendly parts that can be appended to the 20th, and Stanley is the junior-most Senator, having just been elected this month. This is an extremely Republican district consisting of a rural swath of land between Lynchburg and Roanoke.

SD-15, incumbent: Frank Ruff (R)

Another very Republican district dominated by Lynchburg and Amherst County. It stretches down to the North Carolina border because Ruff lives in the very southeastern tip of the district.

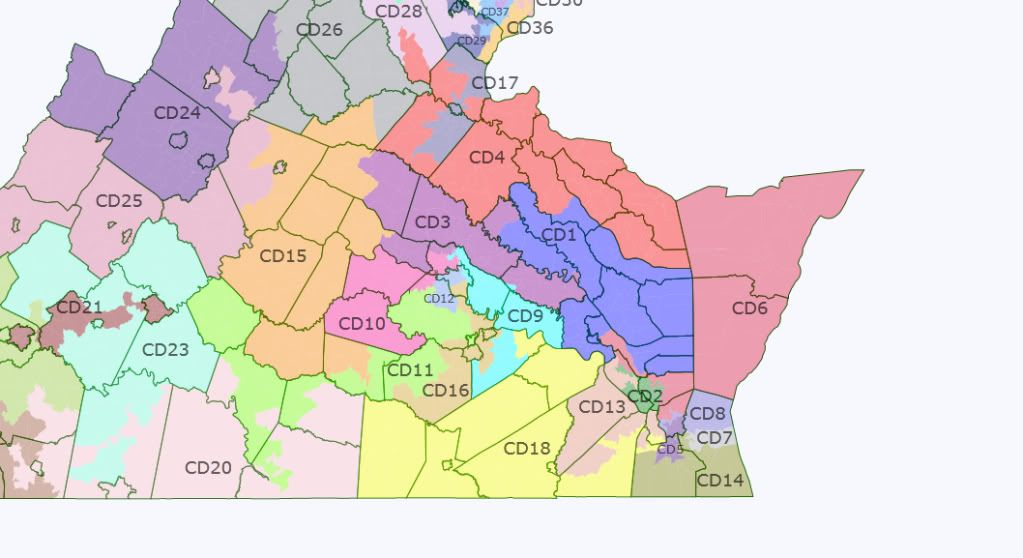
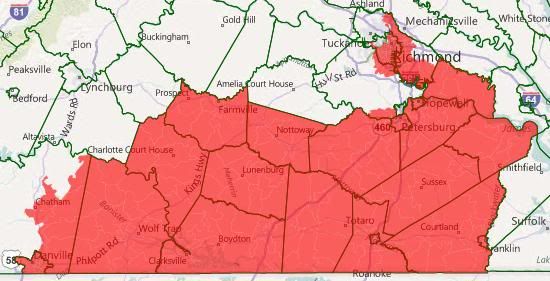
On to Southside and Richmond…

SD-13, incumbent: none

This is where the Democrats need to get creative. The 13th used to be Republican Fred Quayle’s district, stretching from Portsmouth to Hopewell; I’ve created a district to replace it centered in Emporia, Petersburg, and the Southside counties with high black populations. In fact, this district is very narrowly majority-black (50.2%). It should be a prime pickup opportunity for the Democrats.

SD-11, incumbent: Stephen Martin (R) (possibly)

Martin’s residence is just listed as “Chesterfield County” on Wikipedia, and there’s nothing on his campaign website that says where in the county he lives, but this is the district he would run in. It’s a solidly Republican district that takes in Amelia and Nottoway Counties as well as part of Chesterfield.

SD-10, incumbent: John Watkins (R)

Watkins does live in this district. It’s another solidly-Republican suburban Richmond district.

SD-12, incumbent: Walter Stosch (R) (possibly)

Again, Stosch is just listed as being in Henrico County, which is chopped up between four districts. This is an attempt to create as Dem-friendly a district as possible. It’s still a Republican-leaning district, but it’s more likely a 55-45 district than the 60-40 district it is now.

SD-16, incumbent: Henry Marsh (D)

Marsh’s district was drawn to soak up as many black voters as possible. I’ve dropped it down to 51% black, as it loses the southern end of the district, including Petersburg. Still safe Dem.

SD-9, incumbent: Don McEachin (D)

This one loses part of Richmond and gains more of Henrico. Still majority-black, at 52%, and safe Dem.

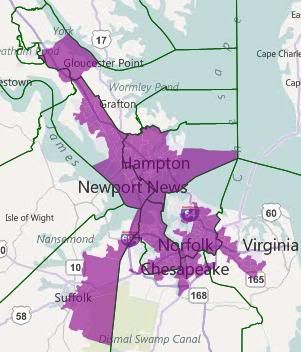
Now we’re on to my part of the state, Hampton Roads.

SD-1, incumbent: John Miller (D)

Miller barely beat a nutcase back in 2007, so he really needs a better district. I axed the Poquoson/York/Hampton part of the district, gave him all of Newport News, and ran the district up to Williamsburg and across the James River to Surry/Sussex/Franklin. It should make his district much less Republican.

SD-2, incumbent: Mamie Locke (D)

Locke’s district consists of all of Hampton and the southern end of Newport News. Remains majority-black at 53%. Safe Dem.

SD-18, incumbent: Louise Lucas (D)

Maintains the African-American majority (53% black) without the ridiculous stretched-across-a-third-of-the-state shape that it has currently. Most of Portsmouth and part of Suffolk.

SD-5, incumbent: Yvonne Miller (D)

Another majority-black district; it’s the minority-heavy parts of Norfolk, Chespeake, and a few precincts from Virginia Beach. 55% black, safe Dem.

SD-6, incumbent: Ralph Northam (D)

Northam’s district is the white-majority half of Norfolk, the Eastern Shore, and one or two precincts in Virginia Beach. It’s 27% black. Should be pretty safe for Northam.

SD-7, incumbent: Frank Wagner (R) (possibly)

Wagner may or may not live here, I have no idea. He’s somewhere in Virginia Beach. This was an attempt to create as Dem-friendly a district as you can get in Virginia Beach. It’s certainly more diverse than the city at-large; it’s 60% white, 23% black, 7% Asian, and 7% Hispanic. It would still be an uphill climb for a Democrat to win here, but it is at least possible.

SD-8, incumbent: Jeff McWaters (R)

I’m pretty sure McWaters lives here, though. It’s the very Republican Virginia Beach/Chesapeake district.

SD-14, incumbent: Harry Blevins (R) (possibly), Fred Quayle (R)

Again, Blevins lives in Chesapeake, but I have no idea where. Quayle lives in Suffolk, but he’s probably retiring regardless of how the map looks, so that doesn’t matter. This district takes in the white parts of Chesapeake, Suffolk, Portsmouth, as well as parts of Sussex, Southampton, and Isle of Wight Counties. It should be a pretty Republican district.

Okay, that was a lot. Let’s move on to the Tidewater area.

SD-3, incumbent: Tommy Norment (R)

Norment gets a district consisting of a swath of Republican areas between Newport News and the Northern Neck.

SD-4, incumbent: Ryan McDougle (R)

This district actually shrinks, which is a good thing, because it contains some swing counties that I needed for the 17th. It’s centered in the Hanover County exurbs, which are bright-red.

SD-17, incumbent: Edd Houck (D)

A ridiculous snake of a district that attempts to shore up Houck as much as possible. He lives in Spotsylvania, and it stretches from Culpeper in the northwest down to King & Queen and Essex Counties in the southeast.

SD-28, incumbent: Richard Stuart (R)

Northern Neck to Stafford. Actually shrinks, since it used to go all the way up to Fauquier. Should remain in Republican hands; Del. Al Pollard would be about the only candidate to make it competitive, and he lost when the seat was open in 2007.

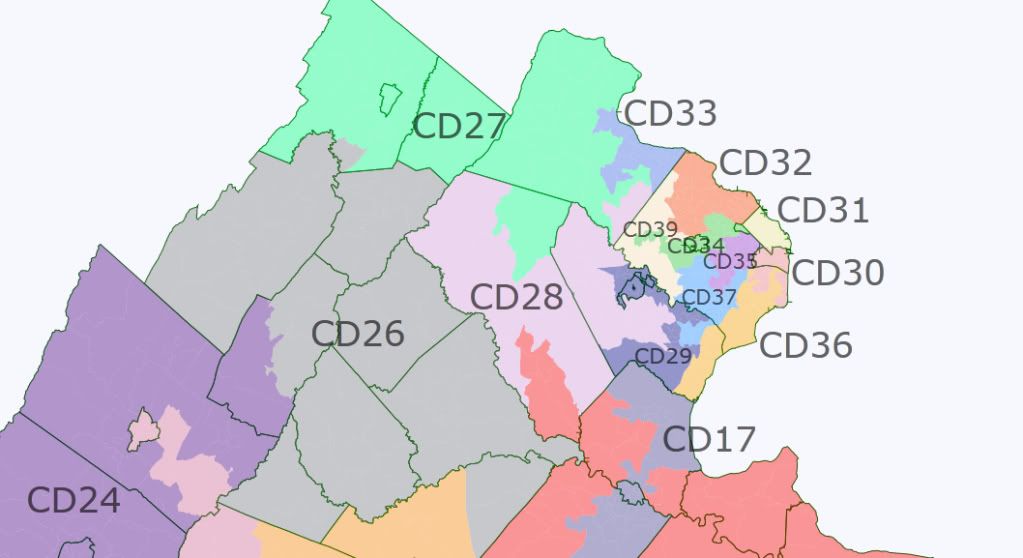
Okay, two more regions to go. First is the Shenandoah Valley.

SD-25, incumbent: Creigh Deeds (D)

The Deeds district. Pretty much the same as before, should remain safe Dem, as the population is centered in Albemarle/Charlottesville.

SD-24, incumbent: Emmett Hanger (R)

Not much changes here; still a heavily Republican district in Augusta/Rockingham.

SD-26, incumbent: Mark Obenshain (R)

Same as above. Stretches up to Frederick County to pull some territory out of the 27th.

SD-27, incumbent: Jill Holtzman Vogel (R)

JHV narrowly won in 2007, but she’ll be happy with this district; it cuts out the parts that she didn’t win that year (Loudoun and Clarke Counties and Winchester).

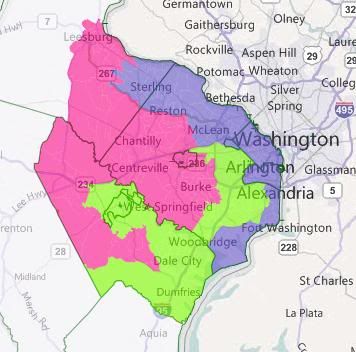
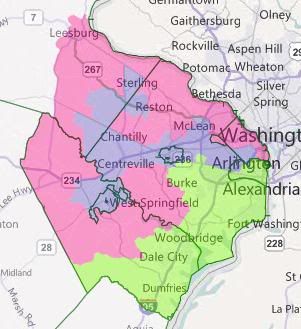
And finally, here’s Northern Virginia.

SD-19, incumbent: none

A new district formed out of parts of the 27th and 33rd. The parts from the 27th were won by the Democratic candidate, Karen Schultz. It also takes in the southern end of the 33rd. This is a winnable district for Democrats, but it would likely depend on the candidate quality and the climate.

SD-33, incumbent: Mark Herring (D)

Herring’s district is reconfigured to span Leesburg to Sterling, and Herring should be pretty happy with that.

SD-29, incumbent: Chuck Colgan (D)

Colgan is expected to retire, and I can’t say that’s a whole lot you can do with his district. The areas around Manassas are the most Dem-friendly parts of the old district, but with Del. Jackson Miller, a Manassas native, a likely candidate for the seat, it’s going to be tough for Democrats to hold it.

SD-36, incumbent: Toddy Puller (D)

Puller’s district remains one that stretches from Mt. Vernon to southern Prince William County.

SD-39, incumbent: George Barker (D)

After the 29th, this is probably the most vulnerable district in NoVa. I tried to strengthen it by running it up to inner Fairfax. It might just be a good idea to give up on the 29th and put as much of Prince William in that district, while making the 39th a mostly-Fairfax district.

SD-37, incumbent: Dave Marsden (D)

Marsden’s district, as currently drawn, is intended to be as polarized as possible. Redrawn, it’s centered around Marsden’s home of Burke, so it will be much safer for him.

SD-34, incumbent: Chap Petersen (D)

Chap lives in Fairfax City, and should have little trouble holding down this district.

SD-32, incumbent: Janet Howell (D)

Howell’s district currently stretches from Reston, through Great Falls, and into McLean. This district stretches from Reston around to the southwestern edge of the county. It might be somewhat less Democratic now, but someone’s got to take those Republican precincts.

SD-31, incumbent: Mary Margaret Whipple (D)

This district is currently mostly Arlington, but I decided to stretch it out to Great Falls. You’d think you could unpack these districts more, but it’s tough when all the surrounding territory is Democratic.

SD-30, incumbent: Patsy Ticer (D)

Arlington/Alexandria, probably the most Democratic district in this map.

SD-35, incumbent: Dick Saslaw (D) (possibly)

Saslaw lives somewhere in Fairfax, but where, I don’t know. It may require some precinct swapping to get him in this district. Either way, it’s safe.

So there you have it. I’m not sure if I can answer my question, because there are a lot of variables in play here. The Democrats’ majority is hanging by a thread, and there are a lot of Democrats in tough districts (at least as currently drawn). It’s going to be interesting to see how they proceed.

Handicapping the VA 2011 races in NoVA (Part 1-State Senate)

One of the few states holding elections this year is Virginia, where the entire state senate and house of delegates will be up for reelection in addition to some local races. I will be doing a series of diaries offering my early assessment of how the races here in Northern Virginia could turn out, and what that could mean for 2012. This diary will cover state senate races, Part II the races in the house of delegates, and Part III the local races for offices like County Supervisor. These races seem very down in the weeds, but in a crucial state for 2012 like VA they can give an idea how strong each party is leading up to the presidential election.

The state senate is controlled by Democrats, who took the senate in the 2007 elections. The state senate is currently the last bastion of Democratic control in VA, so taking it back will certainly be the #1 goal of the VA GOP in 2011. The GOP has a fairly easy path towards taking back the senate; they need to flip three seats in order to regain control (a two-seat gain for the GOP would result in a tie, giving tie-breaking power to republican lt. gov Bill Bolling). The GOP could do this by defeating long-serving blue dog senators in extremely conservative districts in the southern part of the state. Many of these senators have been considered so entrenched that they haven’t faced a serious challenge in a while, but OTOH the GOP has had some success in winning against similar incumbents across the south recently. Regardless of what happens in the south of the state, there will certainly be a lot of contested races up here in NoVA, and that is what I intend to cover. The one caveat here is that we don’t know what redistricting will do to many of these districts. I will try my best to make predictions as to what redistricting could do to these races, but as with many races that is a major unknown here.

One of the resources I will be using heavily here are the great maps provided by the Virginia Public Access Project. They have maps down to the precinct level of all statewide and state legislative elections across Virginia available by county, house district, or senate district, not to mention all the other cool stuff that they have (maps of turnout, detailed info on redistricting, fundraising info, etc). I don’t know of any other state that has such a good resource available.

Let’s start with the easiest districts to predict. The 30th, 31st, and 35th are all highly democratic seats that will not be competitive this year. Safe D

Now on to the more interesting districts.

* 32nd District

Areas: McLean, Great Falls, Reston, Herndon

Senator: Janet Howell (D)

2009 Gov: 53% Deeds, 47% McDonnell


2008 Pres: 60% Obama, 39% McCain


2007 State Senate: Uncontested

VA Redistricting D+1?

First of all, I’m rather new to Swing State Project, so my apologies ahead of time if this diary is treading ground that’s already been discussed.

In any case, I decided to do a Virginia redistricting map after reading that Governor McDonnell had created a bipartisan advisory committee.  Three points are worth noting about Virginia redistricting:

1) The legislature is under split control.

2) Virginia redistricting is always highly scrutinized for VRA purposes.

3) Virginia redistricting has tended to favor ‘least-change’ maps with whole county lines wherever possible.

In any case, I was just curious to do a ‘least-change’ map based on the new population estimates at Dave’s app to see whether it seemed any of the Virginia districts might be significantly affected from a partisan standpoint. The one that jumps out at me is VA-10. The only other district that changed significantly was VA-05, which picks up heavily Republican suburbs of Richmond.

Here’s my statewide map. More on VA-10 after the fold!

According to the estimates on Dave’s App, the NoVa seats need to shed population. That, of course, is to be expected considering NoVa accounts for the bulk of Virginia population growth. When applying the new population estimates at Dave’s app, VA-08 needs to gain 12,000 while VA-11 needs to shed 25,000 and VA-10 needs to shed 100,000. Even before I made my ‘least-change’ map it was readily apparent that VA-10 would have to contract into more of a Fairfax/Loudoun based district than it is now – and therefore would become more Democratic.

In any case, here’s a closer look at the district that I ended up with:

The VA-10 district was already an Obama district in 2008: Obama won the district 53% to 46%. The question then is how significantly the contraction might bump the Democratic performance.

On my map, VA-10 loses all of Warren County and all of Winchester City. It loses 60% of the Frederick County population and goes from half of the Fauquier County population to one third.  These areas combined voted 43% Obama to 56% McCain. Of these, only Winchester City voted for Obama, so it’s worth noting the GOP loss would be greater if, say, VA-10 retained Winchester and instead lost more of Fauquier. The district also loses 15,000 Fairfax Co. voters to VA-08 and VA-11 and gains 22,000 Prince William Co. voters from VA-01 – which is essentially a wash.

So, I looked at the 2008 countywide figures and came up with an estimate of VA-10 votes lost assuming that they were uniformly spread across these counties (this method should actually slightly favor the GOP, because NoVa gets steadily more Republican the further out you go). I then subtracted these figures from the actual 2008 VA-10 figures.

The outcome is a 55% Obama to 44% McCain district. So then, this would clearly give a boost to a Democratic challenger against Frank Wolf. More importantly, Wolf will be 73 years old in 2012, so an open seat such as this would be a prime Democratic target.

In any case, here’s a final map comparing my projected VA-10 district with the current district: