Georgia Primary Results Thread

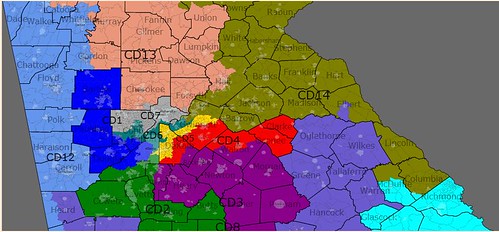
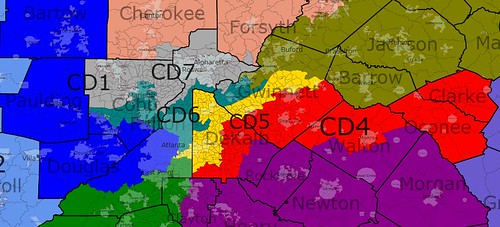
11:30pm: The AP has called the last race we were watching, in GA-07. The race to succeed John Linder will be heading to a runoff between Rob Woodall (37) and Jody Hice (26). Clay Cox (20) didn’t make it. And with that, we seem to be through for the night.

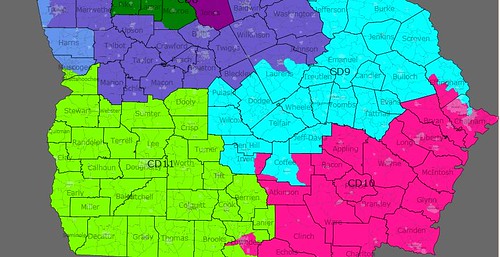
11:11pm: A few more calls on the GOP sides in the House races. GA-08 has been called for Austin Scott, who clears the bar at 53%. In GA-09, Tom Graves (at 49%) and Lee Hawkins (27) got called for a runoff. And in GA-12, Ray McKinney (43) and Carl Smith (27) are officially runoff-bound.

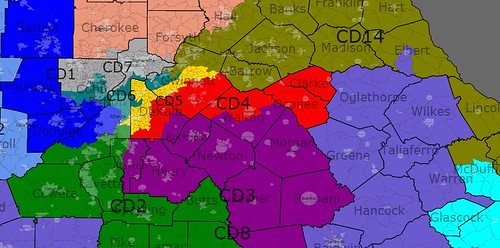
11:04pm: The AP has called the Dem primary in GA-04 for Hank Johnson, without a runoff. He’s at 55, with 27 for Vernon Jones and 18 for Connie Stokes.

10:43pm: Well, that’s it for the Ox. The AP just called Nathan Deal as the other participant in the GOP gubernatorial runoff. With 80% reporting it’s Handel 33, Deal 24, Johnson 20, and Oxendine 17.

10:25pm: Bad news… with 82% reporting, Austin Scott’s up to 53% in the GOP primary in the 8th. I’d rather have Jim Marshall face him after having gotten beaten up in a runoff. On the other hand, in the super-red 9th, Tom Graves is sinking, down to 49%, with 86% reporting. Looks like he’s likely to face Screamin’ Lee Hawkins for a fourth time this year, in another runoff.

10:23pm: At least one member of the Porter household is going home happy tonight; Carol Porter has been called the winner of the Democratic Lt. Governor primary.

10:10pm: The AP has put a big “R” next to Karen Handel’s name (for runoff, presumably), but no call yet for Nathan Deal on joining her.

10:06pm: John Barrow is leading Regina Thomas 68-32 in GA-12 on the D side, with half reporting, but still no AP call.

10:04pm: And I think the candidate for the biggest upset of the night is GA-07 on the GOP side, where the highly-touted state Rep. Clay Cox isn’t even making the runoff. Linder CoS Rob Woodall is at 38 and talk radio host Jody Hice is at 26, with Cox at 19. Couldn’t have happened to a nicer teabagger.

10:02pm: With more than half reporting, Hank Johnson’s still in the safety zone in the D primary for GA-04. He’s at 55, with 27 for Vernon Jones and 18 for Connie Stokes.

10:00pm: In case you were wondering about GA-02, the AP has called the GOP primary for state Rep. Mike Keown, with 80% against scattered opposition. He’s fundraised fairly well, so Sanford Bishop will have to take this one seriously in November.

9:57pm: With 56% reporting, we’re seeing John Oxendine slipping into 4th place, not that that matters other than for reverse-bragging rights. It’s Handel 32, Deal 25, Johnson 19, Oxendine 18.

9:33pm: Major excitement in both GA-08 and GA-09. (By SSP standards, which, admittedly, are pretty low.) Austin Scott has noodged just ahead of 50% in the 8th, up to 51%, with about half reporting. And in the 9th Graves is right about 50%.

9:26pm: The AP has now leapfrogged the GA SoS as being the fastest results outlet, so retrain your sites on either the AP or Politico links below. And guess what? They just called the Democratic gubernatorial nomination for Roy Barnes, who has 63% of the vote with 45.5% reporting. On the GOP side, Handel leads Deal by 33-25.

9:05pm: With 21% in, the GOP side of the governor’s race is further solidifying. It’s Handel 33, Deal 25, Oxendine 18, and Johnson 18. Oxendine might be lucky to make 3rd place.

9:00pm: I think this is going to be the night’s most exciting race: Austin Scott vs. the runoff line, in GA-08 on the GOP side. He’s currenly at precisely 50.0%, with 36% reporting. Ken DeLoach is 2nd, at 33.

8:57pm: The runoff is in three weeks, on 8/10. I can only imagine how Georgians are going to spend the next three weeks getting intimately acquainted with all the details about Nathan Deal’s family’s auto salvage business.

8:52pm: Another gubernatorial update. Barnes is at 58%, looks like he can go on vacation salt away money while Handel and Deal fight the runoff. I say Handel and Deal because Oxendine keeps dwindling: it’s currently Handel 30, Deal 27, Oxendine 19, Johnson 17.

8:38pm: Fail of the day: Oxendine is in 4th place in his home county, Gwinnett.

8:36pm: In the gube race, Roy Barnes is pulling further ahead, beating Baker 57-21 with 13% in. On the GOP side, it’s Handel 31, Deal 25, Oxendine 19, Johnson 17.

8:34pm: Ah, that’s better. Hank Johnson has righted his capsizing island, with 7% in in the 4th. He’s up to 56% now, with 24 for Jones and 20 for Stokes.

8:32pm: Maybe Clay Cox wasn’t in the driver’s seat as much as I’d thought, in GA-07. With 8% in, he’s trailing former John Linder CoS Rob Woodall, 38-23. Radio talk show host Jody Hice is nipping at his heels, too, at 20.

8:30pm: We’ve finally got some action in GA-04. With only 1% reporting, things haven’t really solidified yet, but the numbers show Hank Johnson in the lead but below the runoff line. He’s at 47, with Vernon Jones at 30 and Connie Stokes at 23.

8:20pm: Mildly amusing: In GA-13, BaseConnect client Deborah Honeycutt is losing to businessman Mike Crane by 34-28 according to the GA SoS. Honeycutt earned headlines last cycle for raising and spending an absurd $5 million in her unsuccessful campaign against Democrat David Scott. (Most of that money, as you may recall went straight back to BaseConnect, which at that time was still called BMW Direct.) Honeycutt’s fundraising hasn’t been the same this cycle, though.

8:16pm: In GA-09, Rep. Tom Graves might get forced into yet another runoff. He’s hovering at 48.5% right now, with Steve Tarvin and Lee Hawkins splitting the anti-Graves vote.

8:14pm: I know the Dem AG primary was grabbing a lot of attention. It didn’t turn out to be very competitive, either: it’s Hodges 72, Teilhet 28.

8:11pm: On the Dem side in the governor’s race, Barnes is still holding at 54. Baker is at 20, Poythress is overperforming (relatively speaking) at 10, and Porter is at 8. And in the Dem Senate primary, not much to see, with Michael Thurmond at 82, R.J. Hadley at 18.

8:09pm: And with that, Deal’s in 2nd. With 7% reporting statewide, it’s now Handel 31, Deal 24, Oxendine 20, Johnson 15. Has the Ox been gored?

8:07pm: We’re up to 5% reporting statewide, and Nathan Deal’s starting to creep back up. Now it’s Handel 32, Oxendine 22, Deal 21, Johnson 15.

8:05pm: Here’s a small surprise: it looks like NRCC prize pick Austin Scott may need to go to a runoff in the GOP primary in GA-08. Even though most of his competition dropped out, pastor Ken DeLoach is still faring pretty well. Scott leads DeLoach 46-34, with someone named Diane Vann at 19.

8:02pm: In the House races, we’re getting a clearer picture in the 12th: Regina Thomas is definitely performing better this year, but still not enough. With 7%, Barrow leads Thomas 64-36, about where a lot of those other HCR-related primary challenges to Blue Dogs wound up. It looks like we’ll have to go to a runoff to find who Barrow’s opponent will be (probably between Ray McKinney (40) and Carl Smith (26)).

8:00pm: Things are smoothing out a little now that we’re up to 2% reporting. (Those first counties, esp. Fannin, appear to be in Deal’s GA-09.) Handel’s at 28, Oxendine at 24, Deal at 19, and Johnson at 18. On the Dem side, Barnes is still above the runoff line at 54 with Baker at 22.

7:45pm: Some very early votes are in, and so far, Barnes leads Baker by 55-18. Nathan Deal (!) leads Oxendine by 34-24, but this is still way early.


This thing is about to go off.

RESULTS: Associated Press | GA SoS | Politico

9-5 Non-VRA map of Georgia

An 9-5 Democratic map probably. I will quickly give a rundown of the districts followed by a few maps of the districts.

District 1 (blue): 46% black and 45% white, probably John Lewis territory more than anyone else but man would the folks in Paulding and Bartow counties be pissed to be in a district with the west side of ATL. Probably the most ridiculous district.

District 2 (green): 45 percent white and 44 percent black, amazing considering how all the black population is concentrated in a chunk of Fulton and a sliver of Clayton. David Scott would probably run here.

District 3 (purple): 48% white and 42% black, Clayton and east Dekalb make this a Democratic district probably. I have no idea what Democrat would run though.

District 4 (red): 49 percent white, 39 percent black. Probably my favorite district. White percentage doesn’t necessarily represent GOP percentage because of Clarke county which is 60% white yet 60% Democratic. I think Hank Johnson would want this one or…

District 5 (yellow): Very diverse district, 40 percent white, 34 percent black, 17 percent Hispanic, 8 percent Asian. Similar to the 4th, white percentage includes liberal whites in east Fulton/ west central Dekalb. Another possibility for Hank Johnson?

District 6 (teal): 49% white, 25 percent black, 19% Hispanic, 6% Asian. Getting desperate here but this would no doubt be a Democratic district due to once again liberal whites in ATL plus the majority-minority status of the district. Have no idea who would represent this but definitely not Tom Price.

District 7 (gray): Finally a GOP seat in Metro ATL (6-1 delegation for Dems so far)! Tom Price and Phil Gingrey battle it out here for a 76 percent white, safe GOP district.

District 8 (periwinkle): I’m pretty sure I helped Jim Marshall out with this one stretching across Middle GA. 56% white, 39% black probably pretty close to 50-50 for Obama/McCain (7-1 Dems).

District 9 (light blue): Screwed up a little here but Barrow should be safe. 54% white, 40% black so less black than now. I was attempting to get a Democratic south east GA district by diluting Barrow’s district but you’ll see that’s not happening… (but we have a 8-1 Dem advantage).

District 10 (neon pink): 65% white and 28% black. Not quite good enough to elect a Democrat considering the hostility of SE GA whites towards Democrats (8-2 Democrats).

District 11 (yellow-green): pretty much the same as Sanford Bishop’s pre 2006 district. 52 percent white and 41 percent black I think a Democrat would be fine here (9-2 Democrats).

Districts 12-14: well the Republicans had to go somewhere… All these districts are between 75 to 82% white. I think the 12th would be Westmoreland’s, the 13th is similar to the open 9th and the 14th get’s rid of Paul Broun so hurray for that!

With the three additional GOP seats that brings me to a 9-5 Democratic advantage. Pretty unrealistic but entirely possible if not for the VRA guidelines. Honestly though I think this might expand black representation because of the additional metro ATL seats but I worry in a bad cycle the 11th and the 9th could be in danger for Democrats. Still even if those fell we’d be tied 7-7, gaining a seat.

North GA:

NGA

South GA:

SGA

Middle GA:

CentralGA

Metro ATL:

MetroATLzoom

Legislative Special Election and Runoff Election Roundup

While it may feel like we wrapped up the election cycle on Tuesday, there are always more elections to come. This post covers the special and runoff legislative races coming up in the next month. There are three other important races, the Mass. Senate race and the Houston and Atlanta mayoral runoff races, that will be covered in a future post.

Dems have a chance at picking up one seat in California, two in Tennessee and one in Kentucky, while they are defending another seat in Kentucky, one in Georgia and one in Iowa. There are also two interesting inter-party fights going on in the Georgia runoffs.

This is cross posted on my new blog dedicated to following special elections and culling absentee ballot information from all states into one spot to increase turnout in local races. To read more about each race and learn more about the candidates, click here.

I am sure I left out some races – I hope you will let everyone know about them in the comments and I will be sure to write about them shortly

For the races, join me below the jump.

November 17 – CA Assembly 72 – This doesn’t mean much around these here parts, but there is a primary in Orange County for the seat of Republican Mike Duvall, who resigned due to a sex scandal earlier this year.

Three Republicans are vying for the chance to take on the Democratic candidate, John MacMurray, a teacher in La Habra, and the Green Party Candidate, Jane Rands. MacMurray’s website is here.

The general election will be held on January 12.

———————————————

On November 24, Democrats are defending a seat in Cedar Rapids, Iowa. (HD 33) Democrats chose Kirsten Running-Marquardt as their candidate. A former aide to Congressman David Loebsack, her background is detailed here.

Republicans nominated Josh Thurston, an Iraq War veteran and Cargill employee

——————————————-


December 1
– Voters go back to work in Georgia for legislative runoffs and there are two special elections in Tennessee.

In Georgia, four races are being voted on in different parts of the state. Thanks to TheUnknown285 for all his help on these races.

SD 35

This Atlanta-based Senate district was represented by Kasim Reed, who is locked in a runoff race for Mayor of Atlanta, also to be held on December 1. Outside of parts of Atlanta, the district also represents:

College Park, Douglasville, East Point, Fairburn, Hapeville, Lithia Springs, Palmetto, and Union City

The two remaining candidates are Donzella James and Torrey Johnson,  both Democrats. James, who took the most votes in the first vote on December 3 is attempting to return to the State Senate after serving from 1994-2002. Johnson is an ordained Lutheran minister seeking his first elected office.

HD 58

To see a map of the Georgia House Districts, click http://georgiainfo.galileo.usg…

There is a runoff  in GA HD 58 between two Democrats. Asha Jackson faces Simone Bell in this Atlanta-based district.

HD 129

This district is comprised of most of Harris County and parts of Troup County and Muscogee County.

A pair of Republicans, Kip Smith and Steve Earles are facing off in this election.

HD 141

This district is made up of all of Baldwin County and a small piece of Putnam County. The Democratic incumbent did not run for reelection and so independent candidate Rusty Kidd will square off against Democrat Darrell Black.

———————————————-

In Tennessee, specifically East Memphis, voters will go to the polls to elect a new state senator to fill the seat of Republican Paul Stanley, SD 31, who resigned earlier this year. Many of the voters will also be picking in the primary for the 83rd House District in a  seat resigned by Republican Brian Kelsey, a candidate for Stanley’s seat.

In the State Senate race, covering covers most of Bartlett, almost all of Cordova and Germantown, a few East Memphis precincts and parts of Hickory Hill, Democrat Adrienne Pakis-Gillon is hoping to keep the seat in her party’s hands. A Shelby County Democratic Party Executive Committee Member, her website can be found at http://www.voteadrienne.com/.

The Republican candidate is former State Representative Brian Kelsey who was the Republican floor leader in the House for 2007-2008.

For the House race primary vacated by Kelsey, the candidates are Republicans Mark White and John Pellioccitti, Democrats Guthrie Castle and Ivan Faulkner and Independent John Andreucetti.

——————————————

December 8 – There are two races in Kentucky and one in Arkansas.

KY SD 14 and HD 96

Two races will be voted on December 8th in Kentucky. The State Senate race, located in a district in central Kentucky and comprised of Marion, Mercer, Nelson, Taylor and Washington counties, resulted from Republican Senator Dan Kelly being named to a circuit court judgeship.

The Republican nominee for SD-14 is State Representative Jimmy Higdon from Lebanon, KY.

The Democratic candidate is former State Representative Jodie Haydon, who is looking to return to the legislature after retiring from the House in 2004.

The House race is in north-east Kentucky, near the Ohio border, covering Lewis and Carter counties. Democratic Representative Robin Webb resigned the post after being elected to a State Senate seat.

In the House race, Democrats nominated Barry Webb, while Republicans chose Jill York.

———————————————

AR SD 4

There will be a special election held in District 4, which includes all of Yell County, the southern portion of Pope County and the eastern portion of Logan County. Republican Senator Sharon Trusty is resigning her seat.

There are three candidates on the ballot. Former State Representative Michael Lamoureux is attempting to return to the State House as the Republican candidate.

John Burnett is a Russellville Attorney and is running as a Democrat.

Tachany C. Evans is the Independent candidate and a member of the Board of Directors for Help Network, Inc.

——————————

That’s all for this time. Thanks for reading. I look forward to hearing about more races I should include and cover. To read more about each race and learn more about the candidates, click here.

A Rundown of the Results of the Georgia Special Elections

SD-01 (R): Former State Rep. Buddy Carter (R) creams former Chatham County Commission Chair Billy Hair (R) 82.1% to 17.9%. I figured Carter would win, but I had no idea it would be that lopsided.

SD-35 (D): There will be a runoff, we just don’t know which two of the four million nine candidates (all Democrats) will be on the ballot.  With 69% of the vote in, the three most likely candidates seem to be former State Senator Donzella James, Torrey Johnson (my favorite), and Benny Crane. EDIT: As I’ve been writing this, the AP has called the race for a James-Torrey Johnson runoff.

HD-58 (D): The AP is calling a runoff between Democrats Asha Jackson (my least favorite of the four Democrats in the race) and Simone Bell (who would be the second openly gay member of the General Assembly ever and the first from a racial minority and my favorite for mostly unrelated reasons).  

HD-75 (D): Democratic prodigal son (he’s a bastard child) Ron Dodson has reclaimed his seat, defeating Republican Shawn James 60.1-39.9.  In a night we’re we seem to be fucking ourselves, we do it again.  Dodson left the party before, works for big healthcare, says his biggest goal is tort reform, had failing ratings on the environment, and was for the gay marriage ban.

HD-129 (R): In the all-Republican special, Kip Smith barely missed an outright win in his father’s former seat and will now face total wingnut Steve Earles in the runoff.  The guy that seemed the least of four evils came in third.  Smith is bad but Earles is a complete nut.

HD-141 (D): We should be thankful for crazy splinter Republicans.  Political neophyte, wingnut, and recent college grad Casey Tucker siphoned over 500 votes from the more established Republican Angela Gheesling-McCommon.  As it stands now, she and Democrat Darrell Black are separated by sixteen votes (with Black leading) for the right to face indepedent Rusty Kidd in the runoff.

HD-159 (R): The race to replace the aforementioned Buddy Carter wasn’t a race at all, like I expected.  Former State Rep. Ann Purcell (whom Carter unseated in the primary) defeated fellow Republican and self-professed “true conservative” Jesse Tyler 79.2-20.8

The runoffs for SD-35, HD-58, HD-129, and HD-141 (and Atlanta Mayor) will be on December 1.  A more thorough rundown of the candidates and districts can be found here.

Georgia Republican Gerrymander

This is the second of my Georgia maps. I've already done a Democratic gerrymander.  In this edition, I tried to think like a Georgia Republican (but failed because I'm not that damn crazy or evil).  With the fate of the VRA seemingly in doubt, I went ahead and discounted it, using only the requirements of contiguousness and equal population and political realities in shaping the districts (because there's no way the Republicans could get a 14-0 Georgia delegation short of epic measures).

 My “goals” for this round were:

  1. To protect John Linder, who's Gwinnett-based district is rapidly diversifying from black, Hispanic, and Asian growth and taking on some liberal whites as well, as seen in long-term trends toward our side.
  2. To ensure the long term (at least to the next round of redistricting) sustainability of the other Republican districts.
  3. To make the new district a Republican district.
  4. To try to eliminate as many Democrats as possible.
  5. To try to avoid primary battles within the Republican Party.
  6. To make the districts look as nice as possible.

I think I achieved these goals with the following districts:


Metro Atlanta:Metro

The major non-Atlanta regional population centers (Athens, Augusta, Columbus, Macon, and Savannah) all get a district to themselves and their surrounding areas, intact, without sharing with another major city.

1st District (Jack Kingston [R] vs. John Barrow [D]) BLUE
New Demographics: 63% white | 29% black | 0% Native American | 1% Asian | 4% Hispanic | 1% Other
Old Demographics: % white | % black | % Native American | % Asian | % Hispanic | % Other
Old District: 72.6% white | 22.7% black | .3% Native American | .9% Asian | 4.1% Hispanic | .2% other

The first of the Republican pickups comes in coastal Georgia.  Chatham County (Savannah) is made whole, putting Jack Kingston and John Barrow in the same district.  Kingston has a decided advantage here.  Of the seventeen counties in the new district, Barrow represents only three, one of which is a major thorn in his side.  He loses his secondary base in the Augusta area and picks up several rural/exurban, white, and VERY Republican counties.  Kingston, on the other hand, has much of his old district intact.  Barrow has struggled before in a far more minority, far more Democratic district.  His ability to survive here is very much in doubt.  His only saving grace would be his fundraising prowress.

2nd District (Sanford Bishop [D]) GREEN
New Demographics: 56% white | 35% black | 0% Native American | 0% Asian | 5% Hispanic | 0% Other
Old Demographics: % white | % black | % Native American | % Asian | % Hispanic | % Other
Old District: 51.4% white | 44.8% black | .3% Native American | .6% Asian | 3.5% Hispanic | .1% other

With the 2nd, I essentially pushed the district over, cutting Bishop off from his secondary base in the Columbus area and instead moving the district east, taking up large swarths of white, Republican, rural areas.  While we're used to Bishop winning easily, he has had trouble in less Democratic districts.  And not only does the change in direction (from the Georgia-Florida-Alabama border east instead of from the Florida border to Columbus) make the district more Republican but it also, as would be expected, makes for a larger Republican bench and a smaller Democratic bench, increasing the chances of a higher tier Republican emerging while decreasing the chances of a higher tier Democrat emerging when Bishop hangs it up (or gets defeated).

3rd District (Lynn Westmoreland [R]) PLUM
New Demographics: % white | % black | % Native American | % Asian | % Hispanic | % Other
Old Demographics: % white | % black | % Native American | % Asian | % Hispanic | % Other
Old District: 72.6% white | 22.7% black | .3% Native American | .9% Asian | 4.1% Hispanic | .2% other

4th District (Hank Johnson [D]) RED
New Demographics: % white | % black | % Native American | % Asian | % Hispanic | % Other
Old Demographics: % white | % black | % Native American | % Asian | % Hispanic | % Other
Old District: 35.8% white | 53.5% black | .4% Native American | 4.3% Asian | 8.5% Hispanic | 0% other

5th District (John Lewis [D]) YELLOW
New Demographics: % white | % black | % Native American | % Asian | % Hispanic | % Other
Old Demographics: % white | % black | % Native American | % Asian | % Hispanic | % Other
Old District: 37% white | 56.1% black | .2% Native American | 2.2% Asian | 6.1% Hispanic | 0% other

6th District (Tom Price [R]) TEAL
New Demographics: % white | % black | % Native American | % Asian | % Hispanic | % Other
Old Demographics: % white | % black | % Native American | % Asian | % Hispanic | % Other
Old District: 85.6% white | 7% black | .2% Native American | 4% Asian | 4.5% Hispanic | .1% other

The loss of parts of North Fulton and Cherokee to sure up Linder next door and the fact that some parts of the district are shaky (North DeKalb and Sandy Springs) necesitated moving the 6th down into the white, Republican parts of Atlanta on the northside.  Short of something major, Price should be okay

7th District (John Linder [R]) GRAY
New Demographics: % white | % black | % Native American | % Asian | % Hispanic | % Other
Old Demographics: % white | % black | % Native American | % Asian | % Hispanic | % Other
Old District: 72.6% white | 22.7% black | .3% Native American | .9% Asian | 4.1% Hispanic | .2% other

8th District (Jim Marshall [D]) PERIWINKLE
New Demographics: % white | % black | % Native American | % Asian | % Hispanic | % Other
Old Demographics: % white | % black | % Native American | % Asian | % Hispanic | % Other
Old District: 72.6% white | 22.7% black | .3% Native American | .9% Asian | 4.1% Hispanic | .2% other

9th District (Open [R-held]) CYAN
New Demographics: % white | % black | % Native American | % Asian | % Hispanic | % Other
Old Demographics: 84% white | 4% black | 0% Native American | 0% Asian | 9% Hispanic | 0% Other
Old District: 82.5% white | 13.7% black | .3% Native American | 1.2% Asian | 2.6% Hispanic | .1% other

In the four maps I've made for Georgia, I always have trouble with the Nineth because we don't yet know who's going to be the Congressman.  The map I made tries to put the all of the potential candiates into the district (sans State Rep. Bobby Reese, who entered after I made this map and who doesn't lIVe in the current district anyways).  The new district has the same general shape but sheds all of Forsyth, Lumpkin, Union, White Counties, as well as about 45% of Hall County (done to keep the Tenth from getting too mishapen.  In return, it gains all of Chattooga County, the parts of Gordon County originally in the Eleventh, and the Northern parts of Bartow and Floyd Counties.  In sum, it becomes more rural. 

10th District (Paul Broun [R]) HOT PINK
New Demographics: % white | % black | % Native American | % Asian | % Hispanic | % Other
Old Demographics: % white | % black | % Native American | % Asian | % Hispanic | % Other
Old District: 72.6% white | 22.7% black | .3% Native American | .9% Asian | 4.1% Hispanic | .2% other

11th District (Phil Gingrey [R]) ACID GREEN
New Demographics: 73% white | 15% black | 0% Native American | 1% Asian | 7% Hispanic | 1% Other
Old Demographics: % white | % black | % Native American | % Asian | % Hispanic | % Other
Old District: 72.6% white | 22.7% black | .3% Native American | .9% Asian | 4.1% Hispanic | .2% other

Not a huge change in shape, the 11th compacts somewhat and shifts south a bit, shedding Chattooga, its parts of Gordon, and the Northern halves of Floyd and Bartow in return for picking up the southern half of Carroll and the western half of Douglas.  In sum, it becomes more suburban.  Unfortunately, these are not the suburbs that are trending our way at any speed (or at all). 

12th District (NEW SEAT) POWDER BLUE
New Demographics: 58% white | 35% black | 0% Native American | 1% Asian | 3% Hispanic | 1% Other
Old Demographics: % white | % black | % Native American | % Asian | % Hispanic | % Other
Old District: 72.6% white | 22.7% black | .3% Native American | .9% Asian | 4.1% Hispanic | .2% other

With John Barrow set to lose in the new 1st and Paul Broun getting an Athens-Northeast Georgia district, Republicans can placate the Augusta-area Republicans.  While including Augusta-Richmond County and other small blue and purple counties (e.g. Burke, Screven), they're more than outweighed by the the red areas in the Atlanta exurbs, Northeast Georgia, etc.  And even if Barrow decides to run here instead, he'll still have a district stacked against him racially (he's had trouble in far less white districts AND will be carpetbagging for the second time in four cycles.

13th District (David Scott [D]) SALMON
New Demographics: 34% white | 49% black | 0% Native American | 3% Asian | 11% Hispanic | 2% Other
Old Demographics: % white | % black | % Native American | % Asian | % Hispanic | % Other
Old District: 72.6% white | 22.7% black | .3% Native American | .9% Asian | 4.1% Hispanic | .2% other

Due to population increases, the 13th loses its territory in DeKalb and Henry, but remains mostly the same otherwise.  It falls just short of being majority-black.  So, it would take just a little reshuffling to get it to that point if the Republicans end up getting smacked for diluting black voting strenght elsewhere (or feel the need to shore up other districts).  Scott will be safe.

14th District (NEW SEAT) OLIVE
New Demographics: % white | % black | % Native American | % Asian | % Hispanic | % Other
Old Demographics: % white | % black | % Native American | % Asian | % Hispanic | % Other
Old District: 72.6% white | 22.7% black | .3% Native American | .9% Asian | 4.1% Hispanic | .2% other

Although unintended, this district bears a strong resemblance to John Douglas' state senate district.

I think a lesson to take from this is that ostensible communities of interest and clean lines making geometric districts can really fuck us over and an unwillingness to cross political and geographic boundaries can really kill us.

By what margin will Bob Shamansky win?

View Results

Loading ... Loading ...

Georgia Republican Gerrymander

This is the second of my Georgia maps. I've already done a Democratic gerrymander.  In this edition, I tried to think like a Georgia Republican (but failed because I'm not that damn crazy or evil).  With the fate of the VRA seemingly in doubt, I went ahead and discounted it, using only the requirements of contiguousness and equal population and political realities in shaping the districts (because there's no way the Republicans could get a 14-0 Georgia delegation short of epic measures).

 My “goals” for this round were:

  1. To protect John Linder, who's Gwinnett-based district is rapidly diversifying from black, Hispanic, and Asian growth and taking on some liberal whites as well, as seen in long-term trends toward our side.
  2. To ensure the long term (at least to the next round of redistricting) sustainability of the other Republican districts.
  3. To make the new district a Republican district.
  4. To try to eliminate as many Democrats as possible.
  5. To try to avoid primary battles within the Republican Party.
  6. To make the districts look as nice as possible.

I think I achieved these goals with the following districts:


Metro Atlanta:Metro

The major non-Atlanta regional population centers (Athens, Augusta, Columbus, Macon, and Savannah) all get a district to themselves and their surrounding areas, intact, without sharing with another major city.

1st District (Jack Kingston [R] vs. John Barrow [D]) BLUE
New Demographics: % white | % black | % Native American | % Asian | % Hispanic | % Other
Old Demographics: % white | % black | % Native American | % Asian | % Hispanic | % Other
Old District: 72.6% white | 22.7% black | .3% Native American | .9% Asian | 4.1% Hispanic | .2% other

The first of the Republican pickups comes in coastal Georgia.  Chatham County (Savannah) is made whole, putting Jack Kingston and John Barrow in the same district.  Kingston has a decided advantage here.  Of the seventeen counties in the new district, Barrow represents only three, one of which is a major thorn in his side.  He loses his secondary base in the Augusta area and picks up several rural/exurban, white, and VERY Republican counties.  Kingston, on the other hand, has much of his old district intact.  Barrow has struggled before in a far more minority, far more Democratic district.  His ability to survive here is very much in doubt.  His only saving grace would be his fundraising prowress.

2nd District (Sanford Bishop [D]) GREEN
New Demographics: % white | % black | % Native American | % Asian | % Hispanic | % Other
Old Demographics: % white | % black | % Native American | % Asian | % Hispanic | % Other
Old District: 51.4% white | 44.8% black | .3% Native American | .6% Asian | 3.5% Hispanic | .1% other

With the 2nd, I essentially pushed the district over, cutting Bishop off from his secondary base in the Columbus area and instead moving the district east, taking up large swarths of white, Republican, rural areas.

3rd District (Lynn Westmoreland [R]) PLUM
New Demographics: % white | % black | % Native American | % Asian | % Hispanic | % Other
Old Demographics: % white | % black | % Native American | % Asian | % Hispanic | % Other
Old District: 72.6% white | 22.7% black | .3% Native American | .9% Asian | 4.1% Hispanic | .2% other

4th District (Hank Johnson [D]) RED
New Demographics: % white | % black | % Native American | % Asian | % Hispanic | % Other
Old Demographics: % white | % black | % Native American | % Asian | % Hispanic | % Other
Old District: 35.8% white | 53.5% black | .4% Native American | 4.3% Asian | 8.5% Hispanic | 0% other

5th District (John Lewis [D]) YELLOW
New Demographics: % white | % black | % Native American | % Asian | % Hispanic | % Other
Old Demographics: % white | % black | % Native American | % Asian | % Hispanic | % Other
Old District: 37% white | 56.1% black | .2% Native American | 2.2% Asian | 6.1% Hispanic | 0% other

6th District (Tom Price [R]) TEAL
New Demographics: % white | % black | % Native American | % Asian | % Hispanic | % Other
Old Demographics: % white | % black | % Native American | % Asian | % Hispanic | % Other
Old District: 85.6% white | 7% black | .2% Native American | 4% Asian | 4.5% Hispanic | .1% other

The loss of parts of North Fulton and Cherokee to sure up Linder next door and the fact that some parts of the district are shaky (North DeKalb and Sandy Springs) necesitated moving the 6th down into the white, Republican parts of Atlanta on the northside.  Short of something major, Price should be okay

7th District (John Linder [R]) GRAY
New Demographics: % white | % black | % Native American | % Asian | % Hispanic | % Other
Old Demographics: % white | % black | % Native American | % Asian | % Hispanic | % Other
Old District: 72.6% white | 22.7% black | .3% Native American | .9% Asian | 4.1% Hispanic | .2% other

8th District (Jim Martin [D]) PERIWINKLE
New Demographics: % white | % black | % Native American | % Asian | % Hispanic | % Other
Old Demographics: % white | % black | % Native American | % Asian | % Hispanic | % Other
Old District: 72.6% white | 22.7% black | .3% Native American | .9% Asian | 4.1% Hispanic | .2% other

9th District (Open [R-held]) CYAN
New Demographics: % white | % black | % Native American | % Asian | % Hispanic | % Other
Old Demographics: 84% white | 4% black | 0% Native American | 0% Asian | 9% Hispanic | 0% Other
Old District: 82.5% white | 13.7% black | .3% Native American | 1.2% Asian | 2.6% Hispanic | .1% other

In the four maps I've made for Georgia, I always have trouble with the Nineth because we don't yet know who's going to be the Congressman.  The map I made tries to put the all of the potential candiates into the district (sans State Rep. Bobby Reese, who entered after I made this map and who doesn't lIVe in the current district anyways).  The new district has the same general shape but sheds all of Forsyth, Lumpkin, Union, White Counties, as well as about 45% of Hall County (done to keep the Tenth from getting too mishapen.  In return, it gains all of Chattooga County, the parts of Gordon County originally in the Eleventh, and the Northern parts of Bartow and Floyd Counties.  In sum, it becomes more rural. 

10th District (Paul Broun [R]) HOT PINK
New Demographics: % white | % black | % Native American | % Asian | % Hispanic | % Other
Old Demographics: % white | % black | % Native American | % Asian | % Hispanic | % Other
Old District: 72.6% white | 22.7% black | .3% Native American | .9% Asian | 4.1% Hispanic | .2% other

11th District (Phil Gingrey [R]) ACID GREEN
New Demographics: % white | % black | % Native American | % Asian | % Hispanic | % Other
Old Demographics: % white | % black | % Native American | % Asian | % Hispanic | % Other
Old District: 72.6% white | 22.7% black | .3% Native American | .9% Asian | 4.1% Hispanic | .2% other

12th District (NEW SEAT) POWDER BLUE
New Demographics: % white | % black | % Native American | % Asian | % Hispanic | % Other
Old Demographics: % white | % black | % Native American | % Asian | % Hispanic | % Other
Old District: 72.6% white | 22.7% black | .3% Native American | .9% Asian | 4.1% Hispanic | .2% other

13th District (David Scott [D]) SALMON
New Demographics: % white | % black | % Native American | % Asian | % Hispanic | % Other
Old Demographics: % white | % black | % Native American | % Asian | % Hispanic | % Other
Old District: 72.6% white | 22.7% black | .3% Native American | .9% Asian | 4.1% Hispanic | .2% other

14th District (NEW SEAT) OLIVE
New Demographics: % white | % black | % Native American | % Asian | % Hispanic | % Other
Old Demographics: % white | % black | % Native American | % Asian | % Hispanic | % Other
Old District: 72.6% white | 22.7% black | .3% Native American | .9% Asian | 4.1% Hispanic | .2% other

I think a lesson to take from this is that ostensible communities of interest and clean lines making geometric districts can really fuck us over and an unwillingness to cross political and geographic boundaries can really kill us.

Maps for Georgia Redistricting

I think the map is just not realistic enough to pass. Even if we can elect Democrat Roy Barnes as Governor, the best we could do is probably a bipartisan redistricting. Anyway, this is the map I would draw if I could decide what the Georgia map would be. I planned to try for an 8-6 Democratic map with creating a new Democratic district and weakening one Republican. If I tried really hard, I might have created a new Democratic district in the Atlanta metropolitan area. I did not want to weaken new Democrats and Obama turnout may have overestimated the Democratic Party strength around Atlanta. However, the minority population around Atlanta is growing quickly. This will make the Democrats stronger there. Just so people know, Safe Democrat/Republican means that the district is solidly for one party. Likely Democrat/Republican means that the district appears safe but could become competitive. Lean Democrat/Republican means that the district will be competitive but one party is ahead. Toss Up means that the district could go either way. Now here are the maps (Yes, I finally did not use a camera to get these shots.)

north georgia

North Georgia

South Georgia 2

South Georgia

atlanta area (2)

Atlanta area

District 1 Jack Kingston (R) Blue

I kept this district mostly the way it is. It contains most of southern Georgia but Democratic areas are taken into the 2nd, 3rd and 12th district. I took out some counties that were in the 12th to get them into here. I also extended this district to take in some Conservative parts of Warner Robins. Jack Kingston and any Republican should have no trouble here. It probably voted 69% for McCain.

Stats are 21% African American and 71% White. Status is Safe Republican.

District 2 Sanford Bishop (D) Green

Unfortunately, I had to weaken Bishop a bit to strengthen Democrat Jim Marshall in the 8th district. I put in some Republican counties that were originally part of the 8th. The district contains the southwestern part of the state which leans Democratic but extends east a bit to take in Republican counties that were in the 8th. Basically, I made the map of southern Georgia look like the map it used to be. Still, Bishop has been winning easily and unless he faces a big challenge, he should continue to win. I think that McCain won here with 51% of the vote.

Stats are 43% African American and 49% White. Status is Safe Democrat.

District 3 Lynn Westermoreland (R) Purple

Not much change to this district. All I did was remove some African American areas in the Republican counties this district contained. Since many African Americans are moving out of the Atlanta core, the African American population is growing here. Still, it should not be enough to affect the leaning of this district. I was also surprised that this district is more rural than suburban. Its growth was below the Georgia average. I think McCain won about 68% of the vote here.

Stats are 19% African American and 75% White. Status is Safe Republican

District 4 Hank Johnson (D) Red

This is one of the African American majority districts. It is centered in De Kalb County and for population purposes; I gave it a slice of Gwinnett County. I had to reduce the African American percentage a bit to strengthen other districts. Still, the only threat to Hank Johnson is a primary challenge. Obama probably won about 77% of the vote here.

Stats are 52% African American, 12% Hispanic and 29% White. Status is Safe Democrat.

District 5 John Lewis (D) Yellow

I kept this district mostly where it used to be and it should stay safe. It is another African American majority district. Even though I took out a few Atlanta precincts and extended the district into Cobb County, it is still very safe for John Lewis. This is a solid district and since Lewis is very popular, he does not even have to worry about a primary challenge. Obama probably won with 75% of the vote here.

Racial stats are 52% African American, 7% Hispanic and 36% White. Status is Safe Democrat.

District 6 Tom Price (R) Teal

I hope I put enough Democrats in this district to knock out Tom Price. Even though I kept some areas of the old 6th district in such as Roswell, this should not be much of a threat to a Democratic takeover. I removed all of Cherokee which gave McCain a margin of 48,000 votes. The rest of the old district probably gave a 20,000 vote margin to McCain. I removed all of Cobb County too and added part of Gwinnett County. I even sent a little finger down into Atlanta to pick up some heavily African American precincts. In parts of the South, the electorate is almost completely racially polarized. That means that race almost completely determines the party. In this district, the percentage of White Democrats is much higher than the percentage of minority Republicans. With the inclusion of a bit of Atlanta, this will weaken Price and he may want to run in another district even though he lives in Roswell. He was elected in 2004 so he is not as entrenched as he could be. I believe that Obama won about 52% of the vote here.

The racial stats are 18% African American, 14% Hispanic, 8% Asian and 58% White. Status is Toss Up/Lean Democrat depending on the competition.

District 7 John Linder (R) Gray

This district mostly contains the leftovers from other districts in Gwinnet County. I designed this to take in all the Republican parts of Gwinnet County and other Republican suburbs. If the minority growth in the Atlanta area does not slow down, this district might be more competitive in about ten years. For now, it is safe for John Linder. McCain probably won here with about 67% of the vote.

The racial stats are 10% African American, 7% Hispanic and 79% White. Status is Safe Republican.

District 8 Jim Marshall (D) Light Purple

Marshall recently has had a few close races in a district that voted 56% for McCain. This is why I decided to focus on strengthening his district. I extended it further east to pick up heavily Democratic Hancock County and Washington County. I sent this district further west to pick up Talbot, Macon and a few other Democratic counties. I had to remove the swing county Newton because Mac Collins (R) lives in it and he gave Marshall a very tough race in 2006. Most of the southern Republican counties in this district went to the 2nd and 1st districts. With the addition of Democratic counties and the exclusion of more Republican ones, I was able to increase the African American percentage from 32% to 41%. That should be high enough to protect Marshall. I estimate that Obama won about 51% of the vote in this district.

The racial stats are 41% African American and 53% White. Status is Likely Democrat.

District 9 Nathan Deal (R) Bright Turquoise

I did not change this district much. What is there to change anyway? The district was pretty Conservative before and it is still heavily Republican. If the growth in Atlanta continues, the counties closest to Atlanta in this district will start filling up with people. That should be the only change to this district. Either way, it is Republican for the foreseeable future. McCain probably won 72% to 77% of the vote here.

Racial stats are 6% African American, 10% Hispanic and 82% White. Status is Safe Republican.

District 10 Paul Broun (R) Bright Pink

I should say what I said about the 9th district. No Democratic will win here anytime soon. It will be even harder for one because I removed Athens from this district. I put it back into the 12th. The only bit of worry Broun should have is that Gainesville in Hall County has a fast growing Hispanic population. It should not be enough to alter the politics of the district too much. I estimate that McCain got about 70% of the vote here

. The racial stats are 10% African American, 10% Hispanic and 77% White. Status is Safe Republican.

District 11 Phil Gingerly (R) Light Green

Due to large population growth, this district just shrunk down to size. Also, I extended it into Cobb County which is more densely populated so that was another reason for the shrinking of this district. Even though Gingerly had a weak district when the Democrats drew the 2002 map, I gave him a strong one now. The reason I could not give him a weaker district was that I had to protect the 13th. Anyway, I do not believe Gingerly would be weakened enough if I gave him the Democratic parts of Cobb County. Cobb County voted 55% for McCain and the Republican suburbs make the Republican percentage increase. I estimate that McCain won here somewhere in the neighborhood of 65% of the vote.

The racial stats are 14% African American, 7% Hispanic and 75% White. Status is Safe Republican.

District 12 John Barrow (D) Light Blue

Again, I tried to make the lines resemble the 2002 Democratic redistricting. I gave Barrow all the Democratic parts of Savannah, Augusta and extended the district up to Athens. Whites are now a minority so I do not see the Republicans winning here. Even if Max Burns, the former Congressman from this district runs, he should not beat Barrow. I estimate that Obama won with 58%-60% of the vote here. Barrow is safe with the inclusion of Athens and the exclusion of Republican counties.

The racial stats are 43% African American and 49% White. Status is Safe Democrat.

District 13 David Scott (D) Tan

I kept his district pretty much the same except that I moved out the eastern part of his district. This district looks a bit gerrymandered because I moved it everywhere I could to pick up African American areas. Even though this district includes less of Clayton County than it used to, this district should still be heavily Democratic. I did not include enough African American areas to make their population go above 50% so this is not protected by the Voting Rights Act. Still, David Scott should have no problem getting elected here. Obama probably won here with about 70% of the vote.

The racial stats are 46% African American, 11% Hispanic and 39% White. Status is Safe Democrat.

District 14 No Incumbent Algae Green

This is really an eastern extension of the 2002 redistricted 13th. I send this district up into Gwinnet County to take in some heavily African American and Hispanic precincts. It also goes into Democratic trending Rockdale and Newton Counties. They are trending Democratic so quickly. Kerry won 40% of the vote in Rockdale County and Obama won 54%. Even though Whites are a plurality here, this district should have no trouble going for a Democrat. I estimate that Obama won here somewhere in the mid 60’s.

Racial stats are 38% African American, 13% Hispanic, 6% Asian and 41% White. Status is Safe Democrat.

By what margin will Bob Shamansky win?

View Results

Loading ... Loading ...

Redistricting Georgia – Inside the Mind of a Republican

  I set out to draw what the post-census congressional districts of Georgia might look like if we fail to win the governorship or take back one of the houses of the state legislature. I get nauseous when I look at this map, so I think I did a decent job. After all is said and done, this map will probably elect four Democrats and ten Republicans.

 When the Republicans DeLaymandered Texas, they mainly targeted moderate, white Democrats, and I think the Republicans in Georgia will probably try the same thing, so Jim Marshall and John Barrow are toast under this map. The other two goals of the Republicans will most likely be to hog the new 14th district for themselves, and to make sure John Linder’s district won’t have trended out from under him by the year 2022, especially since he will most likely retire before then.

 Without further ado, here are the pictures.

Northern Georgia:

Northern Georgia

Southern Georgia:

Southern Georgia

Greater Atlanta:

Greater ATL

District 2 (Sanford Bishop vs. Jim Marshall):

Photobucket

District 5 (John Barrow):

Barrow's district

District 1 – Jack Kingston (Light Blue) – Kingston’s district picks up some of Savannah’s African-American residents in order to remove them from Barrow’s district, and it shrinks somewhat in size, but this district should still be safe for him.

District 2 – Sanford Bishop vs. Jim Marshall (Dark Green) – While the old 2nd District was majority white and confined to Southwest Georgia, the new 2nd is majority-black and sprawls from Columbus to Augusta, and includes both Sanford Bishop’s home in Albany and Jim Marshall’s home in Macon. I think Bishop is an overwhelming favorite here, because it contains much more of his former territory than Marshall’s, and because he is African-American, which is always a plus when you’re running in a majority black district. If Marshall wants to stay in public life, he would probably want to either move to the 10th or 14th and run there, or retire and plan to either run for Senate or Governor in 2014.

District 3 – Lynn Westmoreland (Dark Purple) – Lynn Westmoreland’s loses Henry County and its portion of Douglas County, and picks up some territory near the Alabama border, as well as Monroe County. It is probably even more Republican than it is in its current form.

District 4 – TBD (Red) – With Nathan Deal running for Governor, I have no idea who this district’s representative will be, but unless hell freezes over, they will be a Republican who can stand to be weakened a bit, since Deal’s current district has a PVI of R+28! This district gets a new number (it used to be the 9th), and picks up part of Gwinnett County, while shedding some territory in the North Georgia Mountains. This district may look different, depending on where Deal’s replacement lives.

District 5 – John Barrow (Yellow) – This district is drawn for the sole purpose of defeating John Barrow. Barrow loses many of his African-American constituents to the 2nd, and to a lesser extent, the 1st. On top of that, there is a tendril that extends into some deeply conservative areas to the north of Augusta. Barrow will have a tough time holding this one.

District 6 – Tom Price (Teal) – This district, which was once represented by Newt Gingrich, changes very little, losing a small section of North Fulton, as well as Dunwoody, in DeKalb County, to the 7th district. Population growth is sufficient that it doesn’t take in any new territory.

District 7 – John Linder (Gray) – In an attempt to make sure Gwinnett County’s trend in our direction doesn’t imperil John Linder, this district loses much of Gwinnett to the 4th District (formerly the 9th), and to the new 14th. To compensate for this, it picks up small sections of North Fulton, as well as Dunwoody, from the 6th, and picks up Forsyth County, which gave McCain 79% of the vote.

District 8 – Hank Johnson (Periwinkle) – The only thing that really changes about this district, aside from the number,(it used to be the 4th), is that it no longer includes Rockdale County. Hank Johnson will be in congress for as long as he likes, assuming he learned a lesson from his predecessor and gives the Capitol Police their space.

District 9 – Phil Gingrey (Bright Blue) – This district contains a little bit more of Cobb County than it used to, and a little bit less rural territory along the Alabama border, but it is still a Republican stronghold. However, it is renumbered. (It used to be the 11th).

District 10 – OPEN (Hot Pink) – This district’s main population center is Warner Robins, a conservative city with a strong military presence. However, this district is mostly rural and is composed of Republican areas taken from the districts of Jack Kingston, Sanford Bishop, and Jim Marshall. Marshall might run here, but historically he hasn’t performed too well in the turf here that was formerly in his district. This is probably a likely pickup for the Republicans.

District 11 – John Lewis (Radioactive Green)- John Lewis’s district is still a majority-black Democratic stronghold, but it gets a new number, and some territory in Cobb County that was previously represented by David Scott.

District 12 – Paul Broun (Indigo) – Despite containing Athens, the 12th (formerly the 10th) is heavily Republican, thanks to its territory in North Georgia. Broun is safe here.

District 13 – David Scott (Salmon) – This district stays very similar in shape, but is now majority black as opposed to majority minority.

District 14 – OPEN (Greenish Brown) – This is the new district. Although it includes Rockdale County, which Obama won, and Henry County, which has been trending our way, as well as part of Gwinnett County, it also includes Walton and Barrow Counties, which are exurban and heavily Republican, as well as some heavily Republican rural areas. This district might be competitive someday, but for now it should go Republican. It wouldn’t surprise me to see former Rep. Mac Collins try and make a comeback here. Marshall could also conceivably run here, but he hasn’t done well in the section of his current district that is in this new district, and would be an underdog.

P.S. I don’t know as much about the Voting Rights Act as I should, so if you know how it might affect this map, be sure to let me know.

Trying My Hand at Redistricting: Georgia Democratic Gerrymander Using DRA

My goals going into this were:

1.) To make sure the new district elects a Democrat.
2.) To shore up the three Central/Southern Georgia Democrats (especially Marshall and Barrow), not only for the incumbents but also Democrats in general if and when those seats come open.
3.) To create or expand our bench in our districts.
4.) To fuck with Phil Gingrey and John Linder to the best of my ability.
5.) To try my best not create an ode to the Flying Spaghetti Monster. 

To that end, I think I accomplished these goals.  My maps:


Atlanta Metro Area

1st District (Jack Kingston [R]) BLUE
New Demographics: 71.3% white | 20.8% black | .3% Native American | 1.1% Asian | 5.4% Hispanic | .1% other
Old Demographics: 72.8% white | 21.2% black | .2% Native American | .9% Asian | 3.9% Hispanic | 1% other
Old District: 72.6% white | 22.7% black | .3% Native American | .9% Asian | 4.1% Hispanic | .2% other
I used this as a dumping ground for Republican votes from the 8th and 12th districts while trying to remove Democratic areas for use in those districts.  Kingston gains several Republican counties to the north from the 12th, including much of Effingham County exchange for heavily Democratic Liberty County, some black(er) areas in McIntosh County as well as connectors in Chatham County.  He also picks up much of heavily Republican Laurens County as well as other parts from the 8th.  Surprisingly, the district gets a bit more diverse (and even more surprisingly, from Asians, Hispanics, and Native Americans), but don't hold your breath; it's a very small increase.  Kingston will win in a cakewalk; our bench in the district is non-existent, at least at the state legislature-level.

2nd District (Sanford Bishop [D]) GREEN
New Demographics: 48.4% white | 45.2% black | .3% Native American | .8% Asian | 4.3% Hispanic | 1% other
Old Demographics: 49.7% white | 45.1% black | .3% Native American | .6% Asian | 3.3% Hispanic | .9% other
Old District: 51.4% white | 44.8% black | .3% Native American | .6% Asian | 3.5% Hispanic | .1% other
With some minor scandal involving Bishop and rumors of an adminstration post, I felt the need to shore up his district a bit, considering Bush won it in 2004.  Population loss/stagnation and losses of area to the 8th necessitated moving the district northward, taking up more of Columbus, as well as extending up to take on the swingy Meriwether County plus the heavily black parts of Troup County in and around LaGrange.  Essentially, I added state Rep. Carl von Epps' district.  This also helped offset the addition of very Republican Colquitt County.  The district goes from majority white to plurality white and is trending even more minority.  Bishop should have no trouble and his successor should be in a relatively good position. 

3rd District (Lynn Westmoreland [R]) PLUM
New Demographics: 71.3% white | 20.8% black | .3% Native American | 1.1% Asian | 5.4% Hispanic | .1% other
Old Demographics: 79% white | 16.6% black | .3% Native American | 1.1% Asian | 2% Hispanic | 1% other
Old District: 72.6% white | 22.7% black | .3% Native American | .9% Asian | 4.1% Hispanic | .2% other
The 3rd loses more of Muscogee County /Columbus to the 2nd and some of its Metro Atlanta area but now goes to the Macon area, making it more of a Central Georgia district.  Other than the peninsulas from the 2nd district, it's actually more compact than before. This area has diversified at a pretty good clip, but even running 80 MPH takes a long time when you're driving from New York to Los Angeles.  Plus, it's still demographically very similar to Westmoreland's old district.  Looks like we would have to deal with his “uppity” ass for a while.

4th District (Hank Johnson [D]) RED
New Demographics: 29.9% white | 53.4% black | .2% Native American | 4.3% Asian | 10.8% Hispanic | 1.2% other
Old Demographics: 31.3% white | 54.3% black | .2% Native American | 4.1% Asian | 8.1% Hispanic | 2% other
Old District: 35.8% white | 53.5% black | .4% Native American | 4.3% Asian | 8.5% Hispanic | 0% other
I undid the horrendous four-way cracking of DeKalb, replacing it with a two-way split.  The fourth occupies the overwhelming majority of DeKalb, having been moved completely out of Gwinnett and Rockdale Counties and absorbing DeKalb areas from the 5th, 6th, and 13th.  Even though North DeKalb is pretty white, the additions from Central and South DeKalb more than make up for it.  The district gets a little less black but even more minority than before.  Hank Johnson will win easily.

5th District (John Lewis [D]) YELLOW
New Demographics: 29.9% white | 57.9% black | .2% Native American | 2.8% Asian | 8.2% Hispanic | 1% other
Old Demographics: 31.2% | 59.6% black | .2% Native American | 2% Asian | 5.7% Hispanic | 1.3% other
Old District: 37% white | 56.1% black | .2% Native American | 2.2% Asian | 6.1% Hispanic | 0% other

Pretty similar to its current form, especially in Clayton and Fulton Counties.  It's still an Atlanta plus some inner-ring suburbs districts, taking in slighly less of Forest Park and South Fulton but a bit more of unincorporated Clayton and a bit more of Sandy Springs.  The big difference is it being reducing to about 45% of it's DeKalb area, including its portion of Decatur, and is basically left with the DeKalb portion of Atlanta plus some areas northeast of this area.  John Lewis has nothing to worry about.

6th District (Tom Price [R] vs. Phil Gingrey [R]) TEAL
New Demographics: 75.3% white | 9% black | .3% Native American | 6.3% Asian | 7.7% Hispanic | 1.5% other
Old Demographics: 80.6% white | 7.9% black | .2% Native American | 4.3% Asian | 5.1% Hispanic | 1.8% other
Old District: 85.6% white | 7% black | .2% Native American | 4% Asian | 4.5% Hispanic | .1% other
This is one of my “fuck with the Republicans” districts.  Like before, the district includes white, affluent, Republican North Fulton County (including Tom Price's home) and East Cobb (likewise white, affluent, and Republican).  However, instead of going east to take up North DeKalb County and north to pick up Cherokee County, it goes west to take up the northern half of Cobb County.  In the general election, this doesn't mean anything; it's still a heavily white, Republican district in which we have no bench (although there is some diversification and it now includes a major state university).  However, the district now includes Phil Gingrey's home between Kennesaw and Marietta!

7th District (John Linder [R] vs. ?) GRAY
New Demographics: 68.1% white | 10.8% black | .3% Native American | 6.1% Asian | 13.5% Hispanic | 1.2% other
Old Demographics: 79% white | 6.8% black | .2% Native American | 3.9% Asian | 8.7% Hispanic | 1.3% other
Old District: 85.2% white | 7.1% black | .3% Native American | 3.8% Asian | 5.4% Hispanic | .1% other

Same thing with as with the 6th.  Linder loses more of the diverse areas of Gwinnett County to the 14th, as well as the Newton, Walton, and Barrow County portions.  In return, he gains almost all of Forsyth County and the Southern half of Hall County.  Depending on who wins the Republican primary in the current 9th district, this may set up a primary in this new 7th.  Regardless, this will be a Republican seat for the foreseeable future.  However, it's rapidly diversifying with every minority group taking up a larger share than before.  I think Linder's days are numbered.  It may be a fairly big number, but numbered all the same.

8th District (Jim Marshall [D]) PERIWINKLE
New Demographics: 54.2% white | 40% black | .2% Native American | 1.1% Asian | 3.6% Hispanic | 1% other
Old Demographics: 55.6% white | 39.8% black | .2% Native American | .8% Asian | 2.6% Hispanic | 1% other
Old District: 64% white | 32.6% black | .2% Native American | .8% Asian | 2.8% Hispanic | 1.4% other
Basically, I shifted the district southward and worked to make sure it was more favorable on a presidential level in anticipation of Marshall's eventual departure for higher office.  So, this meant I had to cut almost all of Laurens County out of the district.  Marshall won it big, but Obama lost it big, and Marshall performed less strikingly there in the past.  I regrettably had to remove Dem-trending Newton County from the district, but the benefit from having it in the district was outweighed by the cost of having four heavily Republican counties in the district to connect Newton to the rest of the district, especially considering Marshall only barely won Newton and lost it in 2006.  While I was at it, I also cut out the whiter parts of Bibb County.  I also removed the troublesome Colquitt County, home of Saxby Chambliss and added a few blue and purple counties along the boomerang.  I also shifted down to add Valdosta, thus increasing our bench as all four members of the state legislature from this area are Democrats.  I would have liked to have removed the more Republican parts of Houston County, but I don't know where I'd make up the lost population, but, overall, I think I made Marshall's life much easier, as the district has gotten significantly more diverse and more Democratic. Maybe he can suck less.

9th District (?) CYAN
New Demographics: 85.2% white | 3% black | .3% Native American | .8% Asian | 10% Hispanic | .8% other
Old Demographics: 89.9% white | 2.6% black | .3% Native American | .6% Asian | 6.6% Hispanic | .9% other
Old District: 82.5% white | 13.7% black | .3% Native American | 1.2% Asian | 2.6% Hispanic | .1% other
I made this district more rectangular, removing the parts that dip into the Metro Atlanta area (for the past part), giving it Chattooga and the rest of Gordon Counties, and stretching it all the way to the South Carolina border.  So, now it borders four different states.  I don't know who it will be, but this district will elect a Republican.  We have no bench whatsoever, and this would be the whitest district in Georgia.  Not only is it the whitest district, but, despite some diversification, it's also the least diverse; the majority black districts are more diverse. 

10th District (Paul Broun [R]) HOT PINK
New Demographics: 77% white | 16.3% black | .2% Native American | 1.7% Asian | 3.7% Hispanic | 1.1% other
Old Demographics: 79.9% white | 15.4% black | .2% Native American | 1.3% Asian | 2% Hispanic | 1.1% other
Old District: 89.7% white | 3.4% black | .3% Native American | .7% Asian | 9.2% Hispanic | .3% other

Other than having the tentacle from the 12th come in, the new 10th actually has a pretty regular, compact shape compared to its predecessor.  It still has a lot of its area along the South Carolina border, including the white, Republican suburbs of Augusta, but now includes parts of the Atlanta and Macon exurbs.  It's actually ten points less white than before, but means it's now only 77% white.  In other words, don't expect Broun to go anywhere, unless he gets primaried, which may happen now that a lot of his Athens primary base is gone.

11th District (New Seat) [This would be my district, by the way] NEON GREEN
New Demographics: 79.5% white | 11% black | .3% Native American | 1.3% Asian | 6.8% Hispanic | 1.2% other
Old Demographics: 86.1% white | 7.8% black | .2% Native American | .9% Asian | 3.9% Hispanic | 1.1% other
Old District: 64.8% white | 28.5% black | .3% Native American | 1.3% Asian | 7.2% Hispanic | .1% other
The new 11th looks a lot like the old 11th but becomes more exurban and suburban.  It sheds Chattooga County and its portions of Cobb and Gordon Counties for East Douglas County , a sliver of Forsyth County, and Cherokee County.  I fear I may be switching one wingnut for another in redistricting Gingrey out of his district.  We only have one state legislator in the district and he would be an idiot to try for it.  This is a demographically unfriendly district, although there may be some solace to tke from its diversification.  Still, there's a long way to go before this one's demographics are promising.

12th District (John Barrow [D]) POWDER BLUE
New Demographics: 47.4% white | 45.8% black | .2% Native American | 1.6% Asian | 4.2% Hispanic | 1.2% other
Old Demographics: 47.5% white | 44.3% black | .2% Native American | 1.4% Asian | 3.2% Hispanic | 1.3% other
Old District: 50.8% white | 44.5% black | .2% Native American | .8% Asian | 2.7% Hispanic | .1% other
I removed all or parts of some troublesome majority white, Republican counties (Bulloch, Candler, Effingham, Emmanuel, Mongtomgery, Tattnall, Treutlen, and Toombs) leaving only the areas that were more minority and/or necessary to maintain contiguousness.  In their place, I added heavily Democratic Liberty County by wrapping the district around the coastal areas of Chatham County and using water continguousness.  On the northside, I added some more of Augusta, the blacker parts of Green, and readded Clark County,  The district gets a little blacker and a lot of the old, rural white voters are replace with white voters in a college county more apt to not only vote Democratic but to vote for a black Democrat if and when Barrow gets primaried by a black Democrat.  In becoming more Democratic, I was able to free up some smaller counties along the boomerang for Jim Marshall.

13th District (David Scott [D]) SALMON
New Demographics: 36% white | 46.6% black | .3% Native American | 3% Asian | 12.6% Hispanic | 1.6% other
Old Demographics: 47.1% white | 39.6% black | .3% Native American | 2.4% Asian | 8.6% Hispanic | 2% other
Old District: 47% white | 44.1% black | .3% Native American | 5.1% Asian | 10.1% Hispanic | .1% other
The 13th stays the same mostly.  I removed some of Northeast Clayton County and added more of Central Cobb.  I also added some of the relatively more minority areas of North Fayette.  Overall, Scott's district, once plurality white, is now plurality black.  He'll do fine.

14th District (New District) OLIVE
New Demographics: 36.1% white | 36.4% black | .2% Native American | 7.7% Asian | 18.1% Hispanic | 1.5% other
Old Demographics: 54.7% white | 24.4% black | .2% Native American | 6.4% Asian | 12.3% Hispanic | 1.9% other

Last and certainly not least is the new 14th district.  This district wraps around the southeastern quadrant of the middle ring suburbs, taking in the blue and blueing areas, including Morrow, Stockbridge, McDonough, Conyers, Covington, Norcross, Lilburn, and Lawrenceville.  It would be by far Georgia's most diverse district, having the highest numbers of Asians and Hispanics, the second-highest number of “others,” is plurality black, and still has a respectable white population.  As you can see from the demographic trends, this one is getting even more diverse really quick.  This diversity is reflected in the state legislators whose districts are entirely or partially within the district which includes whites, blacks, and Hispanics.  If it doesn't elect a Democrat, then the Democratic Party has fucked up.


It's also interesting to look at the districts with the old numbers and see which areas are growing and which areas are stagnant or losing populations by seeing how under or over populated they are compared to the 2000-14 district average.  Judging from the numbers, the Southern and Central Georgia are rapidly atrophying.  The 2nd would have had 90,888 extra people!  The 1st would have 40,693, the 8th 55,570, and the 12th 67,639.  The third is pretty much stagnant, having just 2,366 extra people.  If this keeps up, I think we may be looking at the elimination of a district in Middle and South Georgia, and I think it would be a Democrat (my guess would be Marshall's district because of its centrality.

So, where are the people going?  To Metro Atlanta.  The 10th is 15,007 below average, much/most of which I suspect to be from the Metro portions of the district. The 5th is 22,014 under the average.  The 13th 26,921 under.  The 11th and 7th are under by over 60,000, 63,039 and 62,317, respectively.  The 14th is a whopping 120,767 under average.  Only the 4th and 6th are above average, to the tune of 36,782 and 11,235, respectively. 

FL and GA on Dave’s App.

Having mapped most of the country in my absurdly low-tech fashion, the release of Dave’s redistricting application (and bandwagon appeal) compels me to revisit some of these states with better data. I’ll start with Florida and Georgia, two states covered by recent diaries but for which my approach is decidedly different.

These maps resemble what I drew on Paint, but not exactly.

Below the fold…

Florida

Like my Paint-generated Florida map, this is based on the assumption of a Republican plan, and more or less consists of incumbent protection with few exceptions (since it does generally protect incumbents, the map wouldn’t be dramatically different if Alex Sink was elected). Re: the Voting Rights Act, I was not able to preserve a black majority in Corrine Brown’s district; 47% was as close as I could seem to get, but with the white population at 40%, other minority groups would seem to make FL-3 VRA-protected.

The new 26th, as in my original iteration, is a modestly GOP-leaning Central Florida seat between the Ocala area and Lake Okeechobee.

The northern half of the state:

Photobucket

The southern half of the state:

Photobucket

Focus on South Florida:

Photobucket

District 1 (blue) – Jeff Miller (R-Chumuckla)

Counties: Escambia, Holmes, Okaloosa, Santa Rosa, Walton

Large minorities: 14% black

Politics: strong Republican

District 2 (dark green) – Allen Boyd (D-Monticello)

Counties: Bay, Calhoun, Dixie, Franklin, Gadsden, Gulf, Jackson, Jefferson, Lafayette, Leon, Liberty, Madison, Taylor, Wakulla, Washington

Large minorities: 25% black

Politics: Republican-leaning when Boyd retires

District 3 (purple) – Corrine Brown (D-Jacksonville)

Counties: Alachua, Clay, Duval, Lake, Orange, Putnam

Large minorities: 47% black (just 40% white)

Politics: strong Democratic

District 4 (red) – Ander Crenshaw (R-Jacksonville)

Counties: Baker, Columbia, Duval, Hamilton, Nassau

Large minorities: 15% black

Politics: strong Republican

District 5 (yellow) – Ginny Brown-Waite (R-Brooksville)

Counties: Citrus, Dixie, Gilchrist, Hernando, Levy, Pasco

Large minorities: none

Politics: strong Republican

District 6 (aquamarine) – Cliff Stearns (R-Ocala)

Counties: Alachua, Baker, Bradford, Clay, Columbia, Hamilton, Marion, Suwannee, Union

Large minorities: 11% black

Politics: strong Republican

District 7 (gray) – John Mica (R-Winter Park)

Counties: Flagler, Lake, Putnam, Seminole, St. Johns, Volusia

Large minorities: 12% Hispanic, 11% black

Politics: generally Republican

District 8 (lavender) – Alan Grayson (D-Orlando)

Counties: Orange

Large minorities: 27% Hispanic, 10% black

Politics: tilting/trending Democratic

District 9 (turquoize) – Gus Bilirakis (R-Palm Harbor)

Counties: Hillsborough, Pasco, Pinellas

Large minorities: 14% Hispanic

Politics: tilting Republican

District 10 (fuchsia) – Bill Young (R-Indian Shores)

Counties: Pinellas

Large minorities: none

Politics: swing/leaning Republican

District 11 (yellow-green) – Kathy Castor (D-Tampa)

Counties: Hillsborough, Pinellas

Large minorities: 28% black, 24% Hispanic

Politics: strong Democratic

District 12 (sky blue) – Adam Putnam (R-Bartow)

Counties: Hardee, Hillsborough, Marion, Polk, Sumter

Large minorities: 15% Hispanic, 12% black

Politics: generally Republican

District 13 (pink) – Vern Buchanan (R-Sarasota)

Counties: DeSoto, Hardee, Manatee, Sarasota

Large minorities: 11% Hispanic

Politics: generally Republican

District 14 (olive) – Connie Mack (R-Fort Myers)

Counties: Charlotte, Collier, Lee

Large minorities: 16% Hispanic

Politics: strong Republican

District 15 (orange) – Bill Posey (R-Rockledge)

Counties: Brevard, Indian River, St. Lucie

Large minorities: 11% black

Politics: generally Republican

District 16 (green) – Tom Rooney (R-Tequesta)

Counties: Charlotte, DeSoto, Glades, Hendry, Highland, Martin, Palm Beach, Okeechobee, St. Lucie

Large minorities: 16% Hispanic

Politics: tilting Republican

District 17 (ash purple) – Kendrick Meek (D-Miami)

Counties: Broward, Miami-Dade

Large minorities: 52% black, 28% Hispanic

Politics: strong Democratic

District 18 (yellow) – Ileana Ros-Lehtinen (R-Miami)

Counties: Miami-Dade, Monroe

Large minorities: 63% Hispanic

Politics: swing/leaning Republican

District 19 (chartreux) – Robert Wexler (D-Boca Raton)

Counties: Broward, Palm Beach

Large minorities: 22% Hispanic

Politics: strong Democratic

District 20 (light pink) – Debbie Wasserman Schultz (D-Weston)

Counties: Broward, Miami-Dade

Large minorities: 31% Hispanic, 11% black

Politics: strong Democratic

District 21 (maroon) – Lincoln Diaz-Balart (R-Miami)

Counties: Miami-Dade

Large minorities: 72% Hispanic

Politics: swing/leaning Republican

District 22 (brown) – Ron Klein (D-Boca Raton)

Counties: Broward, Palm Beach

Large minorities: 15% Hispanic

Politics: tilting Democratic

District 23 (mint green) – Alcee Hastings (D-Miramar)

Counties: Broward, Palm Beach

Large minorities: 52% black, 18% Hispanic

Politics: strong Democratic

District 24 (violet) – Suzanne Kosmas (D-New Smyrna Beach)

Counties: Brevard, Flagler, Orange, Seminole, Volusia

Large minorities: 13% Hispanic

Politics: swing

District 25 (salmon) – Mario Diaz-Balart (R-Miami)

Counties: Collier, Miami-Dade, Monroe

Large minorities: 65% Hispanic

Politics: swing/leaning Republican

District 26 (charcoal) – New

Counties: Highland, Lake, Marion, Okeechobee, Osceola, Polk

Large minorities: 25% Hispanic

Politics: tilting Republican

Georgia

While it’s possible Roy Barnes or another Democrat will win the open governor’s mansion (a possibility in Florida too), I’m tentatively betting on a GOP gerrymander that finally cracks Jim Marshall’s district and makes the districts of Sanford Bishop and John Barrow majority-minority at last (Bishop’s would have an outright black majority, Barrow’s being 48% black and 46% white).

The most controversial choice I made was to kill those two birds with one stone by dividing Marshall’s Macon base, giving most of urban Macon (which is heavily black) to Bishop (thereby forcing Marshall against the more entrenched Bishop in a majority-black district based in Southwest Georgia that Bishop would be clearly favored to win) and rendering the 8th even more rural and white.

I kept all three black-majority Atlanta districts over 50%, did my best to protect GOP incumbents in the suburbs, and created a new GOP-leaning suburban seat. In short, the quintessential Republican map. The only part I may have seriously screwed up was Linder’s district…it’s getting harder and harder to keep his portion of Gwinnett County solidly in GOP hands, and the 7th is now the most diverse district in the state.

Photobucket

Photobucket

District 1 (blue) – Jack Kingston (R-Savannah)

Description: entire coastline, rural South Georgia, white areas of Savannah, Valdosta, Vidalia

VRA stats: 72% white, 21% black

Politics: strong Republican

District 2 (dark green) – Sanford Bishop (D-Albany) vs. Jim Marshall (D-Macon) [Bishop would likely win primary in mostly intact but newly black-majority district despite Marshall’s Macon base)

Description: rural Southwest Georgia, Columbus, Albany, most of Macon and Valdosta

VRA stats: 52% black, 42% white

Politics: generally Democratic

District 3 (purple) – Lynn Westmoreland (R-Grantville)

Description: Atlanta exurbs to the south

VRA stats: 68% white, 25% black

Politics: strong Republican

District 4 (red) – Hank Johnson (D-Lithonia)

Description: most of DeKalb County

VRA stats: 51% black, 32% white, 11% Hispanic

Politics: strong Democratic

District 5 (yellow) – John Lewis (D-Atlanta)

Description: heart of Atlanta, remainder of DeKalb County

VRA stats: 54% black, 34% white

Politics: strong Democratic

District 6 (aquamarine) – Tom Price (R-Roswell)

Description: north Atlanta suburbs — Cherokee County, portions of Bartow and Cobb, north Fulton

VRA stats: 78% white

Politics: strong Republican

District 7 (gray) – John Linder (R-Duluth)

Description: most of Gwinnett County, small portion of Forsyth

VRA stats: 47% white, 22% black, 18% Hispanic, 11% Asian [most diverse, and rapidly diversifying, district in the state; this could be serious trouble for the Republicans by the mid-to-late 2010s]

Politics: tilting Republican but trending Democratic

District 8 (lavender) – open/not Jim Marshall

Description: far southern outskirts of Atlanta MSA, Warner Robins, rural Middle Georgia, down to Thomasville and Quitman

VRA stats: 66% white, 27% black

Politics: fairly strong Republican

District 9 (turquoise) – Nathan Deal (R-Gainesville)

Description: Appalachian North Georgia, Dalton, Gainesville, far north exurban Atlanta

VRA stats: 80% white, 13% Hispanic

Politics: strong Republican

District 10 (fuchsia) – Paul Broun (R-Athens)

Description: Northeast Georgia, Athens, north and west Augusta

VRA stats: 77% white, 15% black

Politics: strong Republican

District 11 (yellow-green) – Phil Gingrey (R-Marietta)

Description: northwest Atlanta suburbs/exurbs, much of Cobb County

VRA stats: 67% white, 19% black

Politics: strong Republican

District 12 (sky blue) – John Barrow (D-Savannah)

Description: southeast Augusta, northwest Savannah, rural eastern Georgia [meant to concentrate black population]

VRA stats: 48% black, 46% white [not quite a majority but closer than before]

Politics: generally Democratic

District 13 (pink) – David Scott (D-Atlanta)

Description: south Fulton County, all of Clayton and Douglas, southeast Cobb

VRA stats: 52% black, 33% white, 10% Hispanic

Politics: strong Democratic

District 14 (olive) – New

Description: east Atlanta suburbs/exurbs — most of Forsyth County, remainders of Gwinnett and Hall, stretching south through Barrow, Walton, Rockdale, Newton, and Butts

VRA stats: 71% white, 18% black [I should definitely have weakened Republican strength here for Linder’s benefit…live and learn, I guess!]

Politics: strong Republican [again, split the difference between this and the 7th and you have two fairly strong GOP districts]

So there you are, computer-generated equivalents of two of my maps. I’ve also done Texas and Missouri on Dave’s app and will post those at a later date.