5-7-6 PA Gop compromise/fair districts

I made a map with two goals. They were:

1.) Keep cities together, and if possible, counties

2.) Make the district without care for partisanship

Philadelphia is the only city in more than one cd, and only four counties have 3 or more cds in them (Allegheny, Philadelphia, Chester, and Montgomery. 4 out of 69 aint bad, considering that Philadelphia has to be.)

There is high upside here for both parties, and this is a decent compromise, although more favorable to the republicans. It comes down to if you believe 2008 or 2010 is the closer to reality.

I really only think one picture is necessary due to the nature of this exercise. If anyone wants a zoomed view, lemme know. All are under 1000 off the ideal population.

District 1 (Blue): 53% Black, 88% Obama

Entirely Philadelphia. Safe as could be. 1-0-0

District 2 (Green): 36% B, 14 Hispanic, 5 Asia, 80% O

Entirely Philadelphia. Safe as could be. 2-0-0

District 3 (Dark Magenta): 58% O

North-East Philly, and parts of Montgomery and Bucks. Leans very D. 3-0-0

District 4 (Red): 61% O

Delco and a part of montco. Likely D. 4-0-0

District 5 (Gold): 54% O

Rest of Montgomery and Bucks, plus a tiny bit of chester. Toss-up, Leans slightly R. 4-0-1

District 6 (Teal): 56% O

Bethlehem, Allentown, Easton and their counties, plus a bit of monroe. Toss-up, Leans slightly D. 4-0-2

District 7 (Dark Grey): 56% O

Scranton, Wilkes-Barre and the surrounding area. Toss-Up, Leans slightly D. 4-0-3

District 8 (Slate Blue): 53% M

A few small cities (Hazelton, Bloomsburg, Pottsville), but a lotta empty area. Likely R. 4-1-3

District 9 (Cyan): 55% O

Reading, the rest of Berks and a huge part of chester county. Pure Toss-Up 4-1-4

District 10 (Deep Pink): 56% M

Lancaster, Lebanon and space. Likely R. 4-2-4

District 11 (Chartreuse): 51% M

Harrisburg and York. Lean M. 4-3-4

District 12 (Cornflower Blue): 63% M

Not a lot going on here. Safe R. 4-4-4

District 13 (Dark Salmon): 54% M

North PA. Surprised it is this close tbqh. Likely R. 4-5-4

District 14 (Olive): 49% O (Wins by about 600 votes).

Erie. Toss-Up, Leans R. However, I think obama underperformed what a congressional D could do here so i’m counting it in the toss-up.  4-5-5

District 15 (Dark Orange): 55% M

North of Pitt. Likely R. 4-6-5

District 16 (Lime): 64% O

Pittsburgh. Safe D. 5-6-5

District 17 (Dark Slate Blue): 50% O

South of Pitt. Toss-Up, Leans R. 5-6-6

District 18 (Yellow): 56% M

The rest, includes Altoona. Likely R. 5-7-6.

Not the best either side could do, but most definitely fair. Both sides have reason to believe they could win a lot of the toss-ups. I hope the gopers believe that anyways. Well, lemme know.

36-0 Texas

The hardest thing for me to remember when making GOP friendly gerrymanders is that a 50% John MctCain district isn’t a toss-up but a likely R district, similar in theory to a 60% Obama District. 5 points more friendly to the gop then the nation as an average implies that, but it is somewhat tricky for me, at least, to wrap my mind around it. However, that was my goal when I started North Carolina: create as many districts that went GOP in 08 as possible. After getting an 11-2 in a state that went for Obama, i figured a 36-0 in Texas was possible. and it was. One district voted for Obama by less than 1000 votes, so I’m going to count it. A 59% Obama district would be okay for most of us here… Without further ado, MAPS!

As always, ask me and i will provide a zoomed in map of whatever area you wish if it isn’t clear from the big one.

http://img.photobucket.com/alb…

http://img.photobucket.com/alb…

El Paso: http://img.photobucket.com/alb…

District 1 (Blue):  Mccain 56%, 56% Hispanic

El Paso and Odessa

District 2 (Green): M 53%, 63% H

Rest of El Paso and some nearby counties

San Antonio and Austin: http://img.photobucket.com/alb…

District 3 (Purple): M 50%, 60% H

South San Antonio

District 4 (Red): M 51%, 50% H

North and West Antonio

District 5 (Yellow):  M 51%, 40% H, 10% Black, 3% Asian

East and North San Antonio

District 6 (Teal): M 50%, 72% H

Laredo and some Border counties, then up to West Texas

District 7 (Gray): M 50%, 66% H

McAllen and Border areas all the way up to Bastrop and Fayette Counties

District 8(Violet) M 51%, 62% H

Brownsville, Mcallen and then up.

District 9(Sky Blue): M 51%, 59%  H

Brownsville, Harlingen, up to Williamson and Milam counties.

District 10 (Pink):  M 50%, 35% H, 16% B, 3% A

Corpus Christi and up

Houston:  http://img.photobucket.com/alb…

District 11 (Lemon-Lime Green): M 55%,  55% White

South of  Houston

District 12 (Blue-Line Green) :  M 56%, 22% H, 20% H, 11% A

Some of the south-west of Houston and then surroundin areas.

District 13(Light Brown): M 53%, W 52%

Houston and some areas north

District 14(Gold):  M 57%,  W 61%

Houston and some areas north

District 15 (Orange): M 52%, 32% H, 19% B, 4% A

South of Houston, with a bit of the city

District 16(Lime Green):  M 52%, 39% H, 12% B, 4% A

Houston and Areas East

District 17(Navy blue): M 52%, 41% H,  16% B

Houston and Areas North East

District 18 (Golden Yellow):  M 56%, 56% W

North of Houston

District 19 (Puke Green): M 56%, 65% W

Wraps around 11-17

District 20 (Light Pink): M 52%, 59% W

Wraps around Austin and takes part of the city then to Abilene

District 21 (Blood Red): M 54%, 66% W

Parts  of Austin then  going to sparsely populated Northern Texas

District 22 (Poo Brown):  M 51%, 79% W

Austin and North Texas

Dallas-FW: http://img.photobucket.com/alb…

District 23 (Robin’s Egg Blue): M 54%, 57% W

Dallas and some northern suburbs

District 24 (Dark Purple):  M 56%, 59% W

Dallas and Some Eastern areas

District 25 (Rose): M 54%,  59% W

Dallas then to some less populated eastern areas

District 26 (Silver) M 58%,   54% W

Dallas, FW, then to North Texas

District 27 (Sea Green) M 49%, 54% W

Dallas, FW, then to North Texas

District 28 (Pinkish Purple) M 60%, 57% W

Irving, then up to North Texas

District 29 (Gray Green): M 53%, 60% W

Waco and Forth Worth

District 30 (slightly lighter shade of rose then

the one touching it): M 55%, 60% W

Parts of Arlington, Dallas and Fort Worth

District 31 (Tan): M 61%, 71% W

North Fort Worth and Dallas then North

District 32 (Red Orange): M 64%, 79% W

North FW and then northern areas surrounding it

District 33 (I can’t name that many different shades of blue): M 63%, 80% W

North of Dallas

District 34 (Somewhat dark-green): M 69%, 75% W

Wraps around a lot of other districts, filling in a lot of gaps

District 35 (Royal Purple): M 62%, 64% W

Everything Else Part 1

District 36 (Not Flyers Orange, but I’m using it anyways): M 68%, 69% W

Everything Else, Part 2

This is not a perfect 36-0 Map. The last 5-6 districts could bleed some republican voters to some of the more borderline districts. However, in an ok to good year, the republicans win all 36 seats barring an exceptional democratic candidate.

Dave’s seems to have deleted my other maps. I’ll redo them later and either edit this diary or do a new one, depending on what you guys thing.

12-6 GOP gerrymander of PA (updated with maps)

With Pennsylvania set to lose a congressional district in 2010, and with the GOP now in charge of the process (again), here’s what a 12-6 map might look like.  It’s quite ugly but ugliness is perhaps the only way the GOP can take a light blue state and cement a 12-6 hold on its congressional delegation!  (Bear in mind, Bush II never carried PA).  Even as is, I think a 12-6 map, eliminating just one Democratic congressman, is perhaps a dummymander.  Southeastern PA, especially, is trending away from them.  But I see no way the GOP is going to sacrifice one of their own to make a more sensible 11-7 map.

Ok, here goes… and I’ve renumbered the districts roughly west to east… can’t understand why PA, OH, FL, TX, and a few other states have district numbers that jump all over the place!

Photobucket

District 1 (blue): Altmire (D) OR Dahkemper (D): Erie, New Castle, Dem areas of SW PA

Obama 55, McCain 44

This is perhaps the ugliest district in the entire map, and its purpose is as a Democratic vote sink so that neighboring CD #2 becomes much safer for the GOP.  Still surprising that it isn’t all that Democratic-performing going by Obama’s vote percentage.


District 2 (green): Kelly (R)

Obama 42, McCain 57

Kelly gets a considerably safer district with the removal of Erie into CD #1.

Photobucket

District 3 (purple): Doyle (D)

Obama 68, McCain 31

Still a ridiculous vote sink around the Pittsburgh area.  District extends south a bit to gain some of the southern-most suburbs and thereby helps Murphy’s district become a bit redder.

District 4 (red): Murphy (R)

Obama 42, McCain 57

Republican suburbs in southern Allegany County, most Republican areas of Washington County, and almost all of now GOP-leaning Westmoreland County.  Murphy should be happy with this district.

District 5 (yellow): Thompson (R)


Obama 44, McCain 54

A more condensed version of the PA wilds district that you drive through on I-80.

District 6 (teal green): Shuster (R) vs. Critz (D)


Obama 41, McCain 58

If you were to get rid of a Democrat out of the 7, Critz is the safest one to get rid of.  The ruby-red mountains of PA drown out whatever Democratic votes Critz may be able to get out of Johnstown or Fayette/Somerset counties.  This should be safe for Shuster, unless he forgot how to campaign like Gekas in 2002.

District 7 (grey): Platts (R)

Obama 42, McCain 57

Stays largely the same.

District 8 (purple): Marino (R)

Obama 44, McCain 54

The GOP is faced with a real dilemma in NE PA in that they have 2 GOP freshmen incumbents to protect in an area that should by rights only elect one of them.  Because of this, they realistically cannot target Holden as they did in 2002.  Because of the need to give safer districts to Barletta (and, realistically, Dent – certainly if I were a GOP mapmaker I’d hedge my bets there), this district shifts south to grab all of Dauphin County.  The Democrats of Harrisburg are drowned out by the Republicans of Lycoming and other GOP counties between the two…. Best of all, while it is possible for a Democrat to win this district, Christopher Carney no longer lives in this district.

Photobucket

District 9 (sky blue): Barletta (R)

Obama 45, McCain 54

Through clever conceding of the most Democratic areas of his current district to Tim Holden’s neighboring 10th, this district becomes a carbon-clone of the 9.  Goes from the Republican T south to northern Berks County, but aside from swingy areas in Lackawanna and Luzerne County, this is a lean-GOP district, although it includes the home of Chris Carney, most of the district would be unfamiliar to him.

District 10 (pink): Holden (D)

Obama 61, McCain 37

This is Northeastern PA’s Democratic vote sink.  It accordingly helps out Baretta and Dent.  It helps out the latter by removing Bethlehem, the city of Dent’s 2010 challenger, and about 1/2 of Allentown, through a narrow ugly tendril southward from Carbon County.  Hoping that the part that Dent lives in is in neighboring CD 11; if not, it can easily be rectified by swapping precincts in Allentown.  From there it extends north to include all of the Democratic-rich areas of Scranton and its environs; ditto with Wilks-Barre and other Democratic areas of Luzerne.  It also includes the more Democratic eastern half or so of Schuylkill County, where Holden lives.

Photobucket

District 11 (neon green): Dent (R)

Obama 53, McCain 46

This district becomes a bit safer for Dent by extending north a bit along the Delaware River to Monroe, Pike, and Wayne counties.  It loses Bethlehem and part of Allentown through a narrow tendril in the 10th district.  Although Dent easily gets reelected in his district, his 2010 opponent, the mayor of Bethlehem, presented Dent with a tough race.  He now can run in a Democratic primary against Holden if he wishes.

Photobucket

District 12 (slate blue, I guess): Gerlach (R)

Obama 52, McCain 47

For slaving it out cycle after cycle, Gerlach gets a much safer more exurban district.  Lebanon, the rest of Berks not in CD 10, including all of Reading, which Gerlach can handle, a bit of northern Montgomery, and the northern half or so of Chester, where Gerlach is from.

District 13 (peach): Pitts (R)

Obama 47, McCain 52

Lancaster and the southern bit of Chester, where Pitts is from.  One is tempted to make this even more Democratic still to help out fellow SEPA Republicans elsewhere, but Pitts would be endangered if this district got any bluer than it is.  Indeed, if Lancaster follows Chester in becoming the next red-to-blue suburb of SE PA, I wouldn’t be surprised if Pitts retired and was replaced either with a more moderate Republican or a Democrat.

District 14 (ugly green): Meehan (R)

Obama 53, McCain 46

mostly the same as before in Delaware County, with a few more heavily-Democratic areas such as Media, the areas around Swarthmore College, and heavily black areas in Upper Darby and Lansdowne removed into Brady’s 18th.  The district extends a bit further into carefully chosen precincts in Montgomery County, with Schwartz taking the most Democratic ones.  Meehan should be fine.

District 15 (orange): Fitzpatrick (R)

Obama 52, McCain 47

Bucks County finally gets partitioned, with Bristol, the home of Murphy, and the most Democratic areas nearest Philadelphia removed into Schwartz’s 16th and replaced with more GOP areas in Montgomery County.  The district gets 2-3% more Republican than currently is the case as a result.  About the best that can be done for Fitzpatrick.

District 16 (light green): Schwartz (D)

Obama 64, McCain 35

There we have it, an effective Democratic vote sink in SEPA that helps out all of the endangered GOP congressmen surrounding it.  It carefully takes in the most Democratic areas of Montgomery and Bucks and connects the two through also taking in a large part of NE Phily.  

District 17 (dark purple): Fattah (D)

Obama 88, McCain 12

55% black, 34% white, 5% Hispanic

Largely the same as before, gaining more areas in NE Phily to equalize its population.  Black % drops but still VRA-compliant by a long way.


District 18 (yellow): Brady (D)

Obama 87, McCain 13

44% black, 30% white, 18% Hispanic

Again, largely the same as before.  Extends a bit further into Delaware County to vacuum up heavily-Democratic precincts in favor of Meehan; likewise it takes a bit more of NE Phily than it did before.  Still, it retains its position as a minority-majority VRA-complaint coalition district.

Pennsylvania gets wyoming’d

First of all, this is my first diary and my first redistricting so be gentle! Also, there is one small error in the bigger pictures, however it is fixed in the zoom ones.

I basically did a very dem friendly redistricting of Pennslyvania under the Wyoming plan. This gives PA 25 seats of about 491,242 that MassGOP has made diaries on.

Without further ado, the map: http://img.imgcake.com/pajpgbu…

Without counties/cities: http://img.imgcake.com/paunmar…

Zoom on Philadelphia: http://img.imgcake.com/phillyu…

East PA: http://img.imgcake.com/eastpai…

SEPA: http://img.imgcake.com/southea…

District 1 (Blue): Obama 73%

Plurality Minority  

Goes from Philly to chester county, covering most of delco along the way. I was surprised how democratic the district was. 49 W 44 B

District 2 (Green): Obama 58%

Just gave the district a chunk of philly then tried to make it more conservative, so it went into Bucks, Montgomery and most of South Delaware. Should be reasonably safe.

District 3 (Purple): Obama 56%

Northeast Philly and wraps around the 2nd and 4th. Most bucks, but also Northampton and Lehigh. Would lean strongly D, and it would only get moreso. Would be vulnerable in another 2010 like year.

District 4 (Red): Obama 55%

Takes Allentown and half of Bethleham. Goes into Montgomery, Bucks, a lot of lehigh, and northhampton. Should be ok in most years.

District 5 (Yellow): Obama 55%

Rest of Bethleham, Easton, and most of Hazleton. All of carbon and monroe counties. Only 2 people off the population goal. Should lean Dem.

District 6 (Teal): Obama 53%

Wilks-Barre, the scranton suburbs, a tiny piece of scranton, all of Montour, columbia counties and the majority of wyoming, luzurne and lackawanna. (Thank you the office for spelling of that). Would tilt D but probably require a blue dog.

District 7 (Silver): Obama 54%

The funniest district in the state, containing the rest of scranton, most or all of 3 northeastern counties, and going all the way to Penn State. Leans D

District 8 (Violet): Obama 64%

This one is ugly. Starts in Philly and just goes out. Snakes through Montgomery to get some of the central pa counties like Snyder and Mifflin. Easy D.

District 9 (Sky Blue) Obama 58%

The most Liberal parts of delco and montco along with eastern chester county. Leans D pretty heavily.

District 10 (Pink) Obama 53%

Harrisburg, Half of Lancaster and coatsville. Pretty tough to hold but def doable. Leans slightly

District 11 (Lime Green): Obama 73%

Starts in Philly and snakes.

District 12 (Robin’s Egg Blue): Obama 57%

Starts in Philly and snakes up to central. Easy Dem.

District 13 (Tan): Obama 89%

VRA district. 29 W 46 B 19 H

District 14 (Gold): Obama 39%

Huge by Land Area, takes a ton of the conservative areas into one votesink.

District 15 (Orange): Obama 53%

The one I’m perhaps most proud of. Goes from York to Pittsburgh. Takes Altoona, Johnstown, and some of the bigger Pitt suburbs. Blue dog should take this one easily.

District 16 (Slightly darker lime green): Obama 50%

Reading and the other half of Lancaster. True toss-up, very winnable.

District 17 (Navy Blue) Obama 40%

The surprisingly heavily populated York, Adams and Franklin counties in south central pa. Not a shot in hell for us to win it.

District 18 (Bright yellow): Obama 41%

Scraps. Takes parts of a lot of other counties. Easy R win.

District 19 (Pea Green): Obama 40%

A lot of the Southwestern counties. Easy R win.

Pitt close up: http://img.imgcake.com/pittclo…

District 20 (Light Pink): Obama 52%

Parts of Pitt and Washington county and Fayette county. Lean D or Toss-Up

District 21 (Blood Red): Obama 54%

East Pittsburgh, some suburbs and then it just snakes out east. Lean D

District 22 (Poo Brown): Obama 38%

One of the most conservative districts in the country. Easy easy R.

District 23 (Baby Blue): Obama 54%

Erie, Saint Mary’s and a lot of the more liberal areas in the Northwest PA. Lean D

District 24 (Dark Purple): Obama 55%

Lots of pittsburgh and Allegheny county. Likely D

District 25 (Pink-Red Mesh): Obama 49%

What was left. Surprised it was still winnable for us.

Lean Dem or better: 18

Toss-up: 2

Easy R: 5

Thoughts?

Congressional races 2010: PA and RI

Previous diaries

Summary:

 PA has 19 representatives: 10 D, 8 R

 RI has  2 representatives, both D.

Possibly vulnerable:

  PA-06 (R)

  PA-07 (D)

  PA-10 (D)

  PA-16 (R)

Sources:

House vote in 2008 from WaPo

VoteView (ranked from 1 for most liberal to 447 for most conservative; more than 435 because some districts had more than one rep in the 110th congress)

Race Tracker

Obama vote by CD from Swing State

National Atlas for maps

and my previous diaries.

District: PA-01

Location  Philadelphia and suburbs  map

Cook PVI D + 35

Representative Robert Brady (D)

VoteView  83

First elected 1998

2008 margin 91-9 over Mike Muhammad

2006 margin Unopposed

2004 margin 86-13

Obama margin 88-12

Bush margin 2004 15-84

Current opponents None confirmed

Demographics   14th lowest income (median = $28K), 52nd fewest Whites (33%), 27th most Blacks (45%), 9th most Democratic

Assessment Safe

District: PA-02

Location Philadelphia and suburbs map

Cook PVI D + 38

Representative  Chaka Fattah (D)

VoteView 77

First elected 1994

2008 margin 89-11 over Adam Lang

2006 margin 89-9

2004 margin 88-12

Obama margin 90-10

Bush margin 2004 12-87

Current opponents None confirmed

Demographics   Demographics  32nd lowest income (median = $31K), 46th fewest Whites (29.9%), 7th most Blacks (60.7%). 4th most Democratic

Assessment Safe

District: PA-03

Location Northwestern PA, bordering Lake Erie, OH, and NY map

Cook PVI R + 3

Representative Kathy Dahlkemper (D) over incumbent Phil English

VoteView NA

First elected 2008

2008 margin 52-48

2006 margin NA

2004 margin NA

Obama margin 49-49

Bush margin 2004 53-47

Current opponents Elaine Surma, possibly others

Demographics    33rd most Whites (93.7%), 42nd fewest Latinos (1.3%)

Assessment Dahlkemper ousted Phil English, who had been in the House since 1994; she has raised an impressive $521K, and Surma has no website yet and no fundraising numbers. Should be OK, but Dahlkemper is a freshman in a swing district.

District: PA-04

Location   Western PA, bordering OH map

Cook PVI R + 6

Representative  Jason Altmire (D)

VoteView 236

First elected 2006

2008 margin 56-44 over Melissa Hart

2006 margin 52-48

2004 margin NA

Obama margin 44-55

Bush margin 2004 54-45

Current opponents None confirmed

Demographics   21st most White (94.3%), tied for fewest Latinos (0.6%)

Assessment Altmire ousted Hart in 2006, and has now beat her twice

District: PA-05

Location Northern PA, bordering NY map

Cook PVI R + 9

Representative Glenn Thompson (R)

VoteView NA

First elected 2008

2008 margin 57-41 over Mark McCracken

2006 margin NA

2004 margin NA

Obama margin 44-54

Bush margin 2004 61-39

Current opponents None confirmed

Demographics   32nd most rural (54%), 6th lowest income (median = $33K), 6th most Whites (96%), 47th fewest Blacks (1.3%), 11th fewest Latinos (0.8%).  

Assessment

District: PA-06

Location West of Philadelphia map

Cook PVI D + 4

Representative Jim Gerlach (R) Retiring

VoteView NA

First elected NA

2008 margin NA

2006 margin NA

2004 margin NA

Obama margin 58-41

Bush margin 2004 48-51

Current opponents The only confirmed Democrat is Doug Pike, others are considering running. Confirmed Republicans include Curt Schroder and Ryan Costello, with others considering.

Demographics   70th highest income (median = $56K)  

Assessment A prime pickup possibility.  This district is trending Democratic, and the Gerlach won narrowly in every election.

District: PA-07

Location  Southeastern PA, bordering DE, including King of Prussia  map

Cook PVI D + 3

Representative Joe Sestak (D) Running for Senate

VoteView NA

First elected NA

2008 margin NA

2006 margin NA

2004 margin NA

Obama margin 56-43

Bush margin 2004 47-53

Current opponents No confirmed Democrats; those considering running include Bryan Lentz and Greg Vitali

Demographics 67th highest income (median = $56K), 41st fewest Latinos (1.3%)

Assessment This district is fairly Democratic, but by no means a sure thing.  

District: PA-08

Location The southeast corner of PA, bordering NJ  map

Cook PVI D + 2

Representative Patrick Murphy (D)

VoteView 187

First elected 2006

2008 margin 57-42 over Tom Manion

2006 margin 1418 votes out of 250,000

2004 margin NA

Obama margin 54-45

Bush margin 2004 48-51

Current opponents None confirmed

Demographics    44th highest income (median = $59K)

Assessment Looks fairly safe

District: PA-09

Location The central part of southern PA, bordering MD and a little of WV  map

Cook PVI R + 17

Representative Bill Shuster (R)

VoteView 340

First elected 2001

2008 margin 64-36 over Tony Barr

2006 margin 60-40

2004 margin 69-30

Obama margin 45-53

Bush margin 2004 60-40

Current opponents None confirmed

Demographics 19th most rural (59.5%), 3rd most White (96.4%), 60th fewest Blacks (1.6%), 17th fewest Latinos (0.9%), 2nd fewest nonBlack, nonWhite, nonLatino.  

Assessment Long shot

District: PA-10

Location Northeastern PA, bordering NY and NJ map

Cook PVI R + 8

Representative Christopher Carney (D)

VoteView 234

First elected 2006

2008 margin 56-44 over Chris Hackett

2006 margin 53-47

2004 margin NA

Obama margin 45-53

Bush margin 2004 60-40

Current opponents Christopher Bain, possibly other.

Demographics 27th most rural (55.4%), 9th most White (95.5%), 71st least Black (1.9%), 51st least Latinos (1.4%)

Assessment Do you have to be named Christopher to run here? 🙂   This is a fairly vulnerable district, at R +8; Carney has raised $350K.

District: PA-11

Location Eastern PA, including Scranton and Wilkes-Barre  map

Cook PVI D + 4

Representative Paul Kanjorski (D)

VoteView 169.5

First elected 1984

2008 margin 52-48 over Lou Barletta

2006 margin 72-28

2004 margin 94-6 against a minor party

Obama margin 57-42

Bush margin 2004 47-53

Current opponents Possible primary; no confirmed Republican.

Demographics 97th lowest income (median = $35K)  

Assessment What happened between 2004 and 2008? This might be vulnerable.

District: PA-12

Location An odd, thready district in southwest PA map

Cook PVI R + 1

Representative John Murtha (D)

VoteView 169.5

First elected  1974

2008 margin 58-42 over William Russell

2006 margin 61-39

2004 margin unopposed

Obama margin 49-49

Bush margin 2004 51-49

Current opponents Russell is running again, as is Tim Burns.  And Murtha has a primary challenge from Ryan Bucchianeri

Demographics    32nd poorest (median income = $31K), 16th most Whites (95.0%).  3rd fewest Latinos (0.6%)

Assessment The primary looks easy for Murtha, and, although Russell has raised a huge amount of money (over $1 million), he lost to Murtha pretty badly in 2008, and probably will again.

District: PA-13

Location Suburbs and exurbs of Philadelphia  map

Cook PVI D + 7

Representative Allyson Schwartz (D)

VoteView 162

First elected 2004

2008 margin 63-35 over Marina Kats

2006 margin 66-34

2004 margin 56-44

Obama margin 58-41

Bush margin 2004 43-56

Current opponents Damian Dachowski

Demographics   Not unusual on what I track

Assessment Safe

District: PA-14

Location Pittsburgh and suburbs  map

Cook PVI D + 19

Representative Mike Doyle (D)

VoteView 112.5

First elected 1994

2008 margin 91-9 over a Green party candidate

2006 margin 90-10 (against a green)

2004 margin unopposed

Obama margin 70-29

Bush margin 2004 30-69

Current opponents None confirmed

Demographics   26th lowest income (median = $30K), 71st most Blacks (22.5%)

Assessment Safe

District: PA-15

Location Central part of eastern PA, including Allentown and Bethlehem, bordering NJ  map

Cook PVI D + 2

Representative Charles Dent (R)

VoteView 255

First elected 2004

2008 margin 59-41 over Sam Bennett

2006 margin 54-43

2004 margin 59-39

Obama margin 56-43

Bush margin 2004 50-50

Current opponents John Callahan (site under construction) is running and Sam Bennett may run again

Demographics Not unusual on what I track  

Assessment Long shot, but possible.  Still, if a Democrat can’t win here when Obama won by 13 ….; although some have said that Bennett had some local problems.

District: PA-16

Location Southeastern PA, centering on Lancaster  map

Cook PVI R + 8

Representative Joe Pitts (R)

VoteView 405

First elected 1996

2008 margin 56-39 over Bruce Slater

2006 margin 57-40

2004 margin 64-34

Obama margin 48-51

Bush margin 2004 62-38

Current opponents Lois Herr (this website needs some more info)

Demographics Not unusual on what I track

Assessment Pitts has not raised much for an incumbent with a challenger (only about $100K).  Lois Herr called me up as a potential donor, and she sounds good.  Might be vulnerable.

District: PA-17

Location South and east of central PA, including Harrisburg  map

Cook PVI R + 6

Representative Tim Holden (D)

VoteView 192.5

First elected 1992

2008 margin 64-36 over Toni Gillhooley

2006 margin 65-35

2004 margin 59-39

Obama margin 48-51

Bush margin 2004 58-42

Current opponents Frank Ryan

Demographics Not unusual on what I track  

Assessment Holden has won easily, even in this Republican district.  Should be safe.

District: PA-18

Location Suburbs of Pittsburgh  map

Cook PVI R + 6

Representative Tim Murphy (R)

VoteView 259

First elected 2002

2008 margin 64-36 over Steve O’Donnell

2006 margin 58-42

2004 margin 63-37

Obama margin 44-55

Bush margin 2004 54-46

Current opponents None confirmed

Demographics  10th most Whites (95.4%), 77th fewest Blacks (2.0%), tied for fewest Latinos (0.6%)  

Assessment Long shot

District: PA-19

Location Southern PA including Gettysburg  map

Cook PVI R + 12

Representative Todd Platts (R)

VoteView 254

First elected 2000

2008 margin 67-33 over Phillip Avilo

2006 margin 91-4 against a Green

2004 margin 64-36

Obama margin 43-56

Bush margin 2004 64-36

Current opponents None confirmed

Demographics   68th most Whites (92.2%)

Assessment Long shot

District: RI-01

Location Northern and eastern RI, bordering MA and CT  map

Cook PVI D + 13

Representative Patrick Kennedy (D)

VoteView 89

First elected 1994

2008 margin 69-24 over Jon Scott

2006 margin 62-36

2004 margin 64-36

Obama margin 65-33

Bush margin 2004 36-62

Current opponents John Loughlin

Demographics   Not unusual on what I track

Assessment Safe

District: RI-02

Location Most of the state map

Cook PVI D + 9

Representative Jim Langevin (D)

VoteView 146

First elected 2000

2008 margin 70-30 over Mark Zaccaria

2006 margin 73-27 against an independent

2004 margin 75-21

Obama margin 61-37

Bush margin 2004 41-57

Current opponents A primary challenge, and then Zaccaria again.

Demographics   Not unusual on what I track

Assessment Safe

Several new Rasmussen Pres. swing state polls

FL-Pres

McCain (R) 47%

Obama (D) 47%


http://www.rasmussenreports.co…

OH-Pres

McCain (R) 48%

Obama (D) 47%


http://www.rasmussenreports.co…

PA-Pres

Obama (D) 50%

McCain (R) 42%


http://www.rasmussenreports.co…

CO-Pres

Obama (D) 49%

McCain (R) 48%


http://www.rasmussenreports.co…

VA-Pres

Obama (D) 50%

McCain (R) 47%

http://www.rasmussenreports.co…

Solid numbers for Obama in all five states.

The importance of a ground game – down-ballot drop off

21st Century Democrats is excited about the extraordinary amount of enthusiasm Barack Obama’s nomination has generated. The Pew Research Center is suggesting increased voter turnout in the general election bodes well for Democrats. However, some stats from the primary season show that increased turnout for the presidential election doesn’t always help down-ballot races.

In fact, assuming a strong Presidential ticket will pull Democratic candidates in the House, the Senate, and local offices to victory is dangerous. This assumption is not in line with electoral empirics or America’s personality. Splitting tickets will always occur in our nation which prides itself on having a “maverick spirit” and values competence over loyalty. More importantly, many Americans will rightfully not vote for candidates they are unfamiliar with. Why would anyone put someone they know nothing about in a tremendous position of power? In the midst of all the excitement generated by the Obama campaign, we cannot forget that voters need to have face to face contact with canvassers for all our candidates, not just our candidate for President.

Looking at this year’s primaries, there is a substantial discrepancy between the number of people who voted for Democratic Presidential Candidates and the number of people who voted for other Democrats. Across the board, significantly less people voted for other Democratic candidates than voted for Democratic Presidential Candidates.

In Pennsylvania there was a stark disparity between votes accumulated by Democratic Presidential Candidates and Democrats running for other state-wide offices. There were only two contested statewide primaries in Pennsylvania this cycle. Below are two charts comparing the number of votes for Democratic Presidential candidates in April’s Primary with votes for Democrats running for State Treasurer in PA.

Candidate Votes Percent
CLINTON, HILLARY 1,275,039 54.6%
OBAMA, BARACK 1,061,441 45.4%

Total votes for Obama and Clinton in Pennsylvania = 2,336,480

*Obama and Clinton were the only Democrats on the ballot in PA

Candidate Votes Percent
MCCORD, ROBERT 783,675 43.2%
CORDISCO, JOHN F. 472,027 26.0%
MANN, JENNIFER L. 441,745 24.3%
MORRISON-WESLEY, DENNIS 118,696 6.5%

Total Votes for Democrats running for PA State Treasurer 1,661,549

There was a 674,931 vote or 29% disparity between Democrats who voted for our party’s candidates for State Treasurer and our parties candidates for President in Pennsylvania. That means nearly 3 out of every 10 people who voted in the presidential primary, gave the State Treasurer a pass.

In Ohio, two 21st Century Democrats’ endorsed candidates also were victims of down-ballot drop off. In the 1st Congressional District, there were a total of  115, 387 votes for Obama , Edwards and Clinton. Steve Dreihaus ran an uncontested and only got 60,454 votes, a 57,840 vote difference.  Nearly 1 out of every two voters who cast a vote for the Democratic nominee decided to not cast a vote for their Congressman.

In the 15th CD, Mary Jo Kilroy was also uncontested and received 85,840 votes. All the Presidential Candidates received 91,233 votes in total. That’s a 5, 393 vote drop off. Given Mary Jo’s 2006 election results, she can’t afford to have that sort of drop off.

Out in Oregon,  remember those Obama crowds? All that excitement generated 641, 499 total votes in the Democratic Presidential Primary. One would think that the heated primary for the Democratic Senatorial nominee would have little drop off. In spite of intense competition between two well funded campaigns less people voted for our Senatorial candidates than voted for our Presidential Candidates. In fact there was an almost 14% or 91,523 vote difference between total votes for Democratic Presidential Nominees and total votes for Democratic Senatorial Candidates in Oregon. How will Merkley beat Smith if he has to get 115% of Obama’s take in Oregon?

Why am I telling you this? Because at 21st Century Democrats, we believe that in order to have a true progressive revolution in America we’ll need a bottom up, not a top down, approach to elections and campaigns. We have been training and placing field organizers for two decades now. We know that many down-ballot races cannot depend on Obama’s team. They have a big enough task ahead.

21st Century Democrats is endorsing over fifty down-ballot candidates all over the country. For example Jim Roth is running for Corporate Commissioner in Oklahoma, and Andy Meisner is running for Oakland County Treasurer in Michigan. These candidates need resources to get field organizers hitting the doors, and cannot rely on Barack Obama’s field team to do it for them. The nation will not be changed without your help. We already have organizers in critical races across the country, but we need you to partner with us to get down-ballot candidates like Darcy Burner (WA-08), Dan Maffei (NY-25), Jim Himes (CT-4), Judy Baker (MO -9) and other progressives near you elected.

——-

Big thanks to Corey Goldiner, 21st Century Fellow, for doing most of the legwork and tracking down all these statistics.

Congressional races round 2: Oregon, Pennsylvania, Rhode Island

Continuing through the alphabet.

Oregon has 5 representatives: 4 Democrats and 1 Republican

Filing deadline was March 11, primary is May 20

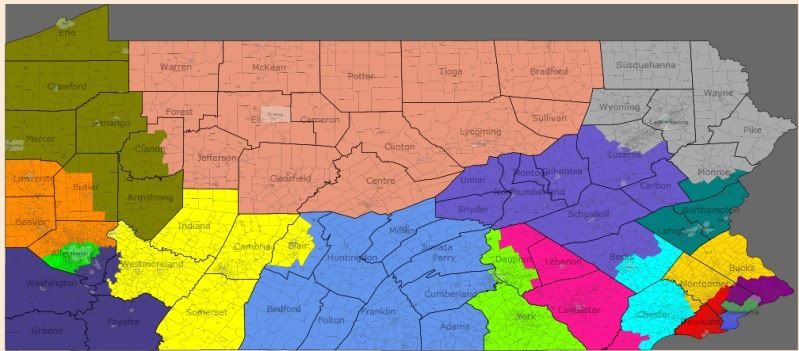
Pennsylvania has 19 representatives: 11 Democrats and 8 Republicans

Filing deadline was Feb 12, primary is April 22

Rhode Island has 2 districts, both Democrats

Filing deadline is June 25, primary Sept 9

District: OR-01

Location Northwestern OR, bordering WA and the Pacific, including parts of Portland and its suburbs

Representative David Wu (D)

First elected  1998

2006 margin 63-34

2004 margin 58-38

Bush margin 2004 44-55

Notes on opponents In 2004, Goli Ameri raised $2.3 million to Wu’s $2.7 million.  In 2006, Derrick Kitts raised about $140K to Wu’s $1.1 million

Current opponents Wu is facing a primary, and then either Stephen Brodhead, CW Chappell or Joel Haugan. No fundraising reports from anyone but Wu, who has $600K COH

Demographics 36th fewest Blacks (1.1%)

Assessment  Safe

District: OR-02

Location The eastern 2/3rds of OR, bordering WA, ID, NV, and CA

Representative Greg Walden (R)

First elected  1998

2006 margin 67-30

2004 margin 72-26

Bush margin 2004 61-38

Notes on opponents Neither raised much

Current opponents Noah Lemas (no website, no fundraising report)

Demographics 15th most veterans (17.3%), 6th fewest Blacks (0.4%)

Assessment Long shot

District: OR-03

Location Northern OR, bordering WA, includes Portland and suburbs, and Mt Hood.

Representative Earl Blumenauer (D)

First elected  1996

2006 margin 73-23

2004 margin 71-24

Bush margin 2004 33-67

Notes on opponents Neither raised much

Current opponents A primary and then Delia Lopez. No fundraising reports from anyone but Blumenauer, who has $465 COH

Demographics 60th most Democratic

Assessment safe

District: OR-04

Location Southwestern OR, bordering CA and the Pacific, including Eugene

Representative Peter DeFazio (D)

First elected  1986

2006 margin 62-38

2004 margin 61-38

Bush margin 2004 49-49

Notes on opponents In 2004, Jim Feldekamp raised $600 K to DeFazio’s $900K; he ran again in 2006, raising $500K to DeFazio’s $750K

Current opponents  None. DeFazio has $360K COH….he should share

Demographics 11th fewest Blacks (0.5%), 24th most veterans (16.9%)

Assessment  Free ride.

District: OR-05

Location A T-shaped district in northwestern OR.

Representative Darlene Hooley (D) retiring

First elected  1996

2006 margin 54-43

2004 margin 53-44

Bush margin 2004 50-49

Notes on opponents In 2004, Jim Zupancic raised $1.3 million to Hooley’s $2 million; in 2006, Mike Erickson raised $1.8 million to Hooley’s $2 million

Current opponents Democrats:

Kurt Schrader

Andrew Foster (no web site), Nancy Moran (no web site),

Steve Marks

Richard Nathe (no website) and a bunch of Republicans.   No fundraising reports from the Dems

Demographics 18th fewest Blacks (0.6%)

Assessment Seems vulnerable, but I don’t know

District: PA-01

Location Some of Philadelphia and some suburbs

Representative Robert Brady (D)

First elected  1998

2006 margin unopposed

2004 margin 86-13

Bush margin 2004  15-84

Notes on opponents No money

Current opponents Mike Muhammad. No fundraising report.  Brady has $678,000 COH, he should share

Demographics 14th lowest income (median = $28K), 52nd fewest Whites (33%), 27th most Blacks (45%), 8th most Democratic

Assessment Safe

District: PA-02

Location Philadelphia and suburbs

Representative Chaka Fattah

First elected  1994

2006 margin 89-9

2004 margin 88-12

Bush margin 2004 12-87

Notes on opponents Neither raised much

Current opponents Mike Livingston, no fundraising report.  Fattah has $183 COH.

Demographics 32nd lowest income (median = $31K), 46th fewest Whites (29.9%), 7th most Blacks (60.7%), 4th most Democratic

Assessment Safe

District: PA-03

Location Northwestern PA, bordering Lake Erie, OH, and NY

Representative Phil English (R)

First elected  1994

2006 margin 54-42

2004 margin 60-40

Bush margin 2004 53-47

Notes on opponents Steven Porter ran in 2004 and 2006, raising about $200K each time, English had about $1.5 million each time

Current opponents Kyle Foust $55K raised, $25K COH

Mike Waltner $100K raised, $65K COH

Tom Myers $140K raised, $75K COH

Kathy Dahlkemper $154K raised, $117K COH;

Demographics 33rd most Whites (93.7%), 42nd fewest Latinos (1.3%)

Assessment Superribbie ranks it as the 50th most vulnerable Republican seat.  On the DCCC list .  The fact that all those Democrats are running is a sign that English is vulnerable.

District: PA-04

Location Western PA, bordering OH

Representative Jason Altmire (D)

First elected  2006

2006 margin 52-48

2004 margin NA

Bush margin 2004 54-45

Notes on opponents In 2006, Altmire ousted Melissa Hart, raising $1.1 million, about half what she raised

Current opponents Hart is back for a rematch, but she has a primary challenger (Ron Francis).  Francis has raised $160K, $113 COH; Hart has raised $385K, $332K COH.

Altmire has raised $1.1 million, $911K COH

Demographics 21st most White (94.3%), tied for fewest Latinos (0.6%)

Assessment Superribbie ranks it as the ninth most vulnerable Democratic seat, and it’s on the DCCC list .  While not safe, Altmire beat Hart, with less money than her, when she was an incumbent.  Now he’s got more money, and he’s the incumbent.  I don’t think it’s quite as vulnerable as Superribbie.

District: PA-05

Location Northern PA, bordering NY.

Representative John Peterson (R) retiring

First elected  1996

2006 margin 60-40

2004 margin 88-12 against a Libertarian

Bush margin 2004 61-39

Notes on opponents In 2006, Don Hilliard raised no money and still got 40%

Current opponents Democrats:

Mark McCracken

Bill Cahir

Rick Vilello

Lots of Republicans. No fundraising numbers from anyone

Demographics 32nd most rural (54%), 6th lowest income (median = $33K), 6th most Whites (96%), 47th fewest Blacks (1.3%), 11th fewest Latinos (0.8%), 99th most Republican

Assessment Somewhat vulnerable. Superribbie ranks it as the 58th most vulnerable Republican seat. The fact that we are competitive here, in a naturally Republican seat, is a really good sign

District: PA-06

Location West of Philadelphia

Representative Jim Gerlach (R)

First elected  2002

2006 margin 51-49

2004 margin 51-49

Bush margin 2004 48-51

Notes on opponents Lois Murphy ran in 2004 and 2006, in 2004, she raised $1.9 million to Gerlach’s $2.2 million; in 2006, she raised $4 million to his $3.5 million

Current opponents Bob Roggio no funding info.  Gerlach has $500K COH

Demographics 70th highest income (median = $56K)

Assessment Somewhat vulnerable,   Superribbie ranks it as the 22nd most vulnerable Republican seat.  On the DCCC list .  Not sure why Roggio has no FEC numbers

District: PA-07

Location Southeastern PA, bordering DE, including King of Prussia

Representative Joe Sestak (D)

First elected  2006

2006 margin 56-44

2004 margin NA

Bush margin 2004 47-53

Notes on opponents In 2006, Sestak ousted Curt Weldon; each raised about $3 million

Current opponents Curt Weldon has $90K COH (but, per comments, appears to not be in it), Craig Williams, no info.  Sestak has $1.7 million COH

Demographics 67th highest income (median = $56K), 41st fewest Latinos (1.3%)

Assessment Superribbie ranks it as the 36th most vulnerable Democratic seat; Sestak’s formidable fundraising advantage makes it a little less vulnerable, I  think

District: PA-08

Location The southeast corner of PA, bordering NJ

Representative Patrick Murphy (D)

First elected 2006

2006 margin 1418 votes out of 250,000

2004 margin NA

Bush margin 2004 48-51

Notes on opponents In 2006, Murphy ousted Mike Fitzpatrick; Murphy raised $2.4 million to Fitzpatrick’s $3.2

Current opponents Thomas Manion (no funding info); Murphy has $1.2 million COH

Demographics 44th highest income (median = $59K),

Assessment   Superribbie ranks it as the 22nd most vulnerable Democratic seat. On the DCCC list .  Another potentially close race, where we appear to have a huge lead in fundraising

District: PA-09

Location The central part of southern PA, bordering MD and a little of WV

Representative Bill Shuster (R)

First elected 2001  

2006 margin 60-40

2004 margin 69-30

Bush margin 2004 67-33

Notes on opponents Neither raised much

Current opponents Tony Barr who got 40% with almost no money in 2006, is running again. No funding info on Barr, but Shuster has only $188K COH, not much for an incumbent at this stage

Demographics 19th most rural (59.5%), 3rd most White (96.4%), 60th fewest Blacks (1.6%), 17th fewest Latinos (0.9%), 2nd fewest nonBlack, nonWhite, nonLatino, 42nd most Republican

Assessment  Long shot

District: PA-10

Location Northeastern PA, bordering NY and NJ

Representative Christopher  Carney (D)

First elected  2006

2006 margin 53-47

2004 margin NA

Bush margin 2004 60-40

Notes on opponents In 2006, Carney ousted Don Sherwood, spending $1.5 million to Sherwood’s $3 million

Current opponents  Dan Meuser has raised the most of several Republicans: He has $398 COH; Chris Hackett has $386K; others much less.  Carney has $766K.  

Demographics 27th most rural (55.4%), 9th most White (95.5%), 71st least Black (1.9%), 51st least Latinos (1.4%)

Assessment Very vulnerable Superribbie ranks it as the 5th most vulnerable Democratic seat. On the DCCC list .

District: PA-11

Location Eastern PA, including Scranton and Wilkes-Barre

Representative Paul Kanjorski (D)

First elected  1984

2006 margin 72-28

2004 margin 94-6 against a minor party

Bush margin 2004 47-53

Notes on opponents No money

Current opponents  Lou Barletta has $851 COH and $300K in debt (hmmmm….). Kanjorski has $1.5 million.  He should share

Demographics 97th lowest income (median = $35K)

Assessment  Safe

District: PA-12

Location An odd, thready district in southwest PA

Representative John Murtha (D)

First elected  1974

2006 margin 61-39

2004 margin unopposed

Bush margin 2004 49-51

Notes on opponents In 2006, Diana Irey raised $850K to Murtha’s $3.2 million.

Current opponents William Russell has $25K COH, Murtha has $529K

Demographics 32nd poorest (median income = $31K), 16th most Whites (95.0%).  3rd fewest Latinos (0.6%)

Assessment Safe

District: PA-13

Location Suburbs and exurbs of Philadelphia

Representative Allyson Schwartz (D)

First elected  2004

2006 margin 66-34

2004 margin 56-44

Bush margin 2004 43-56

Notes on opponents In 2004, this seat was open and Schwartz beat Melissa Brown, raising $4.5 million to Brown’s $1.9 million. In 2006, Raj Bhakta raised $400K to Schwartz’ $2.2 million

Current opponents Marina Kats has no fundraising report.  Schwartz has $1.6 million COH, she should share

Demographics Not unusual on what I track

Assessment Safe

District: PA-14

Location Pittsburgh and suburbs

Representative Mike Doyle (D)

First elected  1994

2006 margin 90-10 (against a Green)

2004 margin unopposed

Bush margin 2004 30-69

Notes on opponents NA

Current opponents No Republican; Doyle has $400K COH

Demographics 26th lowest income (median = $30K), 71st most Blacks (22.5%), 41st most Democratic

Assessment  Free ride

District: PA-15

Location Central part of eastern NJ, including Allentown and Bethlehem, bordering NJ

Representative Charlie Dent (R)

First elected  2004

2006 margin 54-43

2004 margin 59-39

Bush margin 2004 Kerry won by 786 votes out of 300,000

Notes on opponents In 2004, this was an open seat, and Dent beat Joe Driscoll, each spending about $2 million.  In 2006, Charles Dertinger raised little

Current opponents Sam Bennett has raised $194K and has $94K COH; Dent has over $500K COH.  Bennett is one of my favorite candidates.

Demographics Not unusual on what I track

Assessment  Vulnerable. Superribbie ranks it as the 32nd most vulnerable Republican seat.

District: PA-16

Location Southeastern PA, centering on Lancaster

Representative Joe Pitts (R)

First elected  1996

2006 margin 57-40

2004 margin 64-34

Bush margin 2004 61-38

Notes on opponents Lois Herr ran both times, raising about $80K the first time and $300K in 2006; Pitts raised just under $500K the first time and just over that in 2006

Current opponents Bruce Slater has just $7K COH, to Pitts’ $175K

Demographics 86th most Republican

Assessment Long shot

District: PA-17

Location South and east of central PA, including Harrisburg

Representative Tim Holden (D)

First elected 1992

2006 margin 65-35

2004 margin 59-39

Bush margin 2004 58-42

Notes on opponents In 2004, Scott Paterno raised $1 million to Holden’s $1.6 million.  The 2006 opponent raised little

Current opponents Toni Gilhooley has $31K COH to Holden’s $780K

Demographics Not unusual on what I track

Assessment Safe

District: PA-18

Location Suburbs of Pittsburgh

Representative Tim Murphy (R)

First elected 2002

2006 margin 58-42

2004 margin 63-37

Bush margin 2004 54-46

Notes on opponents Each raised about $100K, Murphy raised over $1 million each time

Current opponents Beth Hafer $106K raised, $42K COH

Brien Wall $35K raised, $16K COH

Steve O’Donnell $260K raised, $203K COH

Daniel Wholey $56K raised, $45K COH

Demographics 10th most Whites (95.4%), 77th fewest Blacks (2.0%), tied for fewest Latinos (0.6%)

Assessment Vulnerable. Superribbie ranks it as the 60th most vulnerable Republican seat.  On the DCCC list

District: PA-19

Location Southern PA including Gettysburg

Representative Todd Platts (R)

First elected  2000

2006 margin 64-33

2004 margin 91-4 against a Green

Bush margin 2004 64-36

Notes on opponents Phillip Avilo raised $175K against Platts’ $375K

Current opponents Phil Avilo , no fundraising info

Demographics 68th most Whites (92.2%)

Assessment Long shot

District: RI-01

Location Northern and eastern RI, bordering MA and CT

Representative Patrick Kennedy (D)

First elected  1994

2006 margin 62-36

2004 margin 64-36

Bush margin 2004 36-62

Notes on opponents In 2004, David Rogers and Kennedy each raised about $2 million.  In 2006, his opponent raised little

Current opponents None; Kennedy has $700K COH, he should share

Demographics Not unusual on what I track

Assessment safe

District: RI-02

Location Most of the state

Representative Jim Langevin (D)

First elected  2000

2006 margin 73-27 against an Independent

2004 margin 75-21

Bush margin 2004 41-57

Notes on opponents  No money for Republicans

Current opponents None

Demographics Not unusual on what I track

Assessment Safe

GOP Incumbents in Northeast: Less cash than last cycle

The 2006 midterm elections took a big bite out of Northeast Republicans.  They went from contributing 35 seats to the majority party to providing just 24 seats to the minority.  Many survived by the skin of their teeth and others were not targeted in districts with a Democratic lean or a small Republican lean.  So how have the suruvivors fared?  I have compared the most recent fund raising report with the year end totals from 2005 (the same spot in the 2006 cycle).  Both a dummary report and a more detailed explaination follow.

The 24 Republicans as a group have 22.6% less cash on hand than 2 years ago ($12,702,583 vs. $16,403,287).  The average GOP member from this group has a balance of $529,274 compared to $683,470 two years ago.  Four members from this group have announced their retirement.  Two of those four have a slightly higher balance but two have much lower balances.  In addition, Tom Reynolds had a balance of $2.3 million as head of the NRCC;  he’s at $862 K now.  Still, the numbers are lower, even after adjustments.

Individual results follow below the fold:

CT  Chris Shays, CT 4

Shays is the only one of 3 CT Republicans to survive the last election.  In fact, the moderate congressman from the NYC suburbs is the last Republican House member from New England.  Shays has run a bunch of expensive and exhausting but ultimately successful re-electioin campaigns.  This time around, he’s facing Jim Himes and his fund raising is lagging.  At $797,413, Shays is down $95,000 from two years ago.  Of course, Joe Lieberman will not be campaigning for him either.

NY  Peter King, NY-3

Last cycle, Democrats hoped to entice a name opponent to take on King but failed.  Dave Mejias still managed to take a big bite out of King’s sizeable stash of cash.  Two years ago, King was a committee chairman and a “millionaire” (cash on hand of $1,058,043).  Now the chair is gone and cash is down more than 40% to $604,240.  Peter King is considerably weakened.

NY  Vito Fossella, NY-13

Fossella has come back from the dead, raising $304,000 to bring his cash up from $50,000 to $250,000 in the last quarter of 2007.  That said, Fossella is greatly weaker than two years ago.  Then, he had $572,952; now it’s $250,501.  A good candidate can take him out.  A medium candidate might but would probably drain him to the breaking point.  

NY  John McHugh,  NY-23

McHugh has been rumored to be a possible retiree.  Maybe one reason is his fund raising.  The veteran incumbent has uist $203,402 a drop of nearly 50% from two years ago.  Hmm.

NY  James Walsh,  NY-25

Walsh had a very tight battle against Dan Maffei in 2006 and this looked like a re-match.  Except that Walsh decided to retire.  Walsh had managed to keep pace with last cycle ($511,611 to $508,704 in 2005).  Maffei will have a huge edge over any fill-in.

NY  Tom Reynolds, NY-26

Reynolds was head of the NRCC last cycle and actually did a good job in a thankless assignment.  Compare his results to Liddy Dole (dollars, won-lost).  Reynolds managed to save more seats than were lost. Dole lost everything but Kentucky and had to get massive help from the RNC.  Still, Reynolds was raising national bucks two years ago and is not, now.  That means that Jon Powers may have a good shot in what was a 52-48 district last cycle.  $862,809 vs. $2,351,883 in 2006.

NY  Randy Kuhl, NY-29

Kuhl is a two termer who is struggling in a decent district for NYS Republicans.  It shows in the fund-raising.  Kuhl has $326,513 vs. $389,128 in 2005.  Shot gun Randy is vulnerable to Eric Massa.  Rumor had Randy expecting to lose his last general election.  Maybe this is the time.

NJ  Frank LoBiondo,  NJ-2

The district leans Democratic but LoBiondo had the support of local labor unions against a weak local Democrat.  That may not be the case as Jeff Van Drew, a “hot” state senator, is considering a run.  Lo Biondo has a nice stash ($1,391,321) but less than two years ago ($1,628,568).  It’s doable.  Too bad he wasn’t drained a bit more.

NJ  Jim Saxton,  NJ-3

Saxton is also running in a tough district.  Only he decided to hang it up.  Saxton’s treasure chest of $1,079,955 will (at best for the GOP) be spread out a bit.  That’s down from a hefty $1,434,892 but Jim was still a million dollar man.  Looking very good here as the Democrats have their preferred candidate.

NJ  Chris Smith,  NJ-4

Smith is up but still vulnerable.  He’s got a tough district and just $401,066 in the bank.  And yes, last quarter he was fund raising.  Smith was at just $225,195 last cycle.

NJ  Scott Garrett,  NJ-5

Garrett was first elected with 61% theen fell to 58% and 55% last cycle. He is way out of touch with his moderate district and would fit in with the deep south.  Any other Republican would breeze here.  Garrett?  Maybe not.  So, he has $352,001 this cycle vs. $291,452.  Last time around, reluctance to fund a challenger who had a primary badly hurt Paul Aronsohn who had to overcome Camille Abate.  This time around blind rabbi Ben Shulman also is hamstrung by the presence of Abate.  These “rules” are keeping the winger Garrett alive.  A little flexibility, guys?  (or drop out Camille).

NJ  Rodney Frelinghuysen,  NJ-11

Frelinghuysen’s family held a NJ House seat in the 1700s.  And the 1800s.  And the 1900s,  And the 2000s.  Still, in a district that mainly covers Morris County, Rodney has less cash to play with.  $551,141 vs. $751,195.  Rodney has tended to spread excess cash in $2,000 donations to candidates around the country.  This gives him far less clout than by using the NRCC but Rodney does it.  Maybe he’ll have less to spend this time.  Maybe Tom Wyka will gain a few points in a very slowly blue-ing district (i live there and it’s a long climb).

PA  Phil English,  PA-3

English represents northwest PA.  It is a district where Bush got 54% and English got 53% in 2006 against a lackluster opponent.  English has significantly bolstered his cash this time around as he tries to hold on against the tide.  He’s got $537,340 vs. $323,253 in 2005.  English is a massive guy and rumors do swirl of personal scandal. So this one is not perfectly safe.

PA  John Peterson, PA-5

Peterson is not a massive fundraiser.  He’s retired leaving a modest $117,457 in the kitty.

That’s slightly more than the 2005 sum of $114,865.

PA  Jim Gerlach,  PA-6

Gerlach is off two tight races but seems to be running out of gas.  Or cash.  Without a marquis opponent, he’s got just $500,238 vs. $1,074,827.  Are his days in the House numbered?

PA  Bill Shuster,  PA-9

Shuster is referred to as Bud Lite, because he is the son (and legacy) of ex-Congressman Bud Shuster.  The cash is low ($188,177)but more than last cycle ($138,699).  Time to give the pipsqueak a run?  (one of the great political nicknames was given to Thomas P. O’Neil III, Tip’s son: “tipsqueak”, he aged into the nose, too).

PA  Charles Dent,  PA-15

Dent nearly ran unopposed but a candidate who needed a write-in to make the ballot gave him a hard time in a Democratic lean district.  He’s certainly expecting a harder time this time around but is in the same cash situation.  COH is $535,091 vs. $542,891.  Is this the year the Lehigh Valley goes back blue (it was during the Clinton years).?

PA  Joe Potts,  PA-16

Potts has a decent stash in a friendly district but it is still down from two years ago.  It’s $175,897 vs. $283,335.  Is Joe starting to wind it down?  

PA  Tim Murphy,  PA-18

Murphy has the most cash of any Pennsylvania Republican in the House.  That’s actually a scary thing as it indicates that people like English, Gerlach, and Dent are in trouble.  For stat hounds, Murphy’s balance of $663,484 is down from the $685,083 of two years ago.  Bad news for Gerlach who was way ahead in this race two years ago.

PA  Todd Platts,  PA-19

Platts is the limbo incumbent.  How low can you go?  In Todd’s case it is an anemic $59,032, the lowest figure for any Republican incumbent in the region.  Todd has just $132,025 two years ago so this is nothing new.  he makes lists but so far no waves.

MD   Wayne Gilchrest,  MD-1

The moderate Gilchrest is anti-war and that’s enough to stir up a primary challenge.  It also got Wayne to fund raise a bit in a normally safe district ($424,364 vs. $214,862).  The money is going to the primary where a winger is given a real chance of knocking off the veteran congressman.

MD  Roscoe Bartlett,  MD-6

Bartlett is old (82 I think, and he looks it) and many thought he was headed for retirement.  Not so, as he filed for re-election.  That may come soon, though.  Bartlett has just $276,985 this time, down from $346,618.  It is a safe Republican district.

DE  Mike Castle,  DE At Large

Mike has been rumored for retirement and he’s been rumored as running for the Senate if Joe Biden retires.  The fund raising does not argue retirement.  Mike has the biggest cash on hand balance of any Republican House member in the Northeast and he’s growing it.  It was $1,212,788 and is now $1,527,167.  This is the most Democratic district in the nation represented by a Republican but in the clubby atmosphere of Delaware it “seems” safe.  Oddly, Joe Biden’s son, Beau, would seem like the most likely candidate to unseat the aging and sickly Castle.  Hint, hint.