CO-Sen, CO-Gov: Bennet Retains Small Edge, Republicans Locked in Tossups

Public Policy Polling (8/7-8, likely voters, 5/14-16 in parens):

Michael Bennet (D-inc): 49 (46)

Andrew Romanoff (D): 43 (31)

Undecided: 9 (23)

(MoE: ±4.6%)

Andrew Romanoff has clearly made some pretty big strides in recent weeks, snaring a big chunk of undecideds and turning this sleepy race into a potential nail-biter tomorrow night. Still, unlike SurveyUSA, which released a poll last week showing Romanoff with a slim lead over Bennet, PPP’s tricorder is detecting a Bennet win to be the likeliest outcome. If that’s true, I wonder if that recent NY Times piece on Bennet’s exotic financial deal-making that backfired while he was the Superintendent of the Denver Board of Education may have come out a little too late for Romanoff to make enough hay out of it. But, maybe robocalls from Bubba will help change a few minds.

Meanwhile, over in GOPville…

Jane Norton (R): 45 (31)

Ken Buck (R): 43 (26)

Undecided: 12 (29)

(MoE: ±3.5%)

Scott McInnis (R): 41

Dan Maes (R): 40

Undecided: 19

(MoE: ±3.5%)

PPP also offers slightly different takes than SUSA on the GOP Senate and Gube primaries, showing bare leads for Norton and McInnis where SUSA found Buck and Maes leading the pack last week.

One has to wonder if McInnis would really stick with this thing if he won the primary (his favorability numbers are in the net negatives among Republicans, so the dude is clearly screwed), or if he would step aside and let someone like former state Sen. Josh Penry or Jane Norton (assuming she loses the Senate primary) take his spot on the ballot instead, a deal that ColoradoPols is picking up plenty of chatter about on their enemy radio surveillance channels. And even then, you’ve gotta wonder if Tom Tancredo would stick out his third-party bid or allow one of Penry or Norton (or whomever) a fighting chance in the general election.

Legacy of ’94, Part 3: Lost for other office

This is part 3 of my diaries exploring what is the legacy of the Republican class of 1994.  

Matt Salmon, Phoenix Suburbs.  Matt Salmon’s margin is nearly exactly the same as Ann Kirkpatrick two years ago in a district that is numbered the same but looks very different.  He won by 17 points in an open seat after Sam Coppersmith tried to defeat Jon Kyl in an open Senate election.  (much like IN this year, an open seat seat meant a loss in the Senate seat and a competitive House race, although I don’t know if there would have been one anyways, as Coppersmith pulled a Perriello in winning a total upset in 1992 over an incumbent.  Salmon served six (h/t: jwaalk) years in Congress before running against Janet Napolitano for Governor of Arizona in 2002, losing by a razor-thin margin.  He is now president of the Electronic Cigarette Association (bet you didn’t know that.)

Dave McIntosh, NE. Indiana.  When incumbent Philip Sharp retired after ten terms in Congress in a Republican district, McIntosh won by nine points in the open seat race (a surprisingly small margin, in my opinion).  He served three terms before running for Gov. of Indiana and losing to incumbent Frank O’Bannon by a wide margin.  

Greg Ganske, Des Moines.  Greg Ganske shocked the political world by defeating 18-term incumbent Neal Smith.  He won by nearly seven points in the Republican wave, campaigning in a 1958 DeSoto car (shades of Scott Brown) since Smith had won his first election that year.  He was also a plastic surgeon.  He remained a sane/somewhat moderate Republican throughout his four terms in Congress before challenging Tom Harkin in 2002, something  reserved for sacrificial lambs nowadays, (see Reed, Christopher).  He lost by ten points.  Today, he’s a plastic surgeon again.  

Todd Tiahrt, Wichita.  Tiahrt just lost his Senate primary last week, his social conservative cause dying along with it (although I can’t say I’m unhappy with his loss.)  He defeated 9-term incumbent Dan Glickman in the election, winning by six points.  Glickman then became Secretary of Agriculture, so it didn’t turn out too bad for him.  

Jon Christensen, Omaha.  And another Plains state freshman from that year who tried for higher office.  Christensen defeated 3-term incumbent Peter Hoagland in the election by one point.  Four years later, Christensen ran in a contested primary for Nebraska Governor, losing to Mike Johanns (a la Pete Hoekstra, Zach Wamp, Gresham Barrett).  He is currently married to a former Miss America.  He’s still 47, I’m not sure why he couldn’t run for something again at some point (Governor to replace Heineman?)

Steve Largent, Tulsa.  NFL Hall of Famer Largent ran for Jim Inhofe’s open House seat and won convincingly.  In 2002, he decided it was time for a promotion and ran for Governor, losing to Brad Henry by less than one percent.  He may be one of the greatest receivers of all time, but he couldn’t win an election in a GOP year in a red state, so I guess he didn’t do too well.  He was one of the most conservative House members.  He’s currently CEO of a wireless nonprofit.

Zach Wamp, Chattanooga.  Speaking of Wamp, here he is.  He also lost a gubernatorial primary this week while trying to be as conservative as possible.  He wants to secede, if I remember correctly.  10-term incumbent Marilyn Lloyd’s retirement in this even then reddish seat led to a victory for Wamp. However, the conservative, although pro-choice, Lloyd endorsed Wamp over the Democrat Randy Button, who lost by six points.

Van Hilleary, Rural Tennessee.  Hilleary ran for Governor the last time there was an open gubernatorial seat in Tennessee: 2002.  Before that, he took the open seat that Jim Cooper vacated to run for Senate, a campaign he was thoroughly demolished in.  Hilleary cruised in the open seat that is very similar to Lincoln Davis’s today.  He lost to Democrat Phil Bredesen in the gubornatorial election, however.  He’s now a consultant living in Washington, DC, which means he can’t challenge Lincoln Davis (which is good).  He did come in third in the 2006 Senate primary, losing to Bob Corker.  

Ed Bryant, W. Tennessee.  Ed Bryant replaced governor-elect Don Sundquist on the ballot in the 7th district.  He won in a Safe GOP district, at least in that year, although he was so conservative that he helped organize Pat Robertson’s presidential bid.  He ran for Fred Thompson’s open senate seat, but lost to the sane, although by no means moderate, Lamar Alexander.  In 2006, he came in second in the Senate primary, losing to Corker but defeating Hilleary.  He’ll probably run again if there’s ever an open seat.

George Nethercutt, Spokane.  Nethurcutt garnered national attention after upsetting Speaker Tom Foley by two points in this conservative district.  Foley was the first Speaker to lose since 1860.  He violated his promise of serving only three terms, but after five, he ran for the Senate against Patty Murray.  He lost by twelve points in a race that was never forgotten but never worrisome either.  He is CEO of a nonprofit, the Nethercutt Foundation.  

Mark Neumann, Milwaukee Suburbs.  Mark Neumann defeated freshman Peter Barca by less than one point in this tight 1994 election.  He narrowly won re-election in 1996 and then refused to vote for Newt Gingrich for speaker.  In 1998, he decided to challenge Russ Feingold and lost by only two points.  He’s running for Governor this year, but will probably lose the primary.  

GAME BACK ON in MI-08; Help Give Lance a Chance!

(cross-posted at dKos; if you feel this diary is worth people knowing about, please Recommend it there as well as here, thanks!)

OK. As many of you know, I’ve been posting diaries about the unusual situation going on in Michigan’s 8th Congressional District, where all-around wingnut Republican Mike Rogers has been in office for the past 10 years.

I’m not going to rehash the backstory in MI-08 again at this time; check this diary for the details.

For the record, MI-08 is the district of Mike “Kill the WikiLeaks Guy!” Rogers, who also wants to allow drilling in the Great Lakes.

The short version is this: Kande Ngalamulume–who had grown up in Lansing, Michigan, but had been living and working in Pennsylvania for several years before moving back to Lansing in order to run for Congress–filed for the Democratic nomination and ran a campaign for a few months.

Citing a lack of support and funding, he then decided to drop out of the race after the filing deadline. Since he was the only one who had filed in time, he was virtually guaranteed to be on the ballot in November, even though he had dropped out and moved back to Pennsylvania.

Lansing resident Lance Enderle decided that someone should actually face Rogers in November, and launched a last-minute, desperate write-in campaign for the Democratic nomination, which I promoted non-stop here and elsewhere in the blogosphere (Full disclosure: I’m also the campaign website developer; I’m not being paid much, but I am being paid).

Unfortunately, in spite of a flurry of last-minute activity, it just wasn’t to be: Lance only garnered around 2,100 votes out of 28,000 cast in the Democratic primary, or around 7.5%.

Now, on the one hand, this sucks given how much work and effort everyone on the campaign put in (along with some help from dKos and elsewhere).

On the other hand, typical write-in campaigns are lucky to get more than 1% of the vote at best, and that’s only when they have a decent amount of time and money, neither of which Lance had. For that matter, write-ins at the Congressional level are almost unheard of (I looked it up–there’s only been perhaps a half-dozen successful write-in campaigns in Congressional history, and that’s almost always been with much higher-profile candidates).

Lance only had about 40 days and a couple thousand dollars to scrape together his campaign.

Getting over 7% of the vote in a U.S. Congressional write-in campaign is actually pretty damned impressive, if you think about it.

ANYWAY…

Normally, this would be the end of it, right? Lance put in a good effort, but it just wasn’t meant to be, and he came up short.

HOWEVER…

Since the election, there’s been an important development:

After briefly flirting with the idea of jumping back into the race after all, Mr. Ngalamulume publicly announced that not only is he officially NOT running, but that–even more importantly–he is going to formally change his legal residency back to Pennsylvania, which would allow Michigans’ 8th District Democratic Party to have his name removed from the November ballot, and replace him with someone else’s name.

You know, someone like, say, Lance Enderle.

Yes, that’s right–Lance is now very likely to be named as the Democratic Congressional Nominee for the 8th District after all!

Now, I must stress that this hasn’t actually happened yet. For one thing, the various parties involved–the MI-08 Dems, the Michigan SoS office, and (I presume) the Pennsylvania SoS office, along with Lance, are all waiting for the actual paperwork to be filed. For another, it’s always possible that the MI-08 powers that be will name someone else to be the replacement candidate. However, this is considered pretty unlikely, especially since, to my knowledge, Lance is the only one who’s even expressed any interest in running.

The paperwork and legal processes necessary are expected to happen within the next few days. I’ve been holding off on posting about the situation until the process had completed. However, given the fact that every day that passes makes it that much more difficult to take on Mike Rogers, I’ve been given the OK to give an update on where things stand.

In the meantime, Lance needs your help to ensure that once his name is officially listed, he can get his (admittedly difficult) campaign up and running with minimal down time.

This coming weekend has a number of events–parades and other such things–that the campaign needs to retool for, and very little time to do so. To help prepare for this, we’re putting together a quickie money bomb goal of $3,000 for the coming week.

As for Lance himself, I just wanted to give a taste of one of the excellent 3rd-party blogosphere stories from The Political Carnival; to wit:

I just got off the phone with a someone I could have hung out with for hours. He owns a golden retriever he calls “Dude”, he is a 6th-12th grade social studies teacher going for his masters in special ed at Michigan State, and as lay back and wickedly funny as he is, he’s dead serious about representing the people of Michigan’s 8th district.

And when I say people I mean people. Not corporations. Not BP. Not K Street. Not like Republican Mike Rogers, the incumbent, who really ought to give the HBO movie “Gasland” a little look-see.

Oh, yeah–and I can’t forget the money quote:

After talking to him for quite awhile, I could easily draw parallels to Rep. Alan Grayson. IMHO, Enderle could very well become the new most dangerous man in Washington. Sort of an Alan Grayson with a James Earl Jonesish voice.

Yup. She went there.

You guys keep saying you want more Alan Graysons in Congress, right?

Now imagine Alan Grayson with Darth Vader’s voice.

Lance Enderle for Congress

Lance’s ActBlue Page

Lance’s Facebook Page

Lance on Twitter

Goal Thermometer

GIVE LANCE A CHANCE!!

Bobby Jindal’s Strange 2003 Coalition, Part 1

By: Inoljt, http://mypolitikal.com/

This is the first part of two posts analyzing Louisiana’s 2003 gubernatorial election, in which Republican candidate Bobby Jindal narrowly lost to lieutenant governor Kathleen Blanco. The second part can be found here.

Bobby Jindal’s Strange Coalition

In 2003, an ambitious Bobby Jindal ran for Louisiana governor against Democratic candidate Kathleen Blanco. Despite holding a narrow polling lead throughout most of the campaign, Mr. Jindal ended up losing by a three-point margin.

The story of the coalition that voted for Mr. Jindal constitutes quite the interesting tale. It is much different from the Republican base as commonly envisioned in the Deep South.

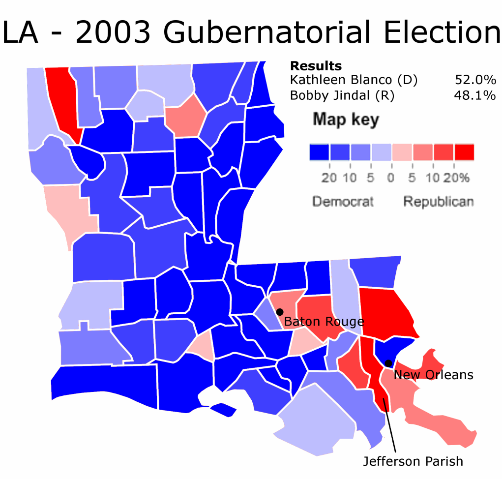
To begin, let’s take a look at a map of the election – which is substantially different from most modern electoral maps. Here it is:

Bobby Jindal's Strange 2003 Coalition,Part 1

More below.

The first thing that strikes the eye is the sheer number of parishes Mr. Jindal lost. He was absolutely crushed in rural Louisiana.

This is a remarkable thing. In the United States of today, it is usually an accomplishment for a Democrat to win a state’s rural counties, even in a landslide. Democrats almost never win the rural vote when the election is close.

Mr. Jindal, of course, got 48% of the vote somewhere. As it turns out, these votes came mainly from the state’s most populous parishes. The state’s most populous parish – Jefferson Parish – voted for Mr. Jindal by more than a 3-to-2 margin. In New Orleans, with the endorsement of Mayor Ray Nagin, Mr. Jindal did as well as possible for a Republican, winning almost one-third of the vote.

In other words, Mr. Jindal used strong margins from metropolitan, suburban Louisiana to counter Ms. Blanco’s rural strength and New Orleans – a strategy more familiar to Democrats than Republicans.

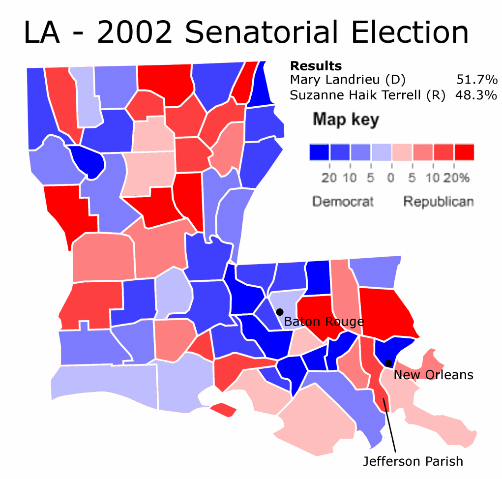
Here is a more “normal” election in Louisiana:

Bobby Jindal's Strange 2003 Coalition,Part 1

Although it does not look like it, Republican candidate Suzanne Terrell did only one point better than Mr. Jindal.

There are substantial differences in their coalitions, however. Ms. Terrell did worse in the populous southeast, although the map does not show it well. She lost Baton Rouge (which Mr. Jindal won) and took only one-fifth of the vote in New Orleans, compared to the one-third Mr. Jindall racked up.

On the other hand, Ms. Terrell performed far better in rural, northern Louisiana – winning a number of thinly populated, poor parishes that Mr. Jindal lost. It was Mr. Jindal’s performance that constituted the aberration; deeply conservative, these parishes are a core part of the Republican base.

The next section will focus on the racial dynamics that caused this effect.

Redistricting Illinois: 14 D – 4 R

This is my first attempt at redistricting Illinois.  I drew this map assuming that Governor Pat Quinn wins re-election and Democrats control the redistricting trifecta.  SSPers know, of course, that Pat Quinn trails in the high single-digits in the most recent polls, so full Democratic control remains in doubt.  

Illinois is predicted to lose a congressional seat in 2012, going from 19 to 18 seats.  This necessitated the drawing together of two incumbents, Peter Roskam and Mike Quigley.  Illinois also currently has 4 VRA districts (3 African-American, 1 Hispanic) all based in the City of Chicago.  I preserved all 4 districts, and I felt that the sharp Hispanic growth required the creation of another majority Hispanic district.  Therefore, my map has 5 Minority-Majority districts.  

Chicago Area

District 1 (Golden Yellow) Pop. 716,433; 56% Black, 36% White, 6% Hispanic – Bobby Rush (D)

Located in the Heart of Chicago’s South Side, the 1st District remains mostly the same, except that it grows a bit in area and becomes dramatically less Black (formerly 65%, now 56%), but this is all a result of population loss in that area.  Still heavily Black and strongly Democratic. Obama ~ 80% – 85%

District 2 (Dark Blue) Pop. 719,391; 55% Black, 32% White, 12% Hispanic – Jesse Jackson, Jr. (D)

The South Side’s other Majority Black district, the 2nd also stays mostly the same, but expands in area and becomes a bit less Black.  It takes in some of the Cook County portion of Judy Biggert’s current district, but still remains the most Democratic district in Illinois.  Obama ~ 85% – 90%

District 3 (Red) Pop. 712,342; 63% Hispanic, 29% White, 5% Black – OPEN (D)

Unlike most of the other ethnic groups in the city, Chicago’s Hispanic population is growing rapidly.  Currently there is only one Majority Hispanic district in Illinois, represented by Luis Gutierrez. The rapid growth, as well as the large distance between the two main Latino enclaves, led me to create two Hispanic majority districts.  The 3rd, located on the South and West sides of the City and including Cicero, Berwyn, and Burbank, is predominantly Mexican.  Gutierrez, this area’s current Congressman, is Puerto Rican and lives on the North Side.  The split will allow the Mexican Community to have it’s own voice in Congress.

Obama ~ 70% – 75%

District 4 (Turquoise Blue) Pop. 716,176; 57% Hispanic, 30% White, 5% Black – Luis Gutierrez (D)

This is Chicago’s second majority Hispanic District.  It is primarily Puerto Rican and is located just North and West of the Loop.  It is reasonably compact (much better than the previous 4th, at least) and includes Rep. Gutierrez’s home.  He would likely be very happy with this district.  It remains strongly Democratic. Obama ~ 70% – 75%

District 5 (Purple) Pop. 718,061; 74% White, 14% Hispanic, 8% Asian – Mike Quigley (D) + Peter Roskam (R)

The new 5th District draws together two relatively new Congressman, Democrat Mike Quigley of Chicago and Republican Peter Roskam of DuPage County.  Roskam’s District was very evenly divided when he won his first term in 2006, but in 2008 it gave President Obama 56% of the vote.  The addition of strongly Democrat-leaning parts of Northern Chicago makes the 5th a likely to safe Democrat district, and Quigley should beat Roskam fairly easily.  Obama ~ 60% – 65%

District 6 (Gray) Pop. 718,677; 54% Black, 35% White, 5% Hispanic – Danny Davis (D)

Danny Davis’s District bled population over the last decade, and therefore had to increase dramatically in size.  It is the last of Chicago’s 3 majority Black districts, and it stretches from Downtown/The Loop out to the Cook County – DuPage County border, and South to include more conservative suburbs formerly represented by Dan Lipinski.  At 54% Black, it is still strongly Democratic.  Obama ~ 80% – 85%

District 7 (Pink) Pop. 720,868; 64% White, 13% Asian, 13% Hispanic – Jan Schakowsky (D)

This new district takes up much of North Chicago along the lakeshore, including Lakeview, the Midwest’s largest gay district.  Much of this area was formerly in Mike Quigley’s district, but will probably be happier with a strong Liberal like Schakowsky.  It also includes her home in Evanston, some North-Western suburbs like Des Plaines and Park Ridge, and other Democrat leaning areas north of the city.  It should be safely Democratic.  Obama ~ 70% – 75%

Collar Counties/Chicago Exurbs

District 8 (Violet/Purplish Blue) Pop. 718,040; 74% White, 14% Hispanic, 7% Asian – Melissa Bean (D)

Covers a similar territory to Bean’s old district, but now takes in more of Lake and Cook Counties and much less of McHenry County.  Moves closer to Chicago, so I would guess that it becomes somewhat more Democratic.  Likely still a narrowly Dem-leaning swing district.  Obama ~ 55% – 60%

District 9  (Bright Green) Pop. 715,049; 66% White, 18% Hispanic, 10% Asian – Dan Seals (D) or Bob Dold (R)

Mark Kirk’s elusive North Shore district moves a little more into Cook County, and becomes 15% less White in the process (going from 81% to 66%).  It now includes Dan Seals’ home in Willmette, as well as Highland Park, Lake Forest, and Waukegan in Lake County.  If Dan Seals doesn’t win this district in 2010, another Democrat will in 2012.  Obama ~ 65% – 70%

District 10  (Tan) Pop. 712,389; 73% White, 11% Hispanic, 9% Asian – Judy Biggert (R) + Dan Lipinski (D)

This district strongly resembles Judy Biggert’s old 13th, but it was drawn with ConservaDem Dan Lipinski in mind.  It includes a portion of his old urban-suburban district, as well as parts of Will and DuPage counties, centered mainly around Naperville.  If faced with a Lipinski matchup in 2012, Biggert would probably opt to retire, but if not, or if Republicans can manage to find a moderate State legislator to run, Republicans could hold this district.  But Lipinski, a social-conservative who is already well known in the area, would have a significant chance of winning here.  Obama ~ 50% – 55%

District 11 (Olive Green) Pop. 718,631; 66% White, 24% Hispanic, 6% Black – Bill Foster (D) OR Randy Hultgren (R)

One of the few Districts in Illinois that has been experiencing steady growth over the past decade, Bill Foster’s district had to shed it’s Western rural counties, but is still centered around Kane, Kendall, and Dekalb Counties.  It includes the fast growing, Democrat-leaning, minority-majority city of Aurora, as well as Geneva, Elgin, and DeKalb. Becomes slightly more Democratic, which should help Foster out, though the district is already trending blue.  Obama ~ 55% – 60%

Rural Illinois

District 12 (Dark Green) Pop. 712,202; 80% White, 11% Hispanic, 6% Black – Don Manzullo (R)

Manzullo’s district stays mostly the same (centered around Rockford), but loses rural Carrol, Ogle, and Whiteside Counties in exchange for almost all of McHenry.  Maybe moves slightly left, but not drastically, and not enough to dislodge Manzullo.  Obama ~ 50% – 55%

District 13 (Periwinkle Blue)  Pop. 719,998; 76% White, 12% Hispanic, 9% Black – Debbie Halvorson (D) OR Adam Kizinger (R)

The 14th takes in all of Kankakee County, most of Will County, and most of LaSalle County.  It loses the strange shaped arm that stretched South into McLean County and becomes much more compact.  Minority growth in the Joliet area makes this district a bit more Democratic, and should be a Democratic hold in a neutral year.  Obama ~ 55% – 60%

District 14 (Sky Blue) Pop. 717,188; 90% White, 4% Hispanic, 3% Black – Aaron Schock (R)

I had to draw Aaron Schock’s home in Peoria out of his district and into Phil Hare’s but in exchange I gave him a district that is a bit more Republican.  It streches South from the Iowa border to strongly Republican Tazewell County, then to the Springfield area, and finally West to include all of McLean County.  Should be safely Republican.  Obama ~ 45%

District 15 (Orange) Pop. 717,498; 88% White, 6% Black, 3% Hispanic – Timothy Johnson (R)

Stays almost exactly the same, covers the same area along the Indiana border and leans strongly Republican.  Obama ~ 45% – 50%

District 16 (Dark Purple)  Pop. 716,746; 83% White, 9% Black, 4% Hispanic – Phil Hare (D)  

This district is now much more compact than it used to be. It includes the Illinois portion of the Quad Cities, Peoria, and a small portion of Springfield, as well as a large swath of rural farming counties along the Iowa border.  Should be safe for Hare, though the area is trending Republican.  Obama ~ 55% – 60%

District 17 (Green) Pop. 717,602; 81% White, 15% Black, 2% Hispanic – Jerry Costello (D)

I tried to shore up Costello’s district as much as possible, but it’s still more or less the same.  It loses some of it’s far Southern counties along the Kentucky border that have been trending Republican, and gains Macoupin and Montgomery Counties, both of which were won by Obama. Still, the needle doesn’t move too much.  Obama ~ 55%

District 18 (Yellow) Pop. 711,505 89% White, 7% Black, 2% Hispanic – John Shimkus (R)

Still the most Republican district in Illinois, Shimkus’s doesn’t change much.  It’s hard to believe this district was once represented by Dick Durbin.  Obama ~ 40% – 45%

Redistricting New Jersey: 10D-2R and 5D-7R

Here is my first attempt at redistricting New Jersey.

Here is a 10-2 NJ plan that is fairly compact, preserves communities of interest, and still has 2 VRA districts. It only splits a small handful of cities, and minimizes splitting counties.

Unlike some other states, NJ has just barely enough minorities in the same place to fill a VRA district(and it gets harder every census), so VRA districts can’t be used to soak up Republican votes.

Note: Obama vs McCain numbers for new districts don’t count votes for other candidats, so they always add up to 100%.

1st District Frank LoBiondo (R) BLUE

Pinelands, Atlantic City area

New 56%O 44%M Old 54%O 45%M

67% White, 15% Black, 13% Hispanic, 3% Asian

In 2008 Frank LoBiondo was reelected with 62% of the vote in a district that gave Obama 54%. Do the math, how Democratic will it have to be to dislodge him. At least now at 56% Obama the district is all but certain to go Democratic after LoBiondo retires (he’s 64). The outermost townships of Camden and Gloucester are more rural than the rest of their counties, but they are just as Democratic. (So I lied, as long as LoBiondo sticks around it’s not 10-2).

2nd District Rob Andrews (D), John Adler (D) GREEN

Camden area

New 63%O 37%M Old 65%O 34%M

70% White, 15% Black, 10% Hispanic, 4% Asian

Rob Andrews and John Adler are my least favorite Democratic Congressmen from NJ, so I don’t mind putting both of them into the same district. It’s 2 points less Democratic, to help out the 1st.

3rd District Rush Holt (D) PURPLE

Mount Laurel, Trenton, Princeton

New 63%O 37%M Old 52%O 47%M

67% White, 18% Black, 9% Hispanic, 5% Asian

Rush Holt is my favorite Democratic Congressman, so I hate doing this to him. His district (the old 12th) is split almost perfectly in 2, so he gets to pick which half he wants. This district follows the Delaware River from Palmyra to Frenchtown. Obama won even the Hunterdon part of this district.

4th District Chris Smith (R) RED

Ocean county, southern Monmouth County

New 41%O 59%M Old 47%O 52%M

87% White, 3% Black, 7% Hispanic, 2% Asian

There is no need to split Ocean County because it is so uniformly Republican. Just add some like-minded southern Monmouth. About 2/3 of Smith’s district is already in Monmouth and Ocean, so this isn’t a big change for him. Now the Mercer and Burlington parts of his district can go in a Democratic district where they belong. Bill Clinton probably won it in 1996.

5th District Rush Holt? (D) YELLOW

Brunswicks, Windsors, Franklin, Bridgewater

New 61%O 39%M Old 58%O 41%M

61% White, 9% Black, 12% Hispanic, 17% Asian

The well-educated, affluent, heavily-Democratic suburbs of Central NJ. It’s more Democratic because it loses the arms extending into Hunterdon and Monmouth. Rush Holt will probably take this district so John Adler can have the 3rd.

6th District Frank Pallone (D) TURQUOISE

Lake Como to most of Edison

New 55%O 45%M Old 60%O 39%M

63% White, 9% Black, 16% Hispanic, 11% Asian

It loses some Democratic strength because it takes more of Monmouth, but it’s still Democratic enough. This piece of Monmouth has a majority of the county’s population and Obama won it.

7th District Rodney Frehlinghuysen (R) GRAY

Morristown, Plainfield, Linden

New 56%O 44%M Old 7th: 51%O 48%M — Old 11th: 45%O 54%M

63% White, 11% Black, 15% Hispanic, 10% Asian

This district contains all of Union that’s not in a VRA district, and piece of Morris that Obama lost by 300 votes (out of 100,000), and fairly Democratic pieces of Somerset, Middlesex, and Essex. At last, North Plainfield, Plainfiled, and South Plainfield are all in the same district! It has a finger protrude west into Dover and Wharton so those Democratic towns don’t go to waste. Rodney F has not represented most of this territory before, so it will be difficult for him to win it. Linda Stender or Ed Potosnak should win it fairly easily.

8th District Donald Payne (D) INDIGO

Newark, Oranges, Roselle

New 82%O 18%M Old 87%O 13%M

26% White, 51% Black, 16% Hispanic, 5% Asian

The black VRA district. It loses heavily Democratic and white Linden and Rahway, and takes in Republican-leaning Kenilworth and Nutley.

9th District Albio Sires (D)CYAN

Elizabeth, Hoboken, Kearny

New 72%O 28%M Old 75%O 24%M

34% White, 7% Black, 49% Hispanic, 8% Asian

The Hispanic VRA district. It no longer reaches into Middlesex County, that territory is saved for a Democrat who needs it more.

10th District Steve Rothman (D) PINK

Secaucus, most of Bergen

New 58%O 42%M Old 61%O 38%M

60% White, 6% Black, 17% Hispanic, 15% Asian

It extends to the northern border because of slow population growth. This makes it 3 points less Democratic. That’s still Democratic enough.

11th District Bill Pascrell (D) LIME

West Orange, Paterson, Ridgewood

New 56%O 44%M Old 63%O 36%M

57% White, 9% Black, 26% Hispanic, 7% Asian

Just like the 10th, it extends to the northern border and becomes less Democratic. It’s still Paterson-centric.

12th District Scott Garrett (R), Leonard lance (R) SKY BLUE

northwest NJ

New 42%O 58%M Old 5th: 45%O 54%M

86% White, 2% Black, 6% Hispanic, 4% Asian

All of Sussex and Warren. Parts of Hunterdon, Somerset, Morris and Passaic. Any territory in NW NJ that is remotely Democratic has been drawn into a different district.

Republican Gerrymander

1st District Rob Andrews (D) BLUE

Camden and Burlington area

New 69%O 31%M Old 65%O 34%M

63% White, 21% Black, 11% Hispanic, 4% Asian

The existing 1st was designed to pack in as much Democratic territory as possible. I just did a better job. This is the only Dem district that’s more than 50% white.

2nd District Frank LoBiondo (R) GREEN

Pinelands, Bay shore, Vineland/Millville, Cape May

New 53%O 47%M Old 54%O 45%M

75% White, 11% Black, 10% Hispanic, 3% Asian

It loses Atlantic City and Pleasantville to make it more Republican, and make up for it gaining Gloucester County.

3rd District John Adler? (D) PURPLE

Atlantic City, Toms River, Delran

New 49.7%O 50.3%M Old 52%O 47%M

79% White, 9% Black, 7% Hispanic, 4% Asian

This district is dominated by Ocean County, and doesn’t have anywhere for a Democrat to build a base.

4th District Chris Smith (R) RED

Hamilton, Old Bridge, Springfield

New 53%O 47%M Old 47%O 52%M

74% White, 6% Black, 9% Hispanic, 10% Asian

Chris Smith always outperforms his district’s PVI, especially in Hamilton (the southwesternmost town in this district). In 2008 Hamilton gave 55% of its vote to Obama and 68% of its vote to Smith. Hamilton (pop. 86k) should be enough of an anchor for Smith to hold down the rest of this swing district.

5th District Rush Holt (D) SKY BLUE

Trenton, New Brunswick, Plainfield

New 72%O 28%M Old 58%O 41%M

44% White, 21% Black, 15% Hispanic, 18% Asian

Democratic Central NJ gets packed in like never before. It’s minority-majority, which is hard to believe from the part where I live. Pretend this district has the most Democratic possible combination of Edison and Woodbridge, while Chris Smith gets the rest of Edison and Woodbridge.

6th District Frank Pallone (D) TURQUOISE

Monmouth and northern Ocean

New 45%O 55%M Old 60%O 39%M

78% White, 7% Black, 10% Hispanic, 3% Asian

It’s probably too Republican for Pallone to hold it. And most of it is territory he has not represented before.

7th District Leonard Lance (R) GRAY

Flemington, Somerville, Morristown, West Orange

New 49%O 51%M Old 7th: 51%O 48%M — Old 11th: 45%O 54%M

76% White, 4% Black, 9% Hispanic, 10% Asian

A more Republican version of the current 7th district.

8th District Donald Payne (D) PINK

Newark, Oranges, Roselle

New 84%O 16%M Old 87%O 13%M

23% White, 53% Black, 17% Hispanic, 5% Asian

It only became less Democratic because it lost population and had to expand. It still packs in blacks and white Democrats.

9th District Albio Sires (D)CYAN

Elizabeth, Hoboken, Union City

New 74%O 26%M Old 75%O 24%M

30% White, 8% Black, 53% Hispanic, 8% Asian

Not that different from the existing 13th.

10th District Steve Rothman (D) vs Bill Pascrell (D) INDIGO

Paterson, Hackensack, Englewood

New 69%O 31%M Old 8th: 63%O 36%M — Old 9th: 61%O 38%M

44% White, 21% Black, 15% Hispanic, 18% Asian

The most Democratic parts of the existing 8th and 9th get packed into 1 district.

11th District Rodney Frehlinghuysen (R) LIME

Warren County to Secaucus

New 51%O 49%M Old 45%O 54%M

77% White, 3% Black, 12% Hispanic, 7% Asian

It takes in northern Essex, southern Bergen, and Secaucus and part of Kearny. Morris and Warren should be enough to keep it Republican at the Congressional level. If it’s not Republican enough for you then trade some territory with the 12th, which has some Republican strength to spare.

12th District Scott Garrett (R) YELLOW

Sussex to Alpine

New 46%O 54%M Old 5th: 45%O 54%M

83% White, 2% Black, 7% Hispanic, 8% Asian

Everything along NJ’s northern border.

California: How Demographic Changes Impacted Partisan Changes (Part 4)

For the final leg of our journey, we are going to the Southland, which includes the 3 biggest counties in the state. Back in 1910, these counties held just about 30% of the state’s population, while the Bay Area held 40%. Now, the Southland’s slice of the pie has been pumped up to 55%, while the Bay Area holds barely 20%. Looking at the PVI results from 1992, it made perfect sense for Clinton to focus his California efforts more on SoCal, because it was making up a greater share of the state. His efforts plus the demographic changes already underway played a big part in pulling this very populous region, and the state, leftward.

Los Angeles

Year Population Change % of state PVI
1920
936,455
85.8%
27.33%
R+9.1
1930
2,208,492
135.8%
38.90%
R+5.8
1940
2,785,643
26.1%
40.33%
D+4.7
1950
4,151,687
49.0%
39.22%
R+1.7
1960
6,038,771
45.5%
38.42%
D+1.3
1970
7,041,980
16.6%
35.29%
D+2.4
1980
7,477,239
6.2%
31.59%
R+0.2
1990
8,863,052
18.5%
29.78%
D+8.7
2000
9,519,338
7.4%
28.10%
D+13.5
2008*
9,862,049
3.6%
26.96%
D+16.0

Orange

Year Population Change % of state PVI
1920
61,375
78.20%
1.79%
R+14.2
1930
118,674
93.40%
2.09%
R+14.6
1940
130,760
10.20%
1.89%
R+15.2
1950
216,224
65.40%
2.04%
R+10.4
1960
703,925
225.60%
4.48%
R+13.7
1970
1,421,233
101.90%
7.12%
R+17.3
1980
1,932,921
36.00%
8.17%
R+13.1
1990
2,410,668
24.70%
8.10%
R+10.4
2000
2,846,289
18.10%
8.40%
R+7.1
2008*
3,010,759
5.80%
8.23%
R+6.8

San Diego

Year Population Change % of state PVI
1920
112,248
82.00%
3.28%
R+4.0
1930
209,659
86.80%
3.69%
R+5.9
1940
289,348
38.00%
4.19%
D+1.6
1950
556,808
92.40%
5.26%
R+5.8
1960
1,033,011
85.50%
6.57%
R+6.8
1970
1,357,854
31.40%
6.81%
R+6.5
1980
1,861,846
37.10%
7.87%
R+11.0
1990
2,498,016
34.20%
8.39%
R+4.8
2000
2,813,833
12.60%
8.31%
R+4.0
2008*
3,001,072
6.70%
8.20%
R+0.2

Imperial

Year Population Change % of state PVI
1920
43,453
219.70%
1.27%
R+1.4
1930
60,903
40.20%
1.07%
D+0.5
1940
59,740
-1.90%
0.86%
R+1.6
1950
62,975
5.40%
0.59%
R+6.7
1960
72,105
14.50%
0.46%
R+1.2
1970
74,492
3.30%
0.37%
R+5.5
1980
92,110
23.70%
0.39%
R+3.5
1990
109,303
18.70%
0.37%
R+1.0
2000
142,361
30.20%
0.42%
D+5.2
2008*
163,972
15.20%
0.45%
D+7.0

Riverside

Year Population Change % of state PVI
1920
50,297
45.00%
1.47%
R+13.2
1930
81,024
61.10%
1.43%
R+15.8
1940
105,524
30.20%
1.53%
R+9.6
1950
170,046
61.10%
1.61%
R+10.3
1960
306,191
80.10%
1.95%
R+5.6
1970
456,916
49.20%
2.29%
R+2.8
1980
663,199
45.10%
2.80%
R+5.8
1990
1,170,413
76.50%
3.93%
R+4.3
2000
1,545,387
32.00%
4.56%
R+4.9
2008*
2,100,516
35.90%
5.74%
R+4.9

San Bernardino

Year Population Change % of state PVI
1920
73,401
29.40%
2.14%
R+6.4
1930
133,900
82.40%
2.36%
R+11.5
1940
161,108
20.30%
2.33%
R+0.9
1950
281,642
74.80%
2.66%
R+2.6
1960
503,591
78.80%
3.20%
R+0.8
1970
682,233
35.50%
3.42%
R+3.1
1980
895,016
31.20%
3.78%
R+5.9
1990
1,418,380
58.50%
4.77%
R+4.7
2000
1,709,434
20.50%
5.05%
R+2.7
2008*
2,015,355
17.90%
5.51%
R+2.6

MN-Gov: Can You Feel the Emmer-mentum?

SurveyUSA for KSTP-TV (8/2-4, likely voters, 6/14-6/16 in parens; 5/3-5 in brackets):

Mark Dayton (DFL): 46 (38) [34]

Tom Emmer (R): 32 (35) [42]

Tom Horner (I): 9 (12) [9]

Undecided: 13 (15) [15]

Margaret Anderson Kelliher (DFL): 39 (33) [33]

Tom Emmer (R): 33 (35) [41]

Tom Horner (I): 9 (12) [9]

Undecided: 13 (21) [17]

Matt Entenza (DFL): 38 (33) [31]

Tom Emmer (R): 33 (37) [42]

Tom Horner (I): 12 (12) [10]

Undecided: 17 (18) [16]

(MoE: ±2.7%)

The wheels on the bus go round-and-round, except, of course, if your bus is Tom Emmer’s gubernatorial candidacy. Emmer’s hit a few speedbumps recently, having been on the receiving end of ads from DFL candidate Matt Entenza attacking Emmer’s Palinism and outside groups hitting Emmer on drunk driving laws.

SurveyUSA follows up with a second poll confirming the results of the Minneapolis Star-Tribune’s poll earlier this week, with leads for each of the DFL hopefuls. Emmer’s decline’s been quite stunning, having consistently lost points in each progressive SurveyUSA poll. We’ve had “Joementum” and felt the “Mumpower”, and now, there’s “Emmermentum.” Mark Dayton fares the best, now boasting a 14-point lead, up from an 8-point deficit three months ago – a remarkable 22% swing in that time. Margaret Anderson Kelliher is now up 6, a 14-point swing from being down 8; Entenza’s now 5 up, a 16-point swing from being 11 down.

SurveyUSA for KSTP-TV (8/2-4, likely voters, 6/14-6/16 in parens):

Mark Dayton (DFL): 43 (39)

Margaret Anderson Kelliher (DFL): 27 (26)

Matt Entenza (DFL): 22 (22)

Undecided: 7 (11)

(MoE: ±4.5%)

The corresponding part of the poll examining the DFL primary also mirrors the Star Tribune’s poll. There’s been slight movement since SurveyUSA last examined the race in June, with Mark Dayton still in the driver’s seat with a 16-point lead over MAK and Entenza in third. Dayton looks well on his way along the road to redemption since retiring from the Senate four years ago; with these results and Emmer’s rising unfavorables, there’s good reason for optimism that we’ll take back the Governor’s Mansion in St. Paul.

SSP Daily Digest: 8/6

  • CO-Sen: In yet another example of the perils of Citizens United, Americans United for Life, a non-profit anti-abortion group, is endorsing GOPer Jane Norton. Worry not, circular firing squad enthusiasts, as other pro-life groups endorsing Norton’s more conservative rival Ken Buck are already hitting back promoting Buck as the pro-lifest option.
  • FL-Sen: Kendrick Meek, seeking to stanch the bleeding of support to Jeff Greene in the Democratic primary, has released an internal poll showing him leading by the slimmest of margins, 36-35, with 8% going to Maurice Ferre and 20% undecided. Meek has three events planned with the Big Dog in the coming weeks – which isn’t surprising given Meek did endorse Hillary Clinton for President in 2008.
  • KY-Sen: Braun Research (8/2-4, likely voters):

    Jack Conway (D): 31

    Rand Paul (R): 41

    Undecided: 28

    (MoE: ±3.46%)

    Braun Research is out with another poll in Kentucky, showing a result consistent with other pollsters of a slight lead for mountain-hater Rand Paul.

  • NV-Sen: Sharron Angle’s Tour de Crazy continues, as she’s now bandying about criticizing gay adoption (which is legal in Nevada) and advocating for the right of religious officials to endorse political candidates – which flies squarely in the face of Section 501(c)(3) of the tax code.
  • CO-Gov: Former state legislator Tom Wiens – last seen briefly running for the Senate seat currently held by Michael Bennet – may have set his sights on the Governor’s race as a post-primary option given the utter fail of both GOPers on the ballot, Scott “plagiarist” McInnis and Dan “lien collector” Maes. Wiens claims to have already voted for Scott McInnis, but his follow-up statement that “I voted for Scott McInnis and let’s hope things work out” is hardly a ringing endorsement.
  • MN-Gov: Target’s CEO, Gregg Steinhafel, is apologizing for the company’s recent $150,000 to the shadowy right-wing group Minnesota Forward, which was last seen airing ads in support of the waitstaff-hating, gay-bashing, Christian conservative-cozy GOP nominee, Tom Emmer. The irony in all of this, of course, is that Target is the successor to the Dayton-Hudson Corporation…to which Democratic gube-hopeful Mark Dayton is an heir.
  • AL-05: With many of their members at risk in November, the Blue Dog Coalition senses an opportunity to add to their ranks here, endorsing Dem nominee Steve Raby. The Blue Dog Coalition goes way back in this northern Alabama district, as Bud Cramer – who held this seat until 2008 – was a co-founder of the coalition.
  • ID-01: It’s hard to to tell who’s campaign’s been more amusing, Bill Sali’s or Raul Labrador’s. The normally GOP-leaning Idaho Associated General Contractors – who even endorsed Bill Sali in 2008 – are opting for Dem Walt Minnick, even citing Minnick’s opposition to the stimulus as a point of reservation for the group.
  • TN-08: The dust’s hardly settled from last night’s bloody GOP three-way…primary, which has fortunately allowed Democratic nominee state Sen. Roy Herron to build up a huge financial advantage. Outside groups are stepping in though, with the conservative-leaning 60 Plus Association dropping $240k in ad buys against Herron in the Memphis, Jackson, and Nashville markets.
  • VA-05: To the disappointment of cat fud lovers everywhere, the teabaggish Jim McKelvey – despite his earlier reluctance – is endorsing the man who beat him in the primary, “moderate” state Sen. Robert Hurt. Fortunately, there’s still the teabagging independent in this race, Jeff Clark.
  • WA-08: In a major surprise, the Seattle Times has decided not to endorse incumbent GOPer Dave Reichert, criticizing his constant nay-saying. The Times – which has endorsed Reichert in the past – is instead opting for Microsoft exec Suzan DelBene (D) and Expedia senior manager Tim Dillon (R) in Washington’s unusual top two primary.
  • Polling: Daily Kos, after having fired their pollster Research 2000, is back in the polling game, to the delight of Swingnuts everywhere. While Daily Kos has yet to decide on a national pollster, they’ve settled on the always reliable Public Policy Polling for state-level horserace polling.

  • Rasmussen:

  • CA-Gov: Brown (D) 43%, Whitman (R) 41%

  • MI-Gov: Bernero (D) 37%, Snyder (R) 49%

  • NC-Sen: Marshall (D) 40%, Burr (R) 49%