GOP Gerrymander of MA–Ask and ye shall receive!

This diary was inspired by a comment from Nichlemn on markhanna’s recent diary which read, “[Other blogs] are for people who want to know who’s likely to win the next big election. SSP is for people who want to know who’s going to win the Democratic primary in UT-03 or draw a Republican gerrymander of MA.” Well, I’ll leave the Utah forecasting to someone else, but here is a redistricted map of the Bay State with the GOP running things!

Note: If this is against the rules–a Republican gerrymander on a Democratic site–please take it down, and I apologize. If it’s OK, let me know if you like it, because I have one for New York too!

A few things to note before we get into it:

1. Massachusetts, unfortunately, will be losing a seat after the Census. I guess the weather is better elsewhere. This map is for nine congressional seats.

2. The current 10-seat map is a very ugly and somewhat unnecessary gerrymander. (Please feel free to venture a guess as to what Frank’s or McGovern’s district looks like now.) Democrats control all 10 districts, but probably would anyway on a fairly-drawn map. However, the current plan is designed to favor Boston-area politicians, as 6 of the 10 members of the current delegation live within 5 miles of the Hub. As a result, Middlesex County is split between 7 districts, Norfolk County has four spaghetti strands, and there is no Member from the southeastern part of the state. I tried to improve on the geographic balance somewhat.

3. Getting even one or two GOP seats was tough! The thing with Massachusetts is that Democratic strength is so evenly spread out across the state. President Obama won 302 of the 351 cities and towns, and won no less than 43% in any community statewide. To further complicate things, most of the 49 communities John McCain did win are inconveniently located near Democratic bastions like Worcester, Lowell, and Taunton. Thus, this “Republican gerrymander” is made up of 7 safe Dem seats, 1 tilt R seat, and 1 likely/safe R seat. I doubt there is any other state where a gerrymander means you have a shot at 2 of 9 seats!

4. Everything is based of presidential results. While Scott Brown put up nice numbers, there is no reason to think this will change long-term voting patterns. There is no partisan data yet for MA, so I used town-by-town results to estimate the leanings.

And here we go!

MA-01 John Olver (D) vs. Richard Neal (D)


Partisan Data: D+15-20. Obama probably got ~70% here.

Finally, Western Massachusetts has its own district, and it’s a mix of bohemian rural towns and the industrial city of Springfield. Politically and culturally, this area has much more in common with Vermont than with the rest of Massachusetts. Home to Amherst, Williams, Smith, and UMass among others, this district is both very Democratic and very liberal (not always the case here.) I drew this to be a fair fight between veterans Olver and Neal, with about equal amounts of population from their current districts. My guess is that Olver would retire in this situation.

MA-02 Jim McGovern (D)


Partisan Data: PVI around D+10. Obama scored in the low 60’s here.

An ugly yet efficient Democratic vote sink in Central Massachusetts, this is mostly new territory for McGovern but he won’t be complaining. His current district, which went strongly for Brown, is more moderate than its PVI suggests, and as one of the most liberal members of the house McGovern could be vulnerable there if not for his immense personal popularity. He retains his home base in Worcester and adds friendly territory to the north, east, and west. This district will be a pain to represent, as Fitchburg, Longmeadow, and Hopkinton have little in common.

MA-03 (purple) and MA-04 (red) OPEN


MA-03 Partisan Data: R+6. McCain 52, Obama 47

Here’s the first, and better, of the two opportunities for the GOP on this map. The district is made up mostly of exurbs of Boston, Providence, and Worcester, combined with the wealthy South Shore (Plymouth County.) In fact, it’s the only Massachusetts district without a significant urban area. I-495 runs right through the heart of this district, and a Republican from the Franklin area like St. Sen Richard Ross would be favored in this race. If Joe Malone wins the current MA-10 this year, this would be his district. Scott Brown also lives here and probably approached 70% of the vote in the January Senate race.

MA-04 Partisan Data: D+7 or so. Obama was around 60% here.

I know my map will never be drawn, but seriously, this district must be. As it stands now, men from Worcester, Newton, and Quincy represent the South Coast, Cape, and Islands,  which are a world away from those other places. This plan unites the three, whose economies are heavily depending on fishing, and in the case of the South Coast, shipping. Politically, the Inner Cape is conservative, the Outer Cape and Islands are very liberal, and the South Coast is dominated by the Democratic cities of New Bedford and Fall River. If Rob O’Leary (D) wins the MA-10 race this year, he will be a perfect fit for this district.

MA-05 Niki Tsongas (D)


Partisan Data: PVI R+3 McCain 49, Obama 49

Niki Tsongas is the weakest member of the current delegation, vastly underperforming in her only contsted election so far, and I made every attempt to draw her into a McCain district. Well I did–by about 250 votes. This plan chops off the liberal southern half of Tsongas’ current district and replaces it with Worcester’s northern suburbs and some Boston exurbs from Essex County. Most of the population comes from the conservative (by MA standards!) Merrimack Valley, which keyed Brown’s win, but geography forced me to include the liberal mill cities of Lowell and Leominster. Thus, Tsongas or another Dem wll have a shot, but the GOP should have a slight edge in a an even year.

MA-06 John Tierney (D)


Partisan Data: D+10ish. Obama probably cracked 60.

This is what remains of fast-growing Essex County after the conservative towns were given to MA-05 combined with the blue-collar cities of Revere, Chelsea and Winthrop in Suffolk County. The industrial and very Democratic city of Lawrence, which I had to keep out of Tsongas’ hands, is responsible for the ugly arm in the northwest. Tierney will cruise here.

Metro Boston Map


MA-07 Ed Markey (D) vs. Barney Frank (D)

Partisan Data: D+15 at a minimum. Obama would have been in the mid to upper 60’s.

Well, I couldn’t squeeze any more than two gettable districts for the GOP here, so the obvious consolation prize was throwing two of the most senior and powerful Democrats in Congress into the same district! But fear not, Dems: there’s a solution here. Markey has considered Senate runs before and may run against Brown in 2012, giving Frank a clear field. If Markey stays in the House, he’ll be geographically favored, and Frank can move to the Cape and run in the new MA-04 since he already represents a good chunk of the South Coast.

Politics aside, this Middlesex County district makes good sense. These are the primary western suburbs of Boston (MetroWest, as they are called), and are for the most part very wealthy and very liberal. Boston College, Tufts, and Brandeis are all in this district.

MA-08 Mike Capuano (D)

Partisan Data: D+32 or so, Obama won about 85%.

One of the most Democratic districts in the country, there’s little change here. Latte-liberal Cambridge and Brookline and blue collar Everett and Somerville combine with the majority of Boston to keep Capuano super-safe. I tried to put the most liberal parts of the Hub here–Beacon Hill, Back Bay, JP, Roxbury, Mattapan, and the South End are all included, as are Harvard, MIT, BU, Northeastern, and dozens of others. It’s 55% white, but MA has actually been losing minority population so I don’t think we’re in VRA trouble.

MA-09 Stephen Lynch (D)

Partisan Data: D+7. Obama was in the high 50’s.

Our final district belongs to the most moderate member of the current delegation, Stephen Lynch. The new district is very similar to his old one, combining most of suburban Norfolk County with the less liberal parts of Boston–Southie, West Roxbury, Hyde Park, and the white parts of Dorchester. The industrial town of Brockton is tacked on to the south to keep it away from the new MA-03. Scott Brown won here by more than expected, and this was one of those places where Obama underperformed Kerry. Nevertheless, it’s safe for Lynch until further notice.

And there you have it! McGovern and Tierney are the clearest Democratic winners, Tsongas and Frank are both losers, and Neal and Olver must slug it out in the west. The GOP has two opportunities now and may or may not have a third by 2020 depending on long-term trends in Lynch’s district.  
Good news for Texas Democrats

Bill White, the former Mayor of Houston, is sitting on $5.4 million for the general election.  Roughly twice as much as either Rick Perry or Kay Bailey Hutchinson.  

Kay Bailey Hutchinson

1.1M raised

8M spent

2.3M Cash on Hand

Rick Perry

850K raised

8.8M spent

2.5M CoH

Debra Medina

450K raised

228k spent

291K CoH

Bill White

2.2M raised

2.7M spent

5.4M CoH

Farouk Shami

1.1M raised

5M spent

1M CoH

Thanks to the BurntOrangeReport for the numbers

http://www.burntorangereport.c…

By what margin will Bob Shamansky win?

View Results

Loading ... Loading ...

Analyzing Swing States: Pennsylvania, Part 5

This is the fifth part of an analysis of the swing state Pennsylvania. It focuses on the traditionally Republican region between the Democratic strongholds in the southeast and southwest. The last part can be found here.

Photobucket

Pennsyltucky

Outside the Pittsburgh and the Philadelphia metropolis, Pennsylvania is a very different place. Political analysts often label this area “the T,” while others call it Pennsyltucky.

Popular culture mythologizes Pennsyltucky as red-neck capital – a rural region dominated by NASCAR-loving red-necks. Politically, James Carville compared Pennsyltucky to Alabama without the blacks.

In fact, this stereotype is inaccurate on two accounts. Firstly, Pennsyltucky contains far more than so-called rural red-necks; most of its counties are fairly populated (they are far more densely peopled than, say, rural Arkansas). Secondly, many of these supposedly NASCAR-loving red-necks also belong to the local union and vote Democratic on economic issues. The majority may support Republicans, but that majority certainly is below the 88% of Alabama whites that voted for John McCain.

Nevertheless, the “T” does constitute the Republican base in Pennsylvania. Former president George W. Bush pulled 48.42% of the state’s vote in 2004, and he had to get those votes somewhere.

More below.

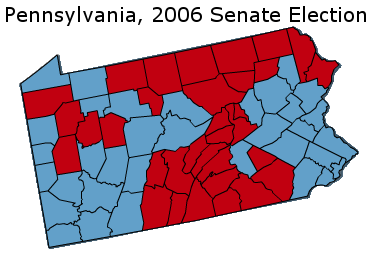
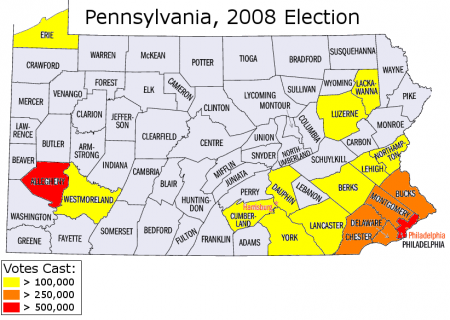
Pennsylvania’s 2006 Senate election provides a geographic illustration of this base. In that election, former Senator Rick Santorum lost by a landslide 17.36% margin; only the reddest counties supported him:

Photobucket

Although they cover a lot of land, not all these counties are rural enclaves of Pennsyltucky (if they were all rural, Senator John Kerry would have won by double-digits in the state). In fact, fast-growing exurbs constitute a substantial source of Republican votes. Located east of the Philadelphia metropolis, these are somewhat wealthy and mostly white. They include Lancaster County (where Bush won 65.80% of the vote) and York County (where he won 63.74%); the former president came out of these two counties with a 121,832 margin, enough to offset Pittsburgh, Erie, and Scranton.

Erie and Scranton both constitute solidly blue areas belonging to “the T.” They give lie to the myth that all Pennsyltucky votes loyally Republican. Like the southwest, Erie and Scranton contain a number of working-class Democrats; unlike the southwest, however, cultural appeals have not swayed these folk into voting Republican.

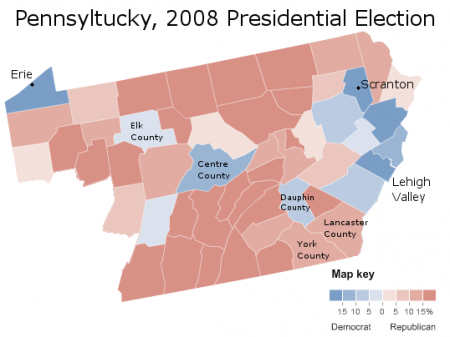
Indeed, Democrats do respectably in many parts of Pennsyltucky. Here is President Barack Obama’s performance:

Photobucket

Mr. Obama did not just win Erie and Scranton; he took several other counties and ran closely elsewhere. These included Centre County, home to Pennsylvania State University, and Dauphin County, which has a relatively high black population. All the Lehigh Valley – somewhat an extension of Philadelphia’s suburbs – voted for the president. More surprisingly, Obama ran very closely in several rural, lily-white regions of the T; one such county (Elk) even gave the president a 4% margin of victory.

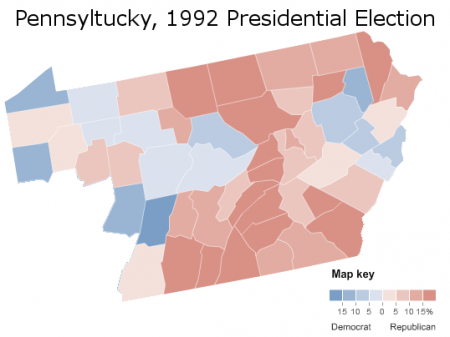
Obama was not the only Democrat to do well in parts of Pennsyltucky. Here is how former president Bill Clinton performed:

Photobucket

Mr. Clinton, of course, was a fellow with immense appeal to so-called “red-necks.” Since his time, much of Pennsyltucky has moved to the right. Yet not all of it is deep-red: while some counties gave Mr. McCain more than 70% of the vote, others – demographically identical – gave him barely more than 50%. These are substantial and curious variations.

While Pennsyltucky as a whole votes strongly Republican, it is wrong to generalize the area. Its most populous regions – the exurbs – constitute a vital part of the Republican coalition, while some rural counties have a fairly weak Republican habit. Finally, a number of places dependent upon industry routinely support Democrats. To stereotype the “T” as a composed solely of Republican-voting red-necks would do injustice to the region’s complexities.

(Note: All statistics come from http://uselectionatlas.org/ . Some pictures modified from the NYT.)

–Inoljt, http://mypolitikal.com/

Analyzing Swing States: Pennsylvania, Part 4

This is the fourth part of an analysis of the swing state Pennsylvania. It focuses on the industrial southwest, a once deep-blue region rapidly trending Republican. Part five can be found here.


Pittsburgh and the Southwest

Pennsylvania’s southwest has much in common with West Virginia and Southeast Ohio, the northern end of Appalachia. Electoral change in the region is best understood by grouping these three areas together as a whole.

Socially conservative (the region is famously supportive of the NRA) but economically liberal, the industrial southwest voters typify white working-class Democrats. These voters can be found in unexpected places: Catholics in Rhode Island and Massachusetts, loggers along the Washington coast, rust-belt workers in Duluth, Minnesota and Buffalo, New York.

It was President Franklin D. Roosevelt and the New Deal that brought the working-class to the Democratic Party; before his time, the party constituted a regional force confined mainly to the South. In Pennsylvania, a Republican stronghold that had voted for President Herbert Hoover, Mr. Roosevelt laid the foundations for a lasting Democratic coalition.

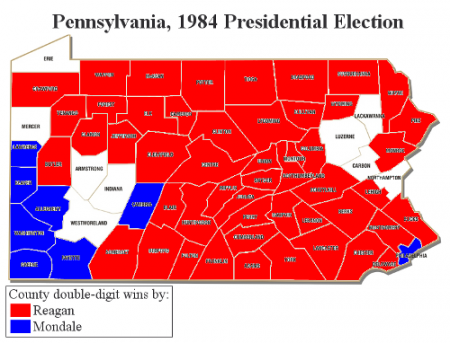
For decades, voters in southwest Pennsylvania constituted this coalition’s foundation. Take, for instance, Democratic nominee Walter Mondale:

Photobucket

In 1984, the industrial southwest, badly hurting from a receding recession, cast a strong ballot for Mr. Mondale. It did so again for Governor Mike Dukakis, and twice for President Bill Clinton.

Ironically, it was during the presidency of Mr. Clinton – a man much liked by Appalachia – that the Democrats became regarded as the party of the coasts and the elite. Ever since his time, Pennsylvania’s industrial southwest has been in a bad way for Democrats.

More below.

Thus, whilst metropolitan Philadelphia has been moving steadily left, Pittsburgh and the industrial southwest have been marching in the opposite direction.

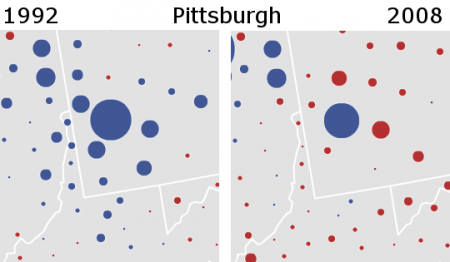
To get a sense of the movement in this region, compare these two maps:

Photobucket

In less than a generation’s span, one sees Democratic strength in northern Appalachia utterly vanish.

In a state where things have been going badly for Republicans, southwest Pennsylvania provides some consolation. Were it not for the southwest’s rightward trend, Pennsylvania would today be a fairly solid Democratic state.

Nevertheless, if I were to choose between Pittsburgh and the industrial southwest or Philadelphia and the suburban southeast, I would much prefer the latter. While Philadelphia itself is in declining, its metropolitan area as a whole has experienced rapid growth. The southwest’s population, on the other hand, remains basically stagnant, suffering the effects of economic decline.

In absolute terms, moreover, eastern Pennsylvania holds far more votes:

Photobucket

Republicans might take comfort in Allegheny County’s vote reservoir – were it not consistently blue. Indeed, Democratic strength in Pittsburgh ensures that, as a whole, the southwest will still vote Democratic for some time yet. Although – unique to practically every other major city – Republicans have been improving in Pittsburgh, its substantial black population limits their potential.

The puzzling thing, however, is why Appalachian working-class whites are moving so rapidly right. It cannot be simply race: both Vice President Al Gore and Senator John Kerry were white, after all, yet they still did progressively worse. It cannot be simply elitism, either: Governor Mike Dukakis and Governor Adlai Stevenson were intellectual technocrats, yet they won what Mr. Kerry and Mr. Gore could not.

Finally, it is not as if all the white working-class has suddenly turned Republican: voters in Michigan, northeast Ohio, upstate New York, and Silver Bow and Deer Lodge Montana, amongst other regions, still retain the Democratic habit. In Pennsylvania, working-class strongholds such as Scranton and Erie, surrounded by a sea of Republican counties, also continue to vote deep blue. They will be the topics of the next post.

–Inoljt, http://mypolitikal.com/

I’ve got a nasty little tidbit on a potential Arkansas Republican senate candidate.

Ok, this is going to be short, but a sweet little piece of gossip.  My boyfriend and I were just over at his two best friends’ house.  We got to talking politics and it turns out that one of them personally knows the mayor of Rogers, Steve Womack, who’s thinking about running against senator Blanche Lincoln.  According to him, “Steve is the man who once said he was going to ‘run all the n***ers, f*gs, and (something else, I forget what exactly as it was a little unusual sounding) out of my town’ in front of…(wait for it)…the city council meeting!”  So somewhere in the public record are some really nasty racist comments by a potential Republican senate candidate…boy I can’t wait for this to break!

Proposal For 2012 Primaries

From December 2007 to March 2008, I wrote various drafts of a proposal on how our political parties — starting in 2012 — might adopt primary election procedures that would better serve our country in selecting presidential candidates. I originally drafted a hypothetical calendar for 2008, based on general election results from 2004. Now that we have the results for 2008, I can now propose a calendar specific to 2012.

The system by which our parties choose their presidential candidates has proven itself to be, at best, highly questionable — at worst, severely flawed.

The primary calendar we need most is one that is built on an orderly and rational plan — one that is based on mathematics and on recent historical outcomes — and not on an arbitrary, publicity-driven, system of one-upsmanship. The change I propose would provide for a more effective, equitable process than the one we have now.

The following factors are the key ones to consider:

Margin of Victory

– The state primaries would be placed in order according to the leading candidates’ margins of victory in the preceding general election — with the states registering the closest margins of victory going first.

For example, John McCain won Missouri by 0.1% and Barack Obama won North Carolina by 0.4%; conversely, McCain won Wyoming by 33%, and Obama won Hawaii by 45%. Therefore, the primary calendar I propose would commence with primaries being held in states such as Missouri and North Carolina — and would close with such states as Wyoming and Hawaii.

– The purpose of ordering the states according to the margin of victory is to help the parties determine which candidates can appeal to those states that have found themselves most recently on the Electoral Divide. A narrow margin in the general election is reflective of an evenly divided electorate. In this scenario, a candidate who appeals to, say, Florida and Montana is more likely to appeal to a greater number of Americans on the whole.

Iowa, New Hampshire, and Fairness

– Iowa and New Hampshire might object to this new system, given their longstanding tradition of being the first states to cast their ballots. However, so long as Iowa and New Hampshire retain their record of being fairly bipartisan states, they’ll maintain their position towards the front of the primary schedule.

– Just because a state should have its primary later in the season does not mean that that state will prove invaluable to the process. Indiana and North Carolina weren’t held until May 6th, but those two states might have very well decided the fate of the 2008 Democratic nomination.

– This new system allows other states to play a greater role in how the parties select their candidates. For example, Missouri and North Carolina would be two of the states to get the limelight in 2012. Likewise, based on the results to come in November of 2012, a still-different slate of states could have a more significant role come 2016. A rotating system will be healthier and fairer.

Groupings of Five, and Timing & Spacing

– By placing states into groupings of five, no one state will be overly emphasized on any given date.

– Candidates will still need to address the concerns of individual states, whilst having to maintain an overall national platform. For example, a candidate will be less able to campaign against NAFTA in Ohio whilst campaigning for it in Florida.

– Given that each state has its own system for electing its delegates, these groupings of five states will act as an overall balancer. Ideally, caucuses will be done away with altogether by 2012. However — should that not happen — states with caucuses, states with open primaries, and states with closed primaries can all coexist within a grouping, therefore no one system will hold too much influence on any given date.

– Racial and geographic diversity in this process has been a great concern for many. The narrowest margins of victory in 2008 were in a wide variety of regions — the Midwest, the Great Lakes, the Mid-Atlantic, the South, and the West.

– All parties would have an interest in addressing these narrow-margined states early on. The incumbent will want to win over those states that were most in doubt of him in the previous election, and opposing parties will want to put forth candidates who have the best chance of winning over those very same states.

– Primaries will be held biweekly, giving candidates and the media enough time to process and respond to the outcomes of each wave of primaries.

– Washington DC will be placed in the same grouping as whichever state — Virginia or Maryland — is closer to its own margin of victory.

– American Samoa, Guam, Puerto Rico, and Americans Abroad — not having Electoral votes of their own — will determine their own primary dates, so long as they occur between the first grouping and the last grouping.

Under these guidelines, the proposed calendar for the 2012 primary season is:

January 2012

Tue, 1/10

Missouri

North Carolina

Indiana

Florida

Montana

Tue, 1/24

Ohio

Georgia

Virginia

Colorado

South Dakota

Tue, 2/7

North Dakota

Arizona

South Carolina

Iowa

New Hampshire

Tue, 2/21

Minnesota

Pennsylvania

Texas

Nevada

West Virginia

Tue, 2/26

Mississippi

Wisconsin

New Jersey

New Mexico

Tennessee

Tue, 3/6

Kansas

Nebraska

Oregon

Kentucky

Michigan

Tue, 3/20

Washington

Maine

Louisiana

Arkansas

Alabama

Tue, 4/3

Connecticut

California

Illinois

Delaware

Maryland

Washington DC

Tue, 4/17

Alaska

Idaho

New York

Massachusetts

Rhode Island

Tue, 5/1

Utah

Oklahoma

Wyoming

Vermont

Hawaii

KS-Sen: Poll Shows Moran in Comanding Lead in GOP Primary

(Cross-posted from Kansas Jackass

Two bits of news out of the Republican Primary for the United States Senate seat Sam Brownback is vacating in 2010.

First, Congressman Todd Tiahrt announced the formation of his campaign steering committee.  It includes such Republican notables as State Representatives Kasha Kelly, Lance Kinzer, and Peggy Mast, along with former Speaker of the Kansas House Doug Mays, and Sharon Meissner, who we surmise is the wife of twice-failed Kansas State Board of Education candidate Dr. Robert Meissner.

Lovely, right?  I do appreciate they sent the press release directly to the blog, though.

In the news that actually matters, the Washington Post is today reporting a poll commissioned for the campaign of Congressman Jerry Moran includes much better news for him than it does good ol’ Todder.

Rep. Jerry Moran starts as the frontrunner for the GOP Senate nod in Kansas, according to new polling done for his campaign. Moran, who has held the massive central-western 1st district since 1996, holds a 41 percent to 25 percent edge over fellow Rep. Todd Tiahrt in a poll conducted by Glen Bolger of Public Opinion Strategies.

“While it is still very early in the primary campaign, it is currently a lot better to be Jerry Moran than it is to be Todd Tiahrt,” Bolger wrote in the polling memo.

I’m sure people will read that and scream, “But it was a internal poll, so it’s just bullshit.”  While I’m sure campaign-released polls always only include selective information (like, for instance, we bet Moran isn’t telling anyone who he matches up against Gov. Kathleen Sebelius…), just because it’s an internal poll doesn’t immediately make it invalid.  A polling firm won’t get much work if their poll are routinely proven wrong in the press.

So, there you go- while Tiahrt’s busy naming his committee, Moran’s busy winning the election.  Long way ’til August 2010, but the pollster is right- I’d much rather be Jerry Moran today.