Why Pennsylvania Matters So Much

Pennsylvania, my home state, will see a lot of big races in 2010. We are electing a new Governor – electing new members of Congress from vacant seats, have a Senate election, and progressive Democrats need to win in the State House and Senate races (We have a very un-progressive Republican state Senate, the only Republican chamber left in the Northeast). It is CRITICAL that the netroots and the grassroots and all of the progressives come together and focus on PA…it's very important.

Please read on to learn more about our 2010 races!

Pennsylvania has been a swing state for some time now so what happens here is VERY IMPORTANT nationwide.

U.S. Senate

Democrats have both Senate seats for the first time since 1968 (okay, January 1969) thanks to the Specter Switcheroo.

Pat Toomey is Rick Santorum 2.0, and he MUST NOT become our new Senator. Arlen Specter or Joe Sestak MUST win.

Our Senate race is very important and has NATIONAL IMPLICATIONS, especially since Arlen Specter is known throughout the country for his switch to the Democratic Party. If Senator Specter wins his primary, we must vigorously support his re-election, no matter what.  So that means no more of the Snarlin' Arlen comments!

The U.S. House

The House delegation has gone from 12-7 Republican to 11-8, with four Democratic pickups (The biggest Democratic sweep in ANY state in 2006- no other state had more than 3 pickups).  In 2008, Democrat Kathy Dahlkemper won in PA-3 (the Erie district) and now we are at 12-7, a complete reversal of pre-2006.

We want to make sure Democrats continue to stay on a roll.

PA-15

My Congressional district of PA-15 is going to be one of the most important races in the country (to me, THE most important House race and a bellwether for the entire nation). Charlie Dent, Republican, has had a VERY easy time winning here despite a prO-bama majority. Mayor John Callahan of Bethlehem is running for the Democratic nomination.  We must make him Congressman. Plus, if you ask me, he's kinda cute (-:

 Mayor Callahan's Campaign Site (Very new)

PA-8

Jim Gerlach is running in the Republican primary for Governor and we have (so far) Doug Pike, who I don't know much about but will support if he is the Democrat.  I think this is VERY winnable.  If Gerlach loses, I'm not so sure he can get back into the race.  Curt Schroder is already running.  A Pike victory will mean A LOT on Election Day since it is expected the Republicans will narrowly hold onto this seat in the Philly suburbs.  It's an Obama district though.

Governor's Race

We also have to watch the Governor's race- most likely it will be between Jack Wagner and Tom Corbett.  Ed Rendell will not have very good approval ratings which will bode poorly for the Democrat but hopefully Jack Wagner (or Dan Onorato from Pittsburgh) will run a top-notch campaign and really narrow that gap in the last few weeks.  My mind says Corbett though.  Please let me wrong.

State Senate

We have a ridiculous 30-20 Republican majority in the State Senate and it keeps getting bigger by the day, so to turn it blue we'll need SIX MAGIC SEATS to take it back (I'm assuming Democrats had control of it at one point).

We will have 25 chances to win the Senate (half of it is up for election in 2010) and most of these will remain the same, however…judging from previous election results, I see these six Republican seats as the most vulnerable (Keeping in mind that they were all last up in 2006, a Democratic year):

SD 6 – held by Robert Tomlinson (R), last won by 53.4%

SD 10 – held by Chuck McIlhinney (R), won by a measly 51.5% against Democrat Chris Serpico

SD 12 – held by Stewart J. Greenleaf (R), won by 57.4%

SD 16 – held by Pat Browne (R), won by 54.2%

SD 24 – Bob Wonderling (R), won by 56.5%

SD 26 – Edwin Erickson (R), won by 52.2% (his challenger in '06 was Mike Farrell)

SD 34 – Jacob Corman (R), won by 56.0% (but Democrat Jon Eich only got 39.1%)

SD 44 – John Rafferty (R), won by 56.2%

SD 50 – Bob Robbins (R), won by 53.5% (challenger was Art Allen)

 The good news is that all of the Democratic seats will likely, barring any unusual events, be safe so we can focus on these nine seats, which are ripe for a takeover.

 State House

Democrats hold onto a 104-99 majority.  It's clearly not a safe majority.

All of the 201-or-some House seats are up and there are a lot of opportunities to pick off some of these Republicans, so let's go through the seats where the Republican won by less than 60%:

HD 15 – Jim Christiana, 51.5%

HD 26 – Tim Hennessy, 52.1%

HD 57 – Tim Krieger, 51.7%

HD 75 – Matt Gabler, 52.8%

HD 128 – Sam Rohrer, 52.2%

HD 142 – Frank Farry, 51.7%

HD 146 – Thomas Quigley, 53.4%

HD 187 – Gary Day, 52.3%

If we win all of these eight seats (a nice goal), and keep onto our close seats, we will have a 112-91, which will be a significant improvement.

Worst Case Scenario

If the Republicans win PA big, we will have:

U.S. Senator Pat Toomey (formerly the president of right-wing Club for Growth and you can just imagine those tax breaks for the rich)

Governor Tom Corbett replacing the fairly progressive Ed

A 30-20 Republican Senate (I sincerely doubt they'll win any Democratic seats)

A Republican State House (which will pass an anti-gay marriage amendment to the Constitution, at top of their to-do list when they retake the House)

The loss of Democrats Paul Kanjorski (he barely won last time around), Jason Altmire (represents a very conservative district), Chris Carney (representing an even more conservative district), freshman Rep. Kathy Dahlkemper, Republican victories in the 6th and 15th, which will give the Republicans a pickup of FOUR seats…which would undo the results of 2006, and perhaps if Joe Sestak runs for the Senate and abandons his House seat they will have FIVE seat pickups.

So as you can see the stakes cannot be higher here in the Keystone State.

By what margin will Bob Shamansky win?

View Results

Loading ... Loading ...

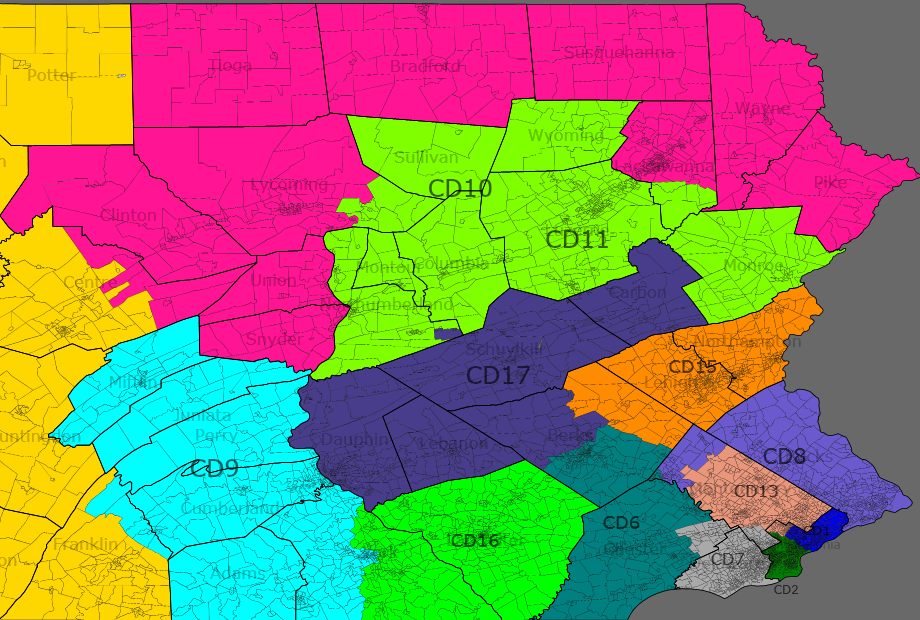
Pennsylvania Democratic Gerrymander

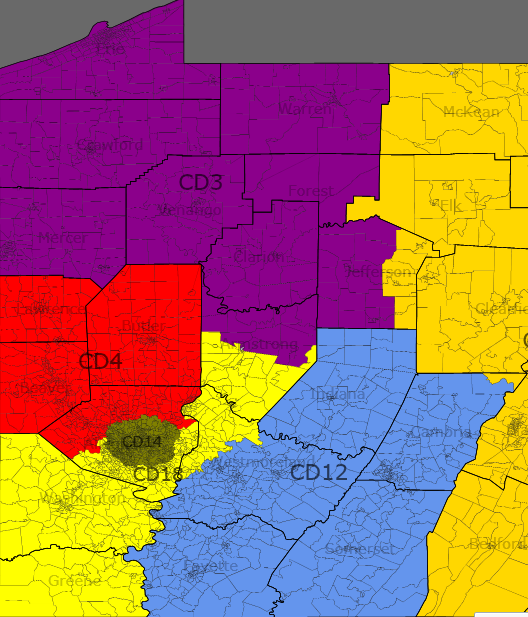
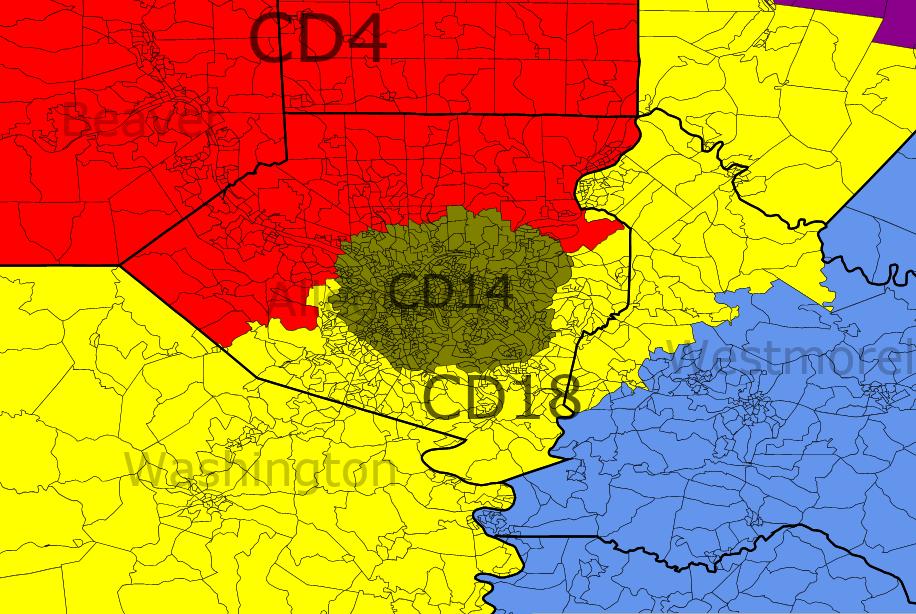
Here is another Democratic gerrymander, this time in Pennsylvania. I am not sure if we can pick up the entire legislature and retain the governorship. If we did, they would probably try to protect new Democrats instead of heading for an all out gerrymander. In my opinion, my map is not too realistic but just in case the Democrats have total control…. This map protects new Democrats while eliminating one Republican seat and endangering the incumbents of two others. I eliminated Charlie Dent’s seat assuming he survives 2010.I am aiming for a 14-4 Democratic delegation as a revenge for the planned 13-6 Republican delegation. My only worry for the Democrats is the 11th district with Paul Kanjorski but even there he should be safe. Here are the maps.

East Pennsylvania

East Pennsylvania

West Pennsylvania

West Pennsylvania

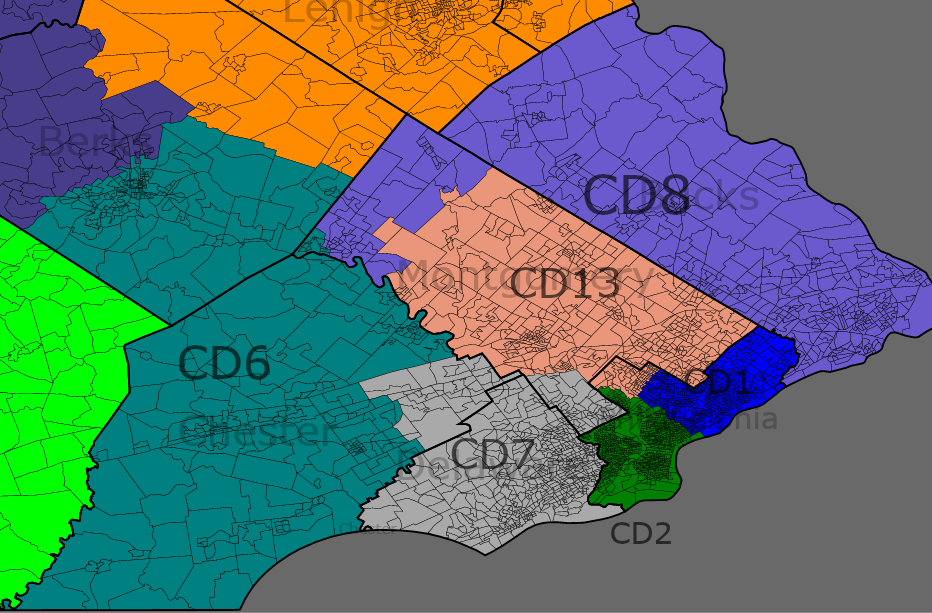
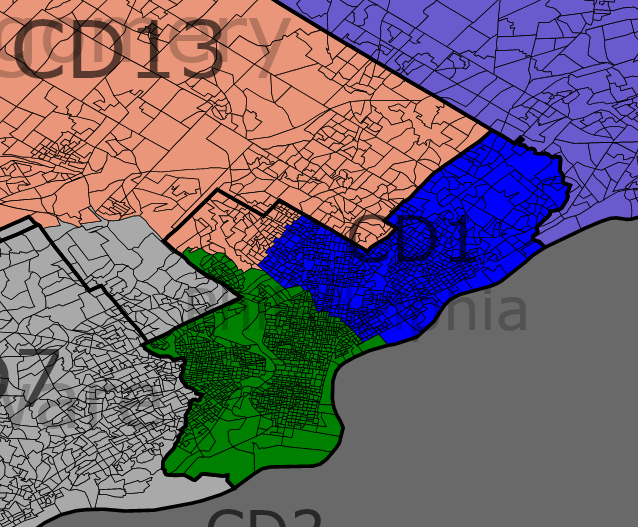
Philadelphia Area

Philadelphia Area

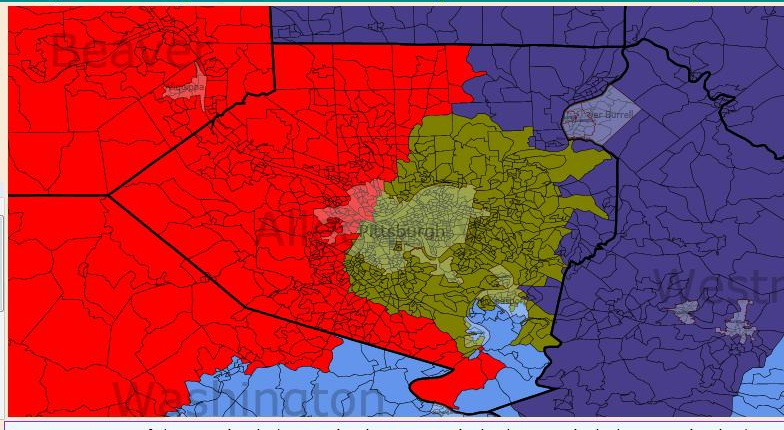
Pittsburgh Area

Pittsburgh Area

District 1 Robert Brady (D) Dark Blue

Robert Brady’s district was safe with the old map and will remain safe this time, even though his district is less safe. I removed some African American areas in western Philadelphia and Delaware County. I added some white parts of Delaware County but they should not affect the voting habits of this district much. Obama probably won 73% of the vote here. Racial stats are 19% African American, 18% Hispanic, 6% Asian and 53% White. Status is Safe Democrat.

District 2 Chaka Fattah (D) Dark Green

For population purposes, I had to send this district up into some white parts of Montgomery County but that should not alter the voting of this district. It stays mostly the same. Obama probably won 85% of the vote here. Racial stats are 58% African American and 32% White. Status is Safe Democrat.

District 3 Kathy Dahlkemper (D) Dark Purple

I was worried about her because she is a freshman. To protect her, I removed all of heavily Republican Butler County and substituted it with some marginal territory along the border. I extended it into the middle of the state to pick up Elk County which Obama barely won. I probably raised Obama’s performance to 53%. She should be safe without a strong challenge. Racial stats are 92% White. Status is Likely Democrat.

District 4 Jason Altmire (D) vs. Tim Murphy (R) Red

To strengthen Altmire, I removed all of Butler County and added some of marginal Washington County. I slipped in some precincts in Pittsburgh as well. He appeared safe in 2008 and he should be even safer. Murphy will probably run in the heavily Republican 17th district so Altmire should not worry. McCain probably won 50% of the vote here. Racial stats are 5% African American and 91% White. Status is Likely Democrat.

District 5 G.T Thompson (R) Yellow

I made this district more Republican to strengthen Democrats in the 3rd and 10th districts. This district basically goes further east, loses Penn State and stays heavily Republican. McCain probably won 63% of the vote here. Racial stats are 95% White, the whitest district in Pennsylvania. Status is Safe Republican.

District 6 Open (Gerleach) (R) Teal

Trust me; this district is not electing a Republican anytime soon. With Gerleach out, this new district would oust any Republican who might have won in 2010. That will probably not be necessary because the Democrats have some good candidates here. The changes I made were removing most of Chester County while giving the district more of Montgomery County. For good measure, 9% of the district is in Philadelphia. The part it has is 75% African American. I see almost no way for a Republican to win here. Obama probably won 64% of the vote here. Racial stats are 13% African American and 78% White. Status is Safe Democrat.

District 7 Open Joe Sestak (D) Gray

I’m a bit worried about this district because I had to extend it all the way out into Republican areas in Lancaster County. I definitely offset Republican margins from Lancaster by putting in heavily African American parts of Philadelphia in this district. Since Chester County is trending Democratic, this district should stay with the Democrats. Obama probably won 57% of the vote here. Racial stats are 14% African American and 77% White. Status is Safe/Likely Democrat.

District 8 Patrick Murphy (D) Light Purple

All I did here was help shore up Murphy by putting in more of Philadelphia which is now 22% of the district’s population. I also removed part of northern Bucks County. Murphy should be fine now. Obama probably won 57% of the vote here. Racial stats are 86% White. Status is Safe Democrat.

District 9 Bill Shuster (R) Bright Blue

I kept the district pretty much the way it is. All I did was move it east so that it is only a few miles away from Harrisburg. I took in Snyder and Union Counties to help strengthen Chris Carney. Anyway, Shuster is safe in the most Republican district in Pennsylvania. McCain probably won 65% of the vote here. Racial stats are 94% White. Status is Safe Republican.

District 10 Chris Carney (D) Pink

If Chris Carney does not represent this district, he probably lost in a primary, retired or the Republicans found the strongest candidate possible. I took out all the heavily Republican western counties and snaked the district into Northampton County (Bethlehem) and Monroe County which voted for Bush but McCain lost it by 17 points. The rural counties to the north lean Republican but they only gave McCain a combined 6,000 vote margin. The only worry I have is that Dent will run but the Democratic margins from Lackawanna, Luzerne and Monroe Counties should offset Dent’s margins from his old district. With the inclusion of most of Lackawanna County are more of Luzerne, Carney is safe. Obama probably won 55% of the vote here. Racial stats are 87% White and 5% Hispanic. Status is Safe Democrat, Likely Democrat if Dent runs.

District 11 Paul Kanjorski (D) Light Green

I am a bit worried about Kanjorski. I had to shore up other Democrats so he lost a few Democratic areas. I tried to help him by sending his district into Lehigh County (Allentown) which Obama won by 15 points. Republican Charlie Dent who represents the 15th district in Allentown may want to run here. Kanjorski had a tight race in 2008 but if he loses, a strong Democrat will probably beat the Republican who won it. Obama probably won 56% of the vote here. Racial stats are 84% White and 9% Hispanic. Status is Lean Democrat.

District 12 John Murtha (D) Indigo

Due to calling his constituents “racists,” Murtha had a ‘tough’ race in 2008 but won by 16 points. The Republicans probably will challenge him again. I’m not the biggest fan of John Murtha myself but we need as many Democrats as possible and a safe district when he retires. To shore him up, I removed all of Armstrong County and part of Westmoreland County. I added in a slice of Alleghany County, all of marginal Fayette County and Penn State. Murtha should be happy. Obama probably won 52% of the vote here. Racial stats are 92% White. Status is Safe Democrat.

District 13 Allyson Schwartz (D) Tan

I had to change Schwartz’s district quite a bit. First, I took out much of Philadelphia and replaced it with part of Bucks and Northumberland Counties. Since those areas both voted Democratic, Schwartz should be safe. She should worry about a primary challenge from the Bethlehem area but her Philadelphia base should probably keep her in Congress. Obama probably won 58-59% of the vote here. Racial stats are 7% African American, 6% Hispanic and 80% White. Status is Safe Democrat.

District 14 Mike Doyle (D) Algae Green

To help protect Altmire, I had to remove the western part of Pittsburgh from this district and substitute it with more Conservative suburbs to the north and south. They should not be nearly enough to endanger Doyle, he appears safe. Obama probably won 65% of the vote here. Racial stats are 19% African American and 74% White. Status is Safe Democrat.

District 15 Tim Holden (D) Orange

Even though Holden seems pretty safe (he won by 28 points in 2008,) I figured that the Republicans would eventually field a strong candidate against him. To help Holden, I added part of Allentown and removed part of Republican Lebanon County. Holden should have no problem at all now that his district is more Democratic. If Charlie Dent ran here, he would probably lose. Obama probably won 51%-52% of the vote here. Racial stats are 7% African American and 5% Hispanic. Status is Safe Democrat.

District 16 Joe Pitts (R) Light green (in Lancaster County)

I am not completely sure if we can knock off Pitts but we definitely have a good shot at it. I removed some of the rural areas in Lancaster County making the district more centered on the city Lancaster. Even though I included part of Republican Lebanon County, I added more of Democratic Reading. The final blow to Pitts is that even though he loses part of Democratic leaning Chester County, he gets heavily Democratic areas in Delaware County and even a couple of precincts in Philadelphia. This should attract some Delaware County Democrats to run. It should be a tight race because Pitts is pretty entrenched yet his margins are dropping. Obama probably won 52% of the vote here. Racial stats are 9% African American, 14% Hispanic and 73% White. Status is Toss Up.

District 17 No Incumbent (R) Dark Purple

If I were Tim Murphy, I would move to this district and run here. It contains part of his old district and takes in the heavily Republican areas of Butler and Armstrong Counties. Other Republicans will probably aim for this seat but Murphy should probably beat them. McCain probably won 61% of the vote here. Racial stats are 95% White. Status is Safe Republican.

District 18 Todd Platts (R) Yellow (on the southern border)

This district stays basically the same. All I changed was that I shrank the district and added some rural areas in Lancaster. Platts is fine. McCain probably won 59% of the vote here. Racial stats are 89% White. Status is Safe Republican.

By what margin will Bob Shamansky win?

View Results

Loading ... Loading ...

Rust Belt Redistricting Musings

The following are my thoughts on redistricting each of the Midwestern states-from Iowa and Missouri to Western Pennsylvania. I think in general, things look good for Dems right now, with the exceptions of Indiana and Missouri. But read on and tell me what you think.

In alphabetical order

Iowa

I think that in some ways, Iowa is the most predictable state because of the way they redraw their lines. You know that there will be a Democratic leaning 1st District in the northeast, a stronger Democratic 2nd in the southeast part, a Polk County/Des Moines based 3rd, and Steve King’s wingnut friendly 4th in the Western part of the state.

Indiana

With the GOP likely to run remap here, the consensus is that they’ll target Baron Hill by stripping him of Bloomington. I think that’s potentially dangerous, as neither Buyer or Burton are good campaigners. Furthermore, I think Baron Hill would be a great candidate for Governor, so the Indiana GOP better be careful what it wishes for……

Illinois

Two thoughts: if Kirk runs for Senate and we win his 10th (or if we win it outright), I’m guessing the ultimate target would be Judy Biggert, who’s older and less politically talented than Roskam. The best bet might be to pair them together in an ultra GOP DuPage based district and use the Dem leftovers with parts of say, the 9th to create a new Dem district.

Now my evil little thought: I wonder if we could create a Democratic leaning monstrosity with the most Democratic friendly parts of Rockford, Peoria, Champaign/Urbana, and Springfield. Yeah it’d be ugly, but so is Phil Hare’s 17th…..

Michigan

In Michigan, if Dems run remap, there are several ways to go with it. My guess is that they would draw Thad McCotter into an Ann Arbor based district that he couldn’t win-that’s by far the easiest. I also think they’ll. The other thing they should do is draw a Lansing based Democratic District drawn for Virg Bernero and give the GOP parts of the 8th to Candice Miller and pack all of the GOP’s Southeast strongholds into a single district. I suppose there’s also the outside possibility of a Dem Western district that combines the city of Grand Rapids with some of the Dem leaning counties on Lake Michigan, but I’m not sure Vern Ehlers wouldn’t win that anyways….

Minnesota

Regardless of whether the state ends up with 7 or 8 CDs, the objective of Minnesota’s redistricting plan (if Dems control, and I think they will) will be to get rid of Michele Bachmann. The only difference being how you do it. If there are 8 CDs, you simply draw a 6th that is is close to even and friendly to State Senator Tarryl Clark. If there are 7, slam her into an uber-GOP (Sherburne, Wright, Carver,Scott and the most GOP friendly parts of Dakota, Anoka, and Hennepin)  district with John Kline.

The big question here in either case is whether the DFL goes after the 3rd by swapping some of the more Democratic suburbs like St. Louis Park and Hopkins for GOP friendly stuff like Edina.

Missouri

Dems have to pray that Missouri holds onto its 9th CD so they can simply play incumbent protection and draw a more friendly 4th CD along the I-70 corridor from KC to Boone County. If Missouri goes to 8, I’m almost certain that Skelton’s district is toast.

Ohio

If Dems control redistricting and Ohio loses 2 seats, here’s some possibilities

-The basic premise is to pack the GOPers into 4 ultra GOP districts: the 4th, 5th, 7th and 8th while creating a Dem Dayton district, cracking the 14th into 3, and the 2nd into 3 parts plus creating a Democratic leaning mashup of the 18th and 12th designed for Zack Space.

-Create a Democratic 3rd by combining Montgomery County with Oxford and the most Dem friendly turf you can find in Greene.

-Eliminate Jean Schmidt’s 2nd with the Dem parts of Hamilton going to the 1st, the GOP suburban stuff splitting between the 7th and 8th CDs and the Dem leaning Ohio River Counties into the 6th.

-Drop the GOP parts of the 15th into the 4th, 5th, and 7th and pick up Dem friendly turf in Franklin. However be careful because….

-To protect Zack Space, try and take what’s left of Franklin and mate it to the friendliest portions of the 18th while dropping as much of the GOP stuff into the 7th as possible.

-Finally, crack Steve LaTourette’s 14th into 3 between Marcia Fudge’s 10th (as much of Geauga  as you can get away with), Tim Ryan’s new district (which would be something like half of Lake and what’s left of Geauga, Astabula, Trumbull and the most Dem parts of Mahoning with some Dem strength going to Boccieri in the 16th), Finally, put the other half of Lake into Kucinich’s 10th by connecting it along Lake Erie.

Pennsylvania

As I remarked in another diary, Tim Murphy is almost certainly toast because the map is likely to be redrawn by a judge due to the split in the state legislature. Flat out, there is no way that any sane judge would draw something similar to Murphy’s one step short of fictitious 18th CD that he has now. He’ll either wind up running against Murtha (and will lose) or will end up in something similar to Frank Mascara’s old 20th (which he’d lose as well).

Wisconsin

I think the best target for Wisconsin Dems, should they control the trifecta, would be to go after Paul Ryan rather than Tom Petri-its much easier to play mix and match with the heavily Democratic 2nd and 4th than it is with Petri’s 6th. Ryan’s also waaaay to conservative for his district as it is, and Petri is something of an institution in his district anyways, even if on paper it is slightly more Democratic.

Redistricting Pennsylvania

*** Update July 7: Now I have all precinct data, PVI calculations are complete. ***

Pennsylvania is expected to lose a district so it will have 18. My goals are:

– Make districts that look fair, even if they’re not.

– Keep communities together

– Try not to screw over any incumbent Democrats

– Put Democratic territory in Democratic districts

– Anticipate future voting trends

Here is my redistricting plan:


Click on the image for a full size screenshot.

Philadelphia closeup:

1st District (old 1st) D+21

“The Eastern Philadelphia district”

Incumbent: Bob Brady (D)

The first district has been shifted east. It is now 51% white, 21% black, 6% Asian and 20% Hispanic. It gave 73.59% of its vote to Obama, making it D+21. The old 1st is D+35.

County #Obama #McCain %Obama %McCain
Philadelphia (pt) 223428 77797 73.59% 25.62%

2nd District (old 2nd) D+40

“The Western Philadelphia district”

Incumbent: Chaka Fattah (D)

The second district is now 24% white, 67% black, 5% Asian and 3% Hispanic. It gave an incredible 93.03% of its vote to Obama, making it D+40. The old 2nd is D+38. It will be the third most Democratic district in America, behind only NY-15 and NY-16, and tied with Washington DC.

County #Obama #McCain %Obama %McCain
Philadelphia (pt) 341893 24374 93.03% 6.63%

3rd District (old 7th) D+9

“The Delaware County district”

Incumbent: whoever succeeds Joe Sestak in 2010

This district has been made more Democratic. It takes up all of Delaware County, the rest of Philadelphia, and a small amount of Montgomery.

County #Obama #McCain %Obama %McCain
Delaware 178870 115273 60.22% 38.81%
Montgomery (pt) 37275 17659 67.45% 31.95%
Philadelphia (pt) 30659 15050 66.38% 32.58%
Total 246804 147982 61.94% 37.14%

4th District (old 13th) D+6

“The Montgomery district”

Incumbent: Allyson Schwartz (D)

This district is now entirely within Montgomery County.

County #Obama #McCain %Obama %McCain
Montgomery (pt) 215206 147338 58.85% 40.29%

5th District (old 8th) D+1

“The Bucks district”

Incumbent: Patrick Murphy (D)

By removing its territory from Philadelphia and Montgomery and adding territory from Lehigh and Northampton the district becomes a little less Democratic. It stops short of Allentown and Bethlehem but takes Easton from the Dent district. Patrick Murphy should be safe.

County #Obama #McCain %Obama %McCain
Bucks 179031 150248 53.78% 45.13%
Lehigh (pt) 6770 7463 47.02% 51.84%
Northampton (pt) 11346 7145 60.55% 38.13%
Total 197147 164856 53.86% 45.04%

6th District (old 16th) D+1

“The Chester district”

Incumbent: Joe Pitts (R)

The current district takes all of Lancaster County and some of Chester. In this plan it takes all of Chester and some of Lancaster, including the city. Chester is the more Democratic county, so this shift makes it more Democratic. Joe Pitts may be able to win this district but after he retires a Democrat should win it.

County #Obama #McCain %Obama %McCain
Chester 137833 114421 54.19% 44.98%
Lancaster (pt) 38485 35210 51.78% 47.37%
Total 176318 149631 53.64% 45.04%

7th District (old 6th, sort of) R+5

“The Reading district”

Incumbent: whoever succeeds Jim Gerlach in 2010

My ideal scenario: Jim Gerlach runs for higher office and a Democrat from Berks County wins the open 6th district in 2010. This Democrat becomes popular quickly and easily wins the more Republican district in 2012. Over time Berks trends more Democratic and Lancaster trends more moderate.

My less ideal scenario: A Republican wins it in 2010, or Jim Gerlach stays, so we make it more Republican.

It is made of almost all of Berks, most of Lancaster, and a tiny amount of Montgomery.

County #Obama #McCain %Obama %McCain
Berks (pt) 92672 73890 54.89% 43.77%
Lancaster (pt) 61101 91358 39.73% 59.40%
Montgomery (pt) 912 555 61.17% 37.22%
Total 154685 165803 47.72% 51.15%

8th District (old 15th) D+4

“The Allentown district”

Incumbent: Charles Dent (R)

The district loses territory from its southeastern border to the Murphy district, and gains most of Monroe County. This shift makes it more Democratic.

County #Obama #McCain %Obama %McCain
Lehigh (pt) 80319 55919 58.17% 40.50%
Monroe (pt) 30676 23064 56.48% 42.47%
Northampton (pt) 63909 51366 54.71% 43.97%
Total 174904 130349 56.57% 42.16%

9th District (old 19th) R+10

“The York district”

Incumbent: Todd Platts (R)

Because of its fast population growth, the district loses some area. It is still strongly Republican.

County #Obama #McCain %Obama %McCain
Adams (pt) 13783 19866 40.49% 58.36%
Cumberland (pt) 42156 54258 43.23% 55.65%
York 82839 109268 42.65% 56.26%
Total 138778 183392 42.60% 56.30%

10th District (old 17th) R+5

“The Harrisburg district”

Incumbent: Tim Holden (D)

This district is still based in Harrisburg. It loses strongly Republican territory in Perry County and gains strongly Republican territory in Northumberland and Montour Counties. Tim Holden keeps getting reelected despite the Republican lean of the district so he should be able to continue. Northumberland and Montour are currently in the Carney district so they are used to having a Democratic Congressman. It is only 0.18% more Republican than before.

County #Obama #McCain %Obama %McCain
Berks (pt) 4375 6623 39.15% 59.27%
Columbia (pt) 5862 4847 53.62% 44.34%
Dauphin 69975 58238 54.02% 58.86%
Lebanon 23310 34314 39.98% 58.86%
Montour 3364 4574 41.93% 57.01%
Northumberland 14329 19018 42.22% 56.04%
Schuylkill 28300 33767 44.88% 53.55%
Total 149515 161381 47.47% 51.24%

11th District (old 11th) D+3

“The Scranton district”

Incumbent: Paul Kanjorski (D) or his successor

The district now includes all of Lackawanna and Luzerne Counties.

County #Obama #McCain %Obama %McCain
Carbon 13464 12957 50.01% 48.13%
Columbia (pt) 7401 9600 42.67% 55.37%
Lackawanna 67520 39488 62.59% 36.60%
Luzerne 72492 61127 53.63% 45.22%
Monroe (pt) 8777 5229 62.11% 37.00%
Wyoming 5985 6983 45.55% 53.15%
Total 175639 135384 55.83% 43.04%

12th District (old 10th, and most of 5th) R+8

“The northern district”

Incumbent: Chris Carney (D)

The district takes all of the New York border except Erie County, and it extends south into Centre County. In 2008 Carney was reelected by a comfortable margin and this proposed district is 0.12% more Democratic. I expect northern Pennsylvania will eventually become more Democratic, like Upstate New York. Giving them a Democratic Congressman should speed up the trend. One problem is Glenn Thompson, Republican Congressman from the 5th District, lives in Centre County. He should run in the new 14th.

County #Obama #McCain %Obama %McCain
Bradford 10306 15057 39.97% 58.39%
Cameron 879 1323 39.15% 58.93%
Centre 41950 32992 55.37% 43.55%
Clinton 7097 7504 47.98% 50.73%
Elk 7290 6676 51.08% 46.78%
Forest 1038 1366 42.47% 55.89%
Lycoming (pt) 17163 27587 37.91% 60.94%
McKean 6465 9224 40.54% 57.84%
Pike 11493 12518 47.33% 51.55%
Potter 2300 5109 30.64% 68.06%
Sullivan 1233 1841 39.52% 59.01%
Susquehanna 8381 10633 43.46% 55.13%
Tioga 6390 11326 35.53% 62.98%
Warren 8537 9685 46.10% 52.30%
Wayne 9892 12702 43.32% 55.63%
Total 140414 165543 45.29% 53.39%

13th District (old 9th) R+19

“The south-central district”

Incumbent: Bill Shuster (R)

It’s more compact than before, and shifted a little bit east. This is the northern Bible Belt. At R+19 there are only a small handful of districts in America that are more Republican.

County #Obama #McCain %Obama %McCain
Adams (pt) 3850 6483 36.83% 62.02%
Bedford 6059 16124 27.00% 71.84%
Blair 19813 32708 37.31% 61.59%
Cumberland (pt) 6150 9471 38.95% 59.99%
Franklin 21169 41906 33.26% 65.85%
Fulton 1576 4642 24.99% 73.61%
Huntingdon 6621 11745 35.54% 63.04%
Juniata 3068 6484 31.59% 66.77%
Lycoming (pt) 1218 2693 30.72% 67.92%
Mifflin 5375 10929 32.57% 66.23%
Perry 6396 13058 32.39% 66.13%
Snyder 5382 9900 34.77% 63.96%
Somerset (pt) 5323 11473 31.21% 67.27%
Union 7333 9859 42.14% 56.66%
Total 99333 187475 34.23% 64.60%

14th District (parts of the old 5th, 12th and 9th) R+10

“The Johnstown district”

Incumbent: Glenn Thompson (R) [from Centre County]

I’ve been told this area would elect a Democratic Congressman despite its Republican PVI because it’s historically Democratic. I’ll believe it when I see it. This will be the whitest district in PA at 96.1%.

County #Obama #McCain %Obama %McCain
Cambria 32451 31995 49.42% 48.72%
Clearfield 14555 18662 43.05% 55.19%
Fayette (pt) 7274 10319 40.84% 57.94%
Indiana 17065 19727 45.75% 52.88%
Jefferson 3068 6484 31.59% 66.77%
Somerset (pt) 7555 10213 41.71% 56.38%
Westmoreland (pt) 41679 61144 40.07% 58.79%
Total 123647 158544 43.17% 55.35%

15th District (parts of the old 3rd and 4th) R+13

“The Butler district”

Incumbent: Tim Murphy (R)

Tim Murphy (R) lives in the 17th and Jason Altmire (D) lives in the 15th. They should trade districts.

County #Obama #McCain %Obama %McCain
Allegheny (pt) 62879 80564 43.48% 55.71%
Armstrong 11138 18542 37.03% 61.64%
Butler 32260 57074 35.68% 63.12%
Clarion 6756 10737 38.03% 60.44%
Venango 9238 13718 39.64% 58.66%
Westmoreland (pt) 16670 22239 42.44% 56.62%
Total 138941 202874 40.22% 58.72%

16th District (old 14th) D+14

“The Pittsburgh district”

Incumbent: Mike Doyle (D)

The district gets bigger because the Pittsburgh area lost population. I shifted it east so the Altmire district could get some more Democratic towns along the Ohio River.

County #Obama #McCain %Obama %McCain
Allegheny (pt) 225371 107892 66.97% 32.06%

17th District (parts of the old 12th and 18th) R+3

“The southwest district”

Incumbent: Jason Altmire (D) [assuming Murtha retires, or gets indicted]

This southwestern PA district is compact and Obama wins it. Yes it’s possible.

County #Obama #McCain %Obama %McCain
Allegheny (pt) 84521 83501 49.84% 49.23%
Beaver (pt) 14587 12626 52.91% 45.80%
Fayette (pt) 18592 15762 53.50% 45.36%
Greene 7829 7889 49.00% 49.38%
Washington 46122 50752 47.04% 51.76%
Westmoreland (pt) 6285 4989 55.23% 43.84%
Total 177936 175519 49.80% 49.12%

18th District (old 3rd) R+1

“The Erie district”

Incumbent: Kathy Dahlkemper (D)

Now it’s a proper Democratic Northwest PA district.

County #Obama #McCain %Obama %McCain
Beaver (pt) 25912 30269 45.52% 53.18%
Crawford 16780 20750 44.00% 54.41%
Erie 75775 50351 59.34% 39.43%
Lawrence 19711 21851 46.82% 51.90%
Mercer 26411 26565 49.07% 49.36%
Total 164589 149786 51.65% 47.00%

A “Fair” map of Pennsylvania

So, with the caveat that I don’t really believe that neutral redistricting is possible, I’ve redistricted my own state of Pennsylvania as I think it might appear if the legislature deadlocks and a Federal district court has to appoint a special master to draw the lines. There are 18k “missing” people in this map, which I assume is a software bug in Dave’s app. Anyway, without further ado. . .

Delaware Valley:

Delaware Valley

Philly:

Philly

Eastern PA:

Eastern PA

Central PA:

Central PA

Western PA:

Western PA

Pittsburgh:

Pittsburgh

PA-12: Murtha: “If I’m corrupt, it’s because I take care of my district.”

Mr. Murtha, a 76-year-old Marine veteran schooled in the blunt-knuckle deal-making that defined politics here, is contrition-free when it comes to his success.

“If I’m corrupt, it’s because I take care of my district,” Mr. Murtha said. “My job as a member of Congress is to make sure that we take care of what we see is necessary. Not the bureaucrats who are unelected over there in whatever White House, whether it’s Republican or Democrat. Those bureaucrats would like to control everything. Every president would like to have all the power and not have Congress change anything. But we’re closest to the people.”

Murtha’s remarks recall another one of CREW’s most corrupt lawmakers, Rep. Don Young (R-AK), who defended his controversial earmarks on the House floor in 2007. “I was always proud of my earmarks. I believe in earmarks, always have, as long as they are exposed. But don’t you ever call that a scandal,” said Young.

http://thinkprogress.org/2009/…

Anyone think this could cause him trouble in 2010?  I’m sure his district has known he was corrupt for a long time, but could this be the final straw?  I really wish he and Kanjorski would save us the trouble and retire in 2010.

Redistricting 2011: Penn. & Utah

Episode 6 in my redistricting series. By this point I’m tired of having these maps and data lying around burning a hole in my Microsoft Word documents, especially in light of the new Census county estimates for 2008. So I’m knocking out all the already-completed states for your and my nerdy enjoyment. Today, some keystones with your Jell-O?

Previously covered:

Diary 1: Massachusetts and Texas

Diary 2: Michigan and Nevada

Diary 3: Iowa and Ohio

Diary 4: Georgia and New Jersey

Diary 5: Florida and Louisiana

Those strangest of bedfellows, Rust Belt Pennsylvania and booming Utah! (spelled with an exclamation point as on state license plates) just below the fold…

Pennsylvania

Needless to say, this is truly a state of contrasts, from the upwardly mobile, newly liberal-leaning Philadelphia suburbs to the numerically shrinking, increasingly Republican towns of western Pennsylvania. In the vast “T” between Pittsburgh and Philly lies some of the most conservative and rural territory in the entire old North, along with a Democratic island in the Penn State campus and its environs.

What will redistricting see in Pennsylvania? Hard to say. The least likely option is a Democratic gerrymander, thanks to a healthy 30-20 GOP majority in the State Senate. Republicans have an outside shot at a redux gerrymander thanks to the open governor’s mansion and narrow 104-99 Dem edge in the House. My money is on a continued power split, since it is tough (though quite far from unheard of) for a party to pick up both the governor’s mansion and a legislative chamber in one cycle in a competitive state. I drew my hypothetical Pennsylvania map (again, using 2007 stats) with according assumptions.

Split partisan power in redistricting usually means all-around incumbent protection, which particularly helps the Democrats and their weaker seats (the 10th, 3rd, 12th, 11th, et al.), but also the Republicans in at least two cases (the 15th and 6th). There is, of course, a wrinkle: Pennsylvania will be losing at least one seat in reapportionment; possibly two, but one seems more likely unless North-to-South migration really picks up in the next year. With much of the state’s worst population loss occurring in the west, and with Western Pennsylvania Democrats a bit overrepresented at the congressional level (at least considering trends in the region), it seemed likely that a relatively new Democrat would be eliminated, or at least put in a tough spot against an incumbent Republican. John Murtha’s seniority means his is likely not to be the unlucky musical chair, unless he’s finally ready to retire in 2012 at age 80. That’s a possibility, but I drew the map to combine Republican Tim Murphy and Democrat Jason Altmire in a competitive (but doubtlessly McCain-supporting) western district. Meanwhile, Murtha and Erie’s Kathy Dahlkemper are both strengthened. Of course, this assumes that Murtha, Dahlkemper, Altmire, and Murphy are all reelected in 2010, and all four have at one time or another been targeted recently.

One oddity in the west as a result of the eliminated district? Bill Shuster’s 9th moved all the way into former Murtha country, though it kept Shuster’s home in-district. (Yeah, doesn’t make much sense, but with the 12th trending GOP, and Murtha getting quite up there in years, you can bet Democrats will try to salvage all their strength in the Pittsburgh area). In the east, I did my best to shore up Chris Carney, whose district is darned difficult to gerrymander for a Dem, as well as 2008 underperformer Paul Kanjorski and Charlie Dent, whose 15th District tilts Democratic in its current form. I also attempted to make the Philadelphia-area districts more compact and logical, which may have been a case of my quixotic reformer instincts overreaching.

Now, every map has at least one Achilles heel, and mine is Tim Holden’s 17th District. I simply could not figure out how to make it Dem-leaning without some seriously ugly and disruptive lines. In fact, it got more Republican in this map…not my intention, I assure you. Also, Shuster’s district moving west meant that Platts and Pitts would see some major turf changes.

This isn’t my best map (I’m much happier with Texas and Ohio), but perhaps it isn’t the travesty Louisiana and Massachusetts were. I aimed to lessen Pennsylvania’s “emaciated serpent” factor while protecting potentially vulnerable newbies. Without a doubt, a state legislator with real redistricting software (rather than a calculator, Census estimates on Excel, and Paint) could draw something more effective and precise. But you can judge for yourself:

Photobucket

District 1 – Bob Brady (D-Philadelphia) — still ethnically mixed and heavily Democratic, the home of Rocky Balboa. (Cue Bill Conti and his horn section.)

District 2 – Chaka Fattah (D-Philadelphia) — the only VRA district in the state, still majority-black.

District 3 – Kathy Dahlkemper (D-Erie) — barely voted for McCain as-is, so I aimed to maximize the influence of Dem-friendly Erie County and competitive Mercer County. I also divided Butler County to further minimize GOP strength. This district would have voted for Obama by an inch, no more than 51-48 or 52-47, but I think that’s the best I could do.

District 4 – Jason Altmire (D-McCandless) vs. Tim Murphy (R-Upper St. Clair) — both incumbents live in suburban Allegheny County, so the district includes a healthy 25% of that county along with the remaining 65% of Butler and all of Beaver and Lawrence. It’s nice and compact, and pretty competitive — my guesstimate is the numbers will actually be more Democratic than the McCain 55-44 stat seen in both Congresscritters’ current districts, which could bode well for Altmire.

District 5 – Glenn Thompson (R-Howard) — super-Republican “T” district, including one Obama base: Centre County and its many Penn State students. Why are these public university towns (State College, PA; Gainesville, FL; Athens, GA) always situated in a sea of red?

District 6 – Jim Gerlach (R-Chester Springs) — I simplified the lines to include 69% of Berks and 85% of Chester Counties, two of the more swingy counties in the Philly suburbs (compared to Delaware and Montgomery, each 60-39 for Obama). Gerlach would have a slightly more favorable seat here, but there is a huge caveat: he is exploring a 2010 run for Governor, which could be bad for our chances of holding the governor’s mansion but is probably good for our chances of picking up PA-06.

District 7 – Joe Sestak (D-Edgmont) — all of Delaware and 18% of Montgomery = a strong (and compact) Dem seat.

District 8 – Patrick Murphy (D-Bristol) — all of Bucks plus remainders of Berks and Montgomery; the vote here should be similar to my proposed 6th (about 54-45 for Obama), and if I’d wanted to gerrymander a bit, I could have made it more solid.

District 9 – Bill Shuster (R-Hollidaysburg) — now essentially a Western PA district! Not my slickest map-making, but I was worried about holding the 12th in future election cycles.

District 10 – Chris Carney (D-Dimock) — this was fairly well-done, OTOH, though I couldn’t be too aggressive for fear of weakening Kanjorski; I included 96% of Luzerne County and 28% of Lackawanna, while cutting out GOP-leaning (but Dem-trending) Pike; a 54-45 McCain district would hopefully be a lot closer to even now.

District 11 – Paul Kanjorski (D-Nanticoke) — I don’t know if Nanticoke would be in the 10th under these lines, so ignore them because the 4% of Luzerne left in the 11th would ideally include Kanjorski’s house. Other than Pike, every county in this district voted for Obama, and the expansion into Northampton County is intended to replace lost turf in Luzerne County. The district might technically be a hair less Obama-supporting than before, but there is a serious silver lining here for the incumbent: Lou Barletta’s Hazleton is no longer included.

District 12 – John Murtha (D-Johnstown) — this being the only district in America to switch from Kerry ’04 to McCain ’08 set off an alarm in my head; coupled with frequent controversy about Murtha himself, it was enough to prompt my version’s radical changes to the old lines. While the 65% of Westmoreland County doesn’t help, I’ve included all of Murtha’s native Cambria County along with competitive Indiana County and (this is key) 18% of Allegheny.

District 13 – Allyson Schwartz (D-Jenkintown) — 80% of Montgomery and the remaining 5% of Philadelphia for a compact, logical, and safe Dem seat.

District 14 – Mike Doyle (D-Forest Hills) — entirely within Allegheny County.

District 15 – Charlie Dent (R-Allentown) — yes, it’s heavy in Democratic Lehigh County, but retains just 18% each of Dem-leaning Northampton and Berks, now including all of heavily GOP Lebanon and even 20% of GOP-friendly Lancaster. This might still have voted for Obama, but by a heck of a lot less than 56-43.

District 16 – Joe Pitts (R-Kennett Square) — stretches along the south from Adams to Chester Counties, but ruled by Lancaster County, of which it comprises 80%.

District 17 – Tim Holden (D-Saint Clair) — this is my biggest disappointment. It was drawn in 2002 for George Gekas to defeat Holden, and somehow I managed to make it more Republican than before, when it should have been easy to push into the Dem column through mild adjustments. Holden can win this district as I’ve drawn it, but when he retires, all bets would be off. There must be a way to grab some Philly suburbs for the 17th without drawing the lines too revoltingly.

District 18 – Todd Platts (R-York) — okay, so it’s a lot less compact and a lot more Shuster-ish. But it’s still dominated by his York County base and still safely Republican (more so, actually).

Mapping the Keystone State, and still failing in some of my goals, was migraine-inducing, so you can imagine how relieving it is to be switching gears here for a state with just four districts, a state like…

Utah

This was a cinch to draw, since the legislature already green-lighted (green-lit?) a plan called Plan L back in late 2006 when Utah pols hoped for lame-duck congressional approval of the D.C. House Voting Rights Act. Now, whether that bill will eventually become law is still up in the air given tensions over the poison pill gun issue, but regardless of the immediate outcome, Utah will get a fourth district in reapportionment, and the state is overdue for an urban Salt Lake seat in the next decade. The current map includes three districts that combine cities/suburbs along the populous Wasatch Front with isolated small towns and desolate rural areas. That was done to hurt Jim Matheson; but GOP lawmakers, who can genuinely approve any map they want to in this heavily Republican state, appear likely to give Matheson the most Democratic district possible in order to ensure hard-right GOP hegemony in the other three districts.

Why would they do this? Well, Salt Lake County is trending Democratic, even voting for Obama in 2008 after going to Bush by 20 points in 2004. A new urban district is likely to be concentrated around Salt Lake City, and should the popular Matheson run in a rural district, there would actually be a good chance of two Democrats in a four-member Utah delegation! Thus, the best solution for Republicans is to put Matheson in the urban seat and carve themselves deep red rural turf.

My 2nd District, designed for Matheson, concentrates just about all the Democratic areas in Utah other than Moab, and creates a new 4th along the western portion of the state that would favor a Republican from Salt Lake, or (if the Salt Lake vote was split) someone from the fast-growing St. George area who commanded rural support. (Trivia for those who haven’t been: most of the state is indeed known for its high elevations, dramatic snow-capped mountains, and pristine skiing, but St. George actually has palm trees and relatively hot, humid summer temperatures ideal for growing cotton! Weird, I know.)

Here’s the Utah map, probably one of the least controversial I’ve drawn (and again, though I’m using 2007 estimates and not 2000 Census data, the legislature’s prior work served as a clear blueprint for my plan):

Photobucket

District 1 – Rob Bishop (R-Brigham City) — the northwest corner of the state, dominated by Davis and Weber Counties along the Front.

District 2 – Jim Matheson (D-Salt Lake City) — considering it would comprise 60% of Salt Lake, 6% of Davis, and all of Summit, this district might have literally voted for Obama…yes, it’s now possible to draw a genuine Democratic seat in Utah! And while the legislature may not draw Matheson something quite as favorable, they are sure to stick him in a safe urban district to avoid introducing a new Democrat into the delegation.

District 3 – Jason Chaffetz (R-Alpine) — the largest area in the state, but Utah County (Provo-Orem) reigns supreme.

New District 4 – Safe Republican, contains 40% of Salt Lake and all of Washington — odds would favor a second Salt Lake County Congressman here (a Republican to complement Matheson), but if rural areas stick together, there is room for someone from outside the Wasatch Front.

Comment away!

Jurassic Park IV, or Redistricting Pennsylvania

(From the diaries with minor edits – promoted by DavidNYC)

As I’d promised in my diary on New Jersey, Pennsylvania would be the next state I’d tackle. This would  have been done a lot sooner, but those things called work and exams kind of got in the way….

My goal, flat out, was to carve more Democratic districts. I’m all for compactness when it comes to suitcases and mp3’s, but not when I’m gerrymandering states. Again, I kept Democratic Congresscritters in their homes.

Unlike New Jersey though, Pennsylvania is probably maxed-out when it comes to Democrats (save Gerlach and Dent, whose districts are certainly Democratic.) Pennsylvania is also losing one seat (most likely) in 2010, so I drew 18 seats on 2008 population estimates. I didn’t “merge” two districts per se, but more like took the 16th, 17th, and 19th and produced two districts from them.

I had the following goals in mind:

  • Dislodge Gerlach (6th) and Dent (15th) by increasing Democratic performance in their districts.

  • Give Dahlkemper (3rd), Altmire (4th), Murtha (12th), and Holden (17th) more favorable territory. They represent McCain districts now, I wanted to change those to Obama districts.

  • Maintain strength for Sestak (7th), Patrick Murphy (8th), Kanjorski (11th), and Schwartz (13th). They have decently strongly Democratic districts, which I wanted to maintain at their current levels.

  • Keep Brady (1st), Fattah (2nd), and Doyle (14th) in strongly Democratic districts, but perhaps not as absurdly strong as before. Obama scored 88%, 90%, and 70% respectively, I felt this could afford to be lowered somewhat. A corollary to this goal is keeping Fattah’s district majority Black. I didn’t bother with Brady’s currently plurality Black district, though it may still be.

Here’s the new map (click for full-size version):

Much more below the flip.

Again, to start, I used this map of Obama’s performance across the state, by municipality. As before, lightest shade is a margin of less than 5%, then 5 to 15, 15 to 25, 25 to 35, and the new uber-dark, which is a margin of 35+.

Going district by district, here’s what we’ve got. As a sidenote, I didn’t bother renumbering districts to make sense (which they don’t right now). I think it’s easier to keep core areas the same when numbering, since I think most of us automatically relate, for example, “PA-14” to Pittsburgh.

Summary statistics are: County, Population, Obama Votes, McCain Votes, Total Votes, Obama%, McCain%.

I’m going to go Northwest to Southeast, as opposed to in order by non-sensical district number. I think that makes the most sense.


3 689,046 169,632 139,373 314,100 54.01% 44.37%
Cameron 5,974 879 1,323 2,257 38.95% 58.62%
Centre 96,991 33,113 21,090 55,022 60.18% 38.33%
Clarion 11,906 2,701 2,626 5,432 49.72% 48.34%
Clearfield 38,795 7,372 7,835 15,582 47.31% 50.28%
Clinton 27,232 5,557 5,070 10,767 51.61% 47.09%
Crawford 88,880 16,780 20,750 38,134 44.00% 54.41%
Elk 32,914 7,290 6,676 14,361 50.76% 46.49%
Erie 279,255 75,775 50,351 127,691 59.34% 39.43%
Forest 4,946 1,038 1,366 2,468 42.06% 55.35%
McKean 20,003 3,579 3,628 7,370 48.56% 49.23%
Mercer 16,892 2,842 4,191 7,184 39.56% 58.34%
Venango 24,009 4,169 4,782 9,169 45.47% 52.15%
Warren 41,249 8,537 9,685 18,663 45.74% 51.89%

Sad to say, this district probably isn’t much more gerrymandered than its current counterpart. It contains the entirety of Erie and Crawford counties in the northwest, and starts a slow march towards State College. I’d hate to leave those Democratic votes behind, and plus they’re a good way to shore up Dahlkemper’s district, which Obama lost by 17 votes. It takes in the Democratic parts of Centre and Clinton counties on the east end, with some arms into Clarion and Venango. I’d like to think I succeeded, since Obama scored 45% in the 3rd’s part of Venango and 50% in Clarion, compared to 35% and 33% in the parts not in the 3rd. All in all, a 54% Obama district – a 6% increase from its current form.


4 689,397 182,724 168,763 356,152 51.31% 47.39%
Allegheny 389,960 110,152 102,177 214,148 51.44% 47.71%
Beaver 149,042 36,109 35,781 73,326 49.24% 48.80%
Lawrence 75,681 17,041 16,670 34,362 49.59% 48.51%
Mercer 74,714 19,422 14,135 34,316 56.60% 41.19%

Altmire is pretty much in the same boat as Dahlkemper, except with a district that Obama lost 44-55. There’s no need to complicate this by including any parts of Butler County, so this district sticks along the Ohio, Beaver, and Shenango Rivers up from Pittsburgh (but not including) to Sharon, through Allegheny, Beaver, Lawrence, and Mercer counties. It’s a point of pride for me that Obama won each county component. Specifically in Allegheny County, Altmire swaps out a bunch of Republican northern suburbs for friendlier stuff east of the city, notably Monroeville and Penn Hills. Obama scored 44% in the Allegheny portion of the old 4th, compard to 51% here. If Altmire didn’t live in Republican-leaning McCandless, there could have perhaps been more improvement. Anyways, this works out to a 51% Obama district – an improvement of 7%.


18 689,231 136,738 218,177 359,372 38.05% 60.71%
Allegheny 127,747 30,252 41,789 72,634 41.65% 57.53%
Beaver 24,444 4,390 7,114 11,706 37.50% 60.77%
Butler 181,082 32,260 57,074 90,761 35.54% 62.88%
Greene 13,925 2,072 2,748 4,892 42.35% 56.17%
Lawrence 16,216 2,670 5,181 7,987 33.43% 64.87%
Mercer 25,909 4,147 8,239 12,668 32.74% 65.04%
Washington 82,349 18,019 27,503 46,141 39.05% 59.61%
Westmoreland 217,559 42,928 68,529 112,583 38.13% 60.87%

This district is what happens when you try to strip all the Republican territory out of the 3rd, 4th, and 12th districts and pack it together. Butler County has no place in a Democratic district, nor does the large chunk of Westmoreland County which is quickly trending away from us. Throw in some the northern Pittsburgh suburbs stripped out of Altmire’s district and the core of Tim Murphy’s old district, and you get this 38% – an 8% drop in Democratic performance.


14 688,540 227,685 124,055 355,158 64.11% 34.93%
Allegheny 688,540 227,685 124,055 355,158 64.11% 34.93%

The 14th doesn’t change much – it keeps the entirety of the city of Pittsburgh and suburbs to the east like Swissvale and Doyle’s home in Forest Hills. Instead of reaching southwest, the new 14th looks south to the southern Pittsburgh suburbs like Upper St. Clair and Bethel Park. Arguably, this district is actually more compact than the current 14th. No worries for Mike F. Doyle though, since Obama still won 55% in the non-Pittsburgh part of the district.  Combine that with the 75% Obama scored in the city, and you get a 64% Democratic district, a drop of 6%.


12 689,579 146,095 143,358 294,030 49.69% 48.76%
Allegheny 19,931 4,385 3,865 8,347 52.53% 46.30%
Armstrong 26,485 5,114 6,186 11,454 44.65% 54.01%
Cambria 131,716 29,955 28,623 59,705 50.17% 47.94%
Fayette 135,292 24,805 23,726 49,108 50.51% 48.31%
Greene 25,794 5,757 5,141 11,084 51.94% 46.38%
Indiana 55,368 12,477 12,254 25,068 49.77% 48.88%
Somerset 26,108 5,709 6,599 12,656 45.11% 52.14%
Washington 122,958 28,100 23,199 52,318 53.71% 44.34%
Westmoreland 145,927 29,793 33,765 64,290 46.34% 52.52%

It’s no secret Obama didn’t do all that hot in Southwest PA, and it’s painfully obvious here. Kerry won the old 12th, which Obama lost by about 1,000 votes. Trying to create an Obama district required some creative districting and ends up being more like connect-the-dots between traditionally Democratic Fayette and Greene counties, Johnstown (Murtha’s residence), Washington, the college town of Indiana, and Lower Burrell in Westmoreland. The old 12th pretty much packed all the Democratic votes in the area, so the increased population requirement really made me stretch. I think again, I have a strong case for this being more compact than the old 12th. Either way, it’s a slight improvement to a district Obama won by 3,000 votes, an improvement of 0.5%.


9 689,087 102,284 191,267 298,149 34.31% 64.15%
Adams 5,926 1,018 1,671 2,739 37.17% 61.01%
Armstrong 42,940 6,024 12,356 18,627 32.34% 66.33%
Bedford 49,650 6,059 16,124 22,508 26.92% 71.64%
Blair 125,593 19,813 32,708 53,298 37.17% 61.37%
Cambria 14,271 2,496 3,372 5,965 41.84% 56.53%
Clarion 28,186 4,045 8,111 12,435 32.53% 65.23%
Clearfield 33,268 5,672 8,599 14,588 38.88% 58.95%
Cumberland 19,402 3,428 4,426 7,976 42.98% 55.49%
Fayette 9,667 1,090 2,054 3,172 34.36% 64.75%
Franklin 139,459 21,169 41,906 63,641 33.26% 65.85%
Fulton 14,261 1,576 4,642 6,306 24.99% 73.61%
Huntingdon 45,552 6,621 11,745 18,730 35.35% 62.71%
Indiana 32,520 4,588 7,473 12,236 37.50% 61.07%
Jefferson 45,151 6,447 12,057 18,904 34.10% 63.78%
Somerset 52,087 7,169 15,087 22,712 31.56% 66.43%
Venango 31,154 5,069 8,936 14,312 35.42% 62.44%

Moving into the ‘T’ now, this is the first of two extremely Republican districts. Arguably, there are two population centers, one in Altoona in Blair County and the other in Chambersburg in Franklin. From there, it moves northwest, picking up the parts of Somerset, Cambria, Indiana, and Armstrong not packed into Murtha’s 12th, and then the parts of Venango and Clarion not in Dahlkemper’s 3rd. At 34% Obama, this is the most Republican district in Pennsylvania and a 1% drop from the current 9th.


5 689,043 114,992 195,836 315,767 36.42% 62.02%
Berks 9,899 993 2,312 3,366 29.50% 68.69%
Centre 46,567 8,837 11,902 21,089 41.90% 56.44%
Clearfield 9,696 1,511 2,228 3,839 39.36% 58.04%
Clinton 10,002 1,540 2,434 4,024 38.27% 60.49%
Cumberland 199,164 43,028 57,531 102,130 42.13% 56.33%
Dauphin 43,419 8,423 15,149 23,834 35.34% 63.56%
Juniata 23,163 3,068 6,484 9,819 31.25% 66.04%
Lebanon 53,875 9,202 16,904 26,528 34.69% 63.72%
Lycoming 49,426 7,076 15,691 23,131 30.59% 67.84%
McKean 23,852 2,886 5,596 8,645 33.38% 64.73%
Mifflin 46,609 5,375 10,929 16,502 32.57% 66.23%
Montour 3,868 590 1,167 1,771 33.31% 65.89%
Northumberland 22,909 3,245 6,360 9,734 33.34% 65.34%
Perry 44,850 6,396 13,058 19,745 32.39% 66.13%
Potter 18,080 2,300 5,109 7,583 30.33% 67.37%
Schuylkill 10,533 1,776 3,294 5,139 34.56% 64.10%
Snyder 23,134 2,499 6,442 9,069 27.56% 71.03%
Tioga 24,641 3,610 7,527 11,305 31.93% 66.58%
Union 25,356 2,637 5,719 8,514 30.97% 67.17%

The is the other Republican district taking in a large chunk of the T. More packing of Republicans here, as this district on the east side swaps many tentacles with Chris Carney’s new 10th district. Any pockets of even-remotely Democratic friendliness are pulled out, including Williamsport and Sunbury. What’s left is expansive Republican space, centered in Cumberland County moving north towards the Northern Tier. At 36% Obama, this is a drop of 8%.


10 688,967 134,946 156,456 296,409 45.53% 52.78%
Berks 8,704 1,724 2,167 3,995 43.15% 54.24%
Bradford 61,626 10,306 15,057 25,884 39.82% 58.17%
Columbia 64,663 13,019 14,255 27,838 46.77% 51.21%
Dauphin 5,728 823 1,231 2,073 39.70% 59.38%
Lackawanna 44,778 13,784 10,806 24,913 55.33% 43.37%
Luzerne 11,637 2,044 3,020 5,153 39.67% 58.61%
Lycoming 67,880 11,305 14,589 26,316 42.96% 55.44%
Montour 14,368 2,757 3,388 6,216 44.35% 54.50%
Northumberland 68,307 11,083 12,655 24,201 45.80% 52.29%
Pike 57,102 11,493 12,519 24,285 47.33% 51.55%
Schuylkill 108,170 20,758 23,247 44,766 46.37% 51.93%
Snyder 14,849 2,883 3,458 6,410 44.98% 53.95%
Sullivan 6,556 1,233 1,841 3,131 39.38% 58.80%
Susquehanna 41,388 8,381 10,633 19,383 43.24% 54.86%
Tioga 16,194 2,780 3,799 6,679 41.62% 56.88%
Union 17,997 4,696 4,140 8,961 52.40% 46.20%
Wayne 51,139 9,892 12,702 22,932 43.14% 55.39%
Wyoming 27,881 5,985 6,949 13,273 45.09% 52.35%

You can’t win all of them, and this is the one district that wasn’t to my liking. I really wanted to protect Carney a bit more, but the territory simply wasn’t there to do that and protect the Democratic strength of Kanjorski’s 11th. I chose to hedge a bit and to keep the 11th strongly Democratic. It might be a waste to protect Kanjorski like that, but he’s got to retire eventually and we can definitely get a good Democrat out of Scranton. Thus, this district starts in Wayne and Pike counties, before moving through Susquehanna (Carney lives in Dimock) and northern Lackawanna counties. Lycoming County outside of Williamsport is stripped out as much as possible, and it gains Columbia County and a large chunk of Schuylkill County freed up from Holden’s 17th. Surprisingly, I still managed a gain of 0.5% to 45.5% Obama. Carney should be fine here regardless.


11 689,582 177,101 128,039 309,934 57.14% 41.31%
Carbon 62,326 13,464 12,957 27,050 49.77% 47.90%
Lackawanna 164,442 53,736 28,682 83,626 64.26% 34.30%
Luzerne 300,203 70,448 58,107 130,815 53.85% 44.42%
Monroe 162,611 39,453 28,293 68,443 57.64% 41.34%

Kanjorski was probably saved in 2008 by Obama’s coattails, and shoring up the 11th was one of my major goals. Surprisingly, this actually becomes more compact, too, it seems. What we get is a district centered on the Lackawanna Valley. 43% of this district is Wilkes-Barre and Luzerne County, and another 23% each for Scranton/Lackawanna County and Monroe County. All in all, a 57% Obama district, up 0.3% from the old 11th. Also a rare victory for compactness.


17 689,314 176,601 148,808 329,673 53.57% 45.14%
Berks 52,440 11,062 13,461 24,959 44.32% 53.93%
Cumberland 6,969 1,850 1,782 3,719 49.74% 47.92%
Dauphin 199,854 59,866 40,264 101,138 59.19% 39.81%
Lancaster 229,139 60,406 52,477 114,386 52.81% 45.88%
Lebanon 72,551 14,108 17,410 32,035 44.04% 54.35%
Schuylkill 28,135 5,938 7,418 13,522 43.91% 54.86%
York 100,226 23,371 15,996 39,914 58.55% 40.08%

Connect the dots version 2.0 here, as we string together the cities of York, Harrisburg, Lancaster, and Tim Holden’s home in St. Clair in Schuylkill County, all of which are strongly Democratic. They’re counterbalanced by the Republican outlying portions of York, Dauphin, and Lancaster counties, though. However, 59% Obama performances in the 17th’s parts of Dauphin and York and a 53% showing in Lancaster anchor this 54% Obama district on balance, an improvement of 6% from the current 17th.


16 688,715 118,510 197,429 320,910 36.93% 61.52%
Adams 93,986 16,615 24,678 41,924 39.63% 58.86%
Berks 9,821 2,245 3,260 5,596 40.12% 58.26%
Chester 1,059 243 552 806 30.15% 68.49%
Dauphin 5,275 759 1,576 2,362 32.13% 66.72%
Lancaster 264,774 39,180 74,091 114,863 34.11% 64.50%
York 313,800 59,468 93,272 155,359 38.28% 60.04%

This is what remains of the old 16th and 19th districts once the Democratic cities are stripped out. There’s really not much to say about this district based in York and Lancaster, except that it’s the last “Republican” district we have to talk about, it only gets better from here. At 37% Obama, it’s a drop of 6% from the old 19th and 10% from the old 16th – which was intentional, of course.


15 688,754 177,367 136,903 318,961 55.61% 42.92%
Berks 65,559 15,023 14,970 30,535 49.20% 49.03%
Lehigh 333,423 87,089 63,382 152,473 57.12% 41.57%
Northampton 289,772 75,255 58,551 135,953 55.35% 43.07%

Starting with the Lehigh Valley, the 15th continues to have the entirety of Northampton County. Lehigh County did have a bite taken out of it by the old pterodactyl of the 6th, but the Lehigh in its entirety stays here too. Instead of reaching into MontCo with two rods hugging the MontCo-Berks and MontCo-BucksCo line, it goes for Bucks County instead. At 56% Obama, this is a slight improvement. Charlie Dent should be gone as soon as we get a good challenger anyway.

Southeast PA is definitely (in my mind, anyway), the coup de grace of this map. Here’s an inset of that:

Each district is colored by county component: all greens are the 6th or 8th, blues are the 7th or 13th, red is the 1st, and yellow is the 2nd.

First, the boring stuff (i.e. the 1st and 2nd):


1 689,174 266,010 78,010 347,098 76.64% 22.47%
Delaware 208,267 65,596 42,719 109,675 59.81% 38.95%
Philadelphia 480,907 200,414 35,291 237,423 84.41% 14.86%

Bob Brady’s district remains anchored in South Philly with an arm into Delaware County. The composition of this arm, however, is significantly different. Brady swaps with Sestak some cities (notably strongly-Democratic Chester city) for some Republican leaning parts of the Main Line. Brady’s old 1st had a 89% Democratic section of DelCo, the new 1st has a 60% Democratic section. This lowers Democratic performance by about 11%, down to 77%. Brady need not be concerned.


2 688,659 303,286 34,983 339,990 89.20% 10.29%
Philadelphia 688,659 303,286 34,983 339,990 89.20% 10.29%

No significant changes for Chaka Fattah. His district still contains most of West Philly. Cheltenham in MontCo is removed, substituted for an arm into Northeast Philly. The changes aren’t all that significant, the district is only down 0.85% in Obama performance.


8 686,233 199,224 162,328 365,625 54.49% 44.40%
Bucks 619,093 179,031 150,248 332,924 53.78% 45.13%
Montgomery 27,576 7,460 5,533 13,168 56.65% 42.02%
Philadelphia 39,564 12,733 6,547 19,533 65.19% 33.52%

Consistent with tradition, Bucks County remains in the 8th in its entirety. The old 8th had an odd-looking protrusion into MontCo (where Obama got 63%), and took a section of Northeast Philly where Obama barely edged McCain with 49%. We flip the roles here, instead taking Wards 41 and 65 of the city, where Obama got 65%. We also take a few municipalities (funnily, Hatfield Twp, Hatfield Boro, and Hatboro Boro) in MontCo, where Obama got 57%. Overall, Obama got 54.5%, up 0.5%.


13 688,902 224,312 140,834 368,302 60.90% 38.24%
Montgomery 443,652 144,765 100,434 247,223 58.56% 40.62%
Philadelphia 245,250 79,547 40,400 121,079 65.70% 33.37%

The 13th remains a MontCo-Philly hybrid. It takes in more of MontCo now, consistent with the increased population constraint, reaching all the way to the Berks County Line. Instead of reaching through the city, the new 13th no longer touches the Delaware River, stopping short by grabbing Northeast Philly taken from the 8th. Centered in Abingdon (it’s the largest municipality), the new 13th’s section of MontCo is 59% Obama, up from 57%, and the new 13th’s section of Philly is 66% Obama, up from 60%. Together, this makes for a 61% Obama district, up from 58%.


7 689,283 219,653 154,096 377,651 58.16% 40.80%
Chester 211,997 66,693 57,071 125,146 53.29% 45.60%
Delaware 345,246 113,274 72,554 187,835 60.31% 38.63%
Montgomery 132,040 39,686 24,471 64,670 61.37% 37.84%

The new 7th stays composed of ChesCo, DelCo, and MontCo. Since more of DelCo is given to Brady’s 1st, this district becomes more Chester County heavy, reaching further north and west into the county. It, incidentally, takes Jim Gerlach’s home in West Pikeland Township here. Even so, the new ChesCo portion is 53% Obama, up from 50%. The DelCo section gets a healthy boost from the city of Chester while keeping in Radnor, Haverford, and Upper Darby along the Main Line. The New DelCo section is 60% Obama, up from 56%. The MontCo part remains mostly the same, taking in Norristown, Upper Merion, and Lower and Upper Providence Townships. Combined, this is a 58% Obama district, up 2.5%.


6 688,652 198,024 136,472 338,576 58.49% 40.31%
Berks 251,731 66,000 44,343 112,060 58.90% 39.57%
Chester 265,765 70,897 56,798 129,300 54.83% 43.93%
Montgomery 171,156 61,127 35,331 97,216 62.88% 36.34%

My favorite district. The pterodactyl is back (hence the title, get it?), and it’s leaner and meaner (to Republicans, anyway). The body remains majority Chester, but it swaps out a large swath of eastern ChesCo for townships along the Lancaster County line freed up from the 16th. It still, however, keeps Democratic centers in Downington and Coatesville, and adds West Chester proper, which was gerrymandered into the 16th before. Obama performed roughly the same in the old and new Chester part.

As before, the left wing reaches into Berks County, but before, Reading was cracked three ways between the 6th, 16th, and 17th. Now, Reading and its 81% Obama goodness are kept whole in this district, raising Obama’s performance in Berks from 54% to 59%. The right arm is still my favorite. Originally, Republicans conceived of this as a way to crack MontCo into two Republican (PA-06, PA-07) and one swing district (PA-13). This is best termed, I think, an EPIC FAIL. The old right arm was 64% Obama, and this new version is 63%. I maintained the anchor in Lower Merion Township and Narberth, since their combined 71% Obama goodness is just too good to give up. Combined, this raises Obama’s performance here by another 1% to 58.5%.

So there you have it, a new, 18-seat map for Pennsylvania. Comments? Questions? Which state should I do next? Please share what you think the districts look like, also!

PA-Gov, PA-06: Gerlach forms exploratory committee

“Exploratory committees almost always are precursors to full-fledged campaigns, though Gerlach said Thursday’s announcement was not tantamount to a declaration of candidacy. He issued a written statement saying he would take the next few months to “speak with political, business and community leaders, help our 2009 statewide judicial candidates, conduct polling and determine if there is a clear path to victory.”

“I suspect that by late spring we’ll know whether to formally move forward with a campaign for governor,” he added.”

He really does see the writing on the wall. His House seat should be a relatively straight-forward pickup in an open seat no?

http://www.cqpolitics.com/wmsp…

PA-05: McCracken for Congress — Staying Positive with a Message of Hope and Change

There really isn’t a lot left to say as we head into the final 24 hours of the campaign.  First, and most important, Kelly, Amanda and I want to thank everyone who has helped in any way with the campaign.  The one thing I will take away from this experience, regardless of the outcome on Tuesday, is the people I’ve met, the communities I’ve visited and the stories we’ve shared.

It has also been encouraging how many people have stepped up over the last 2 weeks to help with donations to the campaign.  Once our opponent got desperate and decided to go negative there were many people and organizations who stepped up and sent in late donations.  These late donations allowed us to expand our media advertising and create a second TV ad to combat the distortions coming from our opponent’s campaign.  

I think once they realized they offered no ideas or solutions for the 5th district, the only way they could win was to trot out the usual wedge issues and scare the voters into thinking I’m someone that I’m not.  Now we know how Barack Obama feels.

I want to close out this campaign on a positive note.  

Keep encouraging everyone you know to get out and vote on Tuesday.  Remind them that while the top of the ballot for President is the race everyone is interested in, the next most important race is the 5th district race.  This is our chance to reverse 8 years of bad policy and take our future back.   Tuesday will be historical and we can be part of it by sending a Democrat to Congress from the 5th district for the first time in 30 years.  Most important to remember — the Democratic message throughout the long campaign has been a positive one stressing HOPE and CHANGE.


Review of the Past Week on the Campaign Trail:

I participated in several additional debates / forums with the other 2 candidates for the 5th district seat this week.   There was really nothing new to report as both my opponents stayed on script with the expected answers to the usual questions.   After going through this process, I am pleased that we did so many debates across the 5th district.   Voters across the district had many opportunities to come out and see the candidates in person and hear where we stand on the issues.  

We had a great GOTV rally in Clarion on Saturday with a nice turnout of people from the Clarion area including members of the Clarion University Young Democrats and members from the IUPAT union.  I was honored to share the stage with PA House candidate Matt Ellenberger, Clarion County Democratic Chairman Bill Miller and IUPAT National President James Williams.

I had 2 big highlights this week — Meeting former President Bill Clinton in State College and meeting our next Vice President, Senator Joe Biden at a rally in Williamsport.


Mark meets and receives the endorsement of Bill Clinton.


Meeting our next VP Joe Biden in Williamsport.

It was an honor to meet both of these great men and it is something I will always remember.  I learned that Senator Biden and I have something in common.  He also served as a county commissioner in Delaware before he was elected to the United States Senate.  

Here is a picture from the rally in Williamsport that appeared in the Lock Haven newspaper.


The gathering in Williamsport.


Schedule for Upcoming Week:

Monday — 7 PM —  DuBois Democratic Committee Meeting

Tuesday  — Election Day

Wednesday & Beyond — To Be Decided by the Voters in the 5th District.


Mark B. McCracken

Your Candidate For Congress

————————————————————————————————–

This diary is cross-posted at McCracken’s campaign blog, PA’s Blue Fifth

Mark McCracken for Congress

ActBlue page