Where can you gain more Democrats in Central Illinois?

Photobucket

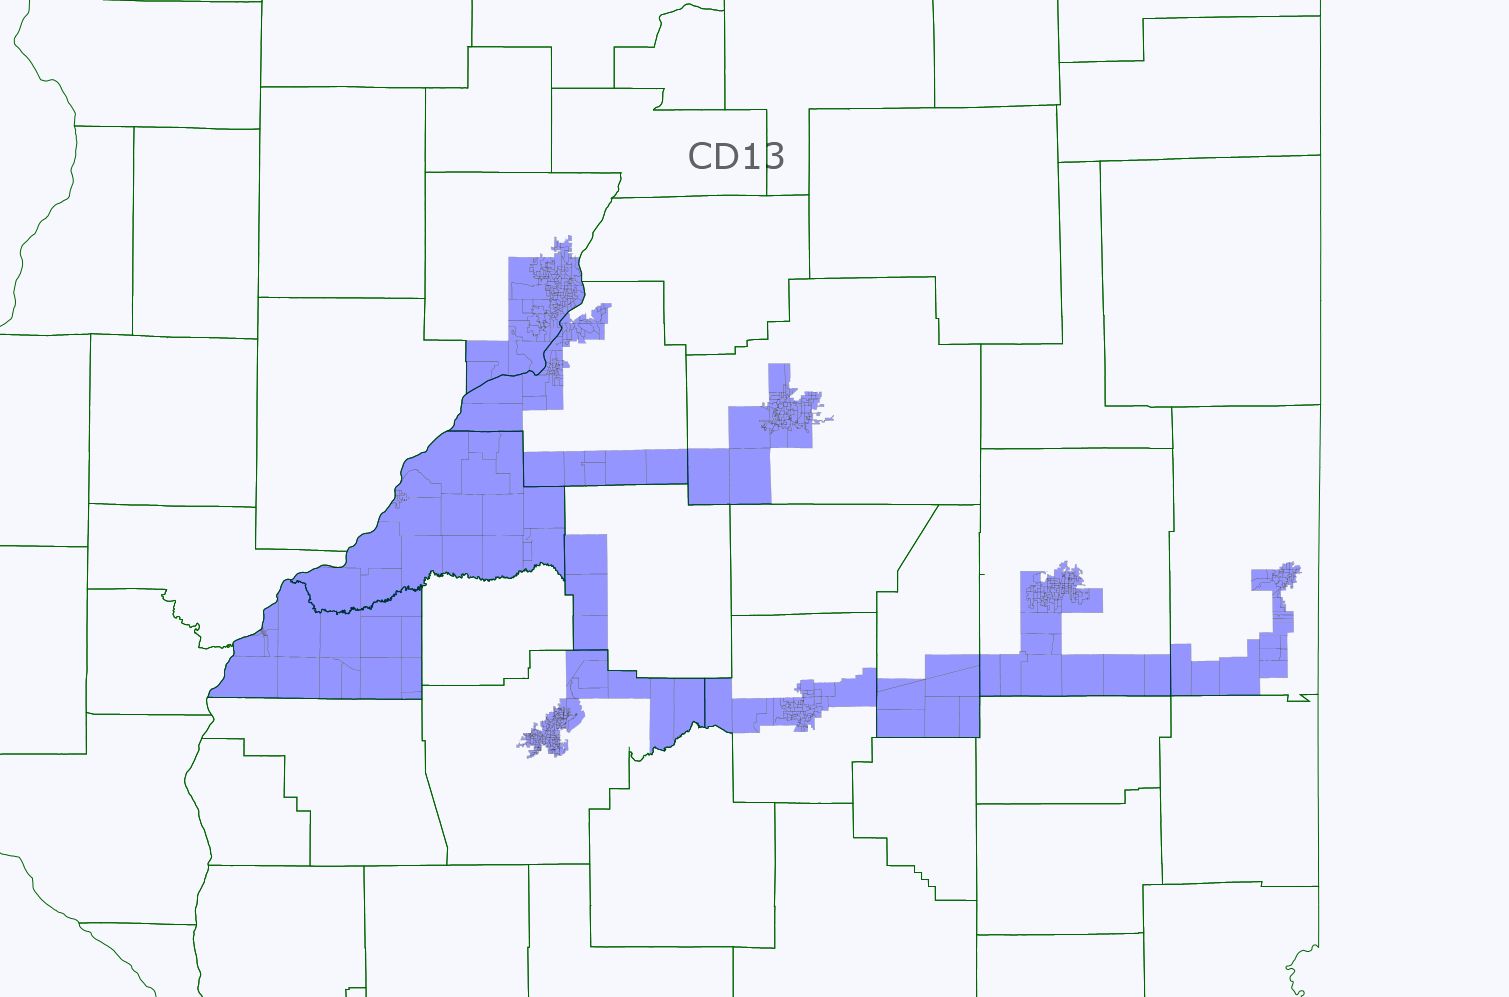
After tweaking this district all evening, I am stumped.  Are there any obvious batch of Democrats I am missing?  I want to save southern Montgomery and Macoupin Counties for bolstering the 12th.  I suppose I could always go into Fulton County, but then I would have to replace those Democrats with other voters for my new 17th.  Coles County with Mattoon and Charleston might be another possibility, but if you are going mainly by Kerry 2004 results (which I am – the 2008 Obama results are just too rosy everywhere in the state although not as bad in the central and southern part of the state as in the Chicago metro area), Kerry lost that county quite handily in 2004.  Either way you look at it, because both Springfield and Bloomington-Normal in a neutral year (like 2004) are lean-GOP cities, even with the powerhouses of Urbana-Champaign, Decatur, and the lean-Democratic cities of Peoria and Dansville, you still end up no better than 51.41% Kerry (at least at my valiant attempt at it).

Any thoughts of how I should try to bolster this district to 52-53% Kerry.  That is my goal for creating 3 downstate lean-Democratic seats.  I got Jerry Costello’s district up to 53-46 simply by axing out Williamson, Union, Pulaski, and Alexander and adding in the town of Edwardsville in Madison County and bits of southern Macoupin and Montgomeryt counties.  Likewise it is easy to make the 17th into a 53-47 Kerry district by going into Rockford.

This district for what it’s worth, voted 59-40 for Obama in 2008 but only 51-48 for Kerry 4 years prior.  I suspect the reason has largely to do with turnout issues among minorities and college students.  We won’t have those worries in 2012 but I worry about the remaining 4 election cycles.

I would still advocate drawing this map, even if it is not possible to go higher than 51-48.  Other than Dick Durbin (who represented Springfield and Decatur when he was in the House), these cities as far as I know have never been a) brought together; or b) represented by a Democrat.  Instead Illinois suffers from decades’ worth of GOP gerrymanders with the result that these cities are always split up.

Still, if Democrats get a bit skittish, I would not be entirely surprised if they sought to bolster the 17th a bit more as well as the 12th at the expense of a new district.

I welcome your thoughts.

Other evidence that Illinois is very swingy: caution needed before we overreach with a 14-4 map

I am as partisan a Democrat as most people on this website.  As an Illinoisan, I am dismayed that my state elected five freshmen Republicans last fall but very grateful (for a whole lot of other reasons besides redistricting) that Governor Quinn just managed to hold on.  Otherwise we would be looking at another “incumbent protection” map, which in a state that just elected five freshmen GOP congressmen last fall, would be tantamount to a GOP gerrymander.

Various would-be mappers such as Silverspring have proposed 14-4 maps that would make Delay and Phil Burton proud.  But many of these maps go by Obama 2008 data, which is a fundamentally flawed data set to be basing districts on in my very educated opinion.  On the surface maps provided by such places as usaelection.org, you can see counties like Kendall and Grundy and Stephenson and McHenry (just to name a few) that wound up in Obama’s column in 2008.  No seasoned Democratic politician in Illinois would ever call these counties that are Democratic by any means.  Perhaps as suburban/exurban areas of McHenry and Kendall start to fill up and become more swingy, those counties might change.

This diary, however, focuses on a slightly different problem with the Obama 2008 data when compared against Kerry 2004 downstate (where it models pretty accurately – I understand the concerns people have about Cook and Dupage which may be a bit bluer now in 2011 but that trend is not noticeable anywhere outside of Chicagoland).  The problem is this: several of the downstate cities that mappers such as myself and Silver Spring and others count on to create as many Democratic-leaning districts as we can, aren’t really all that blue to begin with.  In other cases, such as Decatur and Urbana-Champaign, they are quite blue, but turnout is a problem.  Follow me across the jump where I demonstrate this using a new district I have been creating in most of my maps – a new 13th which disappears in Chicagoland and reappears as a vacant downstate cities seat.

Photobucket

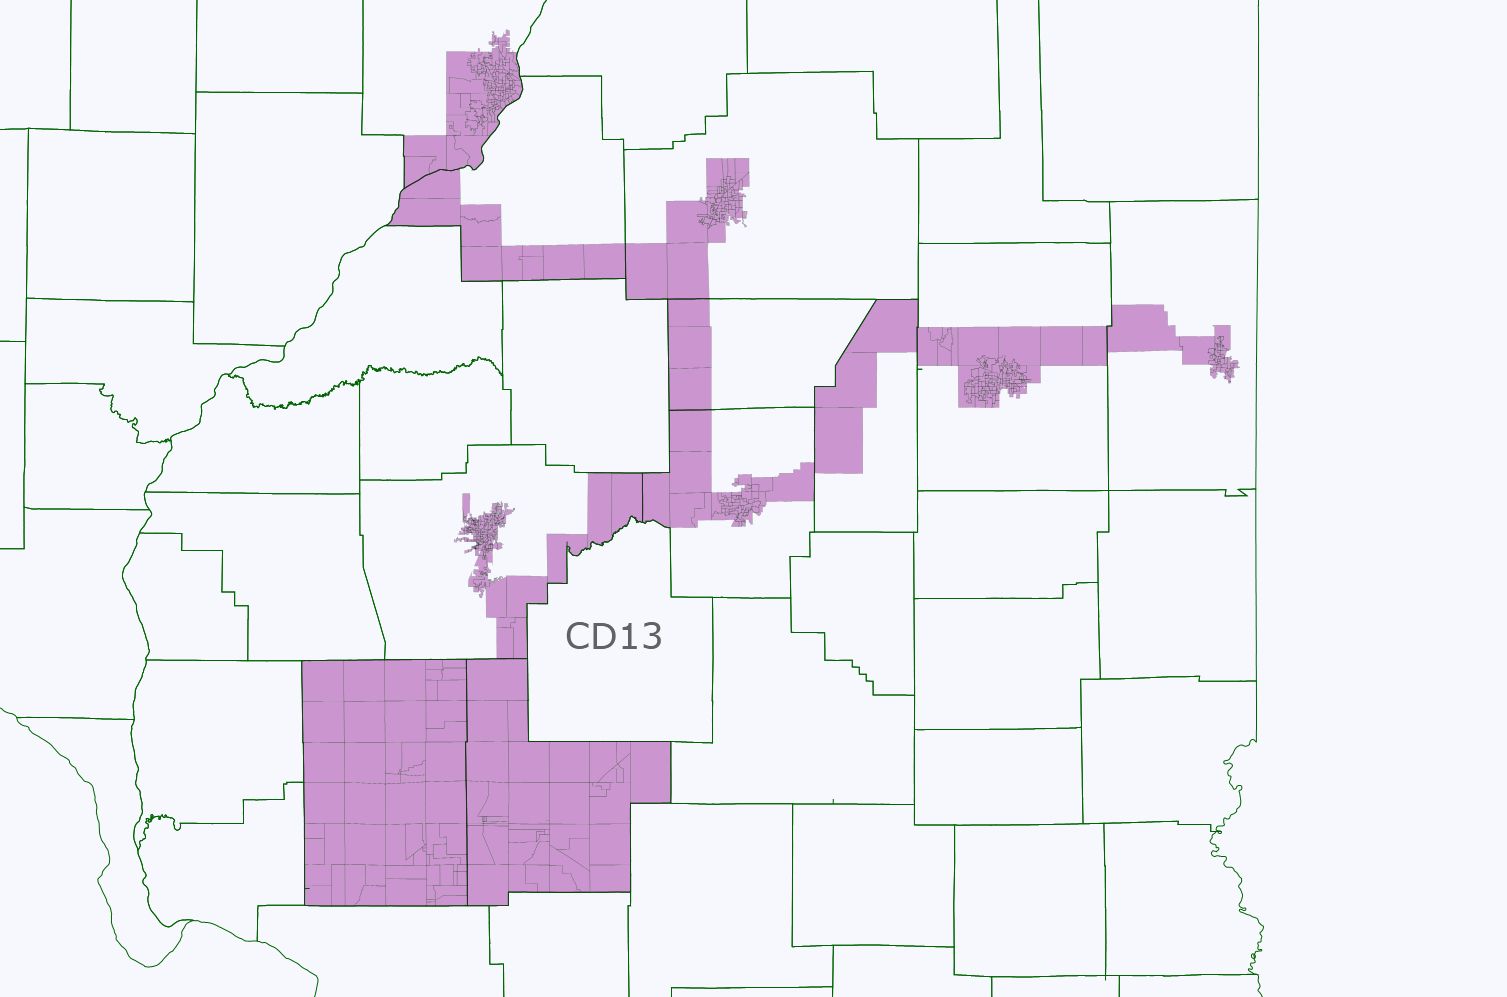
On first glance this district ought to be safely Democratic, even in 2004.  It isn’t entirely so.  Believe it or not, but Bush got 49% of the vote in this district (and the narrow tendrils connecting the various cities together only amount to about 30k residents so that isn’t the problem so much).  The district is good enough for my standards, though, because Obama did get 59%.  By Cook PVI it is a D+4, perhaps not completely safe from a meltdown of 2010 proportions but most Republicans cannot win in districts any more Democratic than this, and other than Tim Johnson, there is no sitting Republican congressman from this area of the state who could have cross-over appeal.  Even then, Tim Johnson is not a Mark Kirk, and it would take a Mark Kirk for the GOP to win this seat.  So I think it is reasonably safe Team Blue, probably as safe as can be drawn in fact.

In most other parts of the country, a 51% Kerry, 59% Obama seat would be considered safely Democratic.  But again, pay attention to that swing.  At 8% it is a bit larger than nationwide if not as extreme as the 10-12% swings found everywhere in Chicagoland.  When one looks at the cities, you see what I am discussing (with the order of the numbers being Dem-Rep):

Peoria: 28,542-18,536 in 2008; 24,795-22,398 in 2004

Danville: about 8,000 – about 4,500 in 2008; about 7,500-about 5,000 in 2004 (Does anybody know where I can find Danville or Vermillion precinct numbers; their elections website is among the most unhelpful I have ever experienced?)  I calculated this by assuming, for the sake of argument, that the out-city areas of Vermillion were equally as red as the out-city areas of Champaign County next door but I could be slightly off in either direction.

Champaign-Urbana: 32,618-13,408 in 2008; 28,814-17,222 in 2004

Bloomington: 17,578-15,167 in 2008; 13,628-17,154 in 2004

Normal: 12,257-9,197 in 2008; 9,555-10,570 in 2004

Springfield: 32,463-24,019 in 2008; 24,650-28,971 in 2004

I am progressing slower than normal with my maps because it has occurred to me that there are really three scenarios that have to be taken into consideration.  Scenario A: a tactically conservative but aggressive in every other sense map that would lock down 13 Kerry districts (Rockford going together with Rock Island; the 14th going into downtown Joliet, etc.).  Scenario B: a more risky 12-4-2 map that would put Joliet in a swing seat as well as Melissa Bean in another one in the north part of Chicagoland.  Scenario C finally would aim for a 12-5-1 which would shore up Melissa Bean while pushing a Kane seat into Rockford, which would then make the downstate cities seat very swingish (voted for Bush 53-47 then flipped to Obama 55-45).

Personally I would opt for Scenario A if I were drawing the map and not try to do a 14-4.  Unfortunately with Citizens United, the money game is even more unstacked in our disfavor.  Our ticket should get a bump with Obama on the top of the ticket, but then what about the remaining four elections in the decade-long period that any map would be operative?  Finally, another reason to be aggressive when possible but tactically conservative, drawing maps more according to Kerry or 2010 congressional data rather than Obama: Illinois is notorious for split-ticket voters.  In the weeds work I have been doing up in Chicago suburbia, I cannot tell you how often a precinct that voted 60-40 for Obama voted also in the same election for Biggert or Roskam.  And that was in 2008!  Chicago suburbia is full of independents and moderates.  

That being said, it is possible to draw 13 Kerry seats to only 5 Bush seats, and if 13-5 were achieved in 2012, that would still mean -6 GOP, +5 Dem.  That is nothing to snuff at.

The Land of Lincoln: The Land of Huge Swings; or why I doubt a 14-4 is at all realistic

Illinois is one of the few prizes for Democrats going into the 2010 round of redistricting.  Republicans currently control the delegation, having swung four sitting Democratic congressmen out of office in 2010.  There are only eight Democrats currently to 11 Republicans in the delegation, which must shrink by one.  But as luck would have it, Governor Quinn managed to narrowly become elected to a full first term, and Democrats managed to hold onto their majorities in both chambers of the state legislature.  Thus, Democrats get to draw the map and it will likely be a savage map toward the GOP.

Okay this much is known, and many people have drawn Democratic gerrymanders; indeed I am currently working on a 12-5-1 map myself that will be posted in a week or two once I tabulate all the precinct data (which is taking forever!).  

This, however, is a more focused diary.  It argues that Illinois is a land of massive swings between 2004, 2008, and 2010 and that only by drawing a map that survives these three cycles can one be really sure that they are drawing a Democratic map versus a dummymander.  Our base got energized in 2008 but did not turn out in 2010, and that was most pronounced in the suburbs where many of us want to draw new Democratic seats.  It is not that the GOP vote went up much, but rather that our vote plummeted, and plummeted more than probably elsewhere in the country given the home-state effect in 2008.  Kerry’s vote in 2004, although dated, shows us a neutral year and it should be read also as cautionary regarding the vote pluralities a Democratic candidate can expect.

One more thing: although I include Alexi numbers here, Illinois is a state without party registration and a state full of moderates and independents.  Really to be truly safe in a 2010 style election, I believe you must look in the weeds and look down-ballot at which lever voters were pulling for Congress rather than which one they were pulling for governor or senator.  Certainly I would imagine that politicians who have to win elections are doing just this thing right now as they contemplate how they want to carve up the state.  

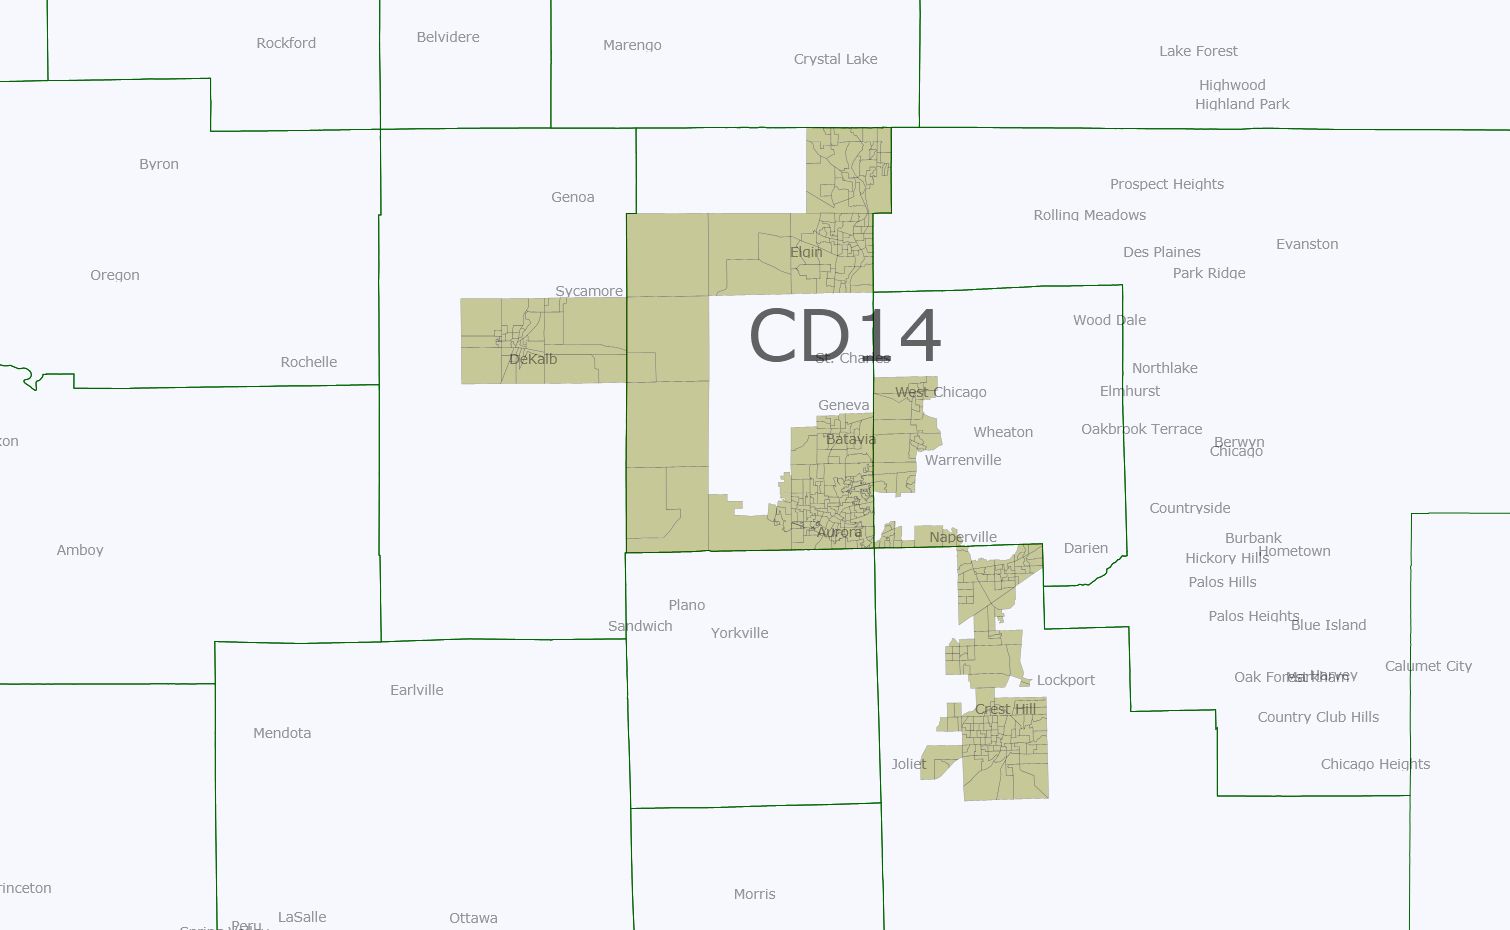
To make these points, I look into the weeds of one district in my budding map, a new Democratic-leaning 14th to elect Bill Foster back into Congress, connecting Aurora, and Joliet along with Elgin and Dekalb.  I imagine that Lake County/northern Cook will show a similar pattern when I get there, as will Rockford, Peoria, Springfield, etc.  But for now let’s look at the new 14th that I am hoping will get drawn.

Photobucket

New District 14th (Hultgren is being drawn, along with Roskam and Biggert, into a super Republican vote sink starting in Republican areas of Kane and snaking through Dupage and ending in super Republican areas of Will).  Foster lives in Batavia so this would be “his” district unless a Joliet politician primaried him.

Racial data: 49.3% white, 33.5% Hispanic, 11.1% Black, 4.4% Asian, thus technically “majority-minority” which was unintended but fortuitous all the same.  Illinois just amended its redistricting statute to emphasize, wherever possible and consistent with the VRA, the creation of coalition districts.  Also, the more I think it through, and the politics of it, I find it hard to convince myself that Democrats in Springfield will actually draw a second Hispanic seat, or that doing so would be required.  Hispanics still don’t vote in any sizable numbers in Chicago (look at the wards that Gutierrez has now if you doubt this), so would 65% and 57% districts really give Hispanics sufficient VRA protection to be able to select a candidate of their choice?  I am increasingly dubious.  So, draw a coalition district like this, plus one probably for Lipinski and you have something that is a compromise.

2010 congressional ballot (aggregating Foster, Harper, and Halvorson votes for areas pulled from the current 14th, 13th, and 11th, assuming for the sake of argument that a Democratic vote for congressman/woman in one district is a generic Democratic vote in another).

Generic Dem-Generic Rep: 80,538-67,285 (54.48%)

Some notable areas:

Aurora: 11,932-6,691

Elgin: 10,220-8,767

Dekalb: 5906-4004

Joliet: 12,461-6,331

Alexi does a bit worse but still carries this district slightly 50.74% to 49.26%, so it suggests to me that it would have withstood the 2010 GOP tidal wave (just).  Without knowing at all what the next ten years will bring, but being a bit cautious-minded, this might model well for what a 2014 2nd Obama midterm election (assuming his reelection) might look like, or for that matter 2018.  Our voters are more prone not to show up in off-year elections whereas the GOP’s are; it is a huge problem, and one that that we ought to be very realistic about when we draw our maps.

Okay, let’s look at two years earlier when Obama romped to his 25 point landslide in his home state.

Obama 161,485 – McCain 85,174 (65.47%… look at the swing between the two years)

Notable areas:

Aurora: 21,472-7,444

Elgin: 20,394-9,858

DeKalb: 12,456-4,333

Joliet: 22,748-6,023

Notice an alarming pattern here?  While we carried all four of these reliably Democratic cities in both cycles, the all-crucial pluralities coming out of them simply plummeted.  The less Democratic areas in the seat used to connect the cities did swing from Obama to generic Republican between 2008 and 2010 but this doesn’t account for the swing so much as our voters simply not showing up.  

Now, finally, let’s look at what a 2016 election without an Illinoian at the top of the ticket might look like.  We know what this probably looks like because we have Kerry 2004 to look at.  Again, Kerry would have carried my district, and by a healthy 54-46% margin.  But the Obama 2008 turnout numbers were historic and probably cannot be counted on across an entire decade worth of political cycles.

(Caveat: Will County doesn’t have publicly-available precinct data going back before 2005, much to my annoyance.  What I did, therefore, was estimate what the likely vote share would have been for the part of Will in this district by extrapolating its 2008 numbers back onto 2004…. E.g., if 60% of Obama’s total 2008 vote came from this portion alone, I am assuming that 60% of Kerry’s county-wide total came from this portion as well.  A bit of an if given likely greater turnout in Joliet than elsewhere, but probably not affecting the topline total much).

119,000 Kerry – 101,000 Bush (~54%)

Notable areas:

Aurora: 17,249-13,057

Elgin: 14,359-14,486

DeKalb: 10,118-6,957

Joliet: probably 16-17,000 Kerry, 8-9,000 Bush

Having eyeballed the data for the rest of the state but not actually tallied it up precinct-by-precinct yet beyond some of the Chicagoland seats, I can vouch for this being repeated in loads of other places in the state other than Chicago.  Chicago turned out fine in 2010; it is why Governor Quinn was re-elected.  The rest of the coalition that adds up with Chicago to form 55-57% of the electorate most neutral years did not, and that is why we have Republicans representing Joliet, the Fox Valley, and Rock Island of all places.

Moderates vs. Independents Part I (Introduction, 2010 chart)

So I'm sure that everyone here is familiar with the simplistic analysis about Independents, that they're all swing voters, that they're all somehow supporting something coherent, that they are, like their namesake, completely independent from either political party. Savvy political analysists have long understood that the number of truly Independent voters is a lot smaller than the self-identification numbers suggest, but that doesn't stop even the most savvy of political analysists from assuming that Independent = Moderate. Not only is this wrong, it's actually the case that even moderate voters are not the swing voters that the media makes them out to be.

For example, would it surprise you to learn that in 2010, when Republicans absolutely destroyed Democrats in the House, Democrats won moderates 55-43? Or maybe you'd be interested to learn that Blanche Lincoln, after losing the election to John Boozman by 21 points that she had won moderates by 14 points.

Independents, as one might expect, went very big for the Republicans, favoring them to the Democrats by a 56-37 point margin. This should serve as a strong reminder as to why Independents are not moderates and why moderates aren't necessarily swing voters.

To read the chart that's below the fold, the Independent/Moderate numbers are the percentages that Democratic candidates got, the comparison is how much more Democratic the moderate vote was compared to the Independent vote. The final number is how well the Democratic candidate did among moderates relative to Independents. The only races here are ones with exit poll data from 2010 (hence why DE-AL and VT-AL are part of the data).Also the Y and N show whether or not the Democratic candidate won the moderate vote. Also, in the case of FL-Sen, I combined Crist's numbers and Meeks's numbers together for purposes of this analysis. Alvin Greene's numbers in South Carolina are also his own, but it's also worth mentioning that 13% of the moderate vote went to the Green nominee, Tom Clemonts, meaning that the combined moderate vote in South Carolina went 53% against DeMint even as the vote went 63-37 for him.

And without further ado, the data:

  Independent Moderate Comparison   Mod won? D vote  Mod compared to actual vote
AZ-Sen 29% 45% 16%   N 35% 10%
AZ-Gov 40% 59% 19%   Y 43% 16%
AR-Sen 25% 55% 30%   Y 37% 18%
AR-Gov 59% 79% 20%   Y 64% 15%
CA-Sen 42% 58% 16%   Y 52% 6%
CA-Gov 42% 59% 17%   Y 54% 5%
CO-Sen 37% 60% 23%   Y 48% 12%
CO-Gov 39% 64% 25%   Y 51% 13%
CT-Sen 48% 56% 8%   Y 55% 1%
CT-Gov 38% 50% 12%   Y 49% 1%
DE-Sen 48% 66% 18%   Y 56% 10%
DE-AL 47% 66% 19%   Y 57% 9%
FL-Sen 48% 64% 16%   Y 50% 14%
FL-Gov 44% 60% 16%   Y 48% 12%
HI-Sen 69% 83% 14%   Y 75% 8%
HI-Gov 51% 59% 8%   Y 58% 1%
IL-Sen 28% 51% 23%   Y 47% 4%
IL-Gov 29% 51% 22%   Y 47% 4%
IN-Sen 34% 52% 18%   Y 40% 12%
IA-Sen 28% 42% 14%   N 33% 9%
IA-Gov 41% 55% 14%   Y 43% 12%
KY-Sen 42% 57% 15%   Y 44% 13%
LA-Sen 32% 48% 16%   Y 38% 10%
MO-Sen 31% 52% 21%   Y 41% 11%
NV-Sen 44% 66% 22%   Y 50% 16%
NV-Gov 32% 53% 21%   Y 41% 12%
NH-Sen 35% 43% 8%   N 37% 6%
NH-Gov 53% 68% 15%   Y 53% 15%
NY-Sen 54% 75% 21%   Y 66% 9%
NY-Sen* 50% 69% 19%   Y 63% 6%
NY-Gov 49% 71% 22%   Y 63% 8%
OH-Sen 27% 48% 21%   Y 39% 9%
OH-Gov 37% 58% 21%   Y 47% 11%
OR-Sen 47% 61% 14%   Y 57% 4%
OR-Gov 43% 52% 9%   Y 49% 3%
PA-Sen 45% 60% 15%   Y 49% 11%
PA-Gov 41% 53% 12%   Y 46% 7%
SC-Sen 14% 40% 26%   N 28% 12%
SC-Gov 41% 63% 22%   Y 47% 16%
TX-Gov 40% 62% 22%   Y 42% 20%
VT-Sen 68% 68% 0%   Y 64% 4%
VT-Gov 51% 42% -9%   N 50% -8%
VT-AL 69% 66% -3%   Y 65% 1%
WA-Sen 41% 57% 16%   Y 52% 5%
WV-Sen 51% 67% 16%   Y 54% 13%
WI-Sen 43% 58% 15%   Y 47% 11%
WI-Gov 42% 56% 14%   Y 47% 9%
 Average 42.30% 58.45% 16.15%   Y 49.38% 9.06%

A Look at Southern Texas Redistricting

I was working on an extended redistricting of Texas, but I accidentally closed out the file! I had saved it using an .RTF, but I don’t know how to open it (can anyone help with that??). But anyway, I did take a photoshot of Southern Texas before I closed out, and I think it might be worthwhile to examine what redistricting will look like along the border.

Photobucket

I used the 2010 Census numbers for this, so all follow the VRA. I also plugged in the partisan data for TX-23 and found that if you attach the district to San Angelo, you get a Obama 44% district and VAP of 59% Hispanic. Pretty cool!

I drew an extra fajita strip (purple) that went about 49% for Obama, while being around 60% VAP. The other Hispanic districts (TX-15, 20, 28, 35) are all around 70% VAP. The new TX27 (green) is safe for Farenthold (back-of-the-envelope calculations say that it went 41% for Obama).

Also, as you can see, McCaul is significantly safer, it’s now a 38% Obama district. However, and this is important, the estimations under the partisan data are wildly different than the actual Census numbers: the district is actually far more Hispanic under the 2010 numbers. In fact, it’s only 60% white VAP, and less so with the total numbers. Austin is far more Hispanic that one would imagine.

Also, Carter is made a lot safer in his district by removing Killeen to the super-duper red TX-11.

So tell me what you think! Sorry I don’t have the rest available–I will if someone helps me out. I do think this is what’s going to happen, though.

Wisconsin Senate: What was lost and what remains

With the Wisconsin Senate’s Democratic caucus in the news recently, I thought I would look at its composition and, since the chamber flipped in 2010, what the “lost” seats looked like geographically/demographically.

Wisconsin has 8 Congressional districts and 33 Senate districts, each of which contains 3 Assembly districts.  That works out to about 4 Senate districts per Congressional districts, and that’s how I’m going to loosely divide them up, although it will be rougher in places than others.

The Congressional districts: http://legis.wisconsin.gov/lts…

and the Senate districts:

http://legis.wisconsin.gov/lts…

Gwen Moore’s Milwaukee Congressional district corresponds to state Senate districts 3, 4, 6, and 7.  All are Democratic-held, although Ballotpedia points out that District 7’s Chris Larson was one of a small handful of candidates to beat an incumbent state Senator in a primary.  (District 7 snakes around covering coastal Milwaukee).  A number of Assembly districts in these Senate districts are actually Republican-held, and some seem to be suburban, but I’m going to look at that in another diary.

Jim Sensenbrenner’s affluent suburban Milwaukee district can correspond to state Senate districts 5, 8, 33, and 20 (as well as some of 13).  All are Republican-held, and District 5 flipped in 2010.  From its appearance I guessed that it was a classic ritzy inner-ring suburban district, and so it appears to be (although one of its assembly districts is actually in Milwaukee proper).  Check out the median income map: http://legis.wisconsin.gov/lrb…

Paul Ryan’s district in the southeast corner of the state can correspond to districts 11, 21, 22, and 28 (as well as some of 15).  All are Republican-held except for District 22, more or less coterminous with Kenosha County.  According to Wiki, it’s actually considered part of the Chicago metro area.  District 21, right above it, flipped in 2010.  It also appears affluent, although less so than District 22.

Tammy Baldwin’s Madison-area district can correspond to districts 15, 16, 26, and 27 (as well as some of 13 and 14).  All are Democratic-held.  Interesting note: District 26, covering Madison proper, is represented by Fred Risser.  As per Ballotpedia, he is the longest-serving state legislator in the United States, having first been elected in 1963.

The northern, Green Bay-ish district formerly represented by Steve Kagen and now by Reid Riggle can correspond loosely to districts 1, 2, 30, and 12 (it also has some of 14, at least).  30 and 12 are Democratic (30 seems to correspond to the city of Green Bay, while 12 is very large and rural) while 1 and 2 are Republican–perhaps why it is such a swingy district.  

Tom Petri’s district stretches, presumably, between the Milwaukee and Madison suburbs.  It is the hardest to fit into Senate districts, covering parts of 9, 13, 14, 18, 19, and 20.  Anyway, all are Republican, and none flipped in 2010.

Ron Kind represents a district with a reputation for a rare combination of ruralness and Democratic-friendlishness.  I’m going to call it more or less Districts 17, 23, 31, and 32, it also has part of 10.  Districts 31 is held by a Democrat, and Districts 10, 17, 23, and 32 by Republicans.  Doesn’t make Kind’s district look like very friendly territory, but then District 23 just flipped in 2010.  It contains some of Eau Claire, but I can’t tell too much interesting about it.  I would be interested to know what explains the state/fed difference here.

Finally, Dave Obey’s old district, now represented by Sean Duffy, covers Districts 24, 25, and 29, as well as the rest of District 10 and some of Districts 23 and 12.  This Congressional district, of course, flipped in 2010, and so did one of its parts, Senate District 29 (and 23).  District 29 contains some wealthy areas, amusingly, they seem to correspond to the village of Rothschild(!).  Districts 24 and 25 remain in the D fold; District 24 is represented by unsuccessful 2010 Congressional nominee Julie Lassa.

In short, the Wisconsin Senate Dem caucus seems to unsurprisingly mirror its Congressional delegation.  Of its 14 seats, 8 more or less line up with the Milwaukee and Madison areas represented by Moore and Baldwin.  Of the remaining 6, one is in Chicagoland, one covers Green Bay, one includes much of Eau Claire, and the remaining three include two large, Canada-bordering rural districts and Lassa’s 24th.  Of note, only odd-numbered seats were up in 2010, so it is possible that 12 and 24, two of these last three, got spared by chance  while the adjacent 23 and 29 flipped.

Anyway, I am always wondering where state-level Dems are, so I thought I would summarize it up for y’all.  I welcome corrections and comments from more Wi-knowledgeable readers.

House Dem voter attrition in 2010

Conventional wisdom has it that turnout is the key issue in midterm elections. In view of that, how well did individual House Democrats do in convincing their 2008 voters to back them again in 2010? This post looks only at total votes, not margin of victory or defeat. Members who did not run in 2008 (Bill Owens, Mark Critz, Scott Murphy) or who had no Republican opponent in 2008 are excluded. The remaining 198 members’ average 2010 vote was just 61.2% of their 2008 vote. Curiously the median was also 61.2%. These folks managed to retain at least 70% of their 2008 vote:

rep                   dist 2008          2010 retention

Pelosi             CA 8 204,996 167,957 81.9

Pingree           ME 1 205,629 166,196 80.8

Schrader         OR 5 181,577 145,319 80.0

Hirono             HI 2 165,478 132,290 79.9

McDermott       WA 7 291,963 232,649 79.7

Eshoo               CA 14 190,301 151,217 79.5

Giffords         AZ 8 179,629 138,280 77.0

Titus               NV 3 165,912 127,168 76.6

Blumenauer     OR 3 254,235 193,104 76.0

Speier             CA 12 200,442 152,044 75.9

Matsui             CA 5 164,242 124,220 75.6

Lee                   CA 9 238,915 180,400 75.5

Woolsey           CA 6 229,672 172,216 75.0

Lujan               NM 3 161,292 120,048 74.4

Bright             AL 2 144,368 106,865 74.0

Inslee             WA 1 233,780 172,642 73.8

Honda               CA 15 170,977 126,147 73.8

Dicks               WA 6 205,991 151,873 73.7

Tonko               NY 21 171,286 124,889 72.9

Himes               CT 4 158,475 115,351 72.8

Sarbanes         MD 3 203,711 147,448 72.4

Richardson     CA 37 118,606 85,799 72.3

Lofgren           CA 16 146,481 105,841 72.3

G Miller         CA 7 170,962 122,435 71.6

Larsen             WA 2 217,416 155,241 71.4

Schiff             CA 29 146,198 104,374 71.4

Napolitano     CA 38 119,795 85,459 71.3

Stark               CA 13 166,829 118,278 70.9

Sherman           CA 27 145,812 102,927 70.6

Roybal-Allard CA 34 98,503 69,382 70.4

Farr                 CA 17 168,907 118,734 70.3

A Smith           WA 9 176,295 123,743 70.2

McNerney         CA 11 164,500 115,361 70.1

Here we have 24 reps from the west coast vote-by-mail states of California, Oregon, and Washington and 9 from the rest of the country. David Wu and Peter DeFazio went unopposed (at least by Republicans) in 2008 and Brian Baird retired, so every eligible rep from Oregon and Washington shows up on this list. We also see a lot of people from completely uncompetitive districts. Nancy Pelosi and Jim McDermott put up nice numbers, a function of their dogged, relentless campaigning…heh. A function of most of their constituents being unwilling to consider voting for a Republican under any circumstances.

It would be more interesting to limit the list to people who actually faced a credible threat and thus had to run a serious campaign. As a first approximation, cut out anyone whose district is D+10 or better. Here’s the top 10:

rank rep   dist   2008       2010       retention pvi

1 Pingree   ME 1 205,629     166,196     80.8      8

2 Schrader OR 5 181,577     145,319     80.0      2

3 Giffords   AZ 8 179,629     138,280     77.0      -4

4 Titus       NV 3 165,912     127,168     76.6      2

5 Lujan       NM 3 161,292     120,048     74.4      7

6 Bright     AL 2 144,368     106,865     74.0      -16

7 Inslee     WA 1 233,780     172,642     73.8      9    

8 Dicks       WA 6 205,991     151,873     73.7      5

9 Tonko       NY 21 171,286    124,889     72.9      6

10 Himes       CT 4 158,475     115,351     72.8      5

8 of the 10 are in blue districts and 6 of these are D+5 or better. And then there’s Bobby Bright. Now for the bottom 10:

rank rep     dist     2008       2010 retention pvi

110 Grayson       FL 8 172,854    84,167 48.7 -2

111 Boyd               FL 2 216,804    105,211 48.5 -6

112 Childers       MS 1    185,959 89,388 48.1 -14

113 L Davis       TN 4 146,776    70,254 47.9 -13

114 Ortiz             TX 27 104,864    50,179 47.9 -2

115 C Edwards   TX 17    134,592 63,138 46.9 -20

116 Kosmas         FL 24 211,284    98,787 46.8 -4

117 Etheridge     NC 2 199,730   92,393 46.3 -2

118 C Gonzalez   TX 20 127,298    58,645 46.1 8

119 Taylor           MS 4 216,542    95,243 44.0 -20

9 of the 10 are in red districts, and 4 of those are really red. Charlie Gonzalez’ appearance on this list is  misleading as he was never in any trouble. He didn’t get his people out, but he didn’t need them. In any case, it’s understandably a lot harder for Dems to hold on to their presidential-year voters when a lot of them are normally inclined to vote red.

So the two basic rules appear to be: 1) People are more likely to vote in midterm elections when they can conveniently vote by mail, and 2) the bluer your district is, the less likely your voters are to swing against you in a red wave year. I did a simple regression analysis to compute members’ predicted retention based on the PVI of their districts and whether their state predominantly uses vote by mail. Using only the D+9 or lower district as the sample, each point of PVI increased retention by an average of about 0.25 percentage points and vote-by-mail increased it by an average of 7 points. The “diff” column shows the difference between actual retention and predicted retention. So here is the adjusted top 20 as measured by differential:

rank rep        dist    diff

1 Pingree     ME 1    19.6

2 Bright         AL 2    19.1

3 Giffords     AZ 8    18.9

4 Titus           NV 3    17.0

5 Lujan         NM 3    13.4

6 Schrader   OR 5    13.3

7 Himes         CT 4    12.3

8 Kratovil       MD 1    12.3

9 Tonko         NY 21    12.2

10 Perriello     VA 5    11.8

11 Sarbanes   MD 3    11.6

12 Arcuri           NY 24    10.0

13 Boswell       IA 3    9.6

14 Yarmuth       KY 3    9.0

15 Peters         MI 9    8.9

16 Courtney   CT 2    8.9

17 C Murphy   CT 5    8.8

18 Altmire       PA 4    7.2

19 Heinrich     NM 1    6.9

20 Boren         OK 2    6.8

And it’s still Chellie Pingree by a nose. Interestingly, the top 19 consists of 18 freshmen or sophomores and one Boswell. (Yep, the much-maligned Leonard Boswell arguably ran the best campaign of any House Dem with actual experience of serving in the minority.) This seems counterintuitive given that newer members have not had much time to build up goodwill and thus should be more vulnerable to losing support in a red wave year. Instead, it appears that these newer reps were used to having to scratch and claw for every vote and thus adapted more easily to an unfriendly environment than veteran reps who were used to winning easily did.

There was a big gap between #3 and #4 and an even bigger gap between #4 and #5. These four super-overachievers come from dissimilar districts and had dissimilar records and this time I don’t see a pattern:

Pingree was one of the few Dems to win by a bigger margin in 2010 than 2008, and this doesn’t appear to be any unobserved Maine-specific effect (Libby Mitchell coattails? heh) as Mike Michaud had a differential of just +4.8. This race did not get much attention, although it was considered competitive at one point. Was Pingree’s remarkable retention number a function of a sloppy campaign in 2008 or a brilliant one in 2010, or both?

Bright almost never voted with the Dems, but Gene Taylor didn’t either and Bright only retained 30% more of his 2008 vote than Taylor did! It still wasn’t enough to get him over the hump, but he came a lot closer than similarly situated dudes like Lincoln Davis, Chet Edwards, and Travis Childers.        

Gabrielle Giffords was the other red-district rep to make the unadjusted top 10. Her district is far more purple than Bright’s but she also took many more risks than he did, voting for TARP, the stimulus, cap and trade, health care, and financial reform. This did not appear to hurt her much with the Dems and swing voters who voted for her in 2008. Like Pingree, she got zero up-ballot help but unlike Pingree she just barely held her seat. Her voting record may have motivated the people who opposed her in 2008 to stick around and pull the lever for that megatool Jesse Kelly.

Unlike the top 3, Dina Titus got some indirect help in the form of Harry Reid’s fearsome operation. Titus probably deserves some credit for her strong showing, though. Shelly Berkley isn’t a perfect comparison (much higher baseline Dem vote but also a much less threatening opponent) and with a D+10 district just missed the regression sample, but her differential would have been +4.9, and 12 points is a big spread in any case.

Here is the adjusted bottom 20:

rank rep             dist          diff

100 B Miller           NC 13    -8.0

101 Nye                     VA 2    -8.1

102 Loretta Sanchez CA 47    -8.1

103 Space               OH 18    -8.1

104 Cuellar           TX 28    -8.3

105 Doggett           TX 25    -8.6

106 Boyd                 FL 2    -9.0

107 Taylor           MS 4    -9.9

108 Donnelly           IN 2    -9.9

109 Grayson           FL 8    -9.9

110 Filner             CA 51    -10.1

111 Hinojosa             TX 15     -10.2

112 Ortiz               TX 27    -10.8

113 Pallone           NJ 6    -11.3

114 Kosmas           FL 24    -11.3

115 Visclosky         IN 1    -11.6

116 Carnahan       MO 3    -11.9

117 Etheridge         NC 2    -12.4

118 C Gonzalez       TX 20    -15.2

119 Costa               CA 20    -17.8

There may be some unobserved variation related to demographics or state election laws, as the only state to put a rep in both the top 20 and the bottom 20 was Virginia. Glenn Nye managed to retain 20% less of his 2008 vote than Tom Perriello did despite voting with the Dems less often. Texas in particular was a sea of apathy for Dems, as the best performer was actually Chet Edwards at -6.9! That said, Bob Etheridge’s failures are his own, not North Carolina’s. Heath Shuler managed a +4.6 differential.

If you rightly ignore Gonzalez who won by 29 points, Jim Costa turned in the worst performance by a country mile. It’s true that his district is young and poor and heavily Hispanic, but so is Raul Grijalva’s, and Grijalva had a +3.6 differential without the benefit of vote by mail! (Grijalva’s big mouth probably ran up Ruth McClung’s vote total as opposed to depressing his own, as his margin of defeat was worse than even the hopeless Rodney Glassman’s in some counties.) We’ll see if Costa takes his narrow escape as a wake-up call, as commission redistricting is likely to put him in a less friendly district.

Just eyeballing the data, it appears that richer districts generally had more retention than poorer ones (note the 3 Connecticut dudes in the top 20 and the many south Texans in the bottom 20) so I may rerun the numbers once I find enough time to enter the median income of all the districts.

Some conclusions: Chellie Pingree and Leonard Boswell are underrated. Don’t be surprised to see Bobby Bright, Dina Titus, Frank Kratovil, Tom Perriello, and/or Michael Arcuri resurface. Keep an eye on Ben Lujan. Russ Carnahan and especially Jim Costa need to step it up. It may be premature to speculate about Gabrielle Giffords’ future (early signs are good), but she was a beast as of 2010. Vote by mail is great. The Texas Dems’ 2010 turnout was uglier than the Texas Longhorns’ 2010 offense.

Thoughts? (How do you post clean tables from spreadsheets? I tried saving them as PDFs but was unable to convert them to photos.)    

By what margin will Bob Shamansky win?

View Results

Loading ... Loading ...

Best and worst Democratic house challengers of 2010

In 2012, the Democrats are certainly going to have their work cut out for them if they want to retake the 25 seats they need to take back the house of representatives. Many of these gains will come from knocking off freshmen GOP reps who won in 2010, but in order to take back the house the Democrats will also probably have to run strong challenges against GOP incumbents who won reelection in 2010 but are potentially vulnerable in 2012. Often times, the person who was the challenger to an incumbent in the last election gets the nomination to challenge that incumbent in the next election by default (i.e. Dan Seals or Dino Rossi). These candidates may or may not be the best possible challengers (after all, they lost the last election), but it is often hard to tell whether their loss was due to a poor overall political climate, a tough district/incumbent, a badly run campaign, or some combination of the three. This diary is an attempt to make it at least a little bit clearer which of those factors was the case for all of the challengers on the Democratic side in 2010. Basically what I did is to take all the challengers in districts of a given PVI, group them together, and find the average percentage of the vote that they received. I ended up grouping multiple PVIs together in order to get more accurate averages, but that doesn’t matter much, as there is not a whole lot of difference between a district with PVI R+5 and a district with PVI R+7. Basically the question I am trying to answer here is: in a district with this partisan makeup, how well did Democrats do on average in 2010? Each candidate can then be compared to the average performance of democrats in 2010 in districts similar to their’s, in order to see whether they did significantly better or significantly worse than average. That should give us some measure of whether or not they were a good candidate.  

I’m not going to post all the data here in the interest of saving space, you can find the more detailed data in a Google Doc I compiled here . If you find any errors in this data, please let me know in the comments here and I will update ASAP. Here is the most important part, the average performance of Democratic challengers to house incumbents in each PVI grouping:

D+4-D+2:

Avg Dem challenger received 43.3% of the vote*.

D+1-R+1:

Avg Dem challenger received 35.5%.

R+2-R+4:

Avg Dem challenger received 34.9%.

R+5-R+7:

Avg Dem challenger received 33.7%.

R+8-10:

Avg Dem challenger received 31.9%.

R+11-13:

Avg Dem challenger received 31.1%.

R+14-16:

Avg Dem challenger received 30.0%.

*This one may be a little off, as there were only three challengers, Manan Trivedi in PA-06, Suzan Delbene in WA-08, and John Callahan in PA-15, that fit this PVI grouping

Now comes the important part: who did better and who did worse than average? Here are the good ones, the ones who did >5% better than the average performance of Democrats in similar districts:

Rob Miller (SC-02): +11.9%

Jim Reed (CA-02): +11.8%

Bill Hedrick (CA-44): +10.7%

Ami Bera (CA-03): +9.5%

Steven Segrest (AL-03): +8.6%

Steve Pougnet (CA-45): +7.2%

Tarryl Clark (MN-06): +6.1%

Ed Potosnak (NJ-07): +5.7%

Tom White (NE-02): +5.5%

Paula Brooks (OH-12): +5.5%

Timothy Allison (CA-24): +5.2%

Pat Meagher (CA-41): +5.1%

And the winner is… Rob Miller, running against Joe “You Lie!” Wilson in SC-02.

Now let’s take a look at the candidates that underperformed. Here are the candidates that did more than 5% worse than the average.

Philip Fedele (NY-26): -7.3%

Howard Kudler (NY-03): -6.8%

Joseph Kallas (WI-06): -5.6%

2010 Politicos of the Year

So, everyone else does lists at the end of the year. Why shouldn’t we? Here following, my picks for the 2010 Politicos of the year (in reverse chronological order).  

10. Suzana Martinez – NM-Gov

Martinez was a unknown district attorney when she took on Lt. Governor Dina Denish in a state that had not only overwhelmingly voted for Obama in 2008 but elected an all Democratic slate to Congress. She succesfully tied Denish into scandal-ridden outgoing governor Bill Richardson and won. The fact she did so in such a Democratic state makes her acheivement marginally more impressive than the Republicans other woman-minority governor-elect, Nikki Haley.

9. Lisa Murkowski – AK-SEN

Ran won of the worst primary campaigns in history, followed by the first successful write in campaign in 50 years. The kudos she deserves for the later far outweigh the mocking she deserves for the former.

8. Jerry Brown – CA-Gov

The former and future governor of California survived the most expensive attack campaign in American history. Almost without breaking a sweat.

7. Kamala Harris – CA-AG

A rising star, and the first woman to win this traditionally conservative law and order position. It’s no accident she’s being compared to Obama.

6. Rick Snyder – MI-Gov

“One tough nerd” managed to beat out three better known candidates in the Republican primary and crush his Democratic opponent in a state that gave Obama a landside win. Good luck with governing it.

5. Rick Scott – FL-Gov

Just as Time Magazine once picked the Ayatollah Khoemeni as “Man of the Year” we have to put Scott up there as a politician of the year. He beat out Florida’s AG for the nomination, and went on to defeat the much respected CFO of the state, despite being acclaimed as the “Madoff of Medicare,” among other titles.

4. Pete Sessions – R-Texas

It’s hard to single out one candidate in the Republican sweep of the House races this year, although some (Bob Dold? Chip Cravaack? Bill Flores) stand out. So, I’m putting Pete Sessions as a placeholder for everyone, because despite criticism about the NRCC’s tepid fundraising he managed to do better than either the RGA or the NRSC, partially through being very agressive about targeting races. Of course, we’ll see how he does in 2012, when the landscape may not be as promising.

3. Marco Rubio – FL-SEN

Almost everyone (except Kos) was declaring Rubio dead in the water when Charlie Crist released his first fundraising totals after announcing for Senate in 2009. Now, it’s Charlie Crist who is dead in the water, and Marco Rubio who is the potential Republican presidential candidate.

2. Harry Reid – NV-SEN

Here’s how much respect I have for Harry Reid as a politician: I think he would have beaten any of his opponents for Senate in 2010. He’s that good – his commercials were some of the best of the cycle.

1. Scott Brown – MA-SEN

It’s hard to believe that at the beginning of the year, it was assumed Martha Coakley, as Steve Singiser put it, “is likely to be the first woman elected to that chamber from the State of Massachusetts.” Even after all that’s happened since Brown’s victory, it’s hard to come up with a more shocking political result in a long time (the only one I can come up with is Harris Wofford’s win over Richard Thornburgh way back in 1991). What’s more, at this writing, Brown seems to be holding on to his popularity. Because Brown became the early face of the Republican wave that would sweep most strongly in the House elections, but also in the Senate, Governor and all the way down to the state legislatures, I think he should be 2010’s Politico of the Year.

WORST POLITICOS – 2010

1. Christine O’Donnell

Oh I hope she goes to jail. I really do. Even then, she probably won’t shut up. But I do have to say: thank you Erik Erickson and all the Tea Party organizations who gave us Dems a freebie in Delaware this year.

2. Joe Miller

Would have probably one a place as one of the best had he maintained his momentum after the primary. Instead, he lost to a write-in. Ultamite choke.

Del Ali

The head of polling organization Research 2000 is not a politician, but he was involved enough in politics that he makes my worst list for this year. Hope Kos wins his lawsuit.

Alan Grayson

Republicans should send a big thanks to Grayson for taking so much cash from well meaning progressives to fund an 18 point loss – one of the worst of any incumbent this cycle.

Blanche Lincoln, Paul Hodes (tie)

I guess you can give Lincoln credit for beating Bill Halter in the primary, but considering she was chairman of a major committee (Agriculture) in the Senate, shouldn’t she have been able to keep this race closer than a 22 point spread? As for Hodes, remember back in 2008 when Kos told us Hodes would finish off Judd Gregg (or whoever took Gregg’s place) in 2010? Yeah, well Hodes lost by almost 24 points. That was worse than Lee Fisher, or almost anyone else in a supposedly competitive race.  

2010 SSP Election Prediction Contest: RESULTS!

We were going to wait for all results to be fully official before announcing our contest results (and awarding babka), but Joe “Norm Coleman” Miller seems to refuse to give it up (not even at the urging of Norm “Norm Coleman” Coleman).

Results were calculated as follows:

  • For the two-way races, we asked you for a winner and a margin. We take the difference of your predicted margin and the real margin (including third party candidates), and add that to your “regular” score.

  • For the three-way races, we asked you for the percentage each candidate was going to get. Again, we take the difference of your prediction and the actual percentage earned by the candidate, and add that to your “three-way” score.

  • Your total score is the sum of the “regular” and “three way” scores, with a lower score being better.

  • If you didn’t enter a margin/vote percentage (or we couldn’t understand what you entered), you got a “penalty” equal to the maximum score from a given race.

So a few summary statistics, by race:

  • CT-Gov: 69% of you correctly guessed that Dan Malloy would win. Average margin was Malloy by 1.52%.

  • OH-Gov: 57% of you correctly guessed that John Kasich would win. Average margin was Kasich by 1.53%.

  • OR-Gov: 90% of you correctly guessed that John Kitzhaber would win, on average by 3.39%.

  • CO-Sen: 57% of you correctly guessed that Michael Bennet would win. However, the average margin was Ken Buck by 0.40%

  • NV-Sen: 66% of you correctly guessed that Harry Reid would win, on average by 0.30%.

  • WI-Sen: 91% of you correctly guessed that Ron Johnson would win, on average by 5.17%.

  • FL-25: Only 47% of you guessed that David Rivera would win, but the average predicted margin was Rivera by 0.45%.

  • PA-07: 75% of you correctly guessed that Pat Meehan would win, by 2.96% on average.

  • VA-11: 79% of you guessed that Gerry Connolly would win, and correctly so; the average predicted margin was 2.81%.

In the three-way races:

  • MN-Gov: Average prediction was Dayton 44.45; Emmer 39.68; Horner 14.75.

  • AK-Sen: Average prediction was McAdams 31.88; Miller 33.36; Murkowski 33.62.

This could almost be a testament to the wisdom of crowds (…or alternatively, the central limit theorem) – as a collective whole, only one race would have been called incorrectly. If averages were an entry, it would have placed 21st.

So, of course, having done our best Census Bureau impression (at least we haven’t congratulated ourselves excessively!) – who won?

itskevin, abgin, and UpstateNYer come on down! (And by “come on down”, I mean “email DavidNYC with contact information” …) Sidenote: remember, you had to have submitted your entries before 5pm EDT on Election Day – and had (and still have) a valid account at the time of announcement of contest.

Full results are available here. Thanks to everyone who participated!

If you didn’t win, don’t worry, there may or may not be a prediction contest for the Chicago mayoral race, too. I see David’s babka and raise him one deep dish. That, or some dead fish wrapped in a copy of the Trib, depending on how we feel.