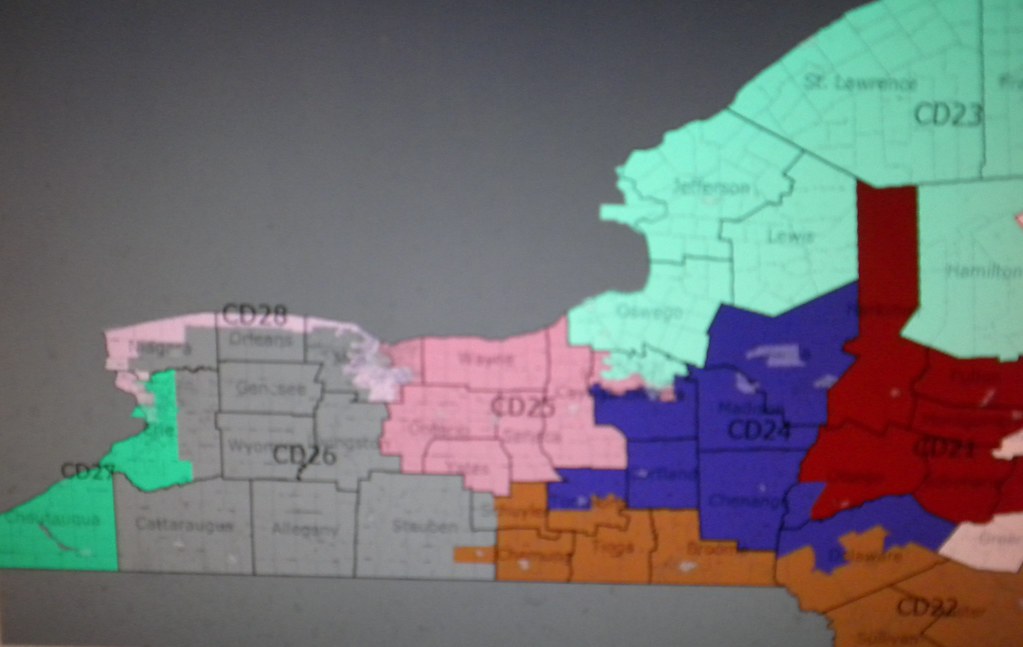
Here’s my contest entry, creating a 27-1 redistricted map for the State of New York.
I had several goals in mind, most lining up with the contest rules anyway.
Here were some of my guiding principles:
* Keep incumbents’ homes in their current districts where possible.
* Pay special attention to good Democrats in bad or mediocre districts.
* Don’t get greedy and gamble too much; don’t repeat the mistakes the GOP made in Pennsylvania and Ohio 10 years ago and turn safe districts into vulnerable ones.
* Comply with all VRA mandates, but don’t overpack minority-majority districts.
I didn’t, in most cases, pay a lot of attention to keeping counties together. I kept most cities, other than NYC obviously, in one district most of the time. (I think whoever posted that comment in someone else’s contest entry that Staten Islanders would be angry at whoever approved a plan to split Staten Island was dead on.)
I tried to stay away from ridiculous gerrymanders for the most part, but had to succumb in a few instances. With the exception of placing Rikers Island (accessible by bridge from Queens but not the Bronx, even though it is considered part of Bronx County) in the Bronx-based NY-16 I did not create any district whose parts whose only contiguity was open non-bridged/tunneled water.
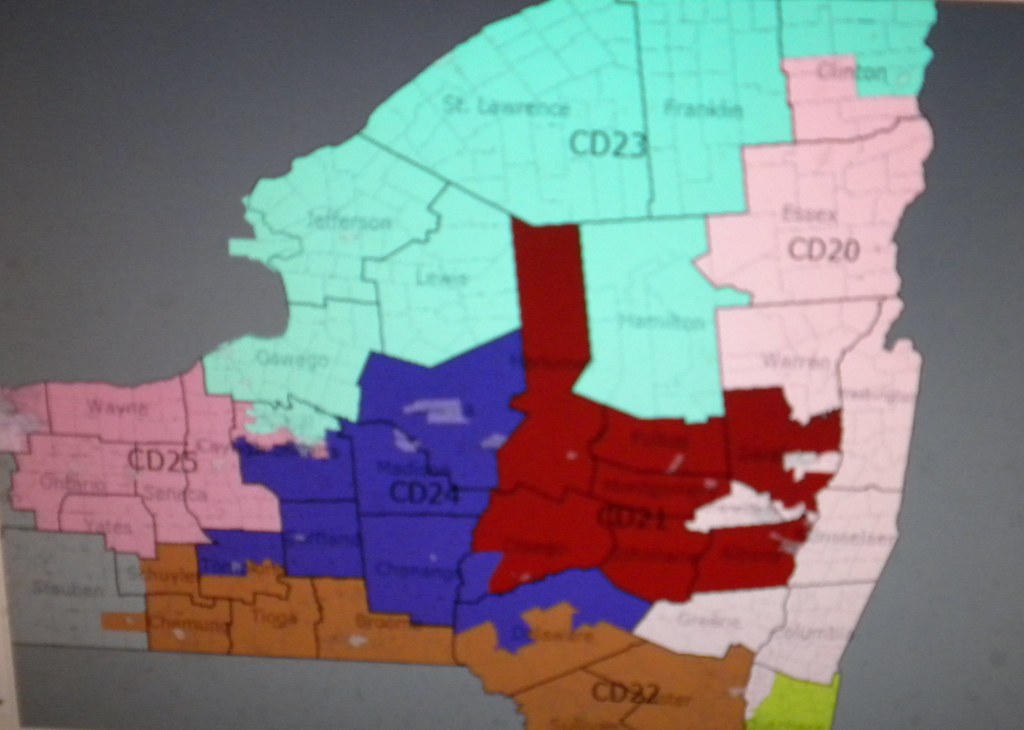
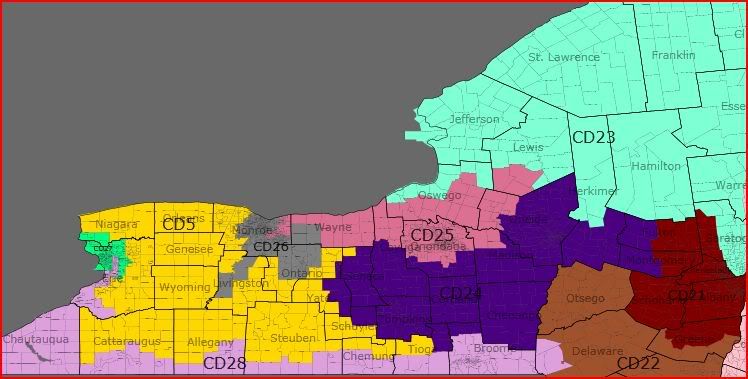
Upstate
Upstate New York Map
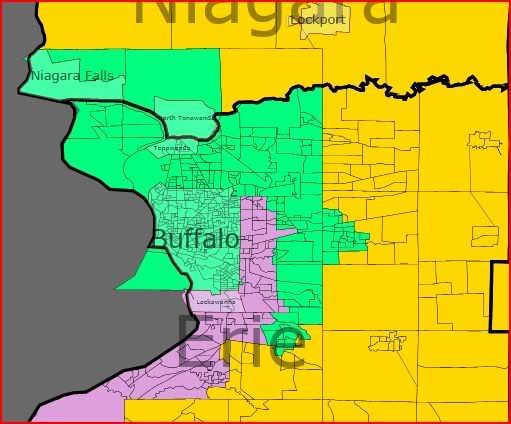
Buffalo Area Map
Rochester Area Map
Albany Area Map
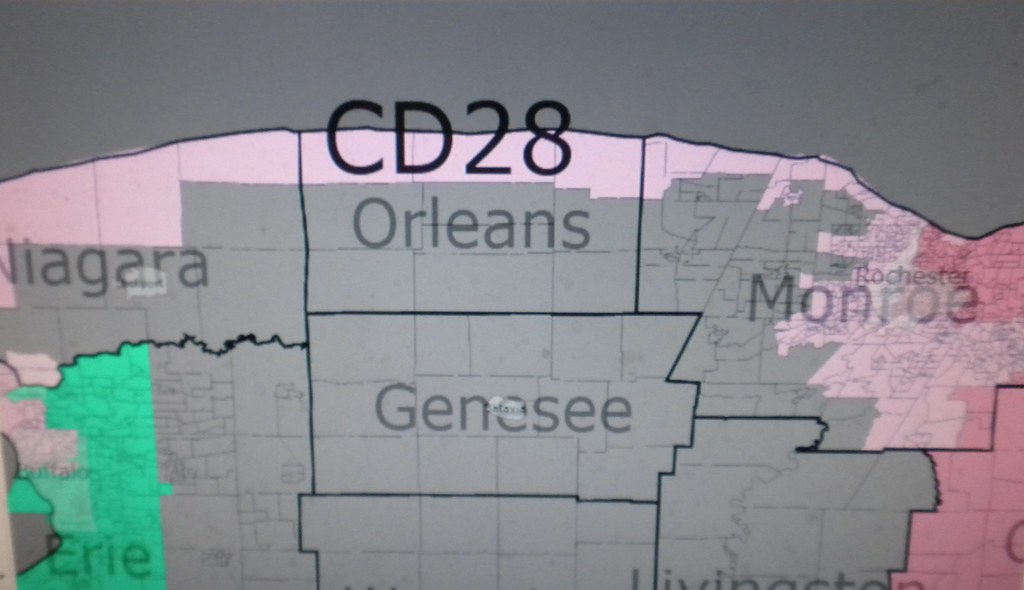
NY-28 (Pale Pink)
Presidential Data –
Old NY-29: McCain 51-48
New NY-28: Obama 51-47 (+4D)
Demographic Data –
Old NY-29: 93% White, 3% Black, 2% Asian, 1% Hispanic
New NY-28: 92% White, 3% Black, 2% Hispanic, 1% Asian
Incumbent: Eric Massa (D-Corning)
Description: Running along a narrow strip the Southern Tier along the Pennsylvania border from Delaware to Cattaraugus County, then including all of Chautauqua and parts of Erie County. Essentially replaces the current NY-29.
Comments: Yeah, this one is a bit unwiedly. Most of the smaller towns of the Southern Tier are so intensely Republican that this district had to run a long way to become a Democratic district. Most of that strength comes from the opposite ends of the district’s length – one end that includes most of the Binghamton metro area and another end covering certain southern and western suburbs of Buffalo, particularly strongly Democratic portions of Lackawanna, West Seneca, and Cheektowaga. In between the pickings are slim; there’s the whole of Chautaqua County, notably less hostile to Democrats as a whole than the counties between there and Binghamton. NY-28 seeks out the more Democratic cities and towns in an otherwise Republican area, including Alfred, Wellsville, Elmira, and, conveniently enough, Eric Massa’s home of Corning. The big change is the new NY-28, unlike the old NY-29, goes nowhere near Rochester. Nearly 25% of the district’s population is in Erie County.
Bottom Line: Still a marginal district, but a little better given that any Republican challenger is going to have to make himself known in both the Binghamton and Buffalo markets. Of course, so is Massa. He’s been a terrific Congressman, so hopefully he can hold on.
NY-27 (Seafoam Green)
Presidential Data –
Old NY-27: Obama 54-44
New NY-27: Obama 62-37 (+8D)
Demographic Data:
Old NY-27: 91% White, 5% Hispanic, 4% Black, 2% Asian
New NY-27: 76% White, 16% Black, 4% Hispanic, 2% Asian
Incumbent: Brian Higgins (D-Buffalo)
Description: Contains portions of Erie and Niagra counties, including the entire cities of Buffalo, North Tonawanda, and Niagra Falls.
Comments: This district shifts northward, taking in all of Buffalo and most of the inner suburbs, such as Amherst and Tonawanda, that are not in NY-28. The old district went south of Buffalo instead and included a fair amount of hostile territory, because it was created for Republican Jack Quinn. The Democratic numbers here improve dramatically due to the inclusion of the whole of Buffalo rather than losing the most Democratic parts to the notorious “earmuffs” of the current NY-28.
Bottom Line: Given Democrats’ trouble in parts of the decaying industrial Rust Belt, the old district could have been vulnerable, but this new district seems pretty safe for Higgins and his successors.
NY-5 (Golden Yellow)
Presidential Data –
Old NY-26: 52-46 McCain
New NY-5: 57-41 McCain (+5 R)
Demographic Data:
Old NY-26: 93% White, 3% Black, 2% Hispanic, 1% Asian
New NY-5: 95% White, 2% Black, 1% Hispanic
Descriptions: Containing all of three counties, and portions of eleven more, this sprawling (and yet reasonable-looking) piece of territory covers the most Republican portions of the Buffalo and Rochester suburbs, the largely Republican turf between them, and most of the strongly GOP rural Southern Tier…you get the idea. [Note: I labelled this district as “NY-5” because, well, it seemed the best color contrast with the other districts in the area; in my first draft of this map, the 5th and 18th districts had a long border, which was annoying since they were similar shades of yellow.]
Incumbent: Chris Lee (R-Clarence)
Comments: All the Republicans in western New York (with a few from Central New York thrown in for good measure) had to go somewhere, and this is where I stuffed as many of them as I could. For the price of keeping other Democrats safe, I wrote this one off. It didn’t make any sense to me to have as many 50-50 Buffalo and Rochester suburbs in there as the current 26th does.
Bottom Line: Safe Republican. You can’t win ’em all.
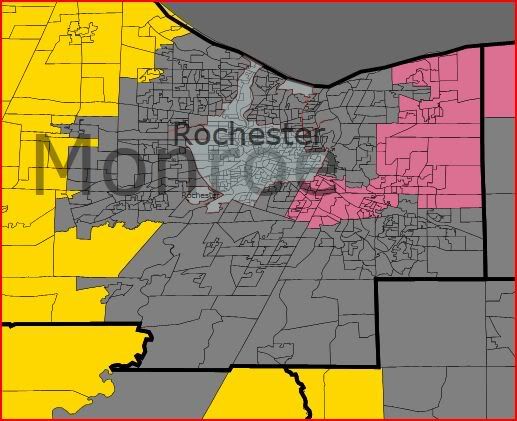
NY-26 (Dark Gray)
Presidential Data –
Old NY-28: Obama 69-30
New NY-26: Obama 59-40 (-10D)
Demographic Data:
Old NY-28: 64% White, 30% Black, 5% Hispanic, 2% Asian
New NY-26: 78% White, 13% Black, 5% Hispanic, 2% Asian
Incumbent: Louise Slaughter (D-Perinton)
Description: No more earmuffs; this district is now firmly in the Rochester orbit as the portions in and around Buffalo are gone. It includes all of the city of Rochester and the majority of its suburbs, excluding the most Republican areas to the west and a few eastern suburbs that are in NY-25. It’s mostly in Monroe County, with some portions of Wayne, Ontario, and Livingston in there as well. Basically replaces the existing NY-28.
Comments: This is a signifcantly weaker district for Democrats without Buffalo, but I’m not too worried. The two appendages to the south are one into Livingston County to grab college town Geneseo and the other into Ontario County to get the city of Candindiagua.
Bottom Line: Slaughter trades a less Democratic district for not having to cover Buffalo anymore. She and her Democratic successors should still be fine. There are a lot less wasted votes here now.
NY-25 (Salmon Pink)
Presidential Data –
Old NY-25: Obama 56-43
New NY-25: Obama 56-43 (unch.)
Demographic Data:
Old NY-25: 88% White, 7% Black, 2% Hispanic, 2% Asian
New NY-25: 88% White, 6% Black, 2% Hispanic, 2% Asian
Incumbent: Dan Maffei (D-DeWitt)
Description: The current NY-25 is very close to the existing district. Anchored now as before by Syracuse, it includes most of Onondaga County, including all of Syracuse; to the east it includes portions of Oswego, Madison, Oneida, and Lewis Counties, while to the west it includes northern Cayuga County, most of Wayne County and a few Rochester suburbs in Monroe County.
Comments: Few changes. All districts had to expand a little bit, so the new NY-25 takes in a few rural areas in Lewis and Madison as well as a few Republican communities in the Rome-Oneida area so as to help NY-24. It includes fewer and different Rochester burbs from the old district.
Bottom Line: Pretty much the same. Maffei should be fine here absent a strong challenger.
NY-24 (Dark Purple)
Presidential Data –
Old NY-24: Obama 51-47
New NY-24: Obama 52-46 (+1D)
Demographic Data:
Old NY-24: 93% White, 3% Black, 2% Hispanic, 1% Asian
New NY-24: 91% White, 3% Black, 2% Hispanic, 2% Asian
Incumbent: Michael Arcuri (D-Utica)
Description: Containing all or part of 14 counties, it’s based around the cities of Utica, Rome, and Oneida. It includes most of Oneida and Madison Counties and the whole of Tompkins, Cortland and Chenango Counties. It also includes most of Seneca and Cayuga, small parts of northern Tioga and Broome and southern Onondaga, the southern (more populated) half of Herkimer County and the western (less populated) halves of Fulton and Montgomery Countes, the area around Geneva in Ontario County and the Town of Hector in Schuyler County.
Comments: Formerly Republican turf, it’s now a swing district. Adding all of Tompkins County, including Ithaca (NY-22 no longer needs it, as I’ll explain below) helps Democrats, and the small towns in the Finger Lakes region are less hostile to Democrats than similar towns to the north and west. NY-24 was a frustrating one to draw for me for a variety of reasons. Rome-Utica is a weak basis for a Democratic district to begin with, adding Ithaca only helps so much, and because, again, all the upstate districts had to get bigger (this one even more than some) there was really nothing available to add to it apart from Republican rural areas. So the best I could do without endangering better Democrats than Arcuri has been is to improve it by one point and hope that and incumbency are enough.
Bottom Line: A little better. Still a tough district for Democrats, even a conservative one like Arcuri. Should a Republican prevail here in 2010, it’d be a good candidate to carve up.
NY-23 (Pale Blue)
Presidential Data –
Old NY-23: 52-47 Obama
New NY-23: 53-46 Obama (+1D)
Demographic Data:
Old NY-23: 94% White, 3% Black, 2% Hispanic, 1% Native American, 1% Asian
New NY-23: 93% White, 2% Black, 2% Hispanic, 1% Native American, 1% Asian
Incumbent: Bill Owens (D-Plattsburgh)
Description: Contains most of what is known as the North Country. The big changes are that it stays further away from Syracuse and Rome but that it now includes most of the Saratoga Springs area as well as all of Essex County and most of the land area of Warren County. (Glens Falls is still out so that it can still be in Scott Murphy’s NY-20.)
Comments: Looks mostly the same as before except that as NY-24 and NY-25 have expanded a bit to the north and east, NY-23 has had to dip down into the Capital Region. This change has the nice side effect of making it slightly more Democrat-friendly.
Bottom Line: Bill Owens is still going to have a challenging district, but some fairly hostile turf has been replaced by some decent territory around Saratoga Springs. Nonetheless, should a Republican win here in 2010, it’d be a good candidate for carving up.
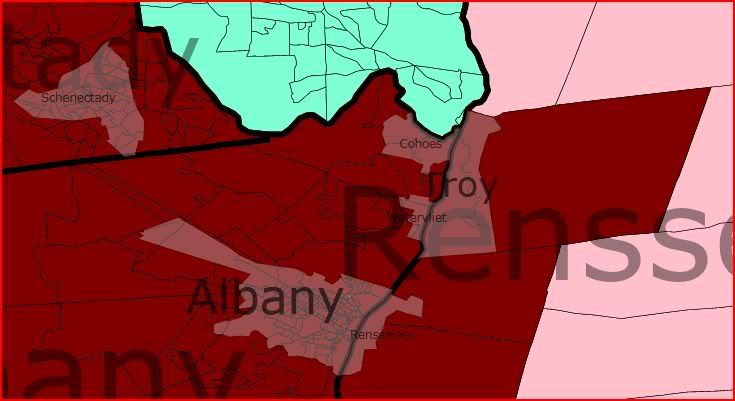
NY-21 (Dark Brown)
Presidential Data –
Old NY-21: Obama 58-40
New NY-21: Obama 57-41 (-1D)
Demographic Data:
Old NY-21: 87% White, 8% Black, 3% Hispanic, 2% Asian
New NY-21: 86% White, 7% Black, 3% Hispanic, 2% Asian
Incumbent: Paul Tonko (D-Amsterdam)
Description: Includes most of the Albany-Troy metro area, including all of Albany, Schenectady, and Schoharie Counties and portions of Rensselaer, Saratoga, Greene, Fulton, and Montgomery.
Comments: Essentially it’s the same district. It’s a little weaker than the current district because it had to expand and only had hostile Republican turf (new portions of Greene, Fulton, and Saratoga on the periphery) available to add.
Bottom Line: Should still be a reasonably safe district for Tonko and his Democratic successors.
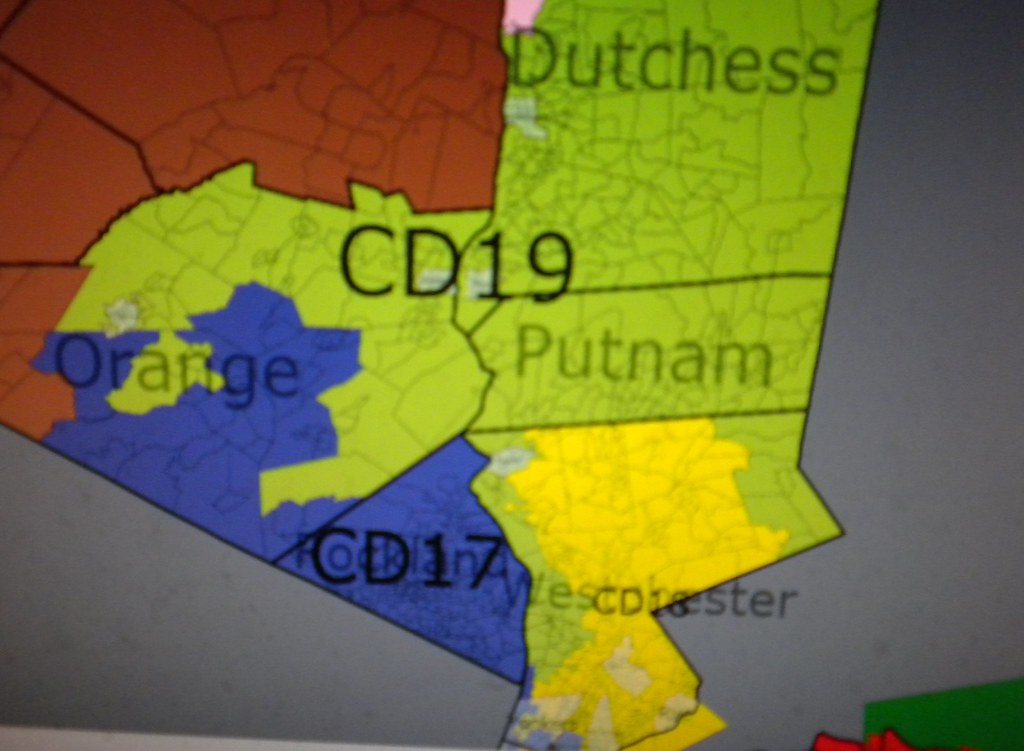
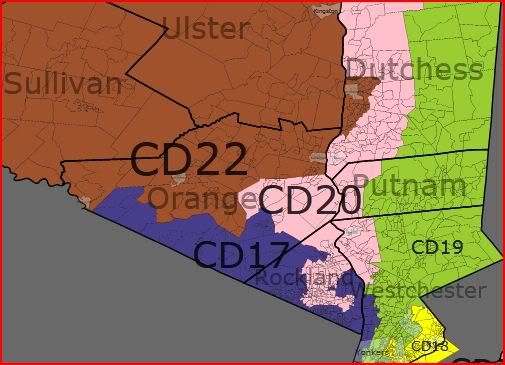
Hudson Valley Region
Hudson Valley Area Map
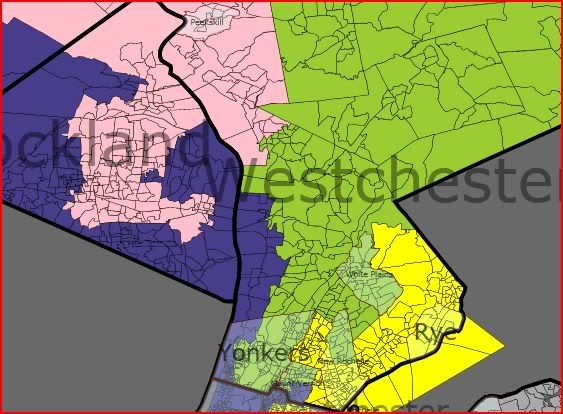
Westchester-Rockland Map
NY-22 (Light Brown)
Presidential Data –
Old NY-22: Obama 59-39
New NY-22: Obama 57-41 (-2D)
Demographic Data:
Old NY-22: 83% White, 8% Black, 8% Hispanic, 2% Asian
New NY-22: 80% White, 9% Hispanic, 8% Black, 1% Asian, 2% Other
Description: Now mostly a Hudson Valley district, at least population-wise, it includes the cities of Newburgh, Poughkeepsie, and Kingston, the latter of which is incumbent Hinchey’s home base. Including all of Ulster, Sullivan, and Otsego, it also includes portions of Orange, Dutchess, and Greene, as well as most of Delaware County.
Comments: I reclassified both this district and NY-20 out of the “Upstate” category for a reason. The arm of the existing district that runs out to Binghamton and Ithaca was originally the product of a compromise whereby Hinchey got a safer district (that didn’t include much of then-mostly Republican Delaware County) while the various upstate Republicans didn’t have to worry about representing either of those Democratic cities. However, all those aforementioned Republicans are gone now and replaced by Democrats, and Democrats’ fortunes in Ulster, Sullivan, and even Delaware County have improved to the point where the district doesn’t need to be shorn up in that fashion. As a consolation prize, NY-22 adds the very Democratic city of Poughkeepsie and while Delaware County and the new portions of Orange and Greene Counties are Republican, the new turf in Otsego County (with Cooperstown and college town Oneonta) is surprisingly Democrat-friendly.
Bottom Line: If current trends continue in the Hudson Valley, with the diversification of the periphery of the NYC metro area, this should say a safe Democratic seat even without Binghamton and Ithaca.
NY-20 (Rose Pink)
Presidential Data –
Old NY-20: Obama 51-48
New NY-20: Obama 55-43 (+4D)
Demographic Data:
Old NY-20: 95% White, 2% Black, 2% Hispanic, 1% Asian
New NY-20: 81% White, 8% Black, 7% Hispanic, 3% Asian
Incumbent: Scott Murphy (D-Glens Falls)
Description: A long thin strand that mostly follows the Hudson River from Lake Champlain down almost to the Tappan Zee. It avoids most of the bigger cities upstream which are in either NY-21 or NY-22. Contains parts of 10 counties, just as the current NY-20 does, but cuts out the Catskills region and instead runs further downstream into Orange, Putnam, Westchester, and Rockland Counties. (The Rockland/Orange section is connected to the rest of the district via the Bear Mountain Bridge.)
Comment: This might be the district I changed more than any other and it’s even more different than it looks on a map. It still contains most of the northern Taconic region as well as incumbent Murphy’s home town of Glens Falls. However, the current district doesn’t go below Poughkeepsie on the Hudson River whereas the majority of the new district lives in its new southern portion in Westchester, Rockland, Orange, and southern Dutchess Counties, and the racial diversity has increased dramatically. The Rockland and Westchester sections of the district are strongly Democratic, which pulls the district from a true swing district into one that leans significantly towards the Democrats. This is another district that looks kind of unwieldy. I certainly did not set out to design something that both borders Vermont and comes within a couple miles of bordering New Jersey.
Bottom Line: The good news for Scott Murphy, assuming he survives 2010, would be a district that’s significantly more Democratic than the one he has now, making a Republican challenge much harder. The bad news is that he may well have to worry more about a Democratic primary challenge from a resident of the lower portion of this district, not to mention needing to worry about the expensive NYC media market.
NY-19 (Yellow-Green)
Presidential Data –
Old NY-19: Obama 51-48
New NY-19: Obama 58-41 (+7D)
Demographic Data:
Old NY-19: 88% White, 8% Hispanic, 5% Black, 2% Asian
New NY-19: 72% White, 12% Hispanic, 10% Black, 4% Asian, 2% Other
Incumbent: John Hall (D-Dover)
Description: A north-south piece of territory that covers the eastern half of Dutchess County, the eastern-two thirds of Putnam County, and the majority of Westchester County.
Comments: A “musical chairs” situation where no upstate districts are eliminated creates a downstate pull on everything else, and that’s very much manifested here. NY-19 now stays entirely east of the Hudson, more or less following Metro North’s Harlem Line and the Taconic Parkway from the northernmost reaches of Dutchess County down to the borders of the Bronx. As one might expect, subtracting mostly Republican turf in Orange County and a mixed bag of stuff in Rockland County while adding all of White Plains and portions of New Rochelle and Mount Vernon is a huge boost to Democratic numbers. These changes would likely remove NY-19 from the list of swing districts entirely and into “Likely Democratic” if not “Safe Democratic” territory.
Bottom Line: This map should make John Hall a very happy man.
NY-18 (Bright Yellow)
Presidential Data –
Old NY-18: Obama 62-38
New NY-: Obama 68-30 (+6D)
Demographic Data:
Old NY-18: 67% White, 16% Hispanic, 10% Black, 5% Asian, 1% Other
New NY-18: 50% White, 22% Hispanic, 21% Black, 4% Asian, 2% Other
Incumbent: Nita Lowey (D-Harrison)
Description: Sort of a “Long Island Sound” district, it covers a stretch of lower Westchester along the Sound and the Connecticut border (Pelham, Eastchester, part of New Rochelle, Rye City and Town, Mamaroneck, and Harrison), eastern and central portions of the Bronx (a mixture of white, black, and Hispanic neighborhoods), then over the Throgs Neck Bridge to Queens. NY-18 contains portions of the Bayside and Flushing areas and moves into the Great Neck section of Nassau County.
Comments: A lot has changed here as Rockland County is out entirely and Lowey’s home town of Harrison is in the far northern edge of the new district as instead NY-18 gets pushed downstate, into the Bronx and Queens and even onto Long Island. Note that in the 1990s, Lowey’s district actually included portions of Queens and the Bronx so this isn’t entirely new to her. The upside for an incumbent Democrat is obvious – even though I tried to include as many Republican areas as I could (the Queens and Nassau portion together is about even between Obama and McCain) the district still moved 6 points towards Team Blue, thanks mostly to the Bronx. Note also than non-Hispanic whites are now just barely a majority of the new district.
NY-17 (Grey-Blue)
Presidential Data –
Old NY-17: Obama 72-28
New NY-17: Obama 67-32 (-5D)
Demographic Data:
Old NY-17: 49% White, 32% Black, 20% Hispanic, 5% Asian, 1% Other
New NY-17: 46% White, 28% Hispanic, 19% Black, 4% Asian, 3% Other
Incumbent: Elliot Engel (D-Riverdale,Bronx)
Description: This district contains mostly northern parts of the Bronx (Wakefield, Woodlawn, Riverdale) with some portions down near Fordham University, takes in parts of the cities of Mount Vernon and Yonkers in Westchester County, and then crosses the Tappan Zee Bridge to include portions of Rockland and Orange Counties, mostly along I-287 and, appropriately enough, NY Route 17.
Comment: The biggest change here is that this new district stretches out into Orange, cutting out the more Democratic precincts in Rockland County formerly in the district and leaving in mostly the ones which voted for McCain. Furthermore, by the 2008 Presidential vote NY-17 is now 5 points less Democratic, but that’s likely somewhat misleading as a large number of those ostensible Republican votes were in precincts that consisted largely or wholly of Hasidic or other Orthodox Jews, who strongly preferred McCain to Obama but have voted for plenty of state and local Democrats and who should have little trouble supporting Engel, one of the more prominent Friends of Israel in Congress. The remainder of Rockland is now in NY-20, where it helps boost Democratic vote totals. The new Orange County portion of NY-17 also leans toward the GOP…but the Bronx and Westchester portions are so heavily Democratic that it hardly matters. The demographics change a little bit as NY-17 gains more Hispanic residents by cutting deeper into the Central Bronx while losing African-American residents to the downward movement of NY-18 and NY-19.It remains a minority-majority district, albeit one with no clear majority.
Bottom Line: Still safe for Democrats, especially for Engel.
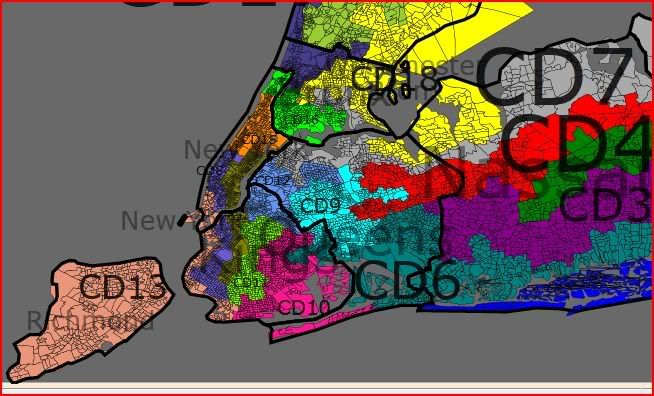
New York City
New York City Map
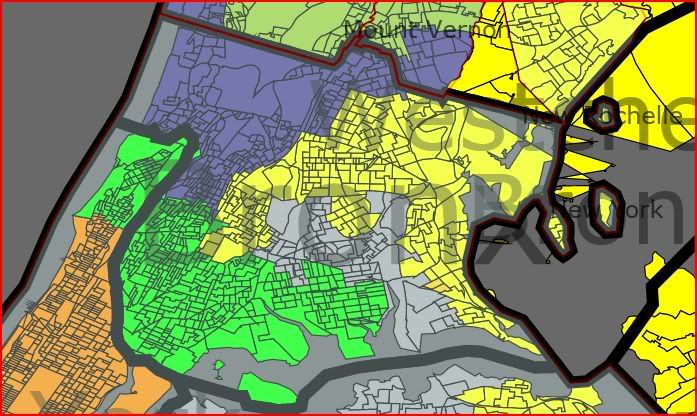
Bronx/Manhattan
Bronx & Upper Manhattan Map
Lower Manhattan Map
NY-16 (Lime Green)
Presidential Data –
Old NY-16: Obama 95-5
New NY-16: Obama 94-6 (-1D)
Demographic Data:
Old NY-16: 63% Hispanic, 36% Black, 20% White, 2% Asian, 6% Other
New NY-16: 63% Hispanic, 28% Black, 5% White, 1% Asian, 2% Other
Incumbent: Jose Serrano (D-South Bronx)
Description: Most of the southern and central Bronx, plus the far northern portion (Inwood, Washington Heights) of Manhattan. Also includes Rikers Island.
Comment: Despite being a Voting Rights Act mandate, NY-16 was a pretty easy district to draw; it’s not like one needs to look too hard for Hispanic precincts in the Bronx. Because NY-18 got pushed into the Bronx and NY-17 got pushed further into the Bronx, my choices were either to push NY-7 out of the Bronx entirely or send NY-16 into Manhattan. Because I wanted NY-7 to absorb some Republican parts of Long Island (I’ll get there eventually, I promise), I chose the latter option. Far northern Manhattan is mostly Hispanic as well. Rikers Island is in here because while there are residents there, there are no votes (it’s a jail) and NY-7, where the island would otherwise have been, needed actual votes more.
Bottom Line: Somehow one point less Democratic, not that Serrano or anyone else will notice much, given that this remains the most Democratic district in New York and in the nation as a whole.
NY-15 (Orange)
Presidential Data –
Old NY-15: Obama 93-6
New NY-15: Obama 91-8 (-2D)
Demographic Data:
Old NY-15: 48% Hispanic, 35% Black, 28% White, 3% Asian, 5% Other
New NY-15: 36% Hispanic, 29% Black, 29% White, 4% Asian, 2% Other
Incumbent: Charles Rangel (D-Harlem, Manhattan)
Description: Uptown Manhattan, including Harlem and East Harlem, as well as portions of the Upper East and Upper West Sides, plus Ward’s/Randall’s Islands.
Comment: The smallest Congressional District in America in area, now even smaller. It’s been pushed downtown some by the incursion of NY-16 into Manhattan. It’s now almost evenly split among white, black, and Hispanic voters.
Bottom Line: Less Hispanic than before, NY-16 contains a few more affluent whites than the old district did. Not sure whether this will make a primary challenge to Rangel amidst his ethical lapses more or less likely.
NY-14 (Olive)
Presidential Data –
Old NY-14: Obama 78-21
New NY-14: Obama 78-22 (unch)
Demographic Data:
Old NY-14: 73% White, 14% Hispanic, 11% Asian, 5% Black
New NY-14: 65% White, 14% Hispanic, 11% Asian, 7% Black, 3% Other
Incumbent: Carolyn Maloney (D-East Side,Manhattan)
Description: Most of the East Side of Manhattan, from the 90s down to the Williamsburg Bridge, plus most of Midtown as well as Roosevelt Island. In Brooklyn it includes portions of Williamsburg, Downtown, Fort Greene, Prospect Heights, Park Slope, and Borough Park.
Comment: Since NY-12 now stays out of Manhattan completely, the Lower East Side is in here. The Brookyn parts are entirely new to this district, as Maloney’s current district instead crosses the East River into Queens. There’s none of Queens in here but there’s not much to complain about as these are, other than heavily Orthodox Borough Park, the most Manhattan-like parts of Brooklyn in terms of demographics and voting patterns; they’re here because most of these precincts (i.e. mostly white and liberal) are poor fits for VRA compliant districts.
Bottom Line: No real changes.
NY-08 (Lavender Blue)
Presidential Data –
Old NY-08: 74-26
New NY-08: Obama 80-20 (+6D)
Demographic Data:
Old NY-08: 75% White, 12% Hispanic, 11% Asian, 6% Black, 2% Other
New NY-08: 56% White, 19% Asian, 17% Hispanic, 4% Black, 3% Other
Incumbent: Jerrold Nadler (D-West Side, Manhattan)
Description: In Manhattan, this district starts on the Upper West Side and then runs downtown to cover much of Lower Manhattan including most of Chinatown, though it gives up some of Lower Manhattan up to shore up NY-13. It crosses the Brooklyn Bridge and then runs all the way down to Bath Beach , taking in all or part of Brooklyn Heights, Carroll Gardens, Sunset Park, Bay Ridge, Dyker Heights, and Bensonhurst in between.
Comment: This is one of many districts used to cover Republican-leaning parts of South Brookyn, overwhelming the GOP voters of Borough Park, Bay Ridge, and Bensonhurst with Manhattan liberals. It probably shows up as being more Democratic due to my effort to give the district more of northwest Brooklyn (which is heavily Democratic) to make the district look less gerrymandered than before. Interestingly enough, since this district now includes most of Chinatown as well as someparts of Brooklyn with large Asian-American communities, NY-8 would become the district in the state, and probably the nation outside of the West, with the highest percentage of Asian-Americans.
Bottom Line: No real changes.
Brooklyn/Staten Island
Brooklyn Map
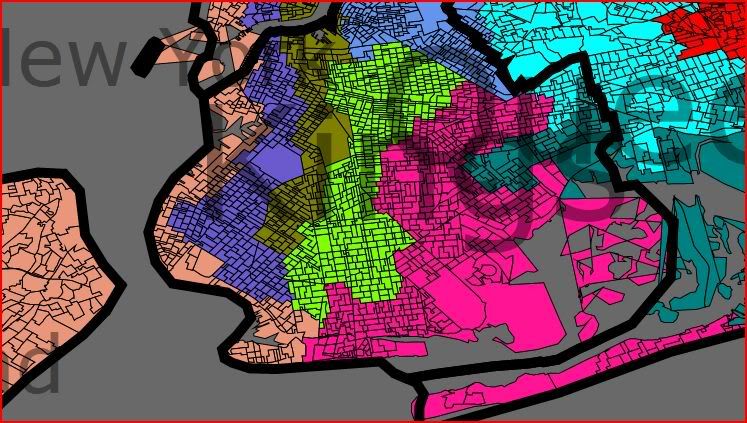
NY-13 (Peach Tan)
Presidential Data –
Old NY-13: McCain 51-49
New NY-13: Obama 55-45 (+6D)
Demographic Data:
Old NY-13: 77% White, 11% Hispanic, 9% Asian, 7% Black
New NY-13: 64% White, 16% Hispanic, 10% Black, 7% Asian, 2% Other
Incumbent: Mike McMahon (D-Staten Island)
Description: This district includes the whole of Staten Island, then crosses the Verrazano Bridge into Brooklyn, where it becomes a thin forked line. One brach runs down along the water to Coney Island while the other branch stretches narrowly through Bay Ridge and Sunset Park up into Gowanus and Red Hook, then crosses the Brooklyn-Battery Tunnel into the southernmost part of Manhattan, including the Finanical District, Tribeca and SoHo.
Comment: What a huge difference those 30,000 Manhattanites (mostly white, mostly highly educated, many of them gay/lesbian) make! Specifically, they by themselves move this district 3 points toward the Democrats. Staten Island of course leans Republican and the Brooklyn portions of the old district weren’t much better, so most of Bay Ridge and Bensonhurst have been excised in favor of more favorable parts of Brooklyn, namely Coney Island at one end and Red Hook at the other. That pushes the district over the 50-50 line but the Manhattan portions make for a more solidly Democratic district.
Bottom Line: Mike McMahon should breathe a little easier.
NY-11 (Bright Green)
Presidential Data –
Old NY-11: Obama 91-9
New NY-11: Obama 81-19 (-10D)
Demographic Data:
Old NY-11: 61% Black, 25% White, 12% Hispanic, 4% Asian
New NY-11: 50.05% Black, 29% White, 11% Hispanic, 6% Asian, 3% Other
Incumbent: Yvette Clark (D-Prospect Gardens, Brooklyn)
Description: Entirely in Brooklyn, mostly in the central part of the borough.
Comment: The northern portions are heavily African-American (e.g Bedford-Stuyvesant) and/or Afro-Caribbean (e.g. Crown Heights) in nature. Much of the predominantly white southern portion, including parts of Borough Park, Midwood, and Homecrest, have strong Republican leanings. It’s 10 points weaker than the old NY-11, mostly because the black vote is less concentrated and because heavily Democratic non-black precincts in Red Hook and Park Slope were replaced with Republican-voting ones further south. Due to some moving around of other districts, Brownsville and East Flatbush were mostly removed from NY-11 while Bed-Stuy and portions of the Clinton Hill/Fort Greene area were added in their place.
Bottom Line: Hardly much of a cause for concern.
NY-10 (Magenta)
Presidential Data –
Old NY-10: 63% Black, 21% White, 17% Hispanic, 3% Asian, 2% Other
New NY-10: 51% Black, 32% White, 11% Hispanic, 4% Asian, 3% Other
Demographic Data:
Old NY-10: 91-9
New NY-10: Obama 78-21 (-13D)
Incumbent: Edolphus Towns (D-East New York, Brooklyn)
Description: Mostly in Brooklyn, with a portion in Queens on the westernmost parts of the Rockaway Peninsula. Includes all or part of Flatbush, East Flatbush, East New York, Brownsville, Canarsie, Marine Park, Sheepshead Bay, Manhattan Beach, Brighton Beach, and Gravesend.
Comment: Same idea as NY-11 above. In this case, the north and east sections are heavily black (Brownsville, East New York) and constitute a majority while the mostly white sections to the south or west (Gravesend, Manhattan Beach, Brighton Beach, Rockaway Park) vote Republican. The Democratic performance dropped dramatically, but that’s good news in a case such as this because it just means fewer wasted votes.
Bottom Line: Should be no real change.
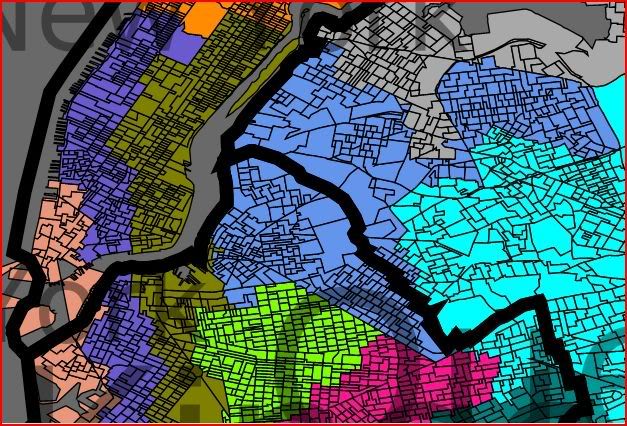
Queens
Queens Map
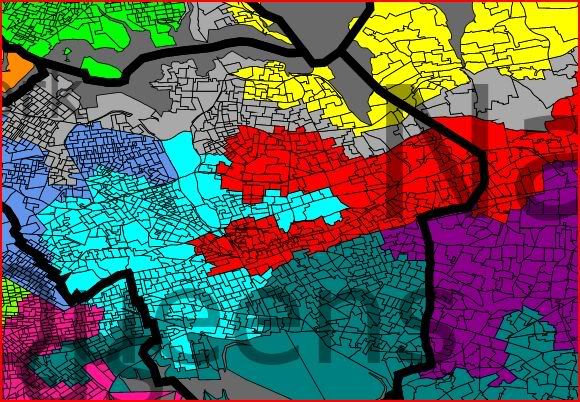
NY-12 (Robin’s Egg Blue)
Presidential Data –
Old NY-12: Obama 86-13
New NY-12: Obama 82-17 (-4D)
Demographic Data:
Old NY-12: 48% Hispanic, 39% White, 16% Asian, 11% Black,
New NY-12: 51% Hispanic, 24% White, 12% Asian, 9% Black, 4% Other
Incumbent: Nydia Velasquez (D-Williamsburg, Brooklyn)
Description: Split between Queens and Brooklyn.
Comment: It’s a miscellaneous collection consisting primarily of predominantly Hispanic neighborhoods in Queens and Brooklyn but including most of Valasquez’ home neighborhood of Williamsburg. It’s changed a bit though as it’s much more compact than before; it no longer includes any of Manhattan and leaves the bayfront portions of Brooklyn such as Red Hook and Sunset Park behind. Instead NY-12 moves east and north and takes in parts of Queens such as Long Island City and portions of Jackson Heights, Elmhurst, and Corona as well as the Brooklyn neighborhoods of Greenpoint and Bushwick. These changes were made mostly because sending three districts via bridge from lower Manhattan to Brooklyn required getting NY-12 out of their way. (It looked better before I discovered that Joe Crowley’s home in Woodside was right in it’s path. )
Bottom Line: Obviously still a safe Democratic district for Velasquez or any other nominated Democratic candidate. There is now a Hispanic majority here.
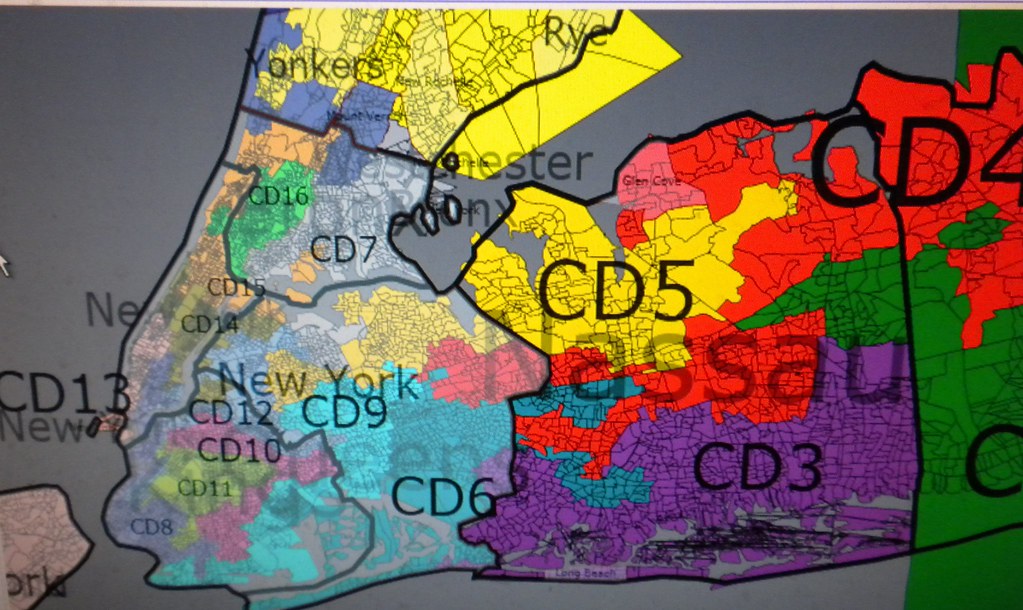
NY-07 (Light Gray)
Presidential Data –
Old NY-07: 45% White, 36% Hispanic, 19% Black, 13% Asian, 2% Other
New NY-07: 48% White, 24% Hispanic, 16% Asian, 9% Black, 4% Other
Demographic Data:
Old NY-07: Obama 79-20
New NY-07: Obama 66-33 (-13D)
Incumbent: Joseph Crowley (D-Woodside, Queens)
Description: Geographically, mostly a long thin strand running from Astoria and Woodside in Queens out Northern Boulevard and then the North Shore out to portions of Huntington, including portions of northern Nassau and Suffolk Counties, with another branch going into southeastern and central sections of the Bronx via the Whitestone Bridge.
Comment: NY-07, being a rare district in this part of the state not presently subject to VRA constraints, figures prominently in removal of Peter King and his district from the delegation. With the exception of a few more diverse areas, the North Shore area leans Republican from one end to the other, one reason that much of it is in the current NY-03. One key to keeping this district from falling into swing territory is that the relatively small section of the Bronx actually represents about 20% of the district’s population, and that the predominantly white precincts in that borough that would be of limited help to a Democrat (many of which actually are in the current NY-07) were placed elsewhere, leaving overwhelmingly black or Hispanic precincts who collectively gave Obama 86% of their votes. The Queens portion of the new district also leaves out some of the whiter and less Democratic parts of that borough that had been in NY-07 before. 66% leaves plenty of Democratic margin, even if the 2008 turnout numbers represent something of a ceiling – in part because Long Island figures to continue to diversify.
Bottom Line: Crowley might be the most ticked off Democrat in the delegation as he gets a mostly new set of constituents and one less friendly than he is used to. But someone has to take those Republican votes on Long Island and every other candidate for that task is limited either by already being something of a swing district or by VRA compliance requirements.
NY-06 (Teal Blue)
Presidential Data –
Old NY-06: Obama 89-11
New NY-06: Obama 72-27 (-17D)
Demographic Data:
Old NY-06: 54% Black, 19% White, 17% Hispanic, 9% Asian, 4% Other
New NY-06: 50.01% Black, 36% White, 9% Hispanic, 2% Asian, 3% Other
Incumbents: Gregory Meeks (D- St. Albans, Queens); Peter King (R-Seaford)
Description: Built around a primarily black section of Eastern Queens, it has one branch that runs west to pick up parts of Brownsville and East New York in Brooklyn, taking in Broad Channel and portions of Howard Beach along the way and another that runs to the east along the south shore of Long Island’s Nassau County, including most of the Five Towns area but growing narrower until reaching the Nassau County border near Massapequa.
Comment: I’m pretty sure King’s not actually going to run here. When I was drawing this map, I didn’t know where exactly his home was; I’d have actually guessed it was in the NY-03 I drew with Carolyn McCarthy around, which is probably the district he’d choose to run in anyway. Someone else’s contest entry pointed out the precinct, I looked it up, and what do you know, his precinct’s in the (barely) black-majority NY-06.
Even more than the two Brooklyn districts NY-10 and NY-11, this is NY-06 a classic “blacks and Republicans” district, avoiding any significant areas predominantly white precincts where Obama did well, since those voters don’t help this district comply with the VRA and are more needed elsewhere. The Nassau portion of the district is mostly strongly Republican; diverse areas in southern Nassau County, such as Freeport, where Obama performed well were put into NY-3. I’m a little scared of “blacks and Republicans” districts in some contexts (for fear that the racial turnout gap could become large enough to produce some unpleasant Election Day surprises) but this one is a bit different in that most of the predominantly black neighborhoods in this area are middle-class and well-educated (and thus less likely to suffer from extremely low turnout) and that incumbent Meeks seems like the kind of African-American politician perfectly capable of winning over some white votes (and even Obama’s worst precincts in here were in the 30s rather than the single digits) if he needs them.
Bottom Line: Probably another unhappy incumbent, even if he’s still safe.
NY-09 (Sky Blue)
Presidential Data –
Old NY-09: Obama 55-44
New NY-09: Obama 68-31 (+13D)
Demographic Data:
Old NY-09: 71% White, 15% Asian, 14% Hispanic, 4% Black, 2% Other
New NY-09: 40% White, 26% Hispanic, 17% Asian, 9% Black, 7% Other
Incumbent: Anthony Weiner (D-Forest Hills, Queens)
Description: Now almost entirely in Queens, it’s based, just like the current NY-09 in a group of mostly white Queens neighborhoods such as Maspeth, Middle Village, Woodhaven, Ozone Park, most of Howard Beach, and incumbent Weiner’s own home turf in Forest Hills. It’s become a no-majority district now because it’s border areas in the east and south, particularly the small portion in Brooklyn, have many largely black and Hispanic precincts, and because the Asian-American population has been increased slightly.
Comment: Because other districts are used to cover Republican parts of southern Brooklyn, the Democratic share of the vote in this new district shoots way up. There wasn’t quite enough room to get this district out onto Long Island, so I ended up just trying to make sure the more GOP-friendly parts of Queens were in here rather than in NY-04 or NY-07 to the extent possible.
Bottom Line: Anthony Weiner wasn’t and isn’t in any real danger here. The danger is that he has known higher office aspirations, just like his predecessor Chuck Schumer, so I expect this to be an open seat sooner rather than later. A 55-44 open seat is a cause for concern, but an open seat in the new district would not be.
NY-04 (Red)
Presidential Data –
Old NY-05: Obama 63-36
New NY-04: Obama 60-39 (-3D)
Demographic Data:
Old NY-05: 56% White, 25% Asian, 24% Hispanic, 6% Black
New NY-04: 54% White, 18% Asian, 14% Hispanic, 9% Black, 5% Other
Incumbent: Gary Ackerman (D-Roslyn Heights)
Description: The new NY-04 most closely resembles the existing NY-05, split between Queens and Long Island.
Comment:
This district had the highest Asian population of any district outside of Hawaii and California, but they’ve been spread out some more in this map; those areas in Queens are less Democrat-voting than the neighborhoods that have replaced them in this NY-04; note that the black population, mostly in the Queens portion of the district, increased from 6% to 9%. The Long Island portion of the district, about 41% of it’s residents, narrowly voted for McCain, but 72% of the Queens section (a diverse set of neighborhoods such as East Flushing, Oakland Gardens, and parts of Jamaica Estates, collectively 59% of the district’s population) voted for Obama. In North Hempstead in Nassau, Ackerman has a lot of the same constituents he’s used to, including those in his Roslyn home as well as all or parts of Albertson and Westbury, though Great Neck, Port Washington, and most of Manhasset are moved as NY-07 and NY-18 now move into Nassau County. The Oyster Bay and Suffolk County portions would be entirely new to Ackerman and neither, with a few exceptions (Greenlawn and Huntington Station) are particularly friendly towards Democrats. The Oyster Bay portions are mostly in Peter King’s current NY-03. Essentially, this district’s Democratic base in Queens is used to cover some heavily Republican parts of Long Island, including parts of Garden City, and a large chunk of the town of Smithtown.
Bottom Line: Ackerman has more territory to cover and a bunch of new constitutents, which probably won’t make him happy. But he isn’t seriously endangered by any of the changes and his successor here should be a fellow Democrat as well, especially given the long-term trends on Long Island.
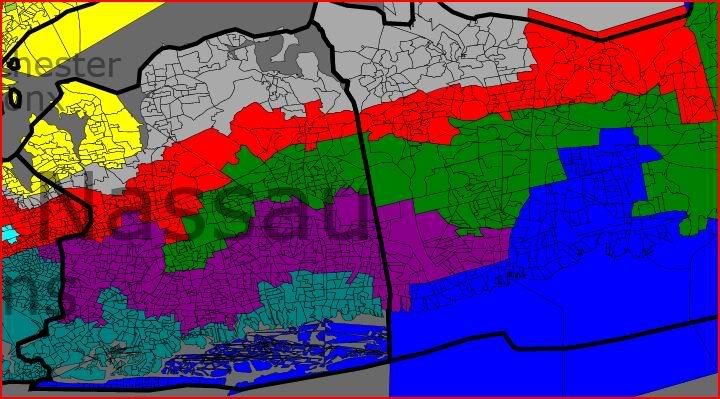
Long Island
Nassau County Map
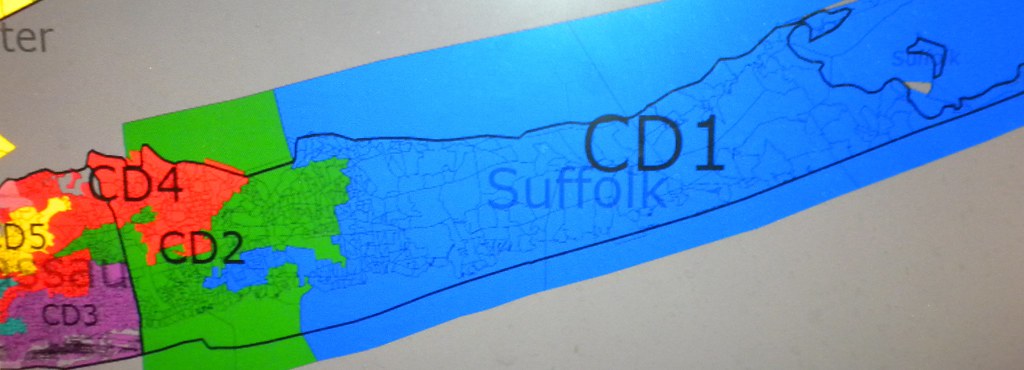
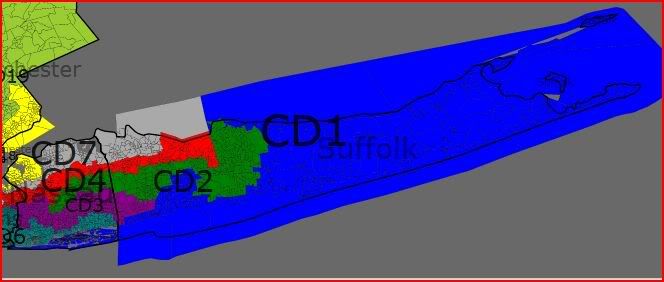
Suffolk County Map
NY-03 (Medium Purple)
Presidential Data –
Old NY-04: Obama 58-41
Old NY-03: McCain 52-47
New NY-03: Obama 56-44
Demographic Data:
Old NY-04: 69% White, 19% Black, 14% Hispanic, 5% Asian
Old NY-03 94% White, 2% Black, 2% Hispanic, 1% Asian
New NY-03: 68% White, 16% Black, 10% Hispanic, 4% Asian
Incumbent: Carolyn McCarthy (D-Mineola); Peter King (R-Seaford)
Description: A roughly eliptical swath across Long Island, covering parts of the Town of Babylon in Suffolk County, interior portions of Nassau County, with a handful of precincts in the far eastern part of Queens. It’s mostly a fusion of the current NY-03 with the current NY-04.
Comment: Here’s where things really get interesting. The eastern half of this district is as of now mostly represented by Republican Peter King while the western half is mostly represented by Democrat Carolyn McCarthy. And then there are two entirely new pieces, one in the east in the Town of Babylon and one in the west in Queens. As one might expect from me at this point, 75% of the 23,000 Queens residents of this district are African-American, as are a substantial minority of the eastern portion which includes the African-American majority village of North Amityville. The western half, full of diverse communities like Valley Stream, Uniondale, Freeport, and McCarthy’s own Mineola, predominates, as the demographic numbers clearly indicate; this looks a whole lot more like McCarthy’s district than King’s. In a race between the two, I’d expect McCarthy to be the clear favorite.
Bottom Line: For Peter King, it’s a matter of picking his poison. The current NY-03 has been placed in six different districts, only two of which are halfway plausible places for him to run; NY-07 contains only a few of his old constituents and runs all the way into the Bronx, NY-04 is mostly (population-wise) in Queens and only contains a few of his old constituents, NY-06 contains his house but is mostly in Queens and is majority African-American, and while NY-01 may be the least Democrat-leaning of all his options, that’s almost entirely unfamiliar territory further out in Suffolk County and his obnoxious screeds on TV don’t play well in the Hamptons anyway. That leaves Steve Israel’s NY-02 and Carolyn McCarthy’s NY-03. Of those NY-03 seems the plausible choice as it contains a little more of King’s current turf than NY-02 does and includes most of King’s base in Massapequa, Farmingdale, and Bethpage. Even here he’s a clear underdog against McCarthy.
NY-02 (Dark Green)
Presidential Data –
Old NY-02: Obama 56-43
New NY-02 Obama 56-44 (unch)
Demographic Data –
Old NY-02: 78% White, 14% Hispanic, 10% Black, 3% Asian
New NY-02: 74% White, 10% Hispanic, 10% Black, 4% Asian
Incumbent: Steve Israel (D-Dix Hills)
Description: Shaped a bit like a big-headed lizard with a long tail section. Predominantly in Suffolk County, it covers most of the Town of Brookhaven and southern portions of Smithtown, with a tail through interior portions of western Suffolk (small portions towns of Babylon and Islip and southern portions of Huntington and stretching into a strand running through the middle of eastern portions of Nassau County, as far west as Hempstead Village.
Comments: This district remains about exactly as Democratic-leaning as it was before, but has changed considerably. It loses its North Shore territory but picks up a different part of the North Shore, around Port Jefferson. Only its central portion, around Israel’s own Dix Hills, and Republican-leaning southeast portion in the Town of Islip remain largely intact. The Nassau County portion, expanded considerably from the old NY-02, picks up some of Peter King’s old base around Levittown and Hicksville but also includes heavily Democratic Hempstead Village, which makes up for not having such Democratic strongholds as Brentwood and Central Islip anymore. It probably has more of Peter King’s old constituents than any district save NY-03. This district had to be altered considerably to help take out Peter King and help lock down what would otherwise be a shaky NY-01.
Bottom Line: Israel’s probably not a happy camper as the power of incumbency goes down dramaticallly with brand new constituents, even if the generic Democratic advantage remains the same as it does here. It’s still hard to imagine Peter King winning here as he hasn’t represented many of these people and would have to move inland considerably to belong to this district.
NY-01 (Medium Blue)
Presidential Data –
Old NY-01: Obama 52-44
New NY-01: Obama 55-43 (+3D)
Demographic Data –
Old NY-01: 89% White, 8% Hispanic, 4% Black, 2% Asian
New NY-01: 76% White, 14% Hispanic, 7% Black, 2% Asian, 2% Other
Incumbent: Tim Bishop (D-Southhampton)
Description: Based in eastern Suffolk County, including both the North and South forks and all the Hamptons, and then runs along the South Shore to Bay Shore then over Robert Moses Causeway to Fire Island and along Ocean Parkway through beach barrier islands to Point Lookout, Long Beach, and Atlantic Beach in Nassau County. The tail becomes wider at one point to include Brentwood and Central Islip.
Comments: A marginal Democratic district shorn up somewhat by the shedding of mostly (apart from Port Jefferson) unfriendly portions of the Towns of Brookhaven and Smithtown and their replacement with the barrier islands in Nassau County and heavily Democratic Central Islip and Brentwood (mostly responsible for the significant jump in the Hispanic population) which more than make up for the Republican-leaning South Shore area (some of which is now represented by Peter King)that this new map includes. It’s admittedly bit of a gerrymander as this new NY-01 borders (by water) Queens despite also including Shelter Island.
Bottom Line: This should help keep this seat in Democratic hands.

Loading ...