Indiana Republican Gerrymander

With Republicans holding the trifecta in Indiana, I decided to try to eliminate 2 of the current Democratic held house seats. Because the 7th district is represented by a minority and is the closest district to minority-majority in Indiana, I left that district intact.

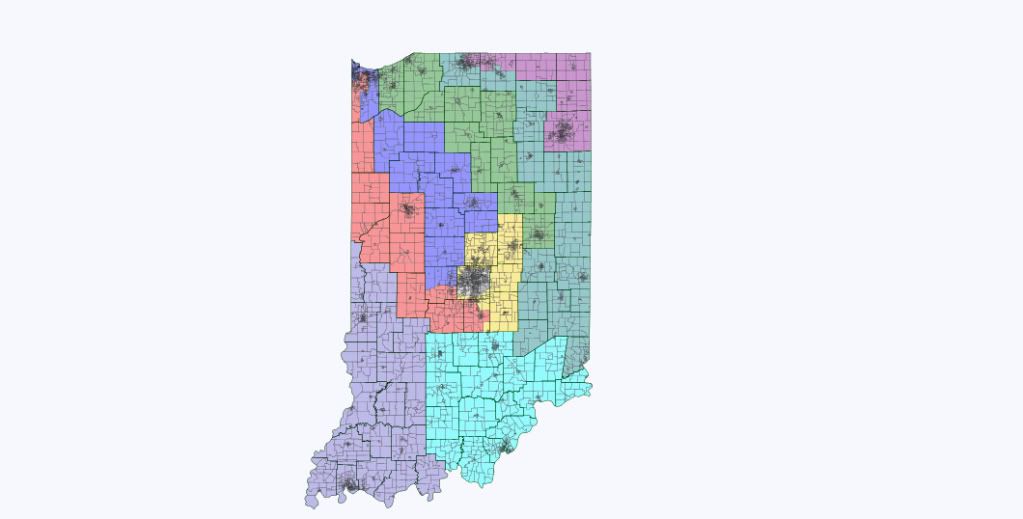
1st District-Blue-Current Rep: Peter Visclosky (D)

Racial Breakdown: 75 white 13 black 11 Hispanic 1 Asian

New District: McCain: 48 Obama: 51

Old District: McCain: 37 Obama: 62

This new district loses about half of Lake County and picks up several heavily Republican counties in the central part of the state. This district becomes 11 points more Republican, but yes, was still won by Obama. However, I would argue that aside from Illinois, Indiana was the state in which Obama most overperformed, and I would say this district would be won a GOP candidate in most years. New PVI around R+2.

Lake County:

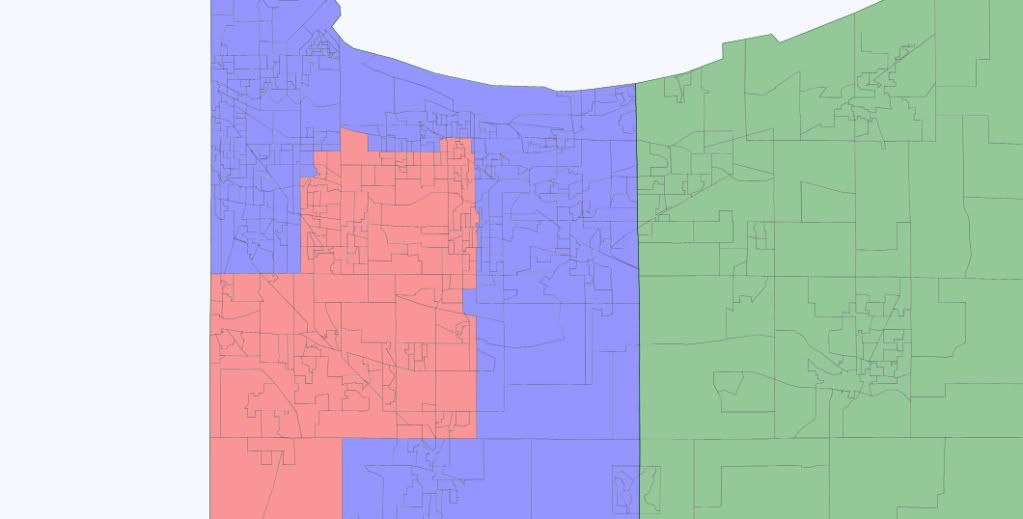
2nd District-Green-Current Rep: Joe Donnelly (D)

Racial Breakdown: 89 white 5 black 5 Hispanic 1 Asian

New District: M: 50 O: 49

Old District: M: 45 O: 54

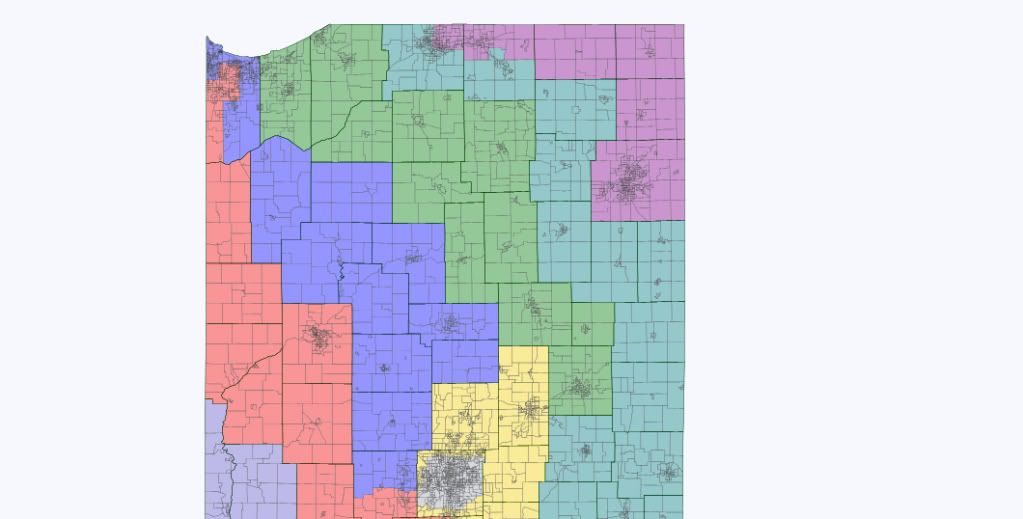
Joe Donnelly is a goner. By removing South Bend and St. Joseph County from his district and picking up some GOP heavy counties in the central part of the state, this district moves 5 points towards the GOP. New PVI around R+5.

3rd District-Purple-Current Rep: Marlin Stutzman (R)

Racial Breakdown: 83 white 9 black 6 Hispanic 2 Asian

New District: M: 51 O: 48

Old District: M: 56 O: 43

Stutzman can’t be thrilled he has to take up part of St. Joseph county, but his Ft. Wayne based district is still solidly Republican. New PVI around R+6.

4th District-Red- Current Rep: Todd Rokita (R)

Racial Breakdown: 85 white 8 black 5 Hispanic 2 Asian

New District: M: 52 O: 47

Old District: M: 56 O: 43

The new 4th splits Lake County then moves south all the way towards the GOP heavy Indianapolis suburbs. It takes in Dem leaning Tippecanoe county and the college town of West Laffayette, but almost all other territory is heavy Republican. New PVI around R+8.

5th District-Yellow- Current Rep: Dan Burton (R)

Racial Breakdown: 89 white 5 black 3 Hispanic 2 Asian

New District: M: 53 O: 46

Old District: M: 59 O: 40

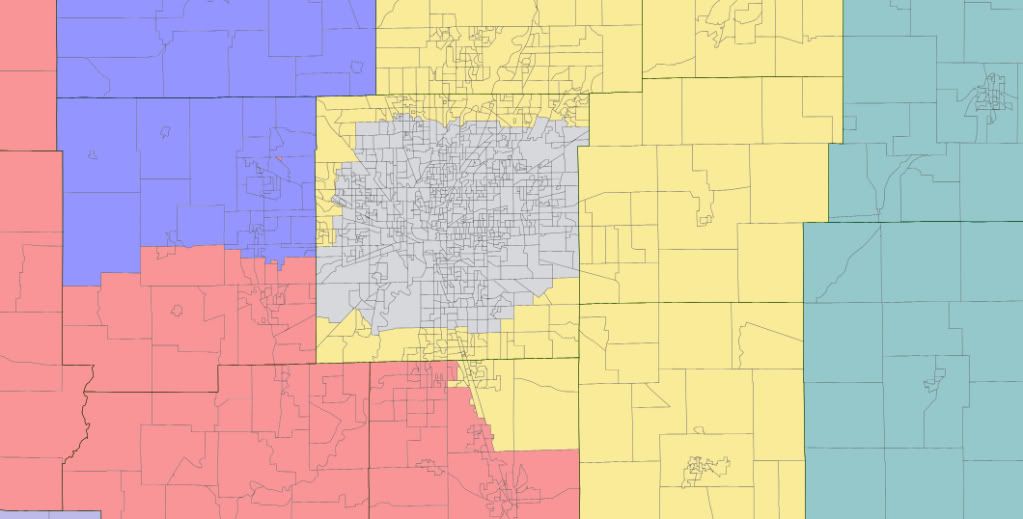
Dan Burton’s district stays largely the same, except for picking up Dem leaning Madison County. Burton also picks up some swing areas of Marion County, but they are not enough to offset the GOP lean of the rest of this suburban district. New PVI around R+11.

6th District-Turquoise- Current Rep: Mike Pence (R)

Racial Breakdown: 88 white 5 black 6 Hispanic 1 Asian

New District: M: 54 O: 45

Old District: M: 53 O: 46

It may be confusing as to how this district gets more Republican despite picking up some Dem friendly areas of South Bend, however it loses Madison and Delaware counties while stretching down the eastern part of the state to pick up more GOP counties. Not the most compact district, but Pence (or someone else) is safe here. New PVI around R+13.

7th District-Gray- Current Rep: André Carson (D)

Racial Breakdown: 59 white 31 black 8 Hispanic 2 Asian

New District: M: 28 O: 71

Old District: M: 28 O: 71

This district stays almost exactly the same. Centered on Marion County it is the most urban and Dem friendly in the state. Carson is safe. New PVI around D+15.

Indianapolis:

8th District-Light Purple-Current Rep: Larry Bucshon (R)

Racial Breakdown: 93 white 4 black 2 Hispanic 1 Asian

New District: M: 51 O: 47

Old District: M: 51 O: 47

The 8th is very similar to the old 8th. Swingy Evansville and Terry Haute are offset by the GOP leaning counties in between. Bucshon should have no trouble with this district unless Brad Ellsworth runs, in which case Bucshon would still probably be the slight favorite. New PVI around R+8.

9th District-Light Blue- Current Rep: Todd Young (R)

Racial Breakdown: 93 white 2 black 2 Hispanic 2 Asian

Old District: M: 50 O: 49

New District: M: 50 O: 49

The 9th stays almost the same as well. Liberal Bloomington is offset by the rest of the district. Young should be safe here, unless a Dem wave and the perfect Dem candidate align. New PVI around R+6.

So there you have it. Let me know what you think. Comments?

By what margin will Bob Shamansky win?

View Results

Loading ... Loading ...

NJ-Sen, NJ-Gov: Menendez May or May Not Be in Trouble

Fairleigh Dickinson Univ. (1/3-9, registered voters, no trendlines):

Bob Menendez (D-inc): 44

Tom Kean Jr. (R): 34

Unsure/Neither/Other: 22

Bob Menendez (D-inc): 40

Michael Doherty (R): 30

Unsure/Neither/Other: 30

Bob Menendez (D-inc): 47

Kim Guadagno (R): 26

Unsure/Neither/Other: 27

Bob Menendez (D-inc): 41

Joe Kyrillos (R): 29

Unsure/Neither/Other: 30

Bob Menendez (D-inc): 44

John Crowley (R): 30

Unsure/Neither/Other: 27

Bob Menendez (D-inc): 42

Jennifer Beck (R): 29

Unsure/Neither/Other: 29

(MoE: ±3.5%)

Local pollster Fairleigh Dickinson’s first look at the 2012 Senate race finds Bob Menendez leading his little-known Republican potential rivals by double digits, ranging from margins of 10 (against his 2006 opponent, Tom Kean Jr., and also against state Sen. Michael Doherty, who’s apparently a particular fave to the tea party types) to 19 (against current Lt. Gov. Kim Guadagno, who may be at a low point right now since most people’s current impression of her involves her being out-of-state during the nor’easter cleanup). FDU doesn’t offer an approval rating for Menendez for some reason, but he’s polling not out of the danger zone, in the mid-40s and, as they point out, his fortunes are probably deeply tied to those of Barack Obama (who’s at 47/41) and those of the broader economy.

Public Policy Polling (1/6-9, New Jersey voters, no trendlines):

Bob Menendez (D-inc): 41

Tom Kean Jr. (R): 39

Undecided: 19

Bob Menendez (D-inc): 47

Lou Dobbs (R): 35

Undecided: 18

Bob Menendez (D-inc): 45

Kim Guadgano (R): 30

Undecided: 24

(MoE: ±4.3%)

FDU’s numbers contrast a bit with those from PPP, who find a much closer race between Menendez and Kean (although they find a similar blowout against Guadagno as with FDU). I’d commented a few weeks ago that Menendez’s approval numbers (which are 37/38 in this poll) reminded me a bit of Richard Burr’s at this point two years ago — a surprisingly large number of people don’t know him, and those who do know him feel prety “meh” about him — and I think that’s still the case here. In fact, I’ll predict the whole cycle here may parallel NC-Sen ’10, with polls continuing to show definite incumbent weakness but the state’s lean (plus a likely underfunded opponent) probably giving the incumbent a decent win in the end.

Public Policy Polling (1/6-9, New Jersey voters, no trendlines):

Cory Booker (D): 42

Chris Christie (R-inc): 42

Undecided: 16

(MoE: ±4.3%)

As a throw-in, PPP also looks at the 2013 gubernatorial race (it’s only two and three-quarters years away!). While if you read only the rightosphere, you’d think that Chris Christie was ready to not only graduate from being governor right now but even to skip that whole Presidency business and move straight on to running for Galactic Emperor, here in the real world, things are a little less clear-cut. The blustery and mass-transit-destroying Christie only manages a tie with Cory Booker, the attention-grabbing Democratic mayor of Newark. Christie’s still above water with 48/45 approvals, but it’s a Dem-leaning state and Booker has nothing but upside at this point with 46/16 favorables.

VA-Sen: Allen Gearing Up to Announce

It’s looking like the GOP’s marquee candidate in Virginia, as expected, is about to enter the race against Jim Webb (or an open seat race, if Webb retires as has been threatened). We don’t have a source beyond Politico’s Mike Allen, but here’s what he knows:

George Allen, the former U.S. senator and Virginia governor, plans to tell supporters within a week that he is mounting a campaign to retake the Senate seat he lost to Sen. Jim Webb (D-Va.) in 2006. Allen, 58, the most prominent 2012 challenger to announce so far, has begun to line up key staff members.

While a Webb/Allen rematch would be one of the nation’s hottest general election races, there’s still the little matter of the primary election, where Allen already faces tea partier Jamie Radtke and may face a higher profile rival from the right. Former state party chair Jeff Frederick, in a just-released interview, is already promising he won’t back Allen:

He was complicit in all the big government conservatism that came out of the Congress during his years in the Senate, cheerleading for it all and never leading against it. Allen was a go-along member of the GOP majority that lost power because it lost its principles, and he really is the opposite of the ideal candidate for those of us looking for a constitutional, first-principles, non-GOP-status-quo type of candidate.  George Allen is the poster child for the establishment.

For some perspective on that position, Allen’s lifetime ACU rating was 92.6.

CT-Sen: A Hot, Sexy Threesome

http://polibeast.blogspot.com/…

No, I’m not speaking of a Cinemax late-night softcore porno, although I wouldn’t be much floored if one titled that actually existed. I’m talking about the 2012 Connecticut U.S. Senate race, a showdown which, presuming incumbent Sen. Joe Lieberman runs again as an Independent candidate, will be a three-person affair.

In one corner, you have Lieberman, who, lately, has been sporting rather grim approval ratings. Liberals are still irked by his behavior during the health care debate, conservatives are wary of his support for liberal legislation like the DREAM Act and the “Don’t Ask, Don’t Tell” repeal, and moderates, though perhaps the most prone to support Lieberman, don’t seem thrilled with the guy, either. Still, I have to suspect Lieberman’s leadership on the DADT repeal has probably bolstered his standing a bit here. I seriously doubt he’s at 50 percent or higher approval, but I wouldn’t be shocked if he’s back above the 40 percent mark. If so, he probably runs again.

In the second corner, you have Rep. Chris Murphy, who’s considered the front-runner for the Democratic nomination, but not necessarily an overwhelming one. There are other possible candidates, and, for Lieberman at least, the more who run, the merrier. Lieberman wants to see Murphy bloodied and battered in a primary, which might irk enough Democrats to bolt for the third-party candidate. If the field is cleared for Murphy, however, that ensures he enters the race with no damaging intraparty conflict and as much money as possible. Murphy goes into a three-way match a modest front-runner, given Democrats outnumber Republicans by a massive margin in Connecticut, plus Lieberman’s pull among Independents isn’t as overwhelming as you’d suspect; it’s even weaker than Charlie Crist’s in this past cycle, and even Crist wasn’t that strong.

And, in corner #3, you have fmr. WWE CEO Linda McMahon, who looks poised to again run for the U.S. Senate after her failed bid over the last cycle. McMahon ran an OK race in 2010, way overperforming the typical Connecticut Republican, but still failing to siphon-off the Democrats that are necessary for a GOP-er to win here. She’s not an overly-popular figure in the state, but she can self-fund, and her financial prowess relieves Republicans from having to pump money in the race. McMahon’s hope is that the GOP base is unified behind her, that Murphy faces a bruising Democratic primary, and that Lieberman fails to improve in approval. This perfect storm is what’s absolutely necessary for a candidate like McMahon to prevail here.

So, reality time. What probably happens here?

Well, here’s my guess – Murphy will face a Democratic primary. Unlike Richard Blumenthal last year, he’s hardly a juggernaut in Democratic circles, and there’s also support for Connecticut’s Secretary of State, Susan Bysiewicz. Bysiewicz is a more liberal, polarizing figure, and while that’s damaging in a general election, it can be helpful in a primary environment. But, still, let’s presume Murphy wins the nomination, and let’s also presume McMahon’s money scares any other serious Republicans away from that primary.

Here’s the thing – for Lieberman to win here, he needs to thrive on a playing field that’s a tad different from the one from his 2006 re-election bid. In that race, the Republicans nominated Alan Schlesinger, a very weak candidate, and this gave Lieberman the license to siphon-off a massive amount of the GOP vote. That, coupled with strong Independent support and adequate Democratic support, gave Lieberman a comfortable leg-up.

It’s different here. Against McMahon, the GOP vote just won’t be up for grabs. Lieberman might manage 15 to 20 percent, maybe, if McMahon’s candidacy falters even worse than in the last cycle. So, he’ll need to look elsewhere for the necessary votes. If his approval rises, he could well get to the 50 percent mark among Independents, and that’s not bad in a three-way. Here’s the hard part, though – for Lieberman to cross the finish line, he needs to steal about a third of the Democratic vote from Murphy. Basically, this means every single self-described “conservative Democrat,” and more than half of “moderate Democrats” must bolt for Lieberman. Don’t worry about McMahon – she has no chance here. If Lieberman did this, it would bring the race to a scenario where Lieberman and Murphy are lingering around 35 percent and McMahon around 25 percent. Lieberman probably can’t win by the double-digit margin from 2006. He’ll need to win by the skins of his teeth here.

In the end, though, I’m not sure Lieberman will have the necessary pull with Democrats to prevail here. Murphy will jump into the race as something of a “Lean D” favorite, and Lieberman will have to work extra-extra-super-super hard to win over wary voters from his former party. I’m not saying a Lieberman victory is impossible – hell, a McMahon victory isn’t impossible, either. But, given the state’s Democrat-heavy electorate, plus the middling favorables of Lieberman and McMahon, you just have to figure Murphy has the obvious advantage here.

http://polibeast.blogspot.com/…

Hyper-partisan Democratic Texas Gerrymander

A hyper-partisan Democratic gerrymander of Texas.  Probably not VRA compliant and Texas might even have some laws against such whacked-outness.  However when drawing hyper-partisan maps I like to take “screw the other party over as much as possible and forget the law” approach.  This another full Texas map, the first I drew was before partisan data was available.

The two crowning achievements of this map are the three Democrats out of Travis County (City of Austin), which is something I posted earlier and worked to further perfect, and six Democrats out of Harris County (City of Houston).  

Every Republican seat is a major vote sink, only 4 of the 14 GOP seats are less than 70% McCain.  Which means there are 10 seats that are R+24 or higher including what would be the most Republican district in the country at R+30.

For the sake of classifying districts 59% Obama and higher are labeled as Safe D, 56-58% is Likely D and <56% is Lean D.  There is only one district that is less than 56% Obama than isn’t a GOP vote sink.

Overall this is a 22-14 Democratic Map with one district that could be won by the GOP in a wave year.  So I think the worst case scenario for the Dems would be 21-15

District 13

Obama 23%

McCain 76%

69% White, 6% Black, 22% Hispanic

The most Republican district in the state and probably the most conservative in the country.  Interestingly enough despite being a R+30 district it is 22% Hispanic.

Safe R

District 17

Obama 26%

McCain 73%

67% White, 5% Black, 26% Hispanic

A R+27 West Texas District that is 26% Hispanic.  Includes the cities of Midland, Odessa and San Angelo.

Safe R

District 19

Obama 27%

McCain 72%

67% White, 6% Black, 25% Hispanic

This is a third West Texas district that is over 20% Hispanic.  That definitely doesn’t help in this district.  Includes the cities of Abilene and Lubbock

Safe R


District 4

Obama 31%

McCain 68%

81% White, 8% Black, 8% Hispanic

North East Texas and part of Collin County

Safe R

District 5

Obama 28%

McCain 71%

76% White, 13% Black, 9% Hispanic

Tyler-Longview based district for Louie Gohmert.  Hey we got to keep the most entertaining Republicans right!

Safe R

District 8

Obama 26%

McCain 73%

81% White, 4% Black, 11% Hispanic

Includes most of the very fast growing Montgomery County.

Safe R

District 11

Obama 28%

McCain 71%

74% White, 8% Black, 14% Hispanic

This is my favorite GOP vote sink based on unattractiveness.  It gets all the Republican vote that would have ended up jeporadizing district 10, 31 and 9 if no counties were split.

Safe R

District 14

Obama 29%

McCain 70%

73% White, 6% Black, 17% Hispanic

Another GOP vote sink near Houston.  

Safe R

District 25

Obama 27%

McCain 72%

78% White, 13% Black, 8% Hispanic

East Texas GOP district.  

District 35

Obama 26%

McCain 73%

78% White, 6% Black, 11% Hispanic

Like the rest of the GOP districts, another vote sink carefully drawn.

District 16

Obama 59%

McCain 40%

24% White, 3% Black, 70% Hispanic

Most of El Paso but I also used 16 to grab some of the more Republican counties from district 23 in order to help make 23 more Democratic.

Safe D

District 23

Obama 55%

McCain 44%

27% White, 2% Black, 69% Hispanic

Shedding some of the more Republican counties and picking up part of Southern El Paso shifts this district 4 points towards the Democrats compared to it’s previous 51% Obama/48% McCain breakdown.  In 2010 Conseco beat Rodriguiz by 5 points.

Lean D

District 36

Obama 29%

McCain 70%

80% White, 2% Black, 16 Hispanic

Contains a decent amount of Lamar Smiths current district including the conservative parts of North Bexar County.

Safe R  

District 15

59% Obama

40% McCain

19% White, 1% Black, 78% Hispanic

Most of McAllen and the most Republican parts of Corpus Christi are here.  

Safe D

District 27

Obama 58%

McCain 41%

22% White, 2% Black, 74% Hispanic

Solomon Ortiz’s loss to Blake Farenthold was definitely a sign of a GOP wave.  The old district 27 was 53%/46%.  I would want to rate this district Safe D since Farenthold won by 1 point and the shift by 5 probably would have safed Ortiz, but I’d be breaking break my own rules.

Likely D

District 28

Obama 59%

McCain 41%

19% White, 3% Black, 76% Hispanic

This district shifts a few more points Democratic from his current 56%/43% district.  It was difficult to get a good image capture of this district since it is drawn like it is.

Safe D

District 20

Obama 58%

McCain 41%

30% White, 5% Black, 61% Hispanic

I tried so hard to get two 59% Obama districts in San Antonio and just couldn’t do it.  58% is really close and as much as I want to label this a safe D district I can’t since my intro says 59% will be considered a safe D district.

Likely D

District 21

Obama 58%

McCain 41%

33% White, 10% Black, 54% Hispanic

Eastern San Antonio and southern Bexar county.  

Likely D


I would have zoomed in more but that would have cut off several of the districts originating from Houston.

District 2

Obama 59%

McCain 40%

36% White, 26% Black, 33% Hispanic

Very Democratic part of North Houston and the Democratic parts of Huntsville in East Texas

Safe D

District 7

Obama 59%

McCain 40%

35% White, 24% Black, 30% Hispanic, 11% Asian

District 9

Obama 59%

McCain 41%

38% White, 27% Black, 23% Hispanic, 12% Asian

Stretches from Galveston up into Brazos County, most of the Democratic vote is in Fort Bend.  Interesting note is this district is 12% Asian

Safe D

District 18

Obama 59%

McCain 40%

39% White, 25% Black, 28% Hispanic

South and West Houston district.

Safe D

District 22

Obama 60%

McCain 40%

39% White, 32% Black, 26% Hispanic

The most Democratic district partially in Houston also includes Beaumont, Port Arthur, Hudson and Nacodoches.  

Safe D

District 29

Obama 59%

McCain 40%

29% White, 10% Black, 57% Hispanic

A good piece of Green’s current district is in the new 29, he should have no problem winning here.

Safe D


Like Houston I had to take this photo to account for the sprawly districts

District 10

Obama 60%

McCain 39%

52% White, 6% Black, 38% Hispanic

This district includes most of Lloyd Doggetts current district in South Austin and it sort of stretches all the way down into South Texas.  

Safe D

District 31

Obama 58%

McCain 40%

47% White, 24% Black, 25% Hispanic

Squeezing a third Democratic district out of Travis County was great.  This district includes parts of Travis County, Waco, Killeen, Temple, College Station

Likely D

District 33

Obama 59%

McCain 40%

67% White, 7% Black, 19% Hispanic

Most of Austin is in this district including Round Rock.

Safe D

District 3

Obama 60%

McCain 38%

39% White, 18% Black, 38% Hispanic

The most Democratic district in the state with Obama winning by a 22 point margin.  It loops around the very conservative Park Cities and Preston Hollow area of Dallas County

District 12

Obama 59%

McCain 40%

45% White, 21% Black, 29% Hispanic

Contains much of the City of Fort Worth.  I’d like to see Lon Burnam run in this one.  He’s a very liberal State Representative in Fort Worth.

Safe D

District 24

Obama 59%

McCain 40%

53% White, 18% Black, 21% Hispanic

Contains the Democratic parts of Arlington in Tarrant County and Southwest Dallas County.   The college town Denton is also roped into the district.

Safe D

District 30

Obama 60%

McCain 39%

40% White, 19% Black, 35% Hispanic

Mostly West Dallas including southern parts of the city and Democratic pieces of Collin/Denton County

Safe D

District 32

Obama 60%

McCain 39%

45% White, 28% Black, 21% Hispanic

South Dallas and some eastern Dallas suburbs including Garland.  I think Eddie-Bernice Johnson would run in this one.

Safe D

Well it happen?  No, but a Democrat can dream 🙂

8R-1D in Tennessee

At first glance, the GOP appears to be doing as well as it can in TN. They control the governor’s mansion, state leg, both senate seats, and every house seat outside of the two in Memphis and Nashville. But the seemingly ironclad Democratic stronghold of Nashville is actually possible for the GOP to crack. TN-05, which encompasses the city, has a PVI of D+3, which is low enough that it can be split among the heavily Republican precincts surrounding Nashville without doing too much damage to the GOP reps in those districts. And TN-05 is also 70% white, so the VRA does not provide an obstacle. I have attempted to draw a map that successfully cracks Nashville, giving the GOP 8 reps, without weakening the surrounding districts (especially the 8th, held by potentially vulnerable freshman Stephen Fincher, aka the gospel singer from Frog Jump).

Nashville Area:

Memphis Area:

The first step is to take the 9th and turn it into a Democratic vote dump, stretching it out to eat up some African American areas in the rural areas around Memphis. The 8th then comes down and takes the suburban Memphis areas currently in the fifth as well as most of the white areas currently in the 9th (leaving out the more liberal white areas). The new 9th is 23% white, 69% black whereas the old district was 36% white, 60% black. The idea here is to make the districts surrounding Memphis more conservative so that they can take Democratic parts of Nashville.

Nashville itself is split between the 8th, the 7th, and the 6th here. The 5th now encompasses only a small part of Nashville and now includes many more conservative suburban and rural counties. The 8th now stretches along the border of the state from Memphis to Nashville, having given up many rural areas to the 7th to make up for the 7th losing some of the Memphis suburban areas (more on why I did this trade-off later). Likewise, the 4th now stretches much further west into territory previously in the 7th to make up for the population that was taken out of the 4th and given to the 5th. The 6th is probably the least changed of all the districts used to split Nashville. It is still relatively compact and composed mainly of the northern suburbs of Nashville with some of urban Nashville thrown in. All three districts in the east are basically unchanged.

Demographics for all changed districts:

TN-09: 23% White, 69% Black, 5% Hispanic (Previously 36% W, 60% B, 3% H)

TN-08: 73% W, 20% B (Prev 75% W, 22% B)

TN-07 80% W, 12% B (Prev 85% W, 12% B)

TN-06 83% W, 11% B (Prev 90% W, 6% B)

TN-05 79% W, 10% B, 7% H (Prev 70% W, 24% B, 4% H)

TN-04 90% W, 6% B (Prev 93% W, 4% B)

Of all these districts, the one that needed to be protected the most was the 8th. The 8th was the most Democratic district in TN outside of Memphis or Nashville before, and the demographic changes seem to suggest that it has most a point or two more to the left with this redistricting. However, it has also become much more suburban and much less rural. This is very important, because while the rural areas have a very long history of electing blue dog democrats, the suburbs around Memphis are much more conservative and are solidly GOP at a local and national level, unlike the rural areas where Democrats still compete locally. Overall, the PVI of this district probably hasn’t changed too much, but I would suspect that it is now a good deal safer for Fincher.

I’m not actually sure that the GOP will do something like this, even though they probably could. It is a pretty atrocious looking map, and even though no majority-minority districts are split, it has looks a lot like something that would have happened in the pre-civil rights era south. There’s also not that much to be gained here; it’s only one congressional seat that we’re talking about. In the end, something like this, while possible, is probably not going to happen. But that doesn’t make it any less fun to draw. 🙂

2010 Downticket Statewide Races Rundown

What follows is a state-by-state rundown of the results of downticket statewide races in 2010.  The universe of races covered is defined by those that appear on www.thegreenpapers.com.  

The trends were similar to the overall trends, with Democrats showing strength in the Northeast and the West Coast, with emerging pockets of blue in the Mountain West/Southwest.  Republicans dominated the South and the redder areas of the Midwest and Mountain West, and also had success in some of the blue/swingy areas of the upper Midwest, particularly in Ohio, where they flipped all three Democratic-held downticket statewide seats.  Republicans also ran the table in swing states like Colorado, Florida, and Michigan.  Meanwhile, Minnesota was an oasis of blue, with Dems taking all of the statewide offices, including of course the Governor’s mansion.

True Blue

California – Democrats ran the table (6 for 6), easily defeating incumbent Lieutenant Governor Abel Maldonado and easily taking the open Insurance Commissioner seat left by Steve Poizner.

Connecticut – Democrats ran the table (4 for 4), as they did in 2006.

Delaware – No change, with Democrats still holding 3 of 4 seats.  Republican Auditor Tom Wagner narrowly held on.

Maryland – Democrats ran the table (2 for 2), as they did in 2006.

Massachusetts – Democrats ran the table (4 for 4), as they did in 2006.

Minnesota – Democrats ran the table (3 for 3), as they did in 2006.

Nevada – All incumbents held, with Democrats continuing to hold 4 of 5 seats.

New Mexico – Static, with Democrats still holding 4 of 5 seats.  The Democrats flipped the open Public Lands Commissioner seat left by Pat Lyons, while Republicans defeated incumbent Secretary of State Mary Herrera.

New York – Democrats ran the table (2 for 2), as they did in 2006.

Oregon – The only election was the special election for Treasurer, which the Democrats held.

Rhode Island – Democrats ran the table (4 for 4), as they did in 2006.

Mixed Nuts

Arkansas – Republicans only contested 3 of 6 seats, and flipped all three of them.  They took the open Lieutenant Governor seat left by Bill Halter, the open Secretary of State seat left by Charlie Daniels, and the open Land Commissioner seat left by John Thurston.  Incumbent Attorney General Dustin McDaniel, incumbent Treasurer Martha Shoffner, and outgoing Secretary of State Charlie Daniels, who ran for the open Auditor seat, all ran without Republican opposition.  Ominously, none of them managed to top 70% of the vote.

Illinois – Republicans now hold 2 of 4 seats, flipping the open Treasurer seat left by Alexi Giannoulias and the open Comptroller seat left by Dan Hynes.

Iowa – Republicans now hold 3 of 5 seats after defeating incumbent Secretary of State Michael Mauro.

Vermont – All seats held, leaving Democrats with 3 of 5 seats.  Republicans held the open seat for Lieutenant Governor left by Brian Dubie and Republican Auditor Tom Salmon held on.

Wisconsin – Republicans now hold 2 of 3 seats after defeating incumbent Treasurer Dawn Marie Sass.

The Redder the Better

Alabama – Republicans ran the table (6 for 6), narrowly defeating incumbent Lieutenant Governor Jim Folsom and easily flipping the open Ag Commissioner seat left by Ron Sparks.

Arizona – Republicans ran the table (5 for 5), narrowly flipping the open Attorney General seat left by Terry Goddard.

Colorado – Republicans ran the table (3 for 3), defeating incumbent Secretary of State Bernie Bueschler and incumbent Treasurer Cary Kennedy.

Florida – Republicans ran the table (3 for 3), easily flipping the open Chief Financial Officer seat left by Alex Sink.

Georgia – Republicans ran the table (7 for 7), flipping the open Attorney General seat left by Thurbert Baker, the open Ag Commissioner seat left by Tommy Irvin, and the open Labor Commissioner seat left by Mike Thurmond.

Idaho – Republicans ran the table, (6 for 6), as they did in 2006.

Indiana – Republicans ran the table (3 for 3), as they did in 2006.

Kansas – Republicans ran the table (4 for 4), defeating incumbent Secretary of State Chris Biggs, incumbent Attorney General Steve Six, and incumbent Treasurer Dennis McKinney.

Louisiana – The only election was the special election for Lieutenant Governor, which the Republicans held.

Michigan – Republicans ran the table (2 for 2), as they did in 2006.

Missouri – The only election was for Auditor, where Republicans defeated incumbent Auditor Susan Montee.

Nebraska – Republicans ran the table (4 for 4), as they did in 2006.

North Dakota – Republicans ran the table (5 for 5), as they did in 2006.

Ohio – Republicans ran the table (4 for 4), defeating incumbent Attorney General Richard Cordray and incumbent Treasurer Kevin Boyce, and taking the open Secretary of State seat left by Jennifer Brunner.

Oklahoma – Republicans ran the table (8 for 8), flipping an incredible 7 seats.  They defeated incumbent Auditor Steve Burrage, incumbent Labor Commissioner Lloyd Fields, and incumbent Insurance Commissioner Kim Holland.  They also took the open Lieutenant Governor seat left by Jari Askins, the open Attorney General seat left by Drew Edmondson, the open Treasurer seat left by Scott Meacham, and the open Superintendent of Education seat left by Sandy Garrett.

South Carolina – Republicans ran the table (8 for 8), flipping the open Superintendent of Education seat left by Jim Rex.

South Dakota – Republicans ran the table (5 for 5), as they did in 2006.

Texas – Republicans ran the table (6 for 6), as they did in 2006.

Wyoming – Republicans ran the table (4 for 4), as they did in 2006.

Oregon: 5-0 with 57% Obama

Despite David’s application has not still political data for Oregon, and would be very interesting to have it since a democratic point (after Illinois, of course), I find the limits for a democratic Gerrymander redistricting of Oregon.

In Oregon, the democrats get really close to win the trifecta this time. We have a tie between democrats and republicans in the state house. But if I’m not wrong, if the state legislature fail drawing the maps, the issue go to the Secretary of State, what is democrat too.

I know not all the details, but it seems Oregon can give the chance of some improvement for the democrats.

Habitually I take as safe districts for the democrats the district with 58-59% Obama (D+5/6). The republicans only win IL-10 (D+6) over D+4 in all the country in 2010 wave, but Oregon is just 57% Obama (D+4) and that mean we can not up all the districts until D+5.

Despite that, Oregon have currently two districts under D+5 in democratic hands, and the democrats from the state are able for keep both despite the republican wave and with Schrader as freshman in OR-05 (D+1), then, I think we can take as safe D+4 districts for Oregon. To up 4 districts until D+5 would mean to have the last district with EVEN rating, and this seems worse since a democratic point.

Then this is the map:

Photobucket

The democratic Gerrymander of Oregon finding the limits is so easy geographically, and need a lot less county split than in the current map.

OR-01: D Wu (D) (Blue)

– 57% Obama D+4 (estimate)

It is the most democratic of the districts by little difference.

OR-02: G Walden (R) (Green)

– 57% Obama D+4 (estimate)

The part of the district inside Multnomah County need to have only the average of the county (77% Obama). G Walden would have harder work for keep the district than in his current R+10 (what is so close geographically).

OR-03: E Blumenauer (D) (Magenta)

– 57% Obama D+4 (estimate)

The part of the district inside Multnomah County need again to have only the average of the county (77% Obama).

OR-04: P DeFazio (D) (red)

– 57% Obama D+4

Need not to go inside Multnomah County. DeFazio get safer than in the current D+2.

OR-05: K Schrader (D) (yellow)

– 57% Obama D+4

A lot more compact than the current district. Schrader get safer than in the current D+1.

Multnomah County has currently three districts inside. I think it would be not a big trouble to have four.

Photobucket

By what margin will Bob Shamansky win?

View Results

Loading ... Loading ...

California: Back to the Future

I have drawn a number of maps trying to predict California’s 2012 redistricting.  I will not be posting any of them in this diary, as I think it’s just a guessing game trying to figure out how exactly the lines will look.  There are several different ways the lines can be drawn – all adhering to the new commission standards.  (OK, maybe I will post a prediction map at some time in the future, once I feel confident that I am drawing the lines in a purely objective way – which is hard to do perfectly) …

Nevertheless, in this diary I wanted to find a totally objective way in which to predict only what the net effect of such a perfectly non-partisan, non-biased redistricting may be – in a “most likely” scenario.  I thought that one of the best and most objective ways to do this is to look back at the 1992 non-partisan map and see how those districts compare, in partisan terms, to the existing ones.  This entails nothing more than redrawing the 1992 districts into Dave’s Application.  Hence, I will not even post any statewide maps here, as you can see what the districts looked like via this link:

http://swdb.igs.berkeley.edu/m…

Instead of the maps, I have included a chart here showing how each 2002 district voted in the 2008 election and how each of the 1992 districts would have voted had that map been in effect in 2008.  Granted, there were obvious population shifts between the 90’s and the last decade, so the 1992 lines now would produce over-populated or under-populated districts, and the biggest difference is that there were 52 districts back then instead of 53 now.  But the districts can still be compared for the purpose of this analysis — because the point here is not really trying to see how any particular district would change, but only what the net effect would be, ie. more or less Democratic or Republican districts overall ??  As far as the missing 53rd District, I get to that too, towards the end of the diary …

Photobucket

Under this exercise, it appears that had the 1992 lines stayed in place for 2002, there might now be upwards of 40 seats in California that Obama won by at least 6 points (at least a 52-46 margin) as compared to only 34 such seats currently.

As can be inferred from the above chart, a perfectly fair redistricting of California is likely to add several more Democratic districts.  The numbers highlighted in yellow are districts where the partisan balance doesn’t change much when you go from the 2002 incumbent protection map to the 1992 non-partisan map.  These are districts where the change in Obama’s margin over McCain (or McCain over Obama) is no more than 4 points.  The numbers highlighted in red are ones where the margin changes by 5 points or more in the Republican direction, while the numbers highlighted in blue are ones where the margin changes by 5 points or more in the Democratic direction.  

First, we need to take out the districts where the numbers change by 5 points or more in the Democratic or Republican direction, BUT the change is not likely to make a difference because the district is already super-Democratic or super-Republican.  These include CA-7, CA-30, CA-34, CA-35 and CA-37, which are already very Democratic and which might become even more Democratic under a re-map, as well as CA-1, CA-10, CA-23, CA-27, CA-36, CA-43 and CA-53 which become less Democratic, but are still very likely to be retained by a Democrat even if the lines were changed (all except CA-23 and CA-36 would have Obama percentages of at least 62%).  

What’s left are 7 districts where the partisan change may entail a change in party control.  These include 2 districts that move in a Republican direction, and 5 that move in a Democratic direction (I have marked these districts using a bolded outline in the column referencing the 1992 District partisan breakdown).

CA-18 and CA-20 become less Democratic to the point where, at least in CA-20, the Republican candidate would have very likely won last November under the old lines.  It appears that CA-18 would have also been a 50/50 district in last year’s election had it remained under the old lines.  (For what it’s worth, it should be noted that both districts still remain “Obama districts”.)   However, for both of these Central Valley districts, the actual 2012 redistricting may not be as “brutal” if you’re a Democrat because of the VRA.  The commission is likely to feel the need to be quite “VRA-compliant” in this part of the state, and the resulting districts are likely to have more Hispanics than under the 1992 lines, and thus be more Democratic.

The 5 more Democratic districts include CA-3, CA-24, CA-25, CA-26 and CA-42.  All move in the Democratic direction in this exercise.  CA-24 and CA-26 become so much more Democratic, that a Democratic takeover would be likely, while the other 3 are right on the line – with the caveat that Congressmen like Lungren and Miller would not likely be able to hold the districts in a Democratic or even “neutral” year.  McKeon – I’m not sure, but he certainly doesn’t have the moderate reputation of someone like Bono Mack who is able to currently hold a district with a similar partisan makeup.

What’s interesting, at first, is that Calvert’s district does not appear to change much in the chart.  Here’s where the “53rd District” comes in … Out of the 52 districts under the 1992 plan, two stand out like a sore thumb, in terms of over-population (I am using today’s population numbers, but under the 2000 population numbers they would have been over-populated in a similar fashion).  Both the western and eastern halves, respectively, of Riverside Co. (which under the 1992 map were labeled CA-43 and CA-44 but now more closely correspond to CA-44 and CA-45) are over-populated by over 300,000 persons, or something like 150% (Calvert’s area is at +367,000 while Bono Mack’s is at +321,000) … No other districts in the state even come close (every other is under 200,000, in most cases 100,000 or less) … Taken together, the +367,000 and +321,000 over-populations add up to almost exactly one new Congressional district in Riverside Co.  Granted, we’re using 2006-2008 population estimates on 1992 lines.  Nevertheless, even between the 1990 and 2000 Censuses, Riverside Co. had the highest population growth in the state (other than three relatively small counties – San Benito, Placer and Madera).  Thus, if the 2002 map was truly “non-partisan” the 53rd district created may have been centered not in the Central Valley, but in Riverside Co.  

To see how this plays out in a partisan way, I drew 4 different possible scenarios of how Riverside may look if it contains 3 districts of equal population (with each district corresponding to an ideal district size using population estimates for 2006-2008) …

The first map below is simply the districts under the 1992 map; the old CA-43 is in magenta while the old CA-44 is in blue:

Photobucket

The second map shows how the districts may look if Riverside Co. is divided into 3 districts of equal population.  In this scenario, equal numbers of people are taken out of both the western (magenta) and eastern (blue) halves of the county to create a new district in the middle.  I tried to draw so that cities are not split up by the district lines.  The new district, in orange, encompasses Riverside, Moreno Valley, Calimesa, Beaumont and Perris, and its partisan breakdown is 56 Obama – 43 McCain (the western district in magenta is 47 Obama – 51 McCain, while the eastern district in blue is 51 Obama – 48 McCain).

Photobucket

The third map below shows how the map may look if, instead, Riverside, Moreno Valley and their immediate environs are put together into one very compact district (almost rectangular) while the magenta and blue districts adjust accordingly for equal population.  In this scenario, the new orange district is 58 Obama – 40 McCain, the magenta one is 46 Obama – 52 McCain, while the blue one is 50 Obama – 48 McCain.

Photobucket

The fourth map has Riverside, Norco and Corona all in one orange district at 53 Obama – 45 McCain (the magenta district is 50 Obama – 48 McCain, while the blue one is 50 Obama – 49 McCain).

Photobucket

The last map tries to keep most of Moreno Valley together with Palm Springs (as they are currently); while Norco and most of Corona stay with Riverside.  The orange district here is 55 Obama – 43 McCain; magenta one is 44 Obama – 54 McCain and the blue one is 55 Obama – 43 McCain.

Photobucket

As you can see, any reasonable way you slice and dice Riverside, you’re creating at least one quite Democratic district (and possibly two) – which, like CA-3, CA-24, CA-25, CA-26 and CA-42 above would likely move in the Democratic direction (in scenario #4, the one that produces the “weakest” partisan shift for Democrats, still has the new Riverside Co. district at 53 Obama – 45 McCain which is a 7 point improvement in the Obama – McCain margin over the existing CA-44).

You can see from this exercise that the 2002 plan, even though it was an incumbent-protection map, has benefitted Republican incumbents significantly more than Democratic incumbents.  If something truly non-partisan had been created in 2002 Democrats would likely have at least several more members currently.  With 2012 redistricting being non-partisan it is therefore likely (though never guaranteed ofcourse) that the map will increase the number of Democrats in California.  And, as you can see from the “53rd District” scenario above, even in Republican districts which have or are experiencing the highest population growth in California (like Riverside Co.) the growth has been in Republican districts, but among Democratic constituencies.  

To sum up, therefore, I think that a non-partisan map will ultimately be more of a plus for Democrats than Republicans.  If drawn in a neutral manner, a new CA-18 and CA-20 might be marginal to leaning Republican — but the VRA is likely to “save” those districts for the Democrats.  Meanwhile, non-partisan criteria will more likely than not enable the creation of more Democratic districts in geographic areas currently corresponding to CA-3, CA-24, CA-25, CA-26, CA-42 and CA-44.  The new Democratic-leaning districts may even not correspond to the districts listed here — as this exercise for me really tried to gauge a net effect rather than trying to predict individual districts — but they will appear somewhere in California (mostly in the southern part of the state).  Several of these new districts will likely go Democratic in 2012, while others may be more marginal but may nevertheless provide Democrats at least an even chance of takeover (later if not sooner, as demographic change progresses) — which is better than what the existing map has to offer.  If you’re a Democrat, fortunately we no longer will have the self-defeating Democrats of 2002 to draw the map for us. Instead, we should look forward to the Commission’s work in the Golden State.

Mass Confusion: 4 Plans for MA Redistricting

For my first diary, I decided to tackle my (adopted) home state. Given that Olver is not going to go quietly, it really seems to be up in the air who gets eliminated. I think there are 4 realistic options:

1. Olver gets pushed in with Neal anyway. Western Mass is where the population loss has been, and this would produce the least-gerrymandered map.

2. Lynch is booted. He’s not popular among the liberal establishment and can be eliminated pretty easily.

3. Tierney is eliminated. He’s probably the weakest incumbent in the delegation, and if it stays the same, I think the 6th is the only district that could flip in 2012 (assuming Tisei runs).

4. Frank retires. The 2010 race, and the prospect of going back into the minority, may convince him that now is the time to hang it up and write his memoir.

I think 2 and 3 are the more likely scenarios, but 1 and 4 are still possible. Notice I did not include Scenario 5: Capuano runs for senate. That’s because the plan will face a lawsuit if they do not draw a Majority-Minority District. I think it is likely to succeed, based on VRA analysis I’ve read here pertaining to other states. Since Capuano’s district is already on the VRA borderline, I think it is going to stay the same regardless. In all my plans I made sure the 8th was below 50% white.

Quick notes for these:

A) Nantucket and Martha’s Vineyard are always in Keating’s district. It’s just easier to leave them off the maps for readability.

B) All districts are safe D in all years in my opinion, unless otherwise indicated.

C) I tried to keep any non-eliminated incumbents in districts that are as similar to their current ones as possible.

D) Keating’s district gets the number of the eliminated district, just for convenience (I know MA always renumbers its districts to count up from the West to Cape Cod)

I have individual district maps for all these – I’ll post them if there’s confusion, but there are so many districts here (36) I’d rather not do that.

The coloring scheme should be familiar:

District 1: Blue

District 2: Green

District 3: Purple

District 4: Red

District 5: Yellow

District 6: Teal

District 7: Hot Pink or Orange(Map II)

District 8: Lavender

District 9: Cyan

Map I: Neal vs. Olver

West:

MA_1_West

Northeast:

MA_1_Northeast

Southeast:

MA_1_Southeast

Boston:

MA_1_Bos

I-1. Keating

This district changes quite a bit – it keeps it base on the Cape and Islands but now includes Keating’s actual residence in Sharon. New Bedford is added too to make this more Dem.

I-2. Neal vs. Olver

Compact Western Mass seat. Should be a fair fight between the two.

I-3. McGovern

This district is now Worcester County-based, losing its tail into Fall River. McGovern should hold it fine, but I’d be concerned about him retiring in a bad year.

I-4. Frank

Frank gets a lot of liberal MetroWest areas along with some more conservative ones around Franklin. He also swaps out New Bedford for Fall River. Probably makes it a point or two less Dem, but Frank should be fine.

I-5. Tsongas

Very similar to her current district, but adds Fitchburg and Leominster while losing Haverhill.

I-6. Tierney

Adds Haverhill and Woburn but otherwise doesn’t change much. A potential alternate configuration would be to move Revere and Winthrop to I-6 and give Woburn back to I-7. That’s probably a wash politically.

I-7. Markey

Pretty similar to his current seat with a little more of MetroWest.

I-8. Capuano.

Similar to his current seat with a few territory swaps in Brighton, Hyde Park, and Everett to make sure it’s majority-minority (47% white).

I-9. Lynch.

Takes in conservative parts of Plymouth county as well as the Blue-collar towns of Quincy and Brockton. Excellent fit for Lynch, but could be competitive if he retires at the wrong time.

Map II: Capuano vs. Lynch (in reality, eliminating Lynch)

West:

MA_2_West

Southeast:

MA_2_Southeast

Northeast:

MA_2_Northeast

Boston:

MA_2_Boston

II-1. Olver

Expands east just a tad and gets rid of that silly tail on the 2nd district, which has outlived its usefulness.

II-2. Neal

Same situation as Olver. These 2 districts are more-or-less identical in maps II, III, and IV.

II-3. McGovern

Almost identical to his current district.

II-4. Frank

Moves a bit further out of Boston. Probably about the same politically, or maybe a point or two less D, due to the addition of Brockton canceling out some more conservative suburbs. Frank should still be safe here.

II-5. Tsongas

Similar to her current district, with a bit more of MetroWest added. Probably a point or two more D.

II-6. Tierney

Pulls in closer to Boston, taking the Northeast part of Markey’s district. Probably a point or two more D, but I’d be really worried about Tisei winning this seat as the new territory coincides with his former State Senate District.

II-7. Markey

Loses its northeastern portion and exchanges it for Brookline, Brighton, and West Roxbury. Maybe a point or two more D.

II-8. Capuano vs. Lynch.

Majority-minority district that contains Capuano’s and Lynch’s homes, but that Lynch can not win. If Capuano runs for Senate, I imagine Chang-Diaz could beat Lynch in a primary easily.

II-9. Keating.

Adds Milton, Braintree, and Weymouth (giving Keating more of his Norfolk County base) but otherwise few changes. Probably a point or two more D than it is now.

Map III: Eliminating Tierney

West:

MA_3_West

Northeast:

MA_3_Northeast

Southeast:

MA_3_Southeast

Boston:

MA_3_Bos

III-1 and III-2. Olver and Neal

See map II above.

III-3. McGovern

This one changes a lot. It becomes basically a MetroWest district. If anything that makes it more Democratic, but I could see McGovern having a tough primary fight if somebody from the Framingham area had the gall to challenge him.

III-4. Frank

This district shifts west, taking the tail of MA-3 and giving up its central portion. The population centers stay the same though (Newton, Brookline, New Bedford, and Fall River) so I think Frank should be fine here.

III-5. Tsongas.

This one has big changes, taking in the northern (and more conservative) half of the old 6th. On the plus side, it loses some conservative areas west of Lowell. It’s probably a point or two more Republican, and I could see Tsongas being vulnerable here in a 2010-like year.

III-6. Keating.

Similar to his current district, but adds Wareham and Braintree.

III-7. Markey vs. Tierney

This is designed as Markey’s district, but I don’t think he’s going to like it. It’s about 60% new territory for him and includes Tierney’s home. If Tierney doesn’t retire voluntarily, I don’t see them going for this as it would put Markey at serious risk in the primary. Even if Tierney retires, I think Markey would still complain loudly at having to absorb so much new area. This should be very safe for whichever Dem wins it in 2012, though.

III-8. Capuano.

Majority Minority District. Basically identical to I-8 above.

III-9. Lynch.

Lynch expands to the South, taking in conservative exurbs. Probably a couple points less Democratic, but this is a good fit for Lynch.

Map IV: Frank retires

West:

MA_4_West

Northeast:

MA_4_Northeast

Southeast:

MA_4_Southeast

Boston:

MA_4_Boston

IV-1 and IV-2. Olver and Neal.

See map II above.

IV-3. McGovern

Very similar to his current district, with one big exception, the addition of New Bedford. Probably significantly more Dem as a result.

IV-4. Keating

Gets fatter by adding more of Plymouth Co. and probably gets more Republican. Keating himself is probably safe, but I’d be very worried about him leaving in a bad year.

IV-5. Tsongas

Loses Haverhill and plunges deep into MetroWest. Probably siginificantly more D than before.

IV-6. Tierney

Adds Haverhill. Probably a wash, and I’d still think Tisei could win this seat.

IV-7. Markey

Adds Newton, Brookline, and West Roxbury while losing MetroWest. Probably more Dem than before.

IV-8. Capuano

Basically identical to I-8 above.

IV-9. Lynch

Very similar to his current district, shifted a little south and west, and adding Wellsley and Needham. Lynch won’t like that, but I think the more conservative rest of his district should be enough to hand him easy primary and general victories.

The moral of the story: Each of these have their strong and weak points. If you make a MMD in Boston (which means not tinkering with Capuano) it’s almost impossible to make 9 truly safe Dem seats. You can make 7 safe, 1 safe except in a really bad year, and 1 safe except for a Tisei run, but I think that’s about the best you can do without looking at a VRA suit. And I honestly don’t know what the final map will be most like – it’s so up in the air I don’t even think I can speculate. But the reason I did these 4 maps is to compare the possibilites, and I feel like the final product will look pretty similar to one of these, depending on who retires and who the legislature favors.

PS: Also note that with Maps 3 and 4, you can swap portions Keating’s and Lynch’s districts to give Lynch Plymouth and Quincy and Keating Norwood and Taunton as I did with Map 1, without affecting any other district.

That’s what I should’ve done for Map 4, but I didn’t realize it until after it was posted. So imagine Lynch’s district going East of Keating’s through Quincy, and Keating taking in Needham and Wellsley. That would solve Lynch’s primary and Keating’s general election problems.