Now that we know that the Texas House and Governor’s mansion will be safely in the hands of the Republican Party during redistricting, I decided to draw a map using Dave Bradlee’s application that predicts what the Republicans might do. (I used 1.0 instead of 2.0 because I had a previously drawn map that I could easily modify in 1.0. If there is an easy way to convert a 1.0 map to a 2.0 map, then please let me know in the comments.) Again to be clear, this is a prediction of what I think the new map might look like, not what I hope happens. I really wish I was sharing a more liberally friendly map than this one.
It’s also a pretty boring map with the following objectives:
1) Keep all incumbents with their base voters, except McCaul.
2) Draw a Republican safe district for McCaul.
3) Draw a non-VRA Republican safe district using the suburban-exurban part of Nueces for Farenthold.
4) Draw a non-VRA Republican safe district using the Northern part of Bexar for Canseco.
5) Draw a new Republican safe district in Harris.
6) Draw a new VRA Democratic safe district in DFW.
7) Draw two new VRA Democratic safe districts from the current 23 and 27.
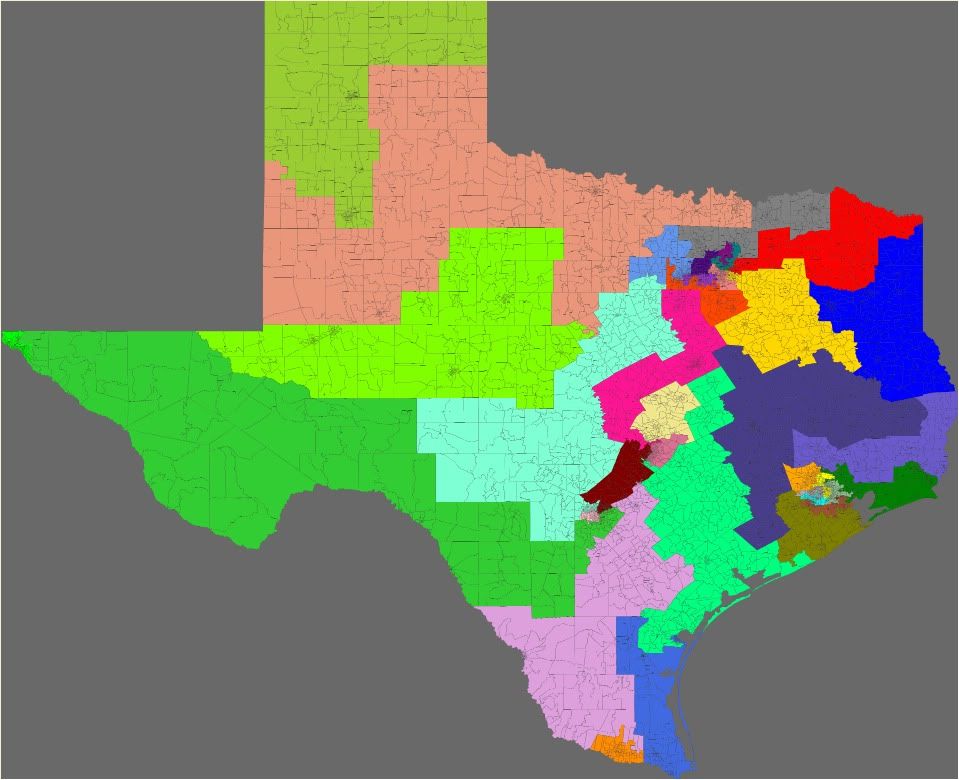
I suspect objectives (1)-(5) are real Republican goals, and objectives (6)-(7) will likely be required by the Obama DOJ. Here are the maps with the pretty colors.
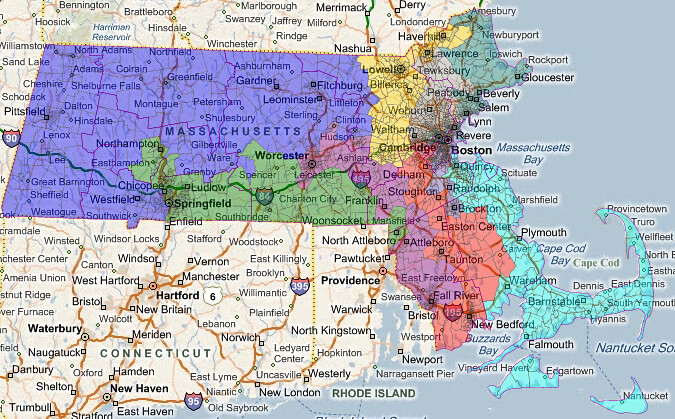
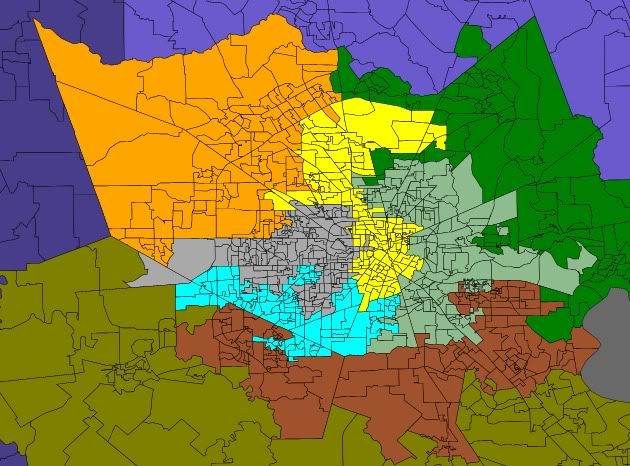
The state.
Greater Houston.
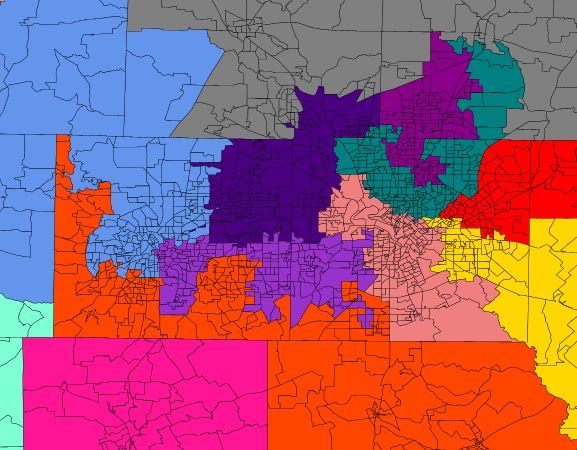
DFW.
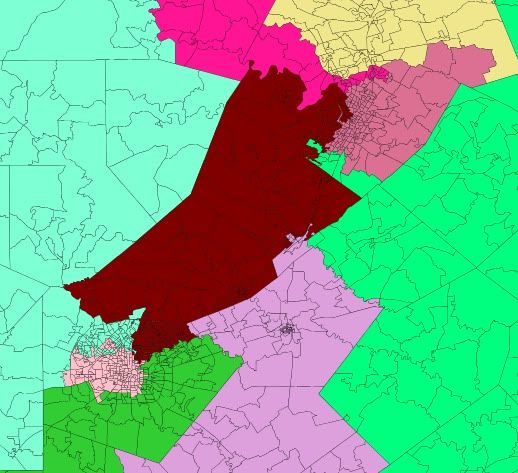
Central Texas.
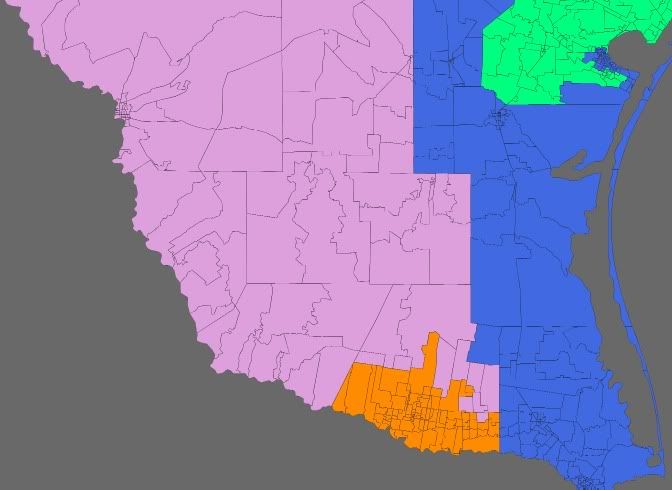
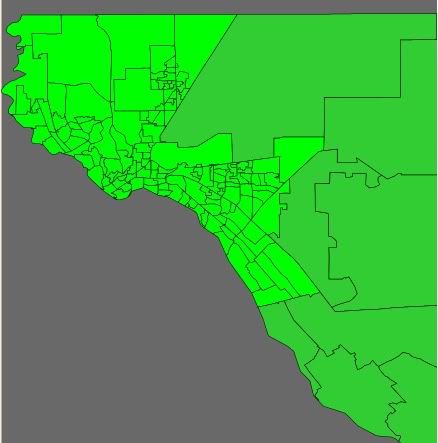
The Valley.
El Paso.
CD 1: (Blue) [31% Obama – 68% McCain, Wh 66%, Bl 19%, Nat 0%, Asn 1% Hisp 12%] Tyler based district for Gohmert.
CD 2: (Dark Green) [41% Obama – 58% McCain, Wh 54%, Bl 19%, Nat 0%, Asn 2% Hisp 24%] Northeast Harris based district for Poe.
CD 3: (Purple) [43% Obama – 56% McCain, Wh 59%, Bl 10%, Nat 0%, Asn 12% Hisp 17%] Plano based district for Sam Johnson.
CD 4: (Red) [35% Obama – 65% McCain, Wh 65%, Bl 12%, Nat 1%, Asn 2% Hisp 19%] Rockwall based district for Hall.
CD 5: (Yellow) [42% Obama – 57% McCain, Wh 55%, Bl 17%, Nat 0%, Asn 1% Hisp 25%] Dallas based district for Hensarling.
CD 6: (Teal) [43% Obama – 56% McCain, Wh 54%, Bl 9%, Nat 0%, Asn 7% Hisp 28%] Dallas based district for Sessions. Sessions district now goes up into Collin County making him significantly safer. (I switched the numbers on 6 and 32, because the color contrast was poor with 4. It’s strictly a visual effect, and I don’t expect the numbers to switch.)
CD 7: (Silver) [42% Obama – 57% McCain, Wh 50%, Bl 7%, Nat 0%, Asn 8% Hisp 34%] Houston based district for Culberson. This district is a little safer than his current district.
CD 8: (Violet) [25% Obama – 74% McCain, Wh 76%, Bl 7%, Nat 0%, Asn 1% Hisp 14%] Montgomery County based district from Brady.
CD 9: (Sky Blue) [76% Obama – 24% McCain, Wh 15%, Bl 39%, Nat 0%, Asn 10% Hisp 35%] Houston based district for Al Green.
CD 10: (Hot Pink). [39% Obama – 60% McCain, Wh 68%, Bl 9%, Nat 0%, Asn 3% Hisp 18%] Austin/Waco/Johnson Country district for McCaul. Really, the only challenge in this map was McCaul. He lives in liberal Austin, which is a few hundred miles away from his base voters in one of the conservative parts of Harris County. Furthermore, because of population growth in both Harris County and Austin, there is no way to keep this district together for him. In fact, I used that part of Harris to draw the new Republican district mentioned in objective (5). A congressperson does not have to live in his/her district, so McCaul could hypothetically run for the Harris district. However, there are several state legislators in that district, who are looking up, and he could get hit with a primary. So, I really don’t think living that far away from a district is practical. Hence, I drew him in with Johnson County, which is very Republican and is not home to a congressperson. With Waco in this district, there is a chance Chet Edwards could run against him, but I doubt it.
CD 11: (Lawn Green) [25% Obama – 75% McCain, Wh 59%, Bl 5%, Nat 0%, Asn 1% Hisp 34%] Midland based district for Conaway.
CD 12: (Steel Blue) [36% Obama – 63% McCain, Wh 59%, Bl 5%, Nat 1%, Asn 3% Hisp 32%] Fort Worth based district for Granger.
CD 13: (Dark Salmon) [25% Obama – 74% McCain, Wh 70%, Bl 5%, Nat 1%, Asn 1% Hisp 22%] West Texas based district for Thornberry. This one though now spreads east and has a new conservative base in Wichita Falls.
CD 14: (Olive) [39% Obama – 60% McCain, Wh 56%, Bl 13%, Nat 0%, Asn 3% Hisp 27%] Galveston based district for Paul.
CD 15: (Orange) [68% Obama – 31% McCain, Wh 9%, Bl 0%, Nat 0%, Asn 1% Hisp 89%] Hidalgo County based district for Hinojosa. This district is much more compact. [UPDATE: Several comments have noted that this district may be too Hispanic. The 15 was after all one of the districts that the courts redrew in 2006. That could very well be true. This issue could easily be resolved by redrawing 15 and 28 (and possibly the new 33) similar to how they are drawn now to reduce the Hispanic influence in 15. I considered doing this myself, but I decided against it. One reason for my decision was that I ran out of time to work on this. Two, I actually decided that the GOP could argue that (a) this district is compact and within a single community, (b) all of the neighboring districts are safely VRAs too, and (c) breaking up this district would break up a community, which is against the spirit of the VRA. That’s not a great argument, but Justice Kennedy might buy it. Since it gives the GOP a chance to weaken the Democrats in 28 almost down to a swing district, I wouldn’t be surprised if they made this argument. (See description of 28 below.) Nonetheless, even if it doesn’t go as predicted, I suspect they will go with a fix by redrawing 15 and 28.]
CD 16: (Lime) [65% Obama – 34% McCain, Wh 14%, Bl 3%, Nat 0%, Asn 1% Hisp 81%] El Paso based district for Reyes.
CD 17: (Midnight Blue) [33% Obama – 66% McCain, Wh 64%, Bl 15%, Nat 0%, Asn 2% Hisp 18%] College Station based district for Flores. This district was moved out of Johnson County and McClennan County to make 10 friendlier for McCaul.
CD 18: (Yellow) [75% Obama – 24% McCain, Wh 17%, Bl 32%, Nat 0%, Asn 4% Hisp 46%] Houston based district for Jackson.
CD 19: (Yellow Green) [26% Obama – 74% McCain, Wh 59%, Bl 6%, Nat 1%, Asn 1% Hisp 32%] Lubbock based district for Neugebauer.
CD 20: (Pink) [65% Obama – 34% McCain, Wh 15%, Bl 4%, Nat 0%, Asn 1% Hisp 78%] San Antonio based district for Gonzalez.
CD 21: (Maroon) [42% Obama – 57% McCain, Wh 68%, Bl 4%, Nat 0%, Asn 3% Hisp 24%] San Antonio/Austin based district for Smith.
CD 22: (Chocolate) [39% Obama – 60% McCain, Wh 52%, Bl 8%, Nat 0%, Asn 12% Hisp 27%] Sugar Land based district for Olson.
CD 23: (Cyan) [33% Obama – 66% McCain, Wh 65%, Bl 3%, Nat 0%, Asn 2% Hisp 29%] North Bexar based district for Canseco. As noted previously, this district is much more Anglo and Republican than the current VRA 23.
CD 24: (Indigo) [41% Obama – 58% McCain, Wh 63%, Bl 8%, Nat 1%, Asn 8% Hisp 18%] Southlake/Coppell based district for Marchant.
CD 25: (Violet Red) [69% Obama – 30% McCain, Wh 41%, Bl 10%, Nat 0%, Asn 5% Hisp 41%] Austin based district for Doggett.
CD 26: (Grey) [34% Obama – 65% McCain, Wh 72%, Bl 7%, Nat 1%, Asn 3% Hisp 16%] Flower Mound/Denton based district for Burgess.
CD 27: (Spring Green) [39% Obama – 60% McCain, Wh 53%, Bl 6%, Nat 0%, Asn 1% Hisp 38%] Greater Corpus Christi based district for Farenthold. It is no longer a VRA district since it extends north.
CD 28: (Plum) [53% Obama – 46% McCain, Wh 24%, Bl 3%, Nat 0%, Asn 1% Hisp 72%] Laredo based district for Cuellar. This district however is not nearly as safe as it is today even though is still safely a VRA. It could be a Republican target, but Cuellar is a staple in Laredo, so I doubt he is going anywhere.
CD 29: (Dark Sea Green) [70% Obama – 30% McCain, Wh 13%, Bl 22%, Nat 0%, Asn 2% Hisp 63%] Houston based district for Gene Green.
CD 30: (Light Salmon) [76% Obama – 23% McCain, Wh 15%, Bl 29%, Nat 0%, Asn 2% Hisp 54%] Dallas based district for Eddie Bernice Johnson.
CD 31: (Khaki) [43% Obama – 55% McCain, Wh 61%, Bl 12%, Nat 1%, Asn 4% Hisp 21%] Williamson County based district for Carter.
CD 32: (Orange Red) [39% Obama – 60% McCain, Wh 64%, Bl 14%, Nat 0%, Asn 3% Hisp 18%] Ellis County based district for Barton. (See comment about switching 6 and 32 above.)
CD 33: (Slate Blue) [58% Obama – 41% McCain, Wh 19%, Bl 2%, Nat 0%, Asn 1% Hisp 78%] Corpus Christi/South Padre Island based district for Ortiz, possibly Ortiz Junior if Ortiz Senior is ready to retire after losing.
CD 34: (Lime Green) [61% Obama – 38% McCain, Wh 21%, Bl 8%, Nat 0%, Asn 1% Hisp 69%] South Bexar/Border based VRA district for Rodriguez.
CD 35: (Orchid) [66% Obama – 33% McCain, Wh 29%, Bl 29%, Nat 0%, Asn 5% Hisp 36%] New Dallas-Fort Worth based VRA district for some Democrat like Royce West or Rafael Anchia. [UPDATE: curiousgeorge noted that this may not be a VRA district. That is probably true. After all, it looks a lot like Martin Frost’s old 24th district that the courts allowed DeLay to butcher in his mid-decade redistricting. Nonetheless, I still believe that there will be a new Democratic district in DFW. Otherwise, at least one Republican would be seriously weakened.]
CD 36: (Dark Orange) [35% Obama – 65% McCain, Wh 61%, Bl 7%, Nat 0%, Asn 7% Hisp 24%] New Harris County based district for some Republican like Dan Patrick or Debbie Riddle.
Overall 24 R – 12 D.
[UPDATE: I corrected some minor typos, added racial percentages, and addressed the issue of 15 being too Hispanic. There are some other minor issues with the map, but I think that the overview is about right. Specifically, we’ll see a 24 R-12 D map with the Democrats representing the following: 3 from Greater Houston, 2 from DFW, 2 from the Valley, 1 from El Paso, 1 from Austin, 1 from San Antonio, 1 from Laredo, and 1 from South San Antonio to the border.]